Middleburg Financial — Shareholder Meeting (April 2010)
35 slides from Middleburg Financial's shareholder meeting presentation, Apr 28, 2010
Slide 1: Annual Shareholder Meeting
() A> Middleburg “<>” Financial Corporation Annual Shareholder Meeting April 28, 2010
Slide 2: Forward Looking Statements
Forward Looking Statements SB Middleburg <—>" Financial Corporation Certain information contained in this discussion may include “forward- looking statements” within the meaning of Section 27A of the Securities Act of 1933, as amended, and Section 21E of the Securities Exchange Act of 1934, as amend
Slide 3: Agenda
Agenda 1. MFC 2009 Review 2. 2010 Opportunities Apal28, 2010 Page
Slide 4: 2009 Financial Performance
() 2009 Financial Performance ‘April2, 2010 Paged
Slide 5: 2009 Financial Performance Key Highlights
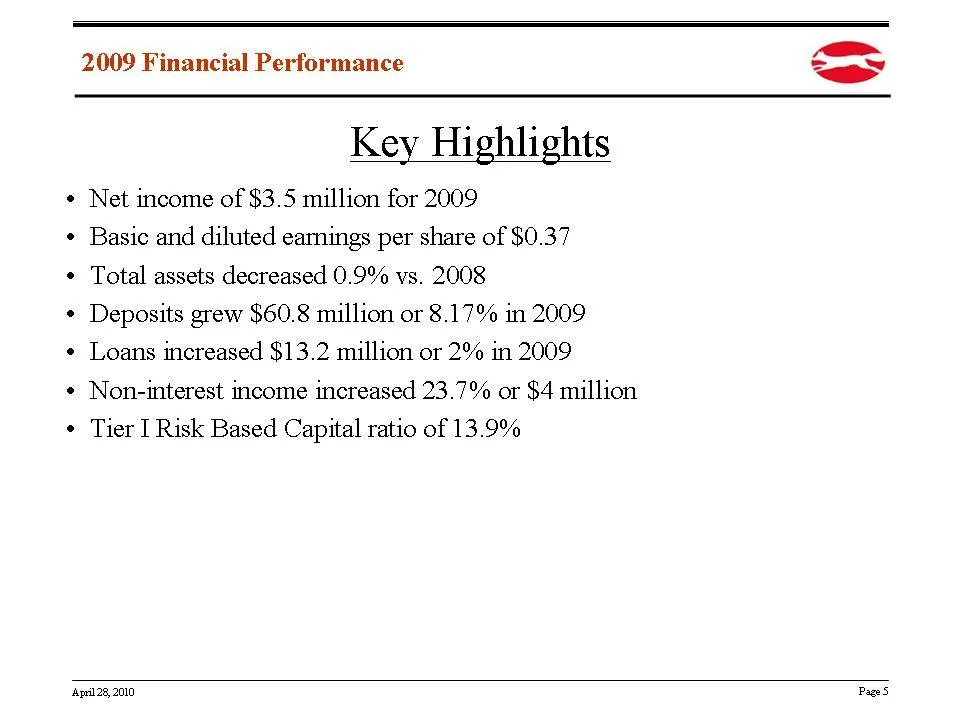
2009 Financial Performance () Key Highlights * Net income of $3.5 million for 2009 ¢ Basic and diluted earnings per share of $0.37 ¢ Total assets decreased 0.9% vs. 2008 * Deposits grew $60.8 million or 8.17% in 2009 ¢ Loans increased $13.2 million or 2% in 2009 ¢ Non-interest income increased 23.7%
Slide 6: Increasing Deposit Market Share
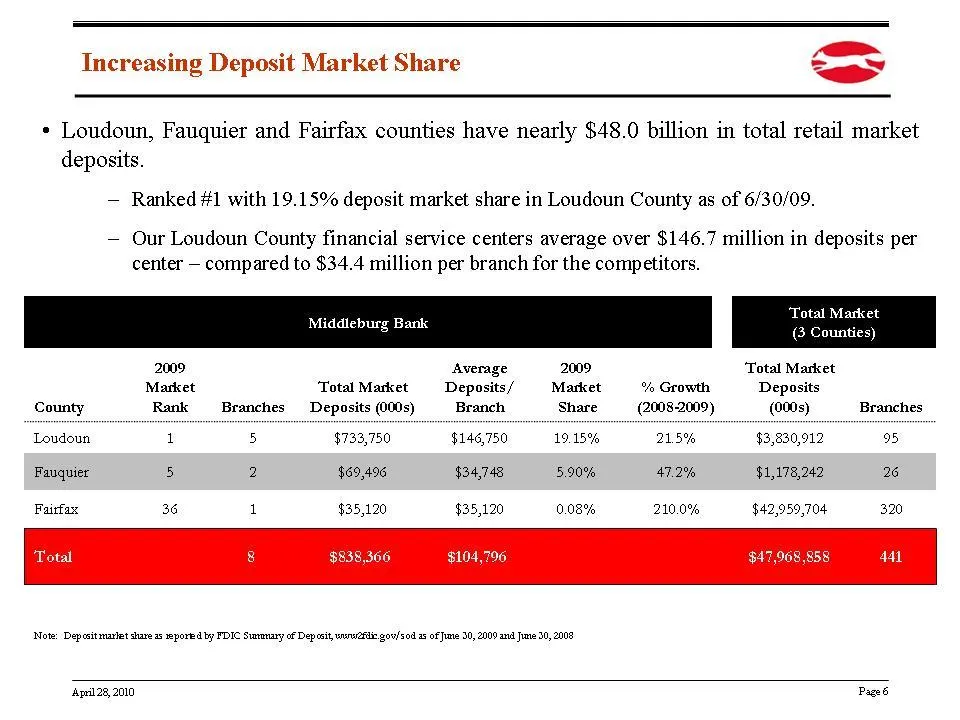
Increasing Deposit Market Share = * Loudoun, Fauquier and Fairfax counties have nearly $48.0 billion in total retail market deposits. — Ranked #1 with 19.15% deposit market share in Loudoun County as of 6/30/09. — Our Loudoun County financial service centers average over $146.7 million in deposits p
Slide 7: Deposit Market Share — Loudoun County
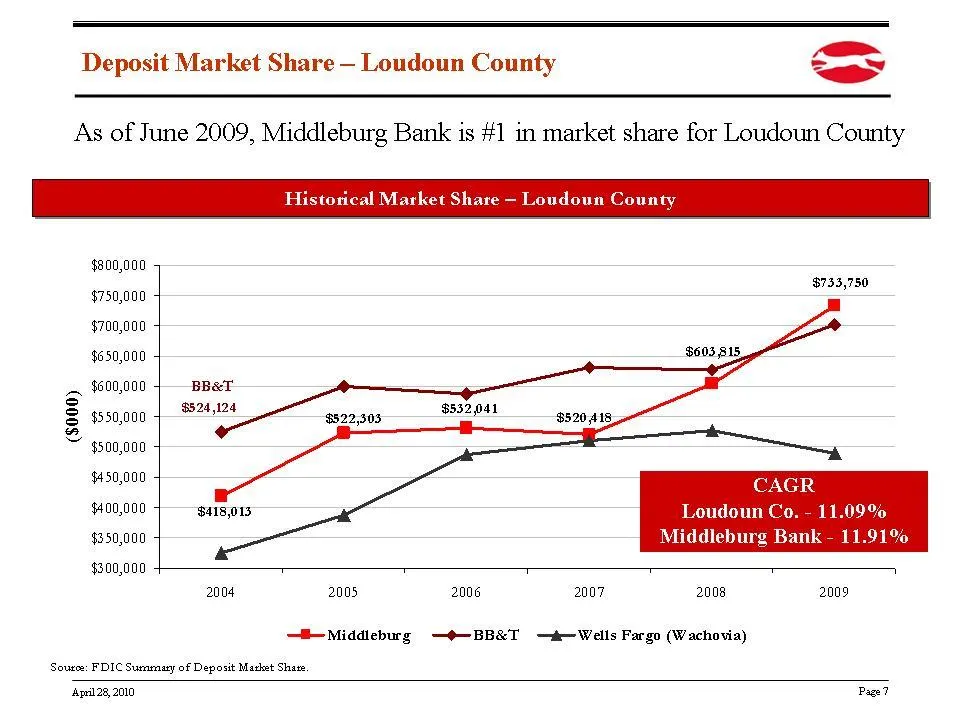
Deposit Market Share — Loudoun County ——— As of June 2009, Middleburg Bank is #1 in market share for Loudoun County $800,000 $750,000 $700,000 $650,000 $600,000 $550,000 $500,000 $450,000 ($000) $400,000 $350,000 $300,000 re — Loudoun County $733,750 $603 815, BBaT $524,124 $552,041 29,303 y= a $520
Slide 8: Strong Balance Sheet Growth
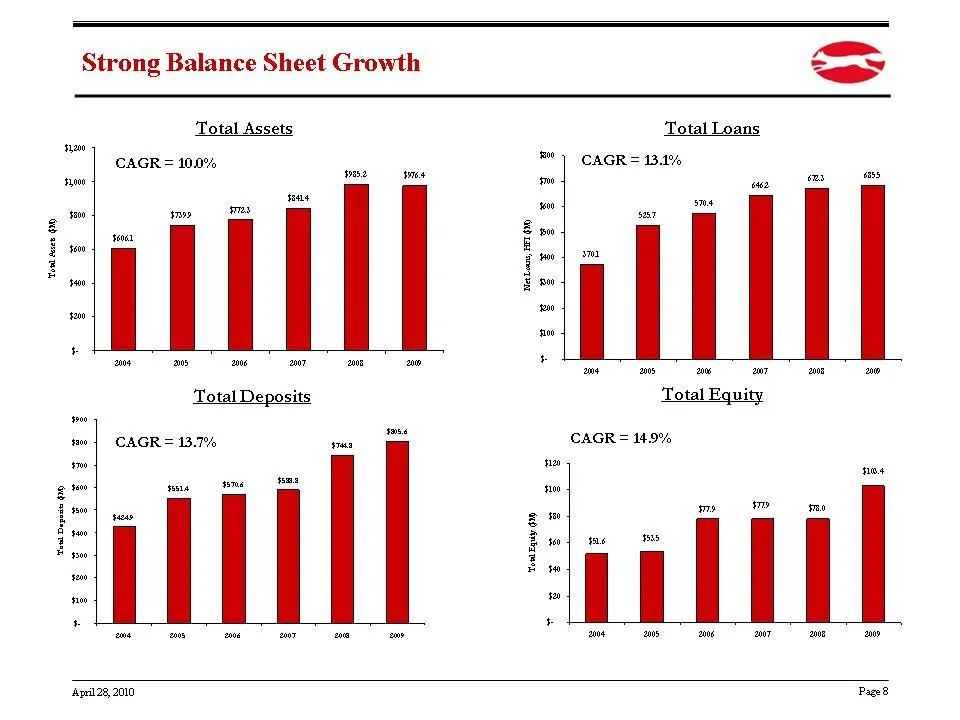
‘om suet 0 Strong Balance Sheet Growth Total Assets a0 CAGR = 100% noe sz es sun sn san sam E Total Deposits ou tose ime] CAGR= 13.7% pas omen 66 Total Loans *) CAGR= 13.1% Total Equity CAGR= 149% ‘April28, 2010, Page
Slide 9: Better-Than-Peer Asset Quality
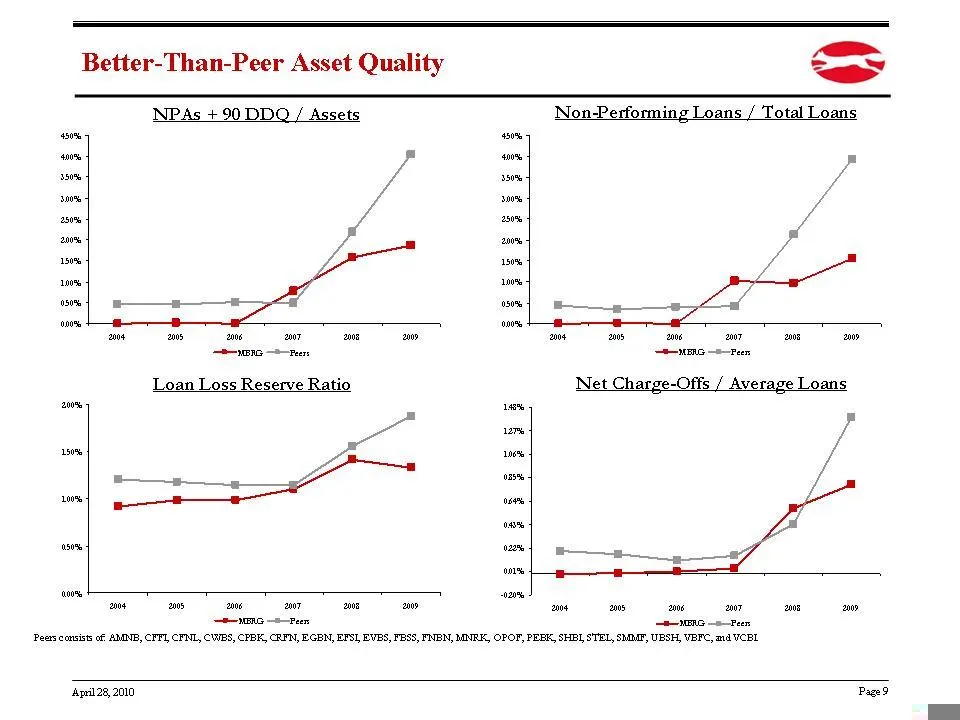
Better-Than-Peer Asset Quality NPAs +90 DDQ / Assets ~ ——— Non-Performing Loans / Total Loans a ————— Loan Loss Reserve Ratio Net Charge-Offs / Average Loans ons |e Pees consists of AMINE, CPTI, CFNL, CWES, CFBK, CRFN, EGEN, EPSI, EVES, FESS, FNEN, MNRK, OPOF, PEEK, SHBI, STEL, SMM, UBSH, VBC, ad VC
Slide 10: Revenue Composition
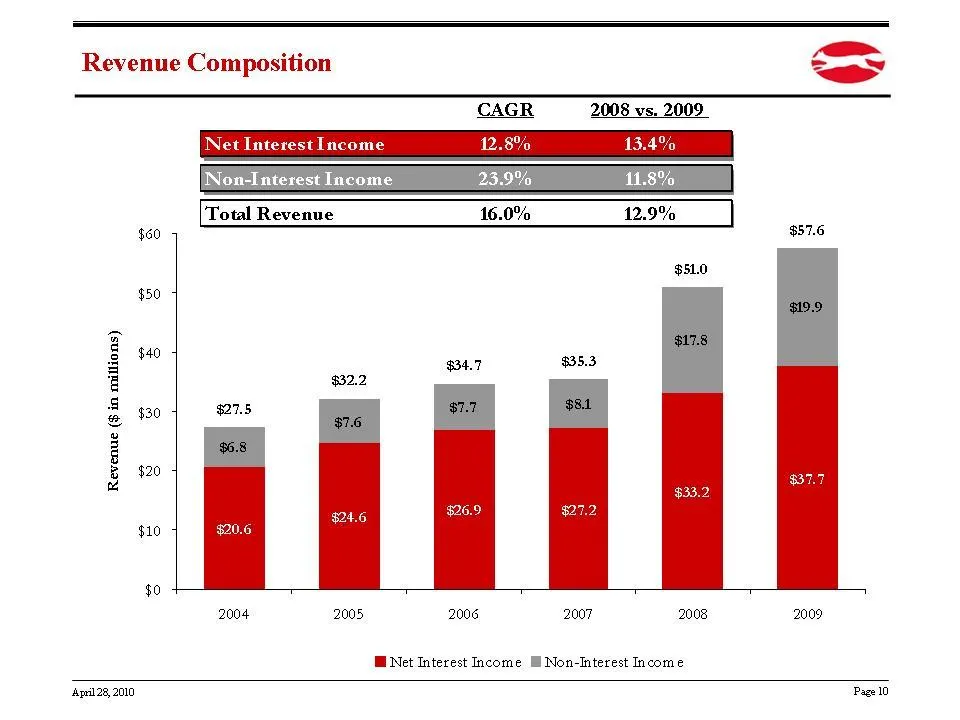
Revenue Composition CAGR 2008 vs. 2009 Net Interest Income 12.8% 13.4% Non-Interest Income 23.9% 11.8% Total Revenue 16.0% 12.9% $60 $57.6 $51.0 $50 § $40 a i $32.2 4 930 $27.5 3 g B $20 cS $33.2 $10 $0 2004 2005, 2006 2007 2008 2009 Wi Net Interest Income M Non-Interest Income ‘pii28 2000 Page 0
Slide 11: Well Capitalized — Effects of Capital Raise
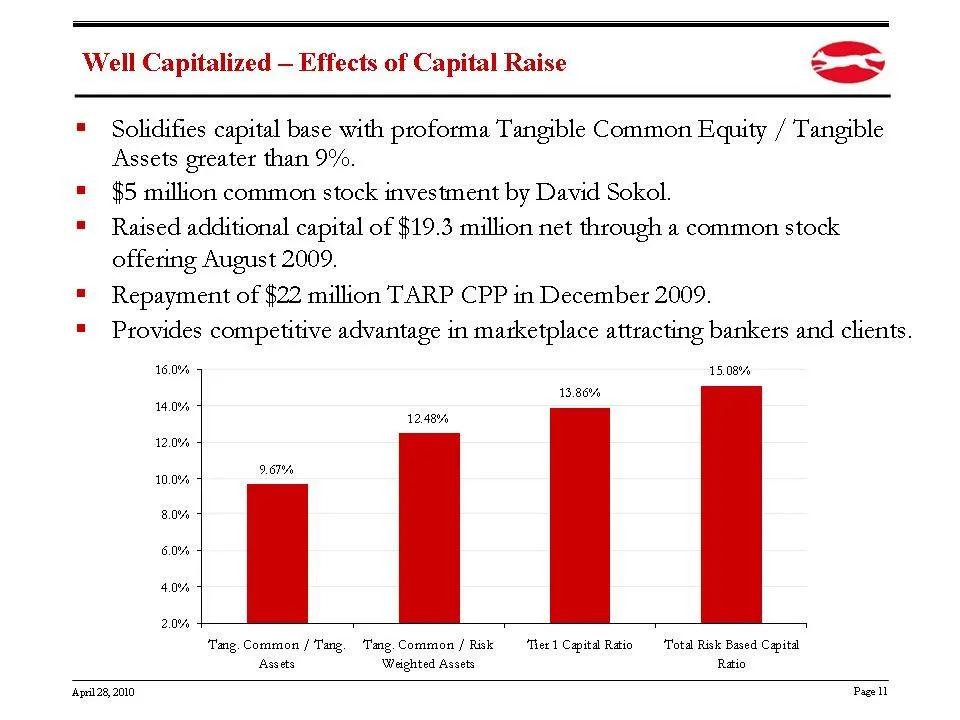
Well Capitalized — Effects of Capital Raise aS = Solidifies capital base with proforma Tangible Common Equity / Tangible Assets greater than 9%. = $5 million common stock investment by David Sokol. = Raised additional capital of $19.3 million net through a common stock offering August 2009. = Repaym
Slide 12: 2009 Summary
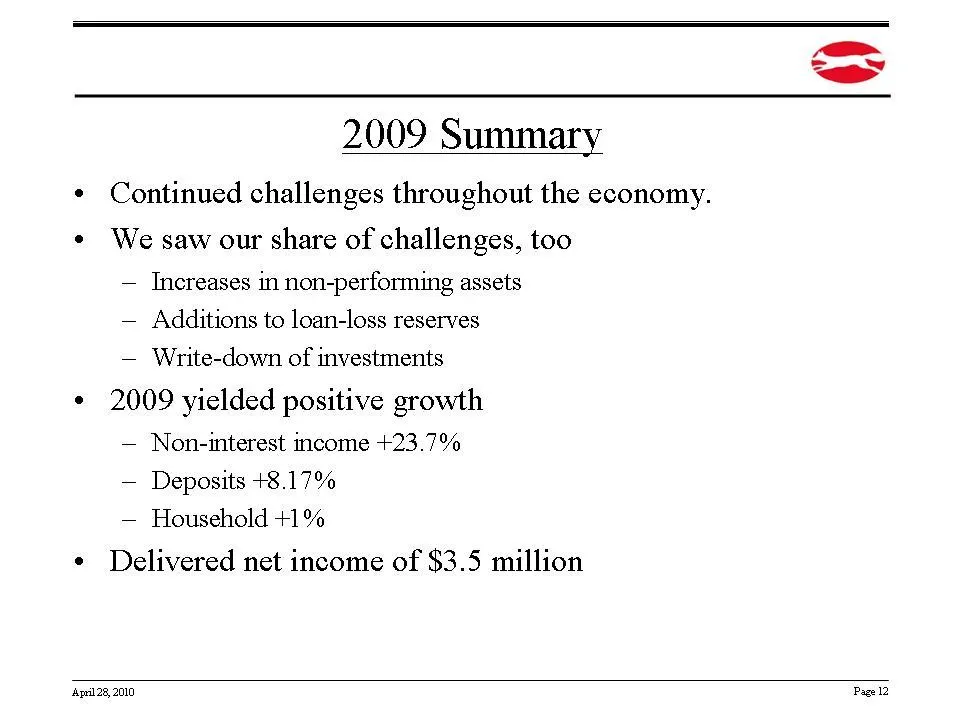
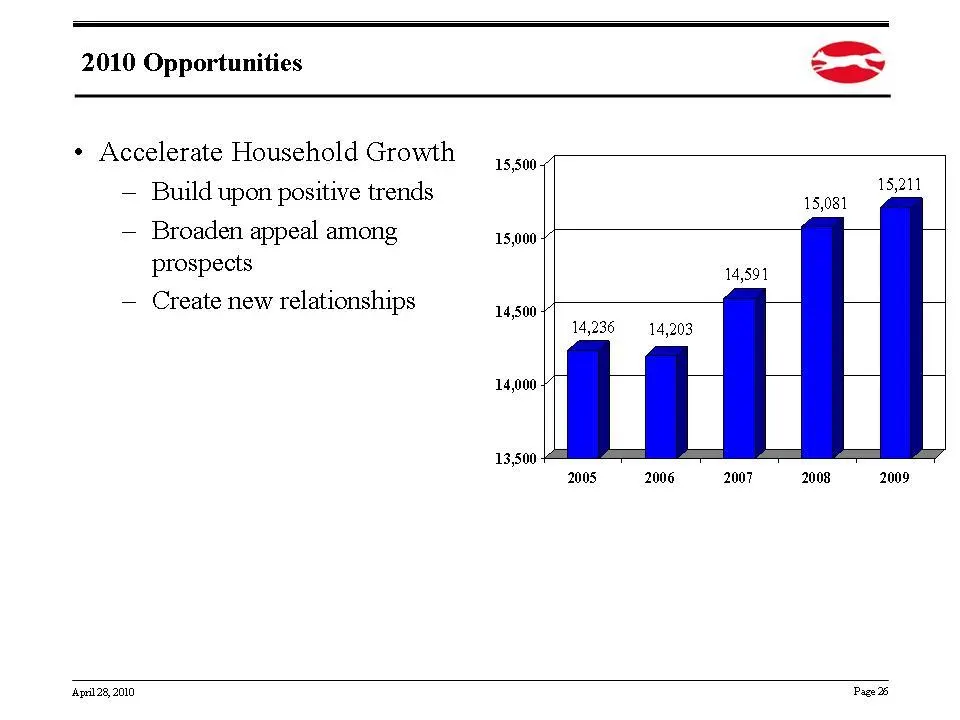
() 2009 Summary ¢ Continued challenges throughout the economy. ¢ We saw our share of challenges, too — Increases in non-performing assets — Additions to loan-loss reserves — Write-down of investments * 2009 yielded positive growth — Non-interest income +23.7% — Deposits +8.17% — Household +1% ¢ Deli
Slide 13: 2010 Opportunities
2010 Opportunities ()
Slide 14: Mission
= Mission To provide high quality financial solutions which aid individuals and businesses in achieving their aspirations, and in so doing, contribute to the welfare of our communities, provide a rewarding work environment for our employees and earn a superior return for our shareholders. Apal28, 20
Slide 15: Mission
= Mission To provide high quality financial solutions which aid individuals and businesses in achieving their aspirations, and in so doing, contribute to the welfare of our communities, provide a rewarding work environment for our employees and earn a superior return for our shareholders. Apal28, 20
Slide 16: Our Constituencies
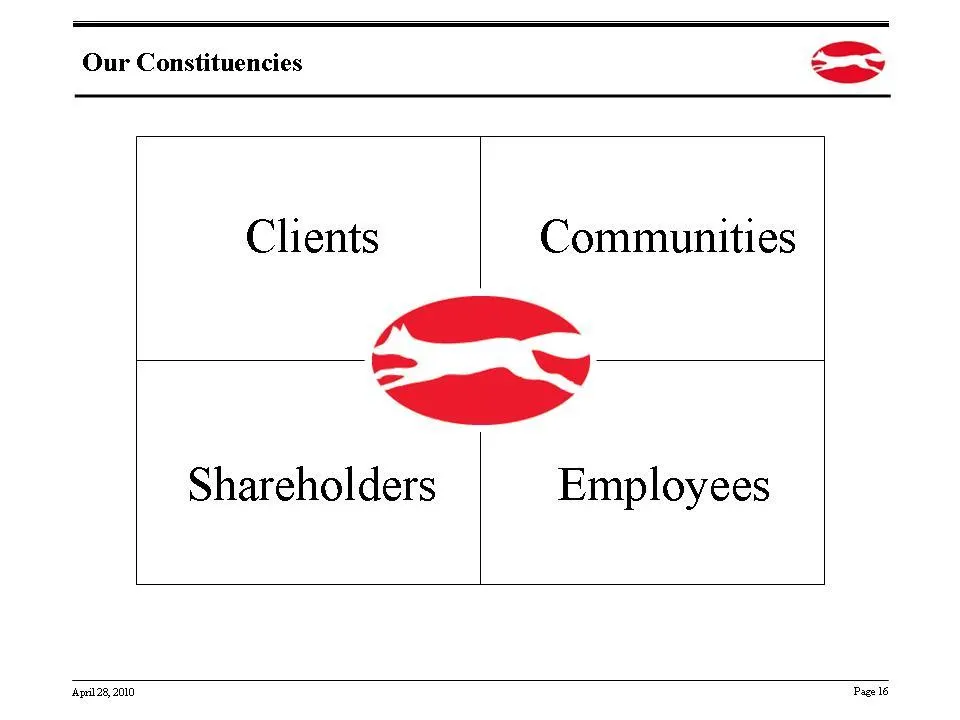
x . Fiona Our Constituencies aS Clients Communities yA oN Shareholders Employees Apal28, 2010 Page 16
Slide 17: Our Constituencies
Our Constituencies () Communities <—>" Shareholders Employees ‘April28, 2010, Page 17
Slide 18: Our Constituencies
() Our Constituencies Clients ee ae —> Shareholders Employees Apal28, 2010 Page 1B
Slide 19: Our Constituencies
Our Constituencies () Clients Communities =D Shareholders Employees Apal28, 2010 Page 19
Slide 20: Our Constituencies
a A ad Our Constituencies aS Clients Communities ibe” Shareholders Employees Apal28, 2010 Page
Slide 21: Vision
() Vision We are a Bank in the Business of Wealth Management Core Values Competency and Trust Apal28, 2010 Page 21
Slide 22: 2010 Opportunities
2010 Opportunities aS * No “silver bullet” solution for improved financial performance ¢ Three key opportunities that will drive results: — Improve operational efficiency — Open new Financial Service Centers — Attract new households Apal28, 2010 Page 2.
Slide 23: 2010 Opportunities: Improve Operational Efficiency
2010 Opportunities () * Improve Operational Efficiency — Streamline processes — Review technology enhancements — Tighten expense control Apal28, 2010 Page
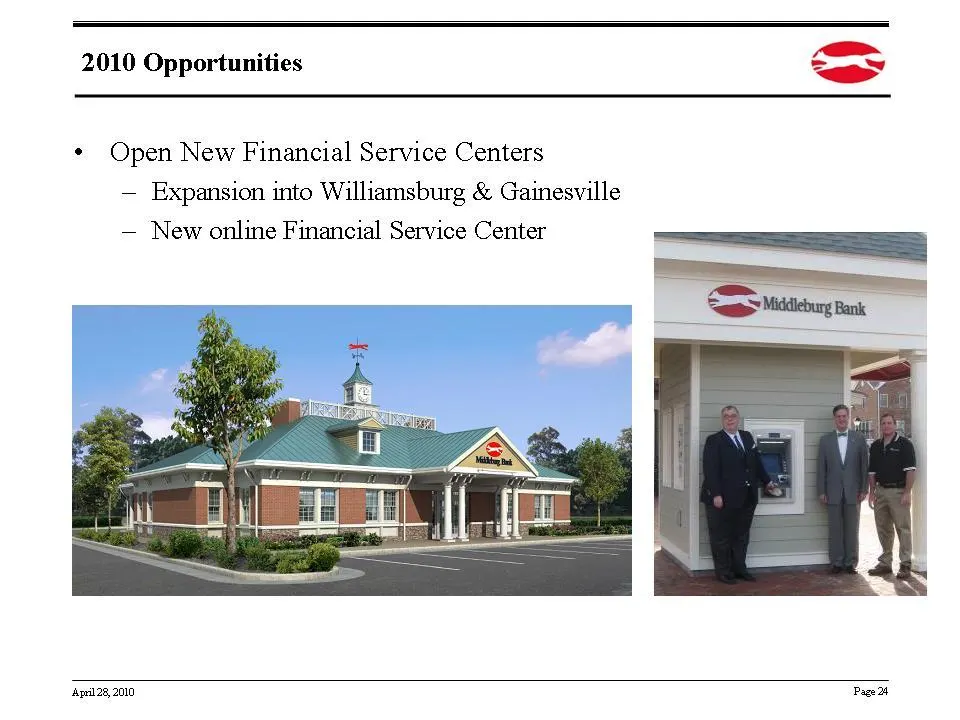
Slide 24: 2010 Opportunities: Open New Financial Service Centers
) 2010 Opportunities as ( * Open New Financial Service Centers — Expansion into Williamsburg & Gainesville — New online Financial Service Center Apal28, 2010 Paget
Slide 25: New Online Financial Service Center
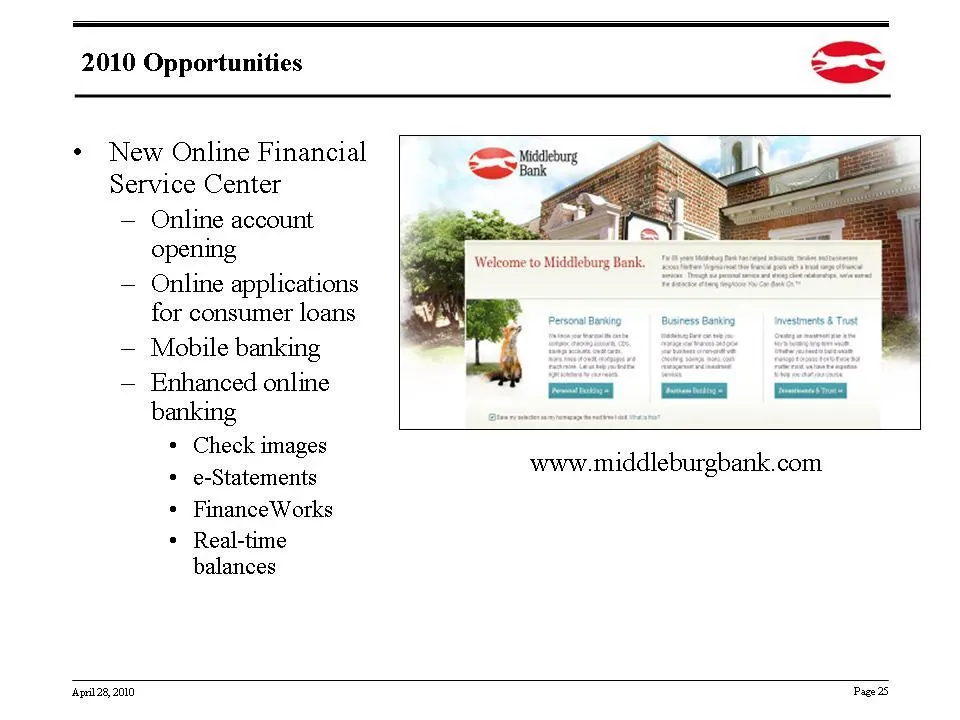
2010 Opportunities * New Online Financial Service Center — Online account opening — Online applications for consumer loans — Mobile banking — Enhanced online banking * Check images « e-Statements * FinanceWorks + Real-time balances www.middleburgbank.com ‘April28, 2010, Page
Slide 26: Accelerate Household Growth
2010 Opportunities « Accelerate Household Growth — Build upon positive trends — Broaden appeal among prospects — Create new relationships 15,500 15,000 14,500 14,000 13,500 2005 2006 2007 2008 2009 ‘April28, 2010, Page 25
Slide 27: Accelerate Household Growth
Accelerate Household Growth « Build awareness/preference among non-clients — reach people who have not seen our messages « Expand beyond community papers — Add Cable TV * Reach prospects who mirror current clientele (50+) — CNN, Fox News, Golf Channel, MSNBC * Reach prospects under-represented among
Slide 28: Brand Identity
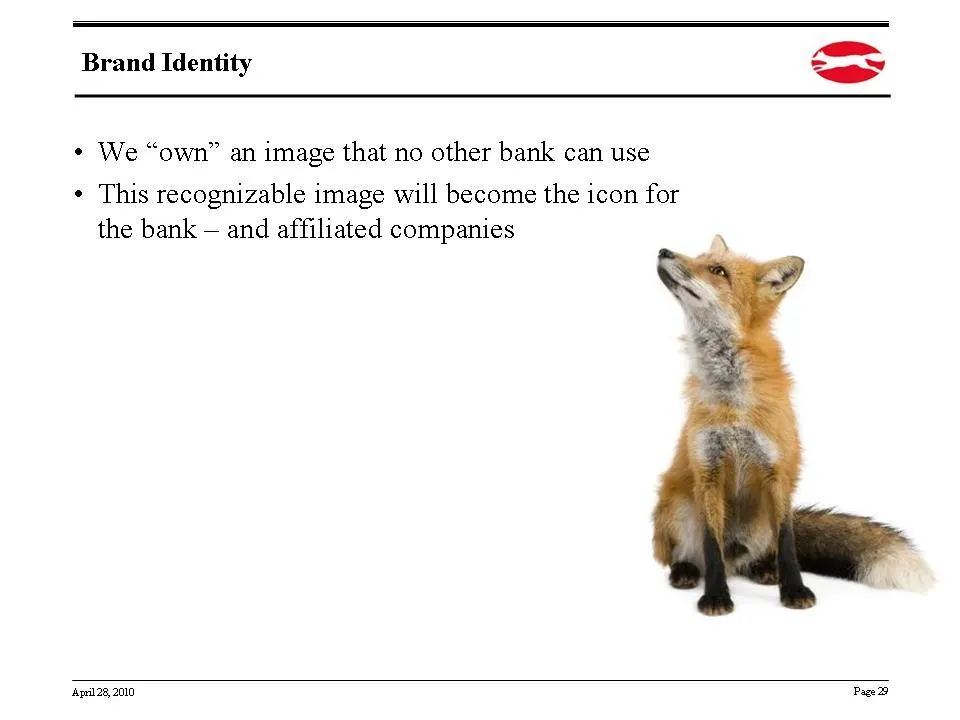
Brand Identity () « We “own” an image that no other bank can use « This recognizable image will become the icon for the bank — and affiliated companies Apal28, 2010 Page
Slide 29: Brand Identity
) Brand Identity as ( « We “own” an image that no other bank can use « This recognizable image will become the icon for the bank — and affiliated companies Apal28, 2010 Page B
Slide 30: Best Of Loudoun
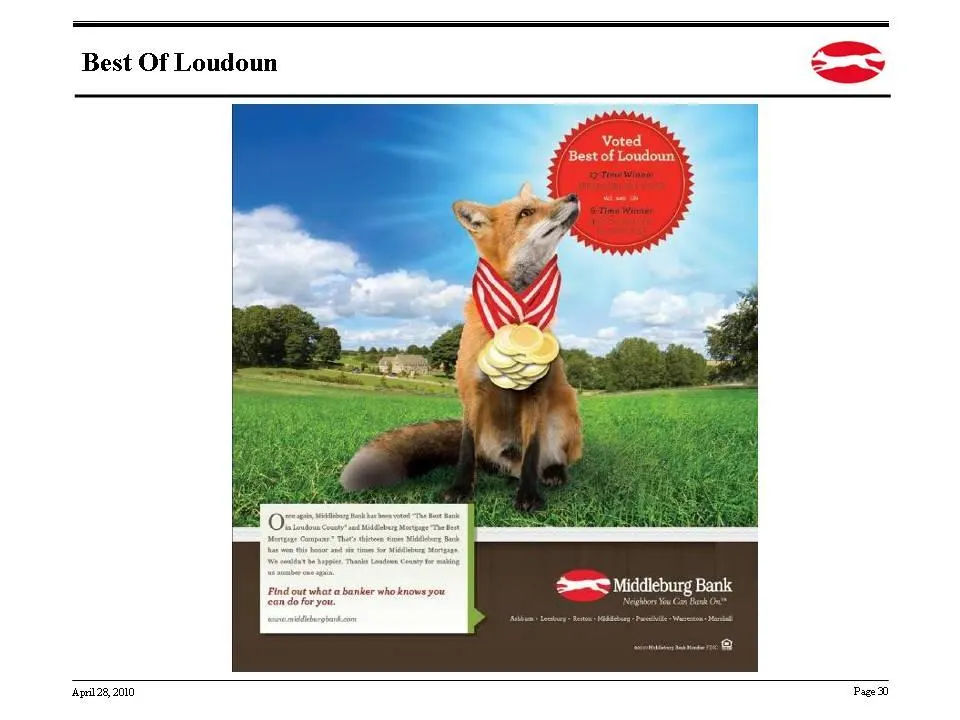
) Best Of Loudoun as \ Find out what @ banker who knows you ‘can do for you Apal28, 2010 Page
Slide 31: Newspaper Ads
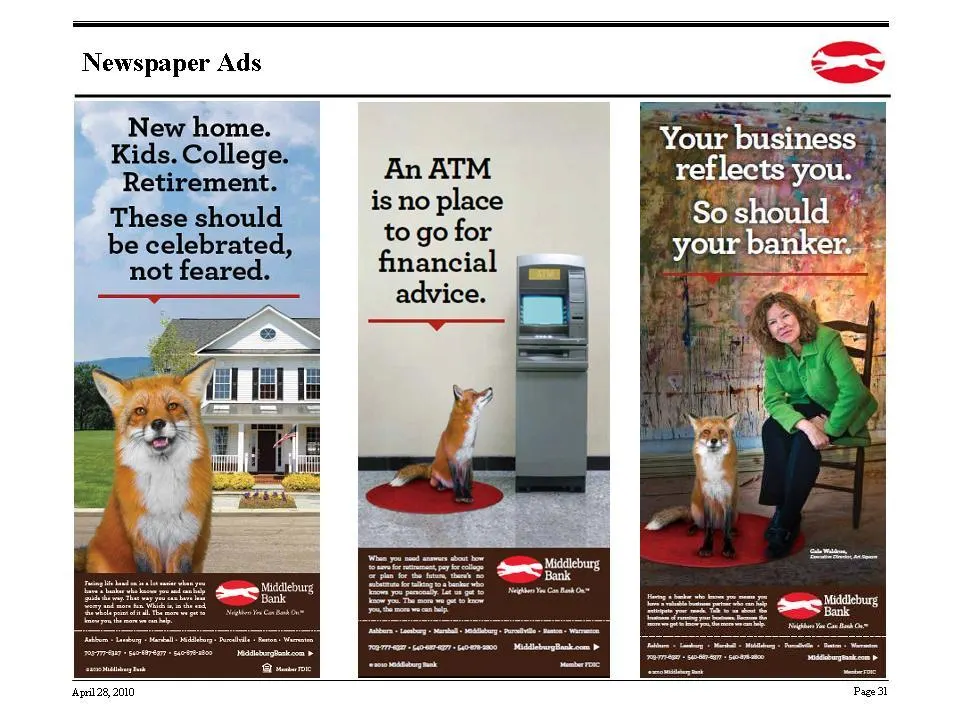
Newspaper Ads by New home. Your business An ATM is no place to go for financial advice. Middleburg Bank Apal28, 2010 Page 31
Slide 32: Television
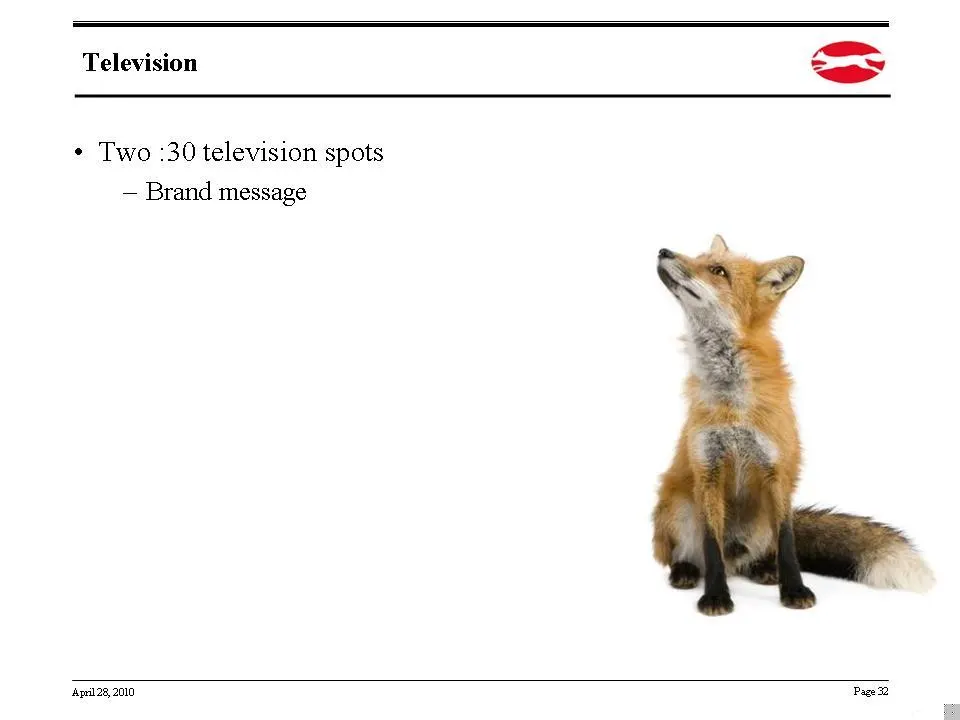
) Television as a « Two :30 television spots — Brand message Apal28, 2010 Page 22
Slide 33: Television
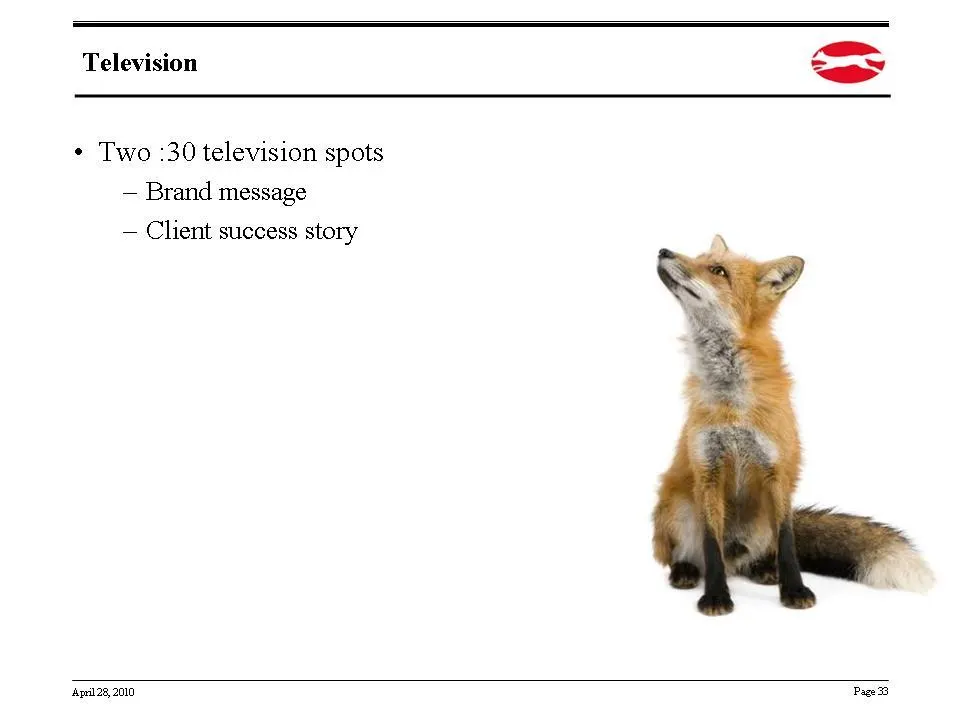
) Television as ( « Two :30 television spots — Brand message — Client success story Apal28, 2010 Page
Slide 34: Conclusion
Conclusion —— * Capitalizing on key opportunities will yield significant benefits — Greater efficiency improves bottom line results — New Financial Service Centers expand business opportunities and. generate additional revenue — New relationships grow the organization and improve utilization of exis
Slide 35: Middleburg Financial Corporation
() __ m, Middleburg <=>" Financial Corporation
Source: SEC EDGAR · 8-K filed Apr 28, 2010
More decks from Middleburg Financial Corp
 Merger or Acquisition (October 2016)19 slides · Oct 24, 2016
 Shareholder Meeting (May 2016)24 slides · May 4, 2016
 Investor Presentation (September 2015)33 slides · Sep 18, 2015
 Shareholder Meeting (May 2015)24 slides · May 6, 2015
 Shareholder Meeting (May 2014)22 slides · May 9, 2014
 Shareholder Meeting (May 2013)26 slides · May 1, 2013