Middleburg Financial — Shareholder Meeting (May 2016)
24 slides from Middleburg Financial's shareholder meeting presentation, May 4, 2016
Slide 1: Annual Meeting
Cn = Middleburg Bank Seas” Neighbors You 1g Bank On™ Annual Meeting May 4, 2016
Slide 2: Forward-Looking Statements
Forward-Looking Statements —S Certain information contained in this discussion may include “forward-looking statements” within the meaning of Section 27A of the Securities Act of 1933, as amended, and Section 21E of the Securities Exchange Act of 1934, as amended. These forward-looking statements re
Slide 3: Agenda
Agenda <> ( e Corporate Overview ¢ Review of 2015 Performance / First Quarter 2016 Highlights ¢ Growth Strategy / Goals for 2016 Celebrating 90 years | -@@™ Middleburg 1924-2014 | qa Bank
Slide 4: Corporate Overview
Corporate Overview ()
Slide 5: Corporate Profile
) Corporate Profile — Diversified financial services company founded in 1924 — Community Bank — Trust & Wealth Management — Mortgage ¢ Conduct business primarily in Virginia — Northern Virginia — Richmond & Williamsburg ¢ Total assets of $1.3 billion ¢ Consistent growth in Assets, Deposits, and Clie
Slide 6: Well Positioned for Growth
Well Positioned for Growth —> Management is focused on profitable growth Balance sheet flexibility to add profitable loan growth without funding constraints Diversified business lines with an accomplished Trust and Wealth Management Business Well-positioned branch franchise operating in some of the
Slide 7: Management Team
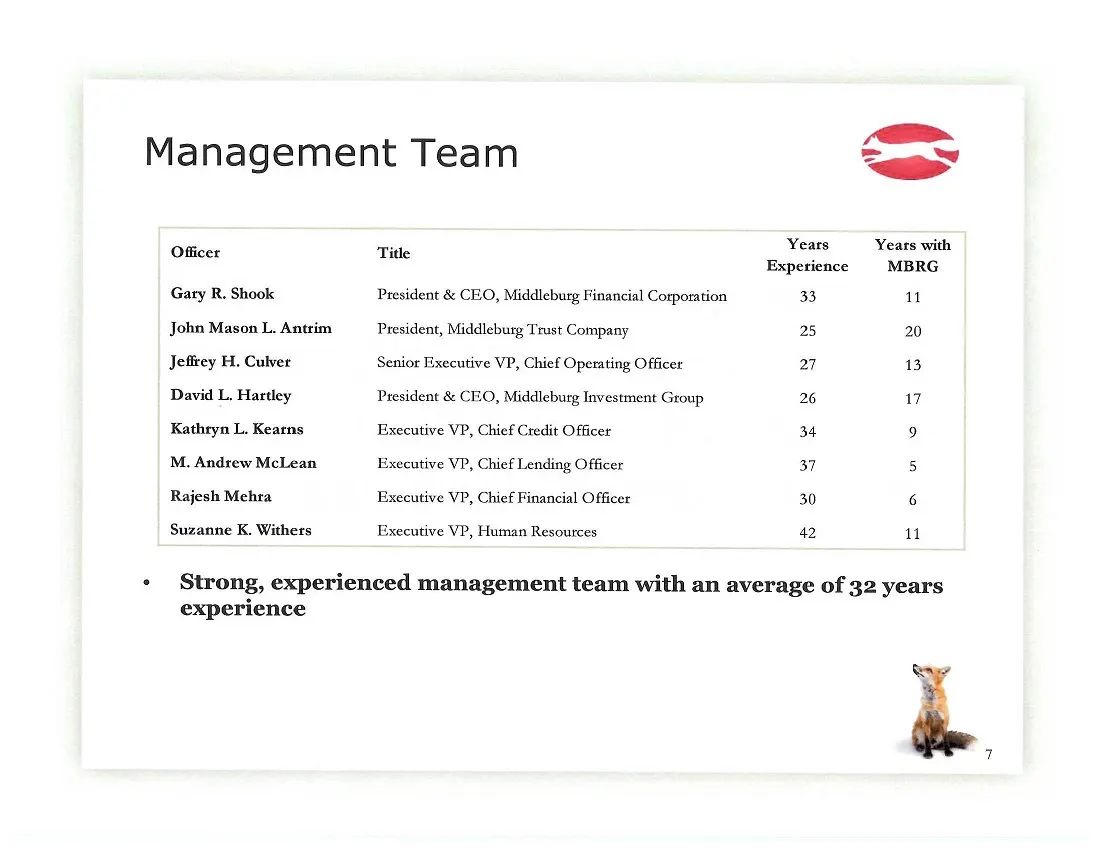
Management Team Officer Gary R. Shook John Mason L. Antrim Jeffrey H. Culver David L. Hartley Kathryn L. Kearns M. Andrew McLean Rajesh Mehra Suzanne K. Withers experience Title President & CEO, Middleburg Financial Corporation President, Middleburg Trust Company Senior Executive VP, Chief Operating
Slide 8: Geographic Footprint
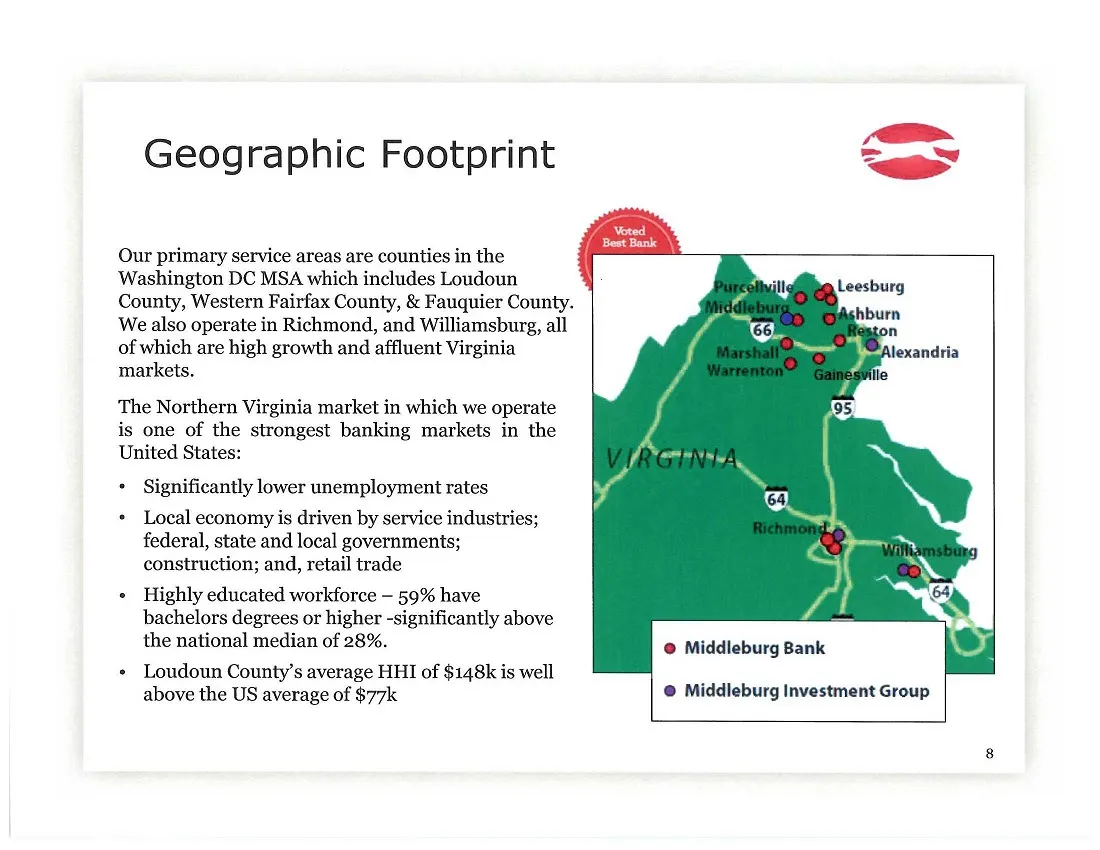
Geographic Footprint — Our primary service areas are counties in the Washington DC MSA which includes Loudoun County, Western Fairfax County, & Fauquier County. We also operate in Richmond, and Williamsburg, all of which are high growth and affluent Virginia markets. The Northern Virginia market in
Slide 9: 2015 Performance / First Quarter Highlights
() 2015 Performance / First Quarter Highlights
Slide 10: Key Financial Highlights
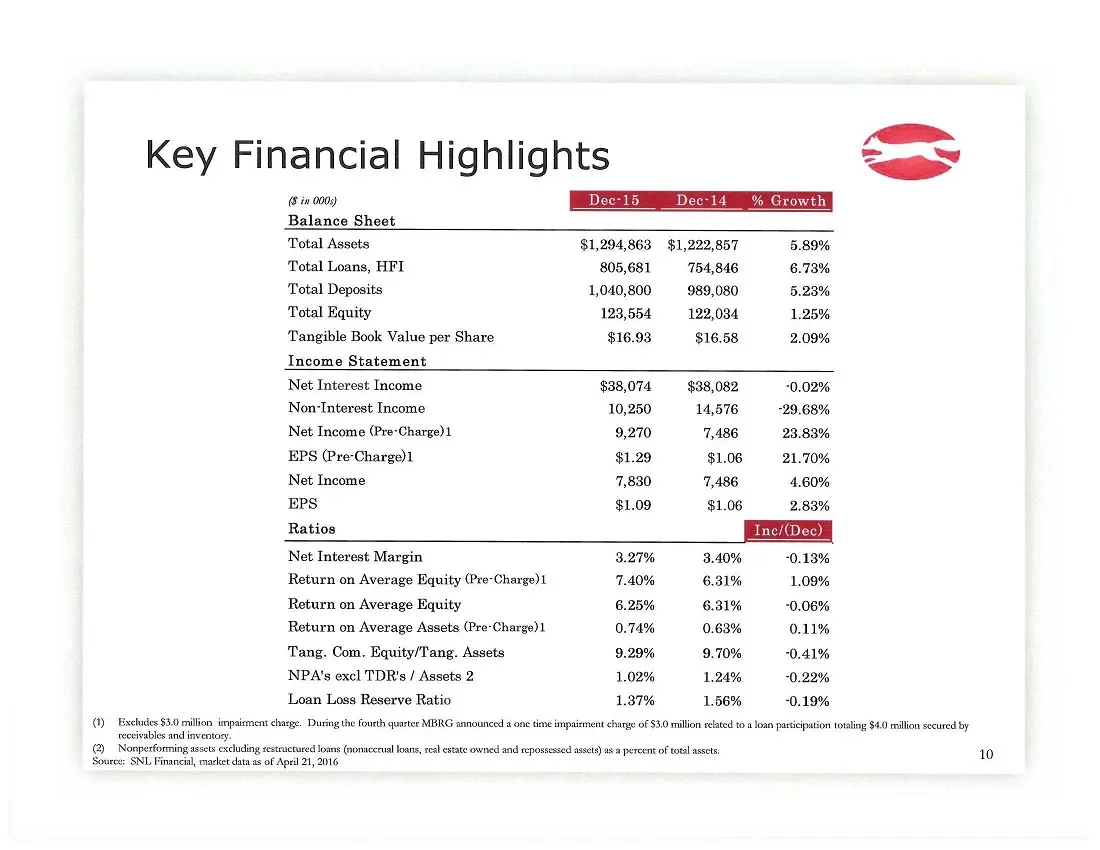
O) Key Financial Highlights Excludes $3.0 million impairment charge. During the fourth quarter MBRG announced a one iene impement charge of $30 milion related to a loan patcipation totaling $40 milion secured by receivables and inventory (in 0009 Balance Sheet ‘Total Assets $1,294,863 $1,222,857 5.8
Slide 11: Asset Growth
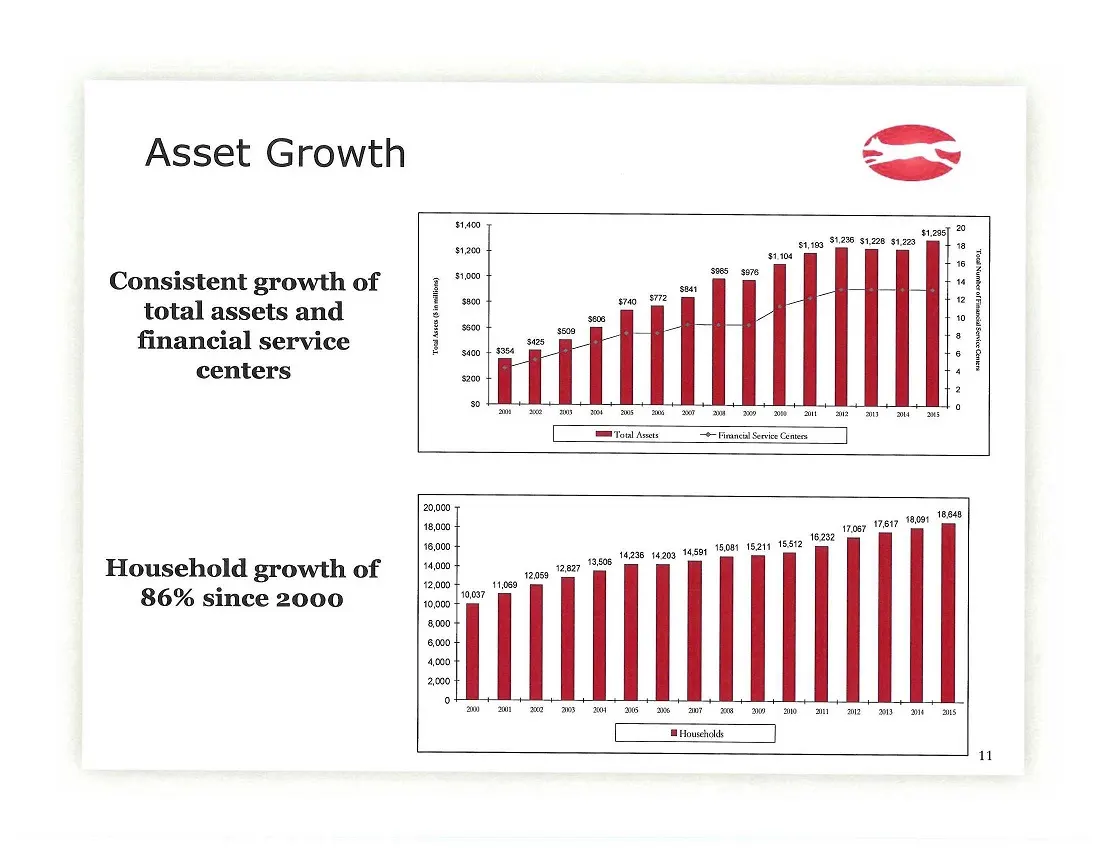
Asset Growth Consistent growth of total assets and financial service centers Household growth of 86% since 2000 1209 svse0 31236 51228 51223, a 14908 1420 ‘4581 nen NSS gpa sain t85t2 u
Slide 12: Improving Financial Performance
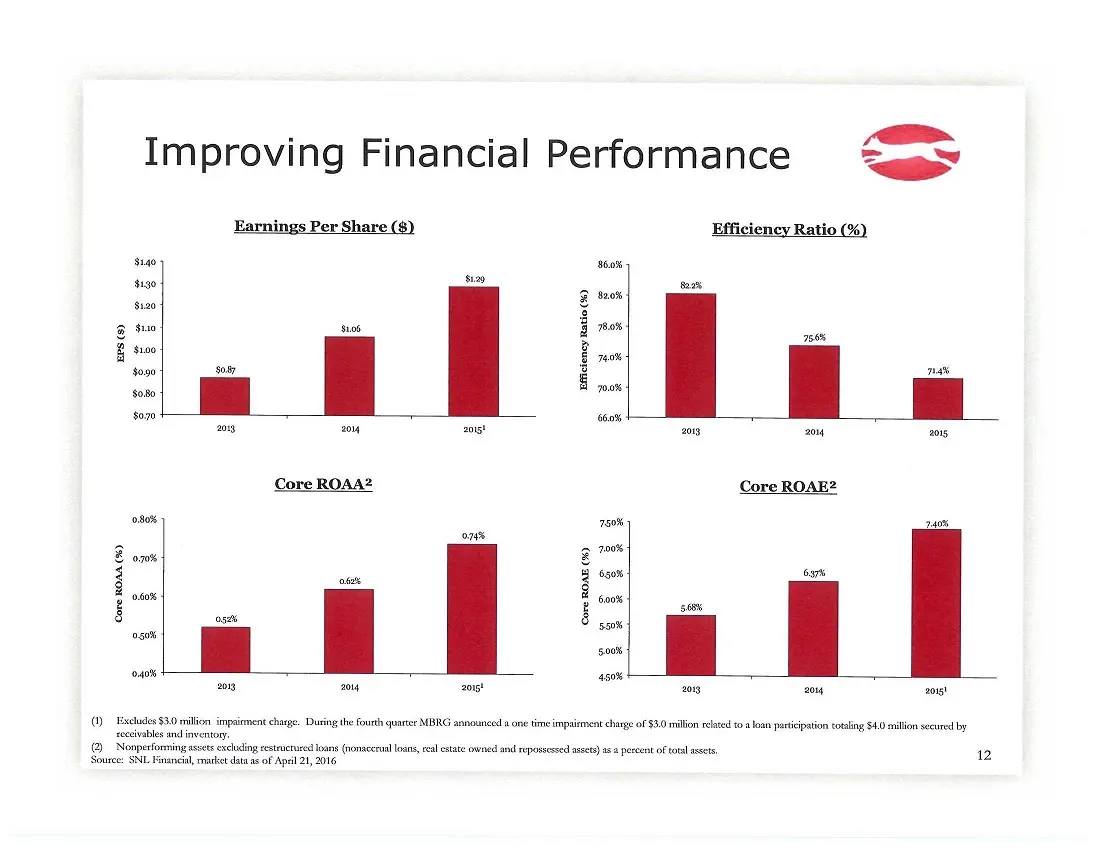
Improving Financial Performance qq» Earnings Per Share Efficiency Ratio (%) S140 60% 129 mass He pee g tue $106, B rox a Btu Bon $090 oc i max a | a | $070 60% 203 2014 2a! 2013 2014 2015 re ROAA2 Core ROAE? 080% 1508 240% ons « a 700 © o7o% & _ ; = inn F 060% F cae 506 ost ‘50% 50% 5.008 ogo 50% 20
Slide 13: Focused on Continued Improvement
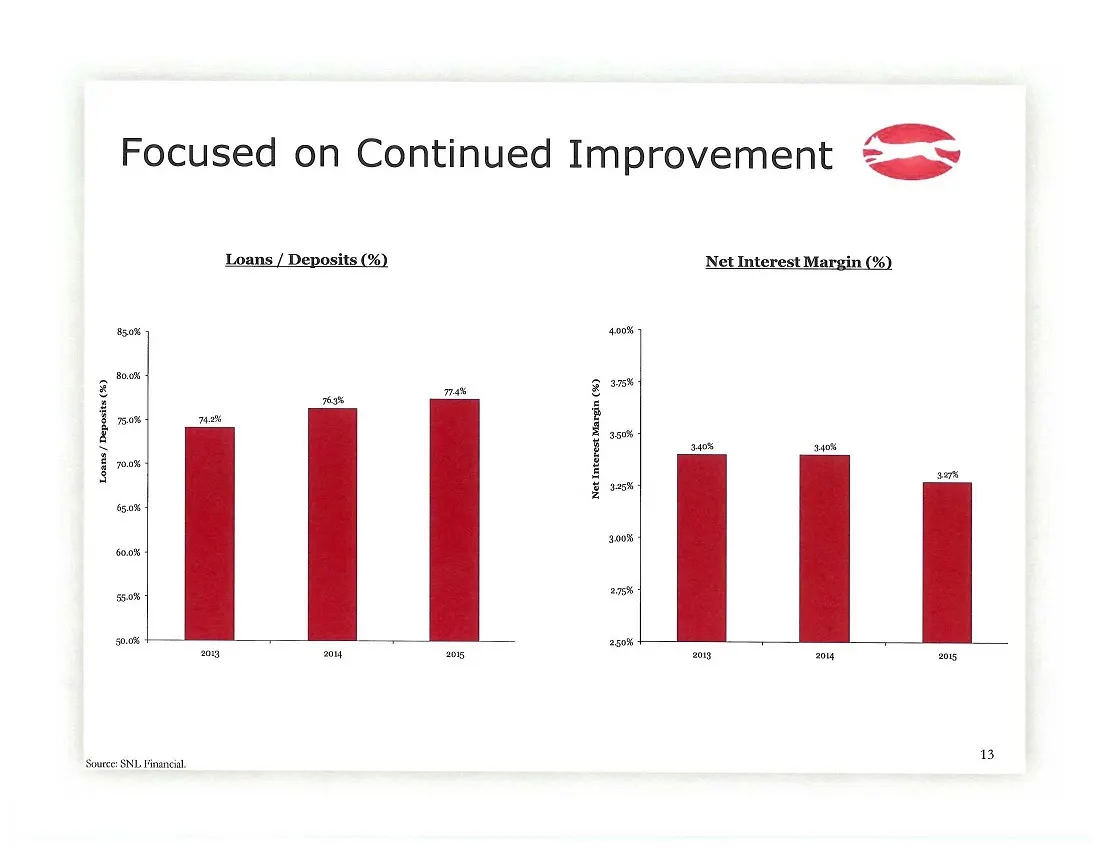
Focused on Continued Improvement ess Loans / Deposits (%) Net Interest Margin (%) 50% 4008 soot > g wt ma 2 os 2 ‘0% nt é 2 sot 7 : 3.40% 340% 00% i ES er Esse so 00% coos 5.0% sad so. 50% 2035 2014 205 2018 204, 2035 Soueee: SNI- Financial. 13
Slide 14: Key Indicators
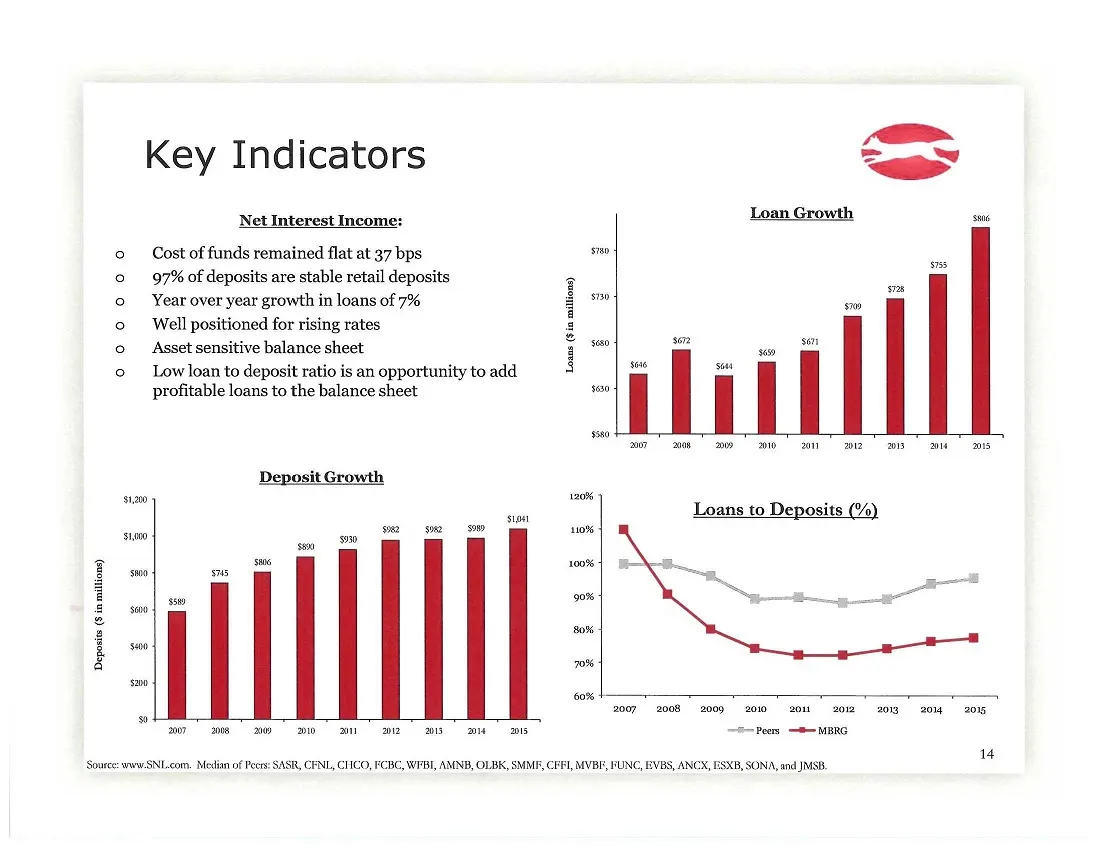
Key Indicators Net Interest Income: Cost of funds remained flat at 37 bps 97% of deposits are stable retail deposits Year over year growth in loans of 7% Well positioned for rising rates Asset sensitive balance sheet Low loan to deposit ratio is an opportunity to add profitable loans to the balance
Slide 15: Deposit Growth
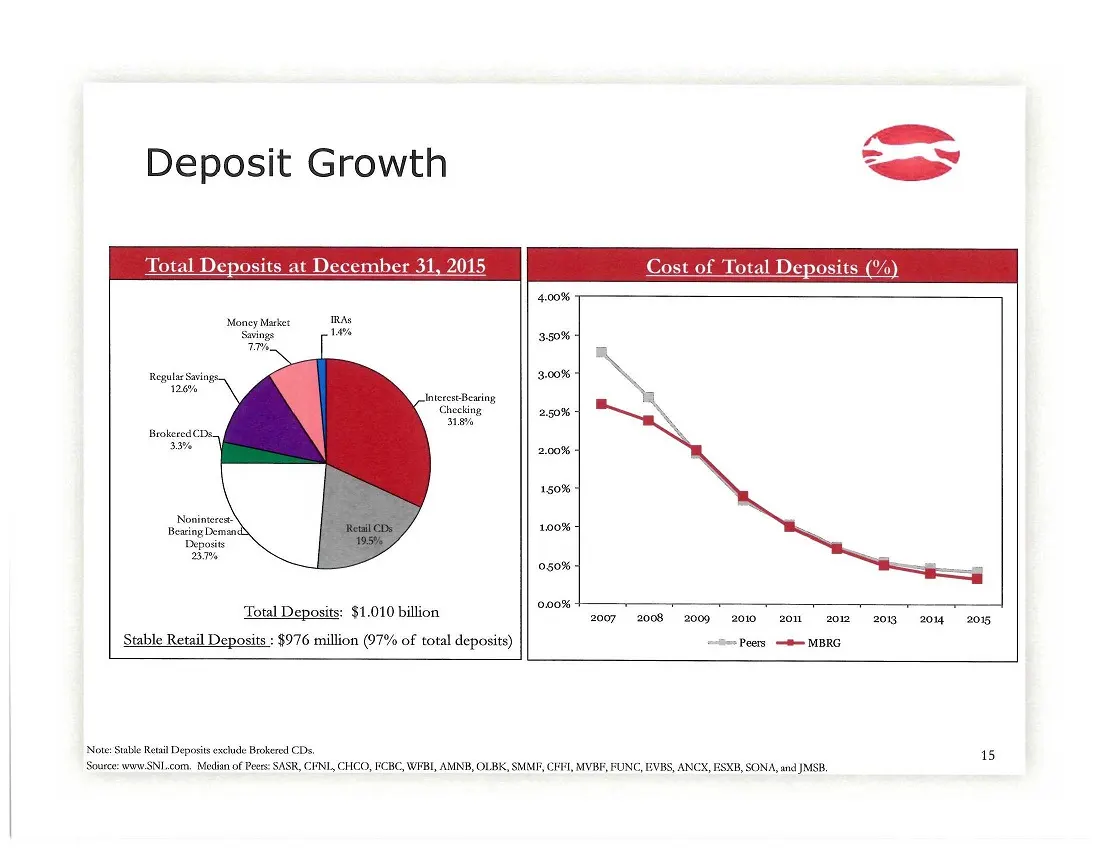
) Deposit Growth ‘Total Deposits: $1.010 billion a ee a eee Stable Retail Deposits ; $976 million (97% of total deposits) es Peers t= MBRG Note: Stable Retail Deposits exclude Brokered CDs, 1s Source: wow.SNI.com, Median of Pees: SASR, CFNL, CHCO, FCBC, WEBI, AMNB, OLBK, SMME, CFE, MVBE, FUNC, EVBS,
Slide 16: MBRG Total Return vs. NASDAQ Bank Index
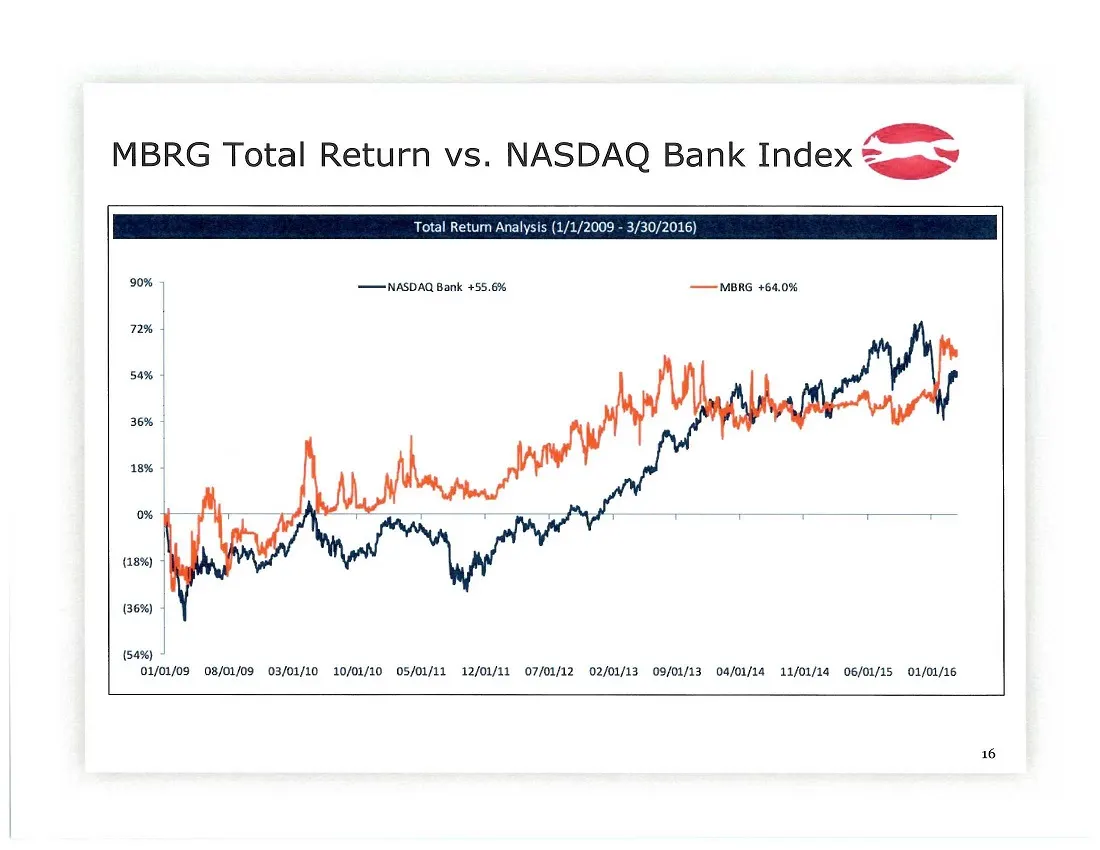
MBRG Total Return vs. NASDAQ Bank Index Zeus» 90% NASDAQ Bank +55.6% ——are +64.0% n2% 54% 36% 18% 0% (18%) (36%) (54%) 01/01/o9 08/01/09 03/01/10 10/01/10 05/01/11 12/01/11 07/01/12 02/01/13 09/01/13 04/0/14 11/01/14 06/01/15 01/01/16 16
Slide 17: First Quarter 2016 Highlights
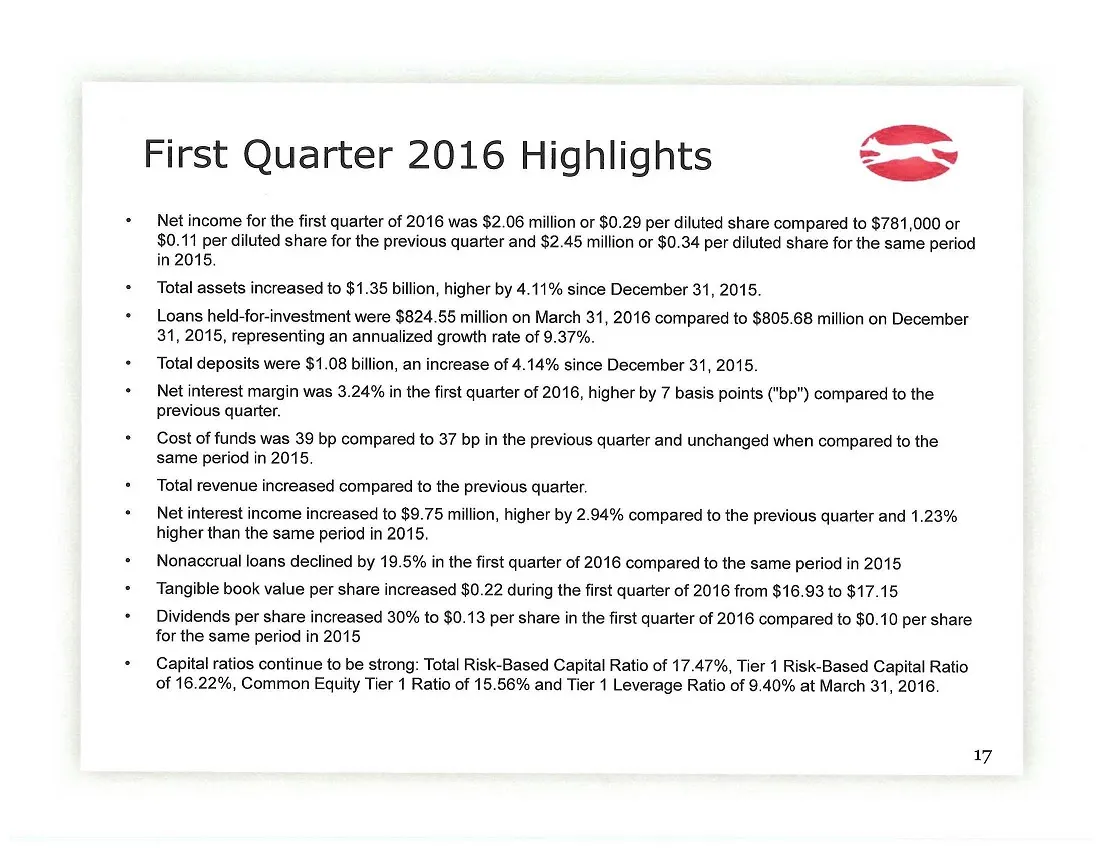
First Quarter 2016 Highlights — Net income for the first quarter of 2016 was $2.06 million or $0.29 per diluted share compared to $781,000 or $0.11 per diluted share for the previous quarter and $2.45 million or $0.34 per diluted share for the same period in 2015. Total assets increased to $1.35 bil
Slide 18: Growth Strategy / Goals for 2016
() Growth Strategy / Goals for 2016 A
Slide 19: Growth Strategy
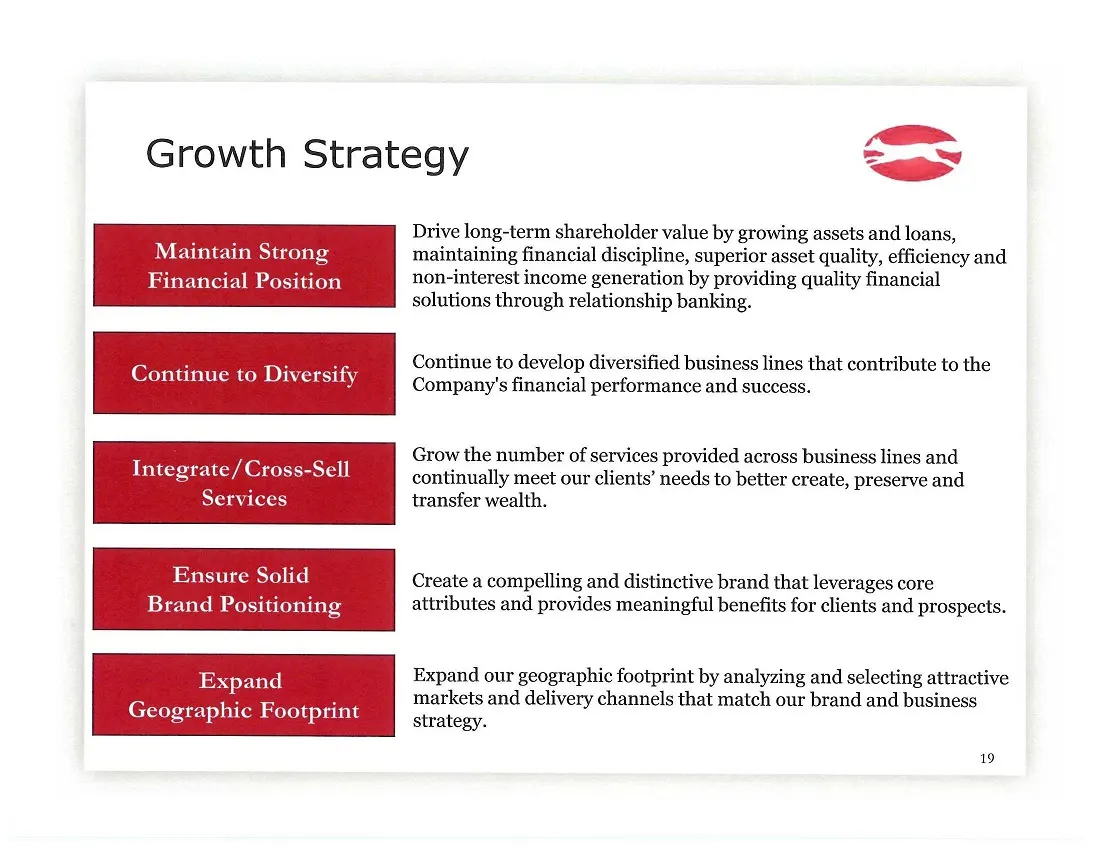
Growth Strategy — Integrate/Cros Services Ensure Solid Brand Positioning Expand Geographic Footprint Drive long-term shareholder value by growing assets and loans, maintaining financial discipline, superior asset quality, efficiency and non-interest income generation by providing quality financial s
Slide 20: 2016 Goals
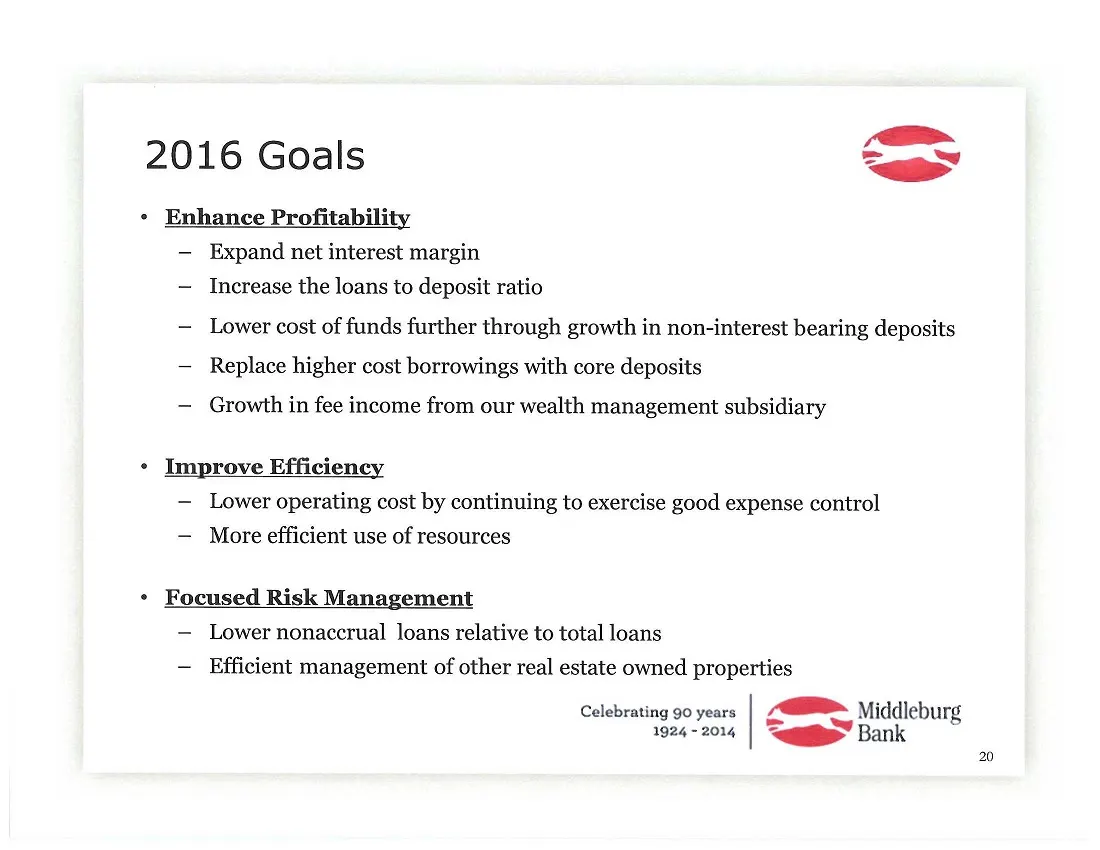
2016 Goals % Enhance Profitability — Expand net interest margin ( — Increase the loans to deposit ratio — Lower cost of funds further through growth in non-interest bearing deposits — Replace higher cost borrowings with core deposits — Growth in fee income from our wealth management subsidiary * Imp
Slide 21: Key Constituent Goals
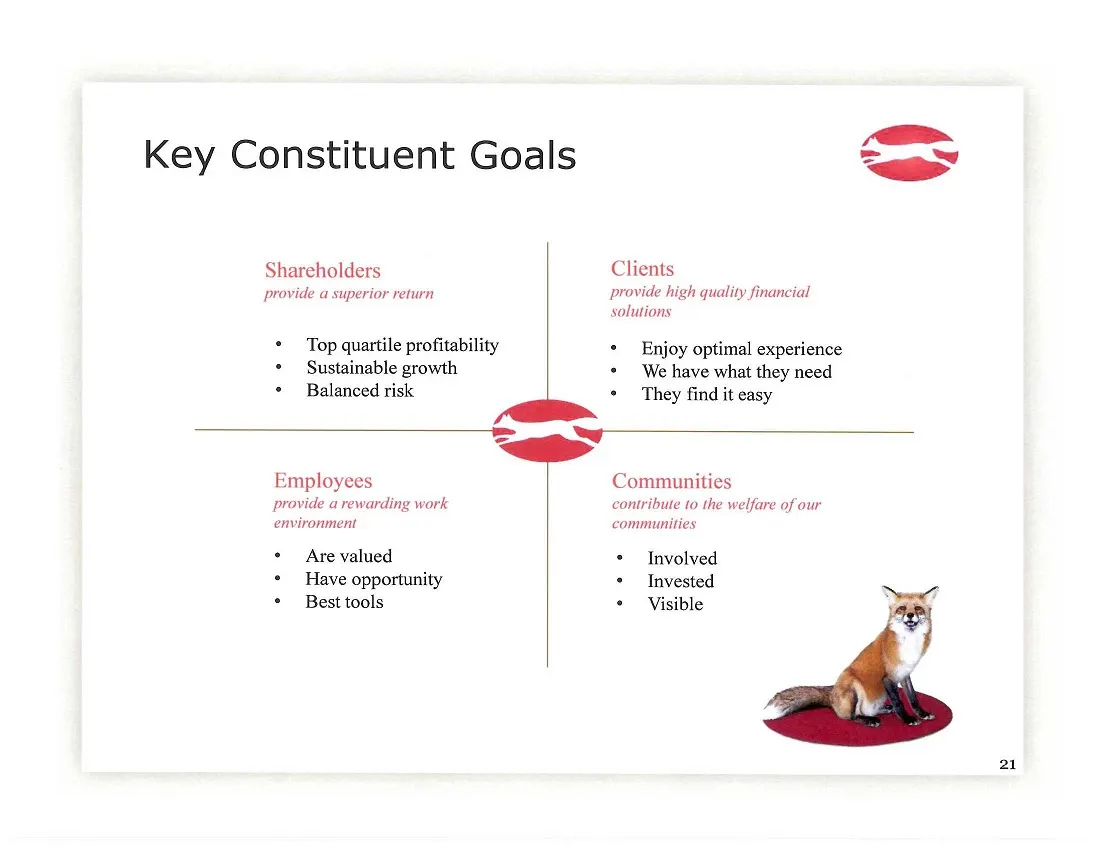
Key Constituent Goals Shareholders provide a superior return * Top quartile profitability * Sustainable growth * Balanced risk Employees provide a rewarding work environment ° Are valued * Have opportunity ° Best tools () Clients provide high quality financial solutions * Enjoy optimal experience *

Slide 22: Balls Bluff Elementary
Balls Bluff Elementary Loudoun Cimes-“Mirror BEST OF LOUDOUN Middleburg Bank Celebrating 90 years e_ my Middleburg 1924-2014 | qa Bank 22
Slide 23: Questions?
Questions?
Slide 24: Thank You
> Middleburg Rie” Financial Corporation Thank You
Source: SEC EDGAR · 8-K filed May 4, 2016
More decks from Middleburg Financial Corp
 Merger or Acquisition (October 2016)19 slides · Oct 24, 2016
 Investor Presentation (September 2015)33 slides · Sep 18, 2015
 Shareholder Meeting (May 2015)24 slides · May 6, 2015
 Shareholder Meeting (May 2014)22 slides · May 9, 2014
 Shareholder Meeting (May 2013)26 slides · May 1, 2013
 Shareholder Meeting (May 2012)27 slides · May 2, 2012