SI Financial — IPO Roadshow (January 2011)
27 slides from SI Financial's IPO roadshow presentation, Jan 4, 2011
Slide 1: Second Step Conversion and Offering
Issuer Free Writing Prospectus Filed Pursuant to Rule 433 Registration Statement No. 333-169302 Second Step Conversion and Offering January 2011
Slide 2: Legal Disclaimers
Legal Disclaimers This presentation is for informational purposes only and does not constitute an offer to sell nor a solicitation of an offer to buy shares of common stock of SI Financial Group, Inc. The offer is made only by the prospectus. Please refer to the prospectus dated November 10, 2010. S
Slide 3: Forward Looking Statements
Forward Looking Statements This presentation contains forward-looking statements, which can be identified by the use of words such as “believes,” “expects,” “anticipates,” “estimates” or similar expressions. These forward-looking statements include, but are not limited to: statements of our goals, i
Slide 4: Offering Summary
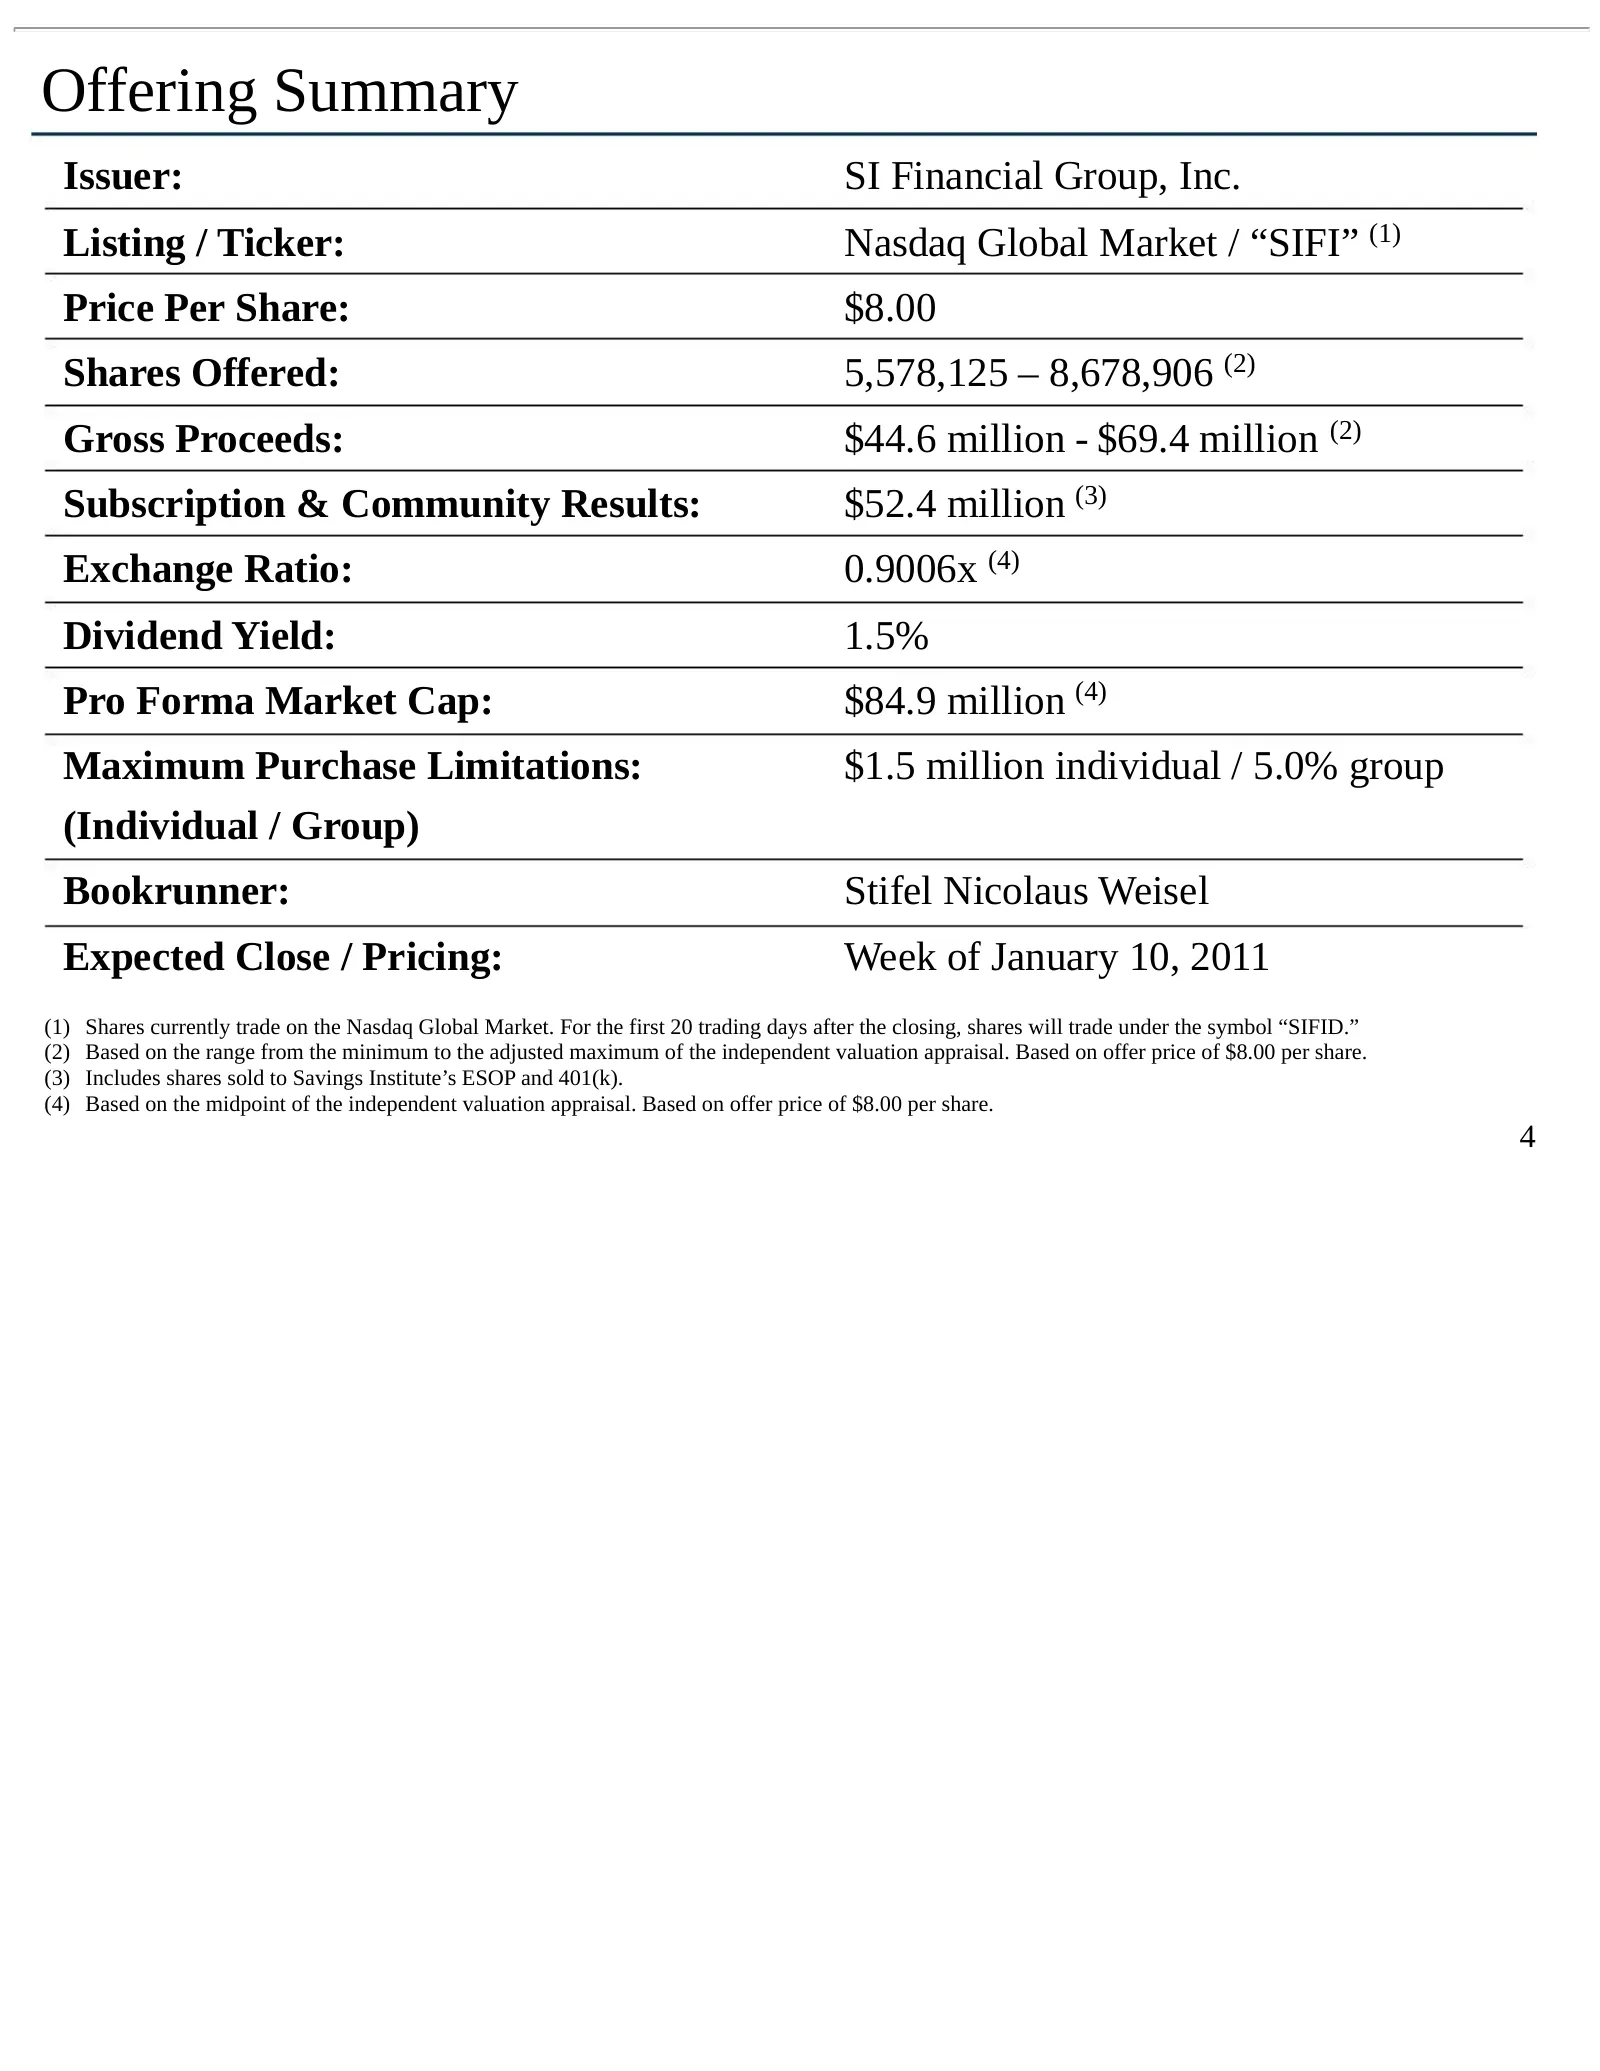
Offering Summary Issuer: SI Financial Group, Inc. Listing / Ticker: Nasdaq Global Market / “SIFI” (1) Price Per Share: $8.00 Shares Offered: 5,578,125 – 8,678,906 (2) Gross Proceeds: $44.6 million - $69.4 million (2) Subscription & Community Results: $52.4 million (3) Exchange Ratio: 0.9006x (4) Div
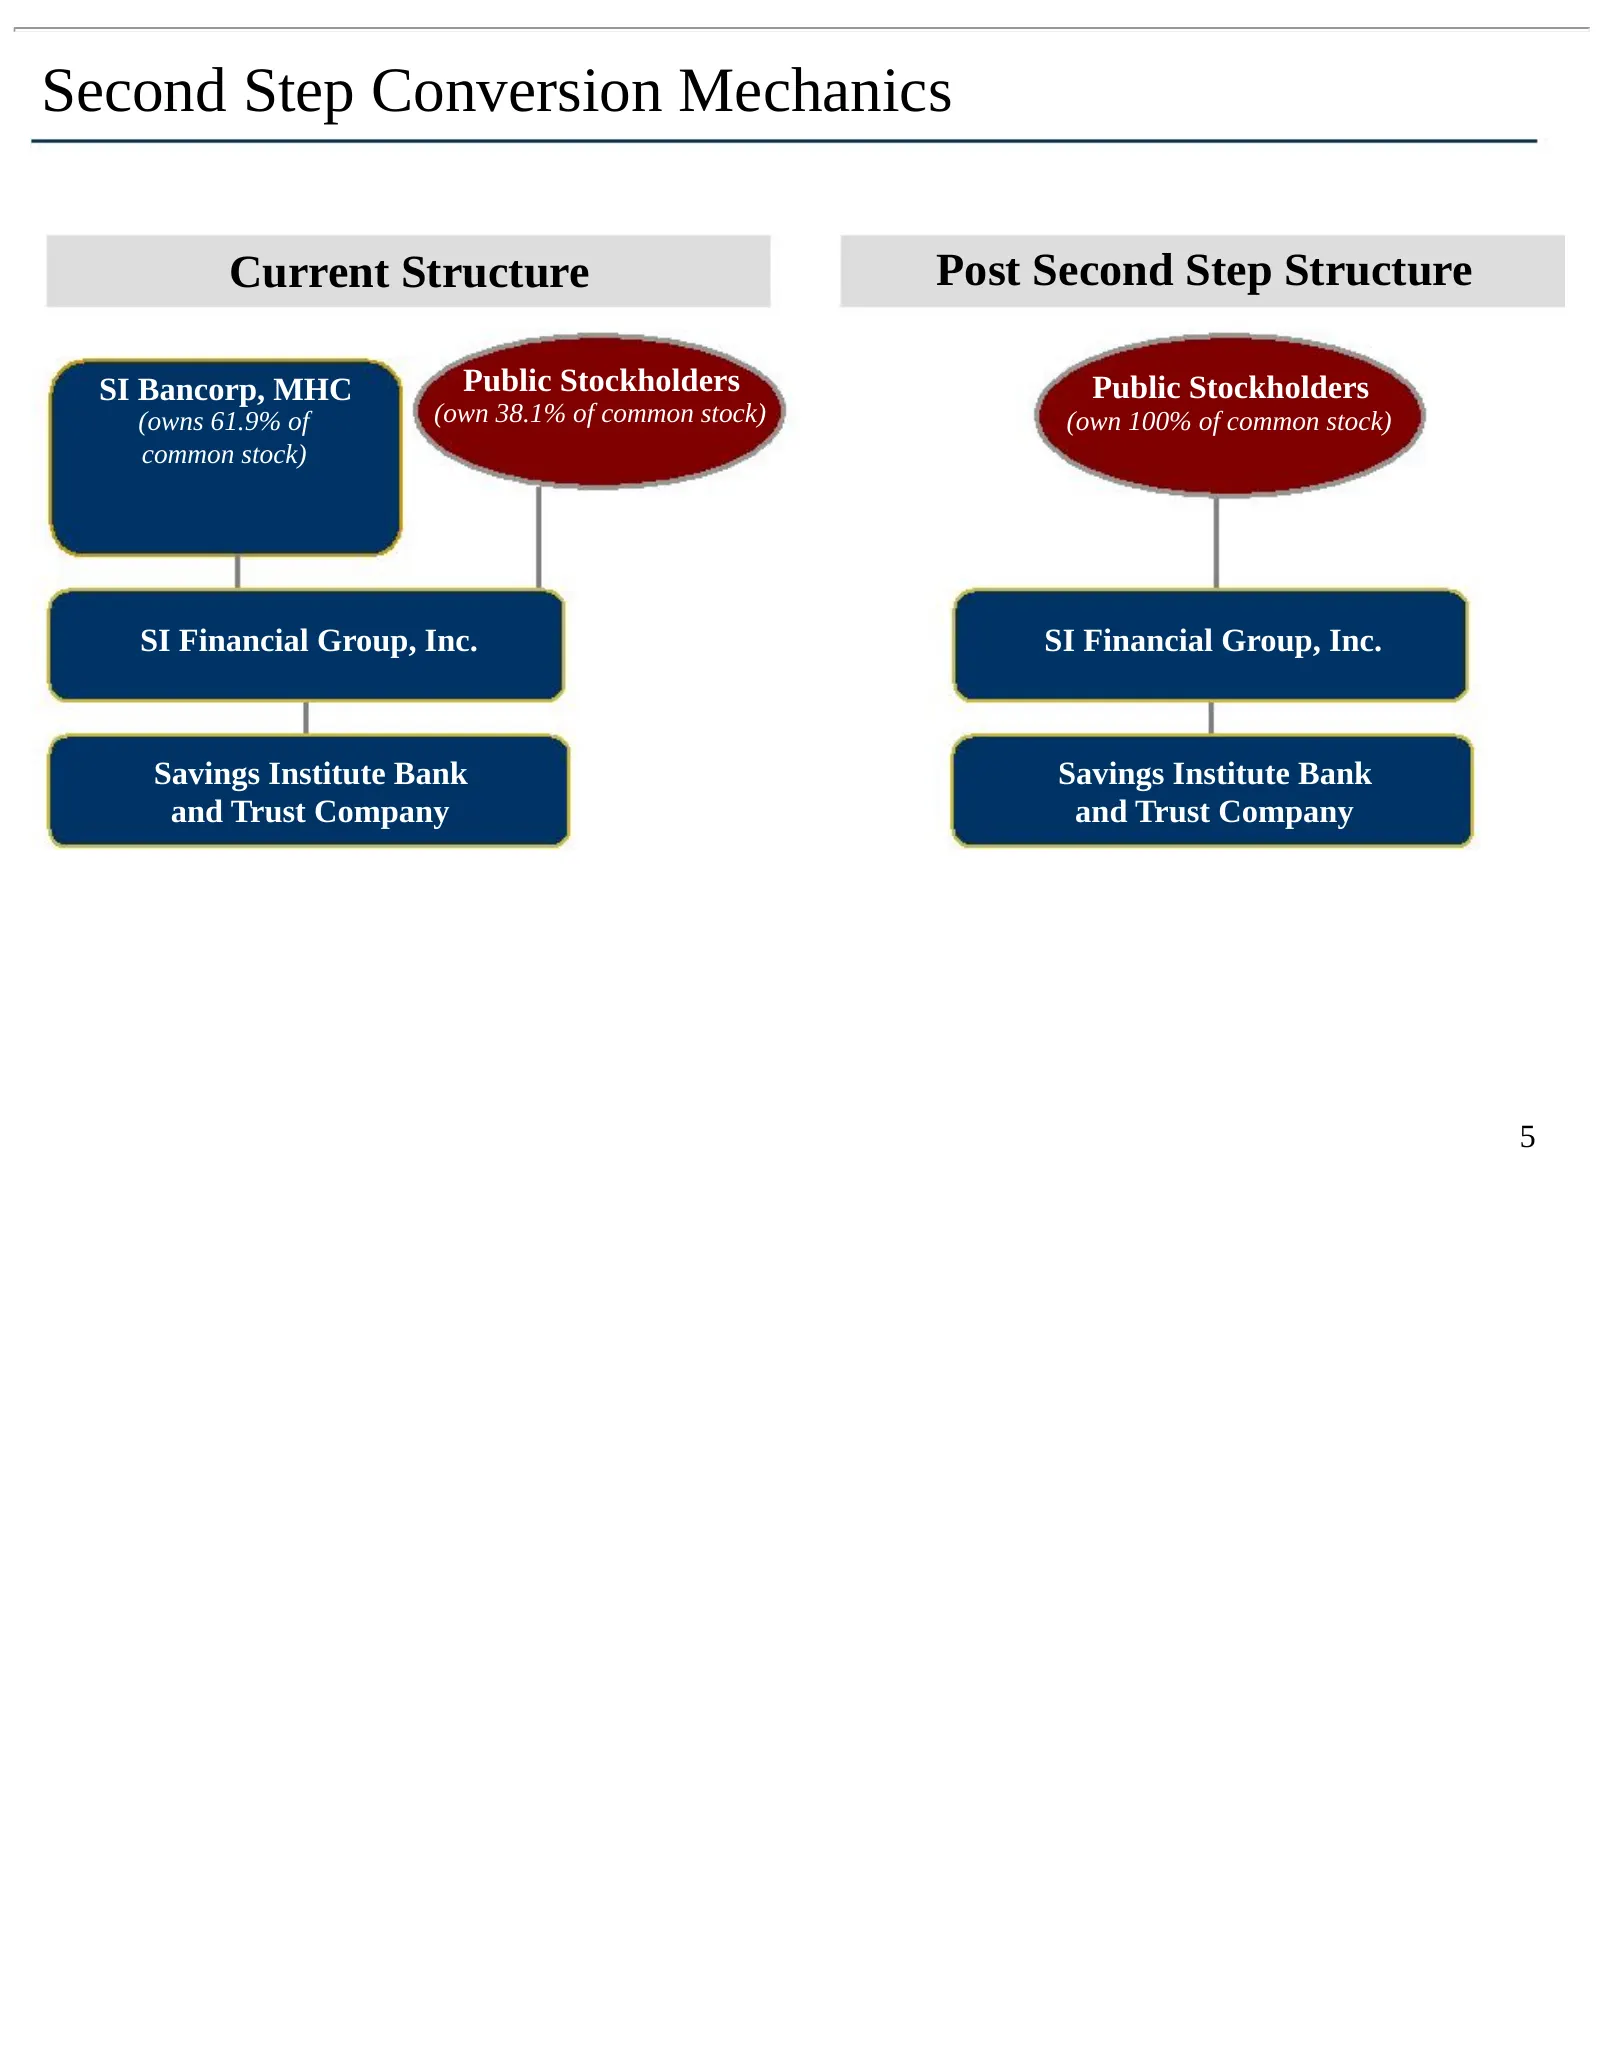
Slide 5: Second Step Conversion Mechanics
Second Step Conversion Mechanics Current Structure Post Second Step Structure SI Bancorp, MHC Public Stockholders Public Stockholders (owns 61.9% of (own 38.1% of common stock) (own 100% of common stock) common stock) SI Financial Group, Inc. SI Financial Group, Inc. Savings Institute Bank Savings I
Slide 6: Company Overview
Company Overview
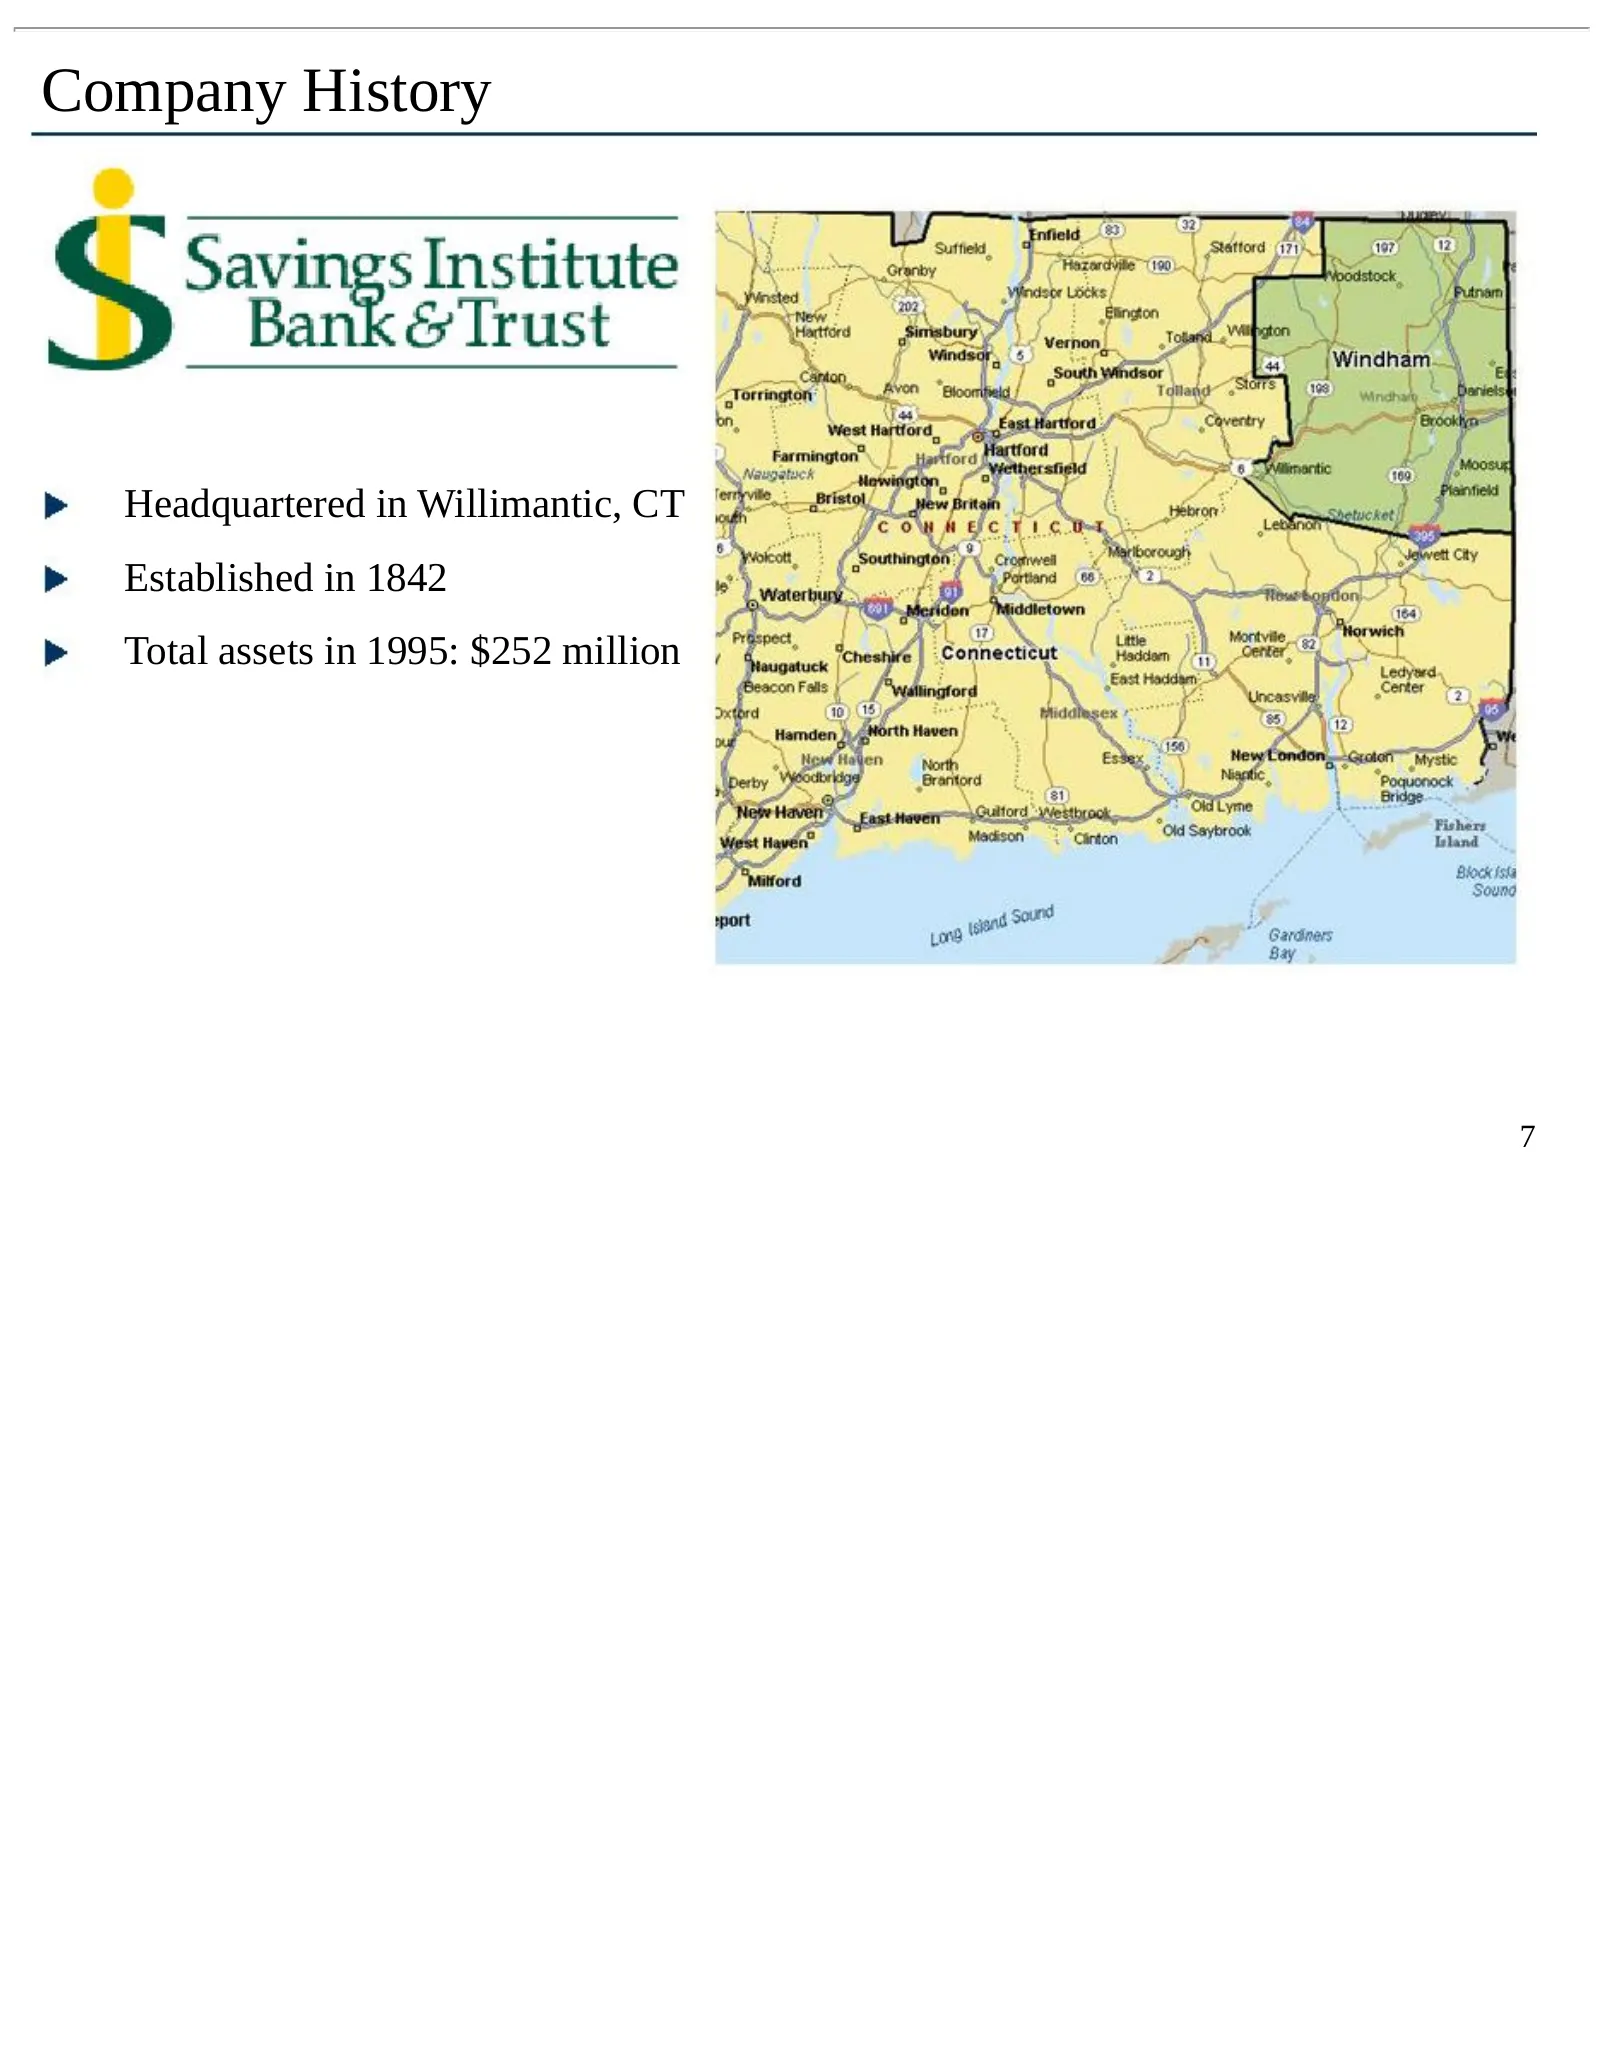
Slide 7: Company History
Company History Headquartered in Willimantic, CT Established in 1842 Total assets in 1995: $252 million 7
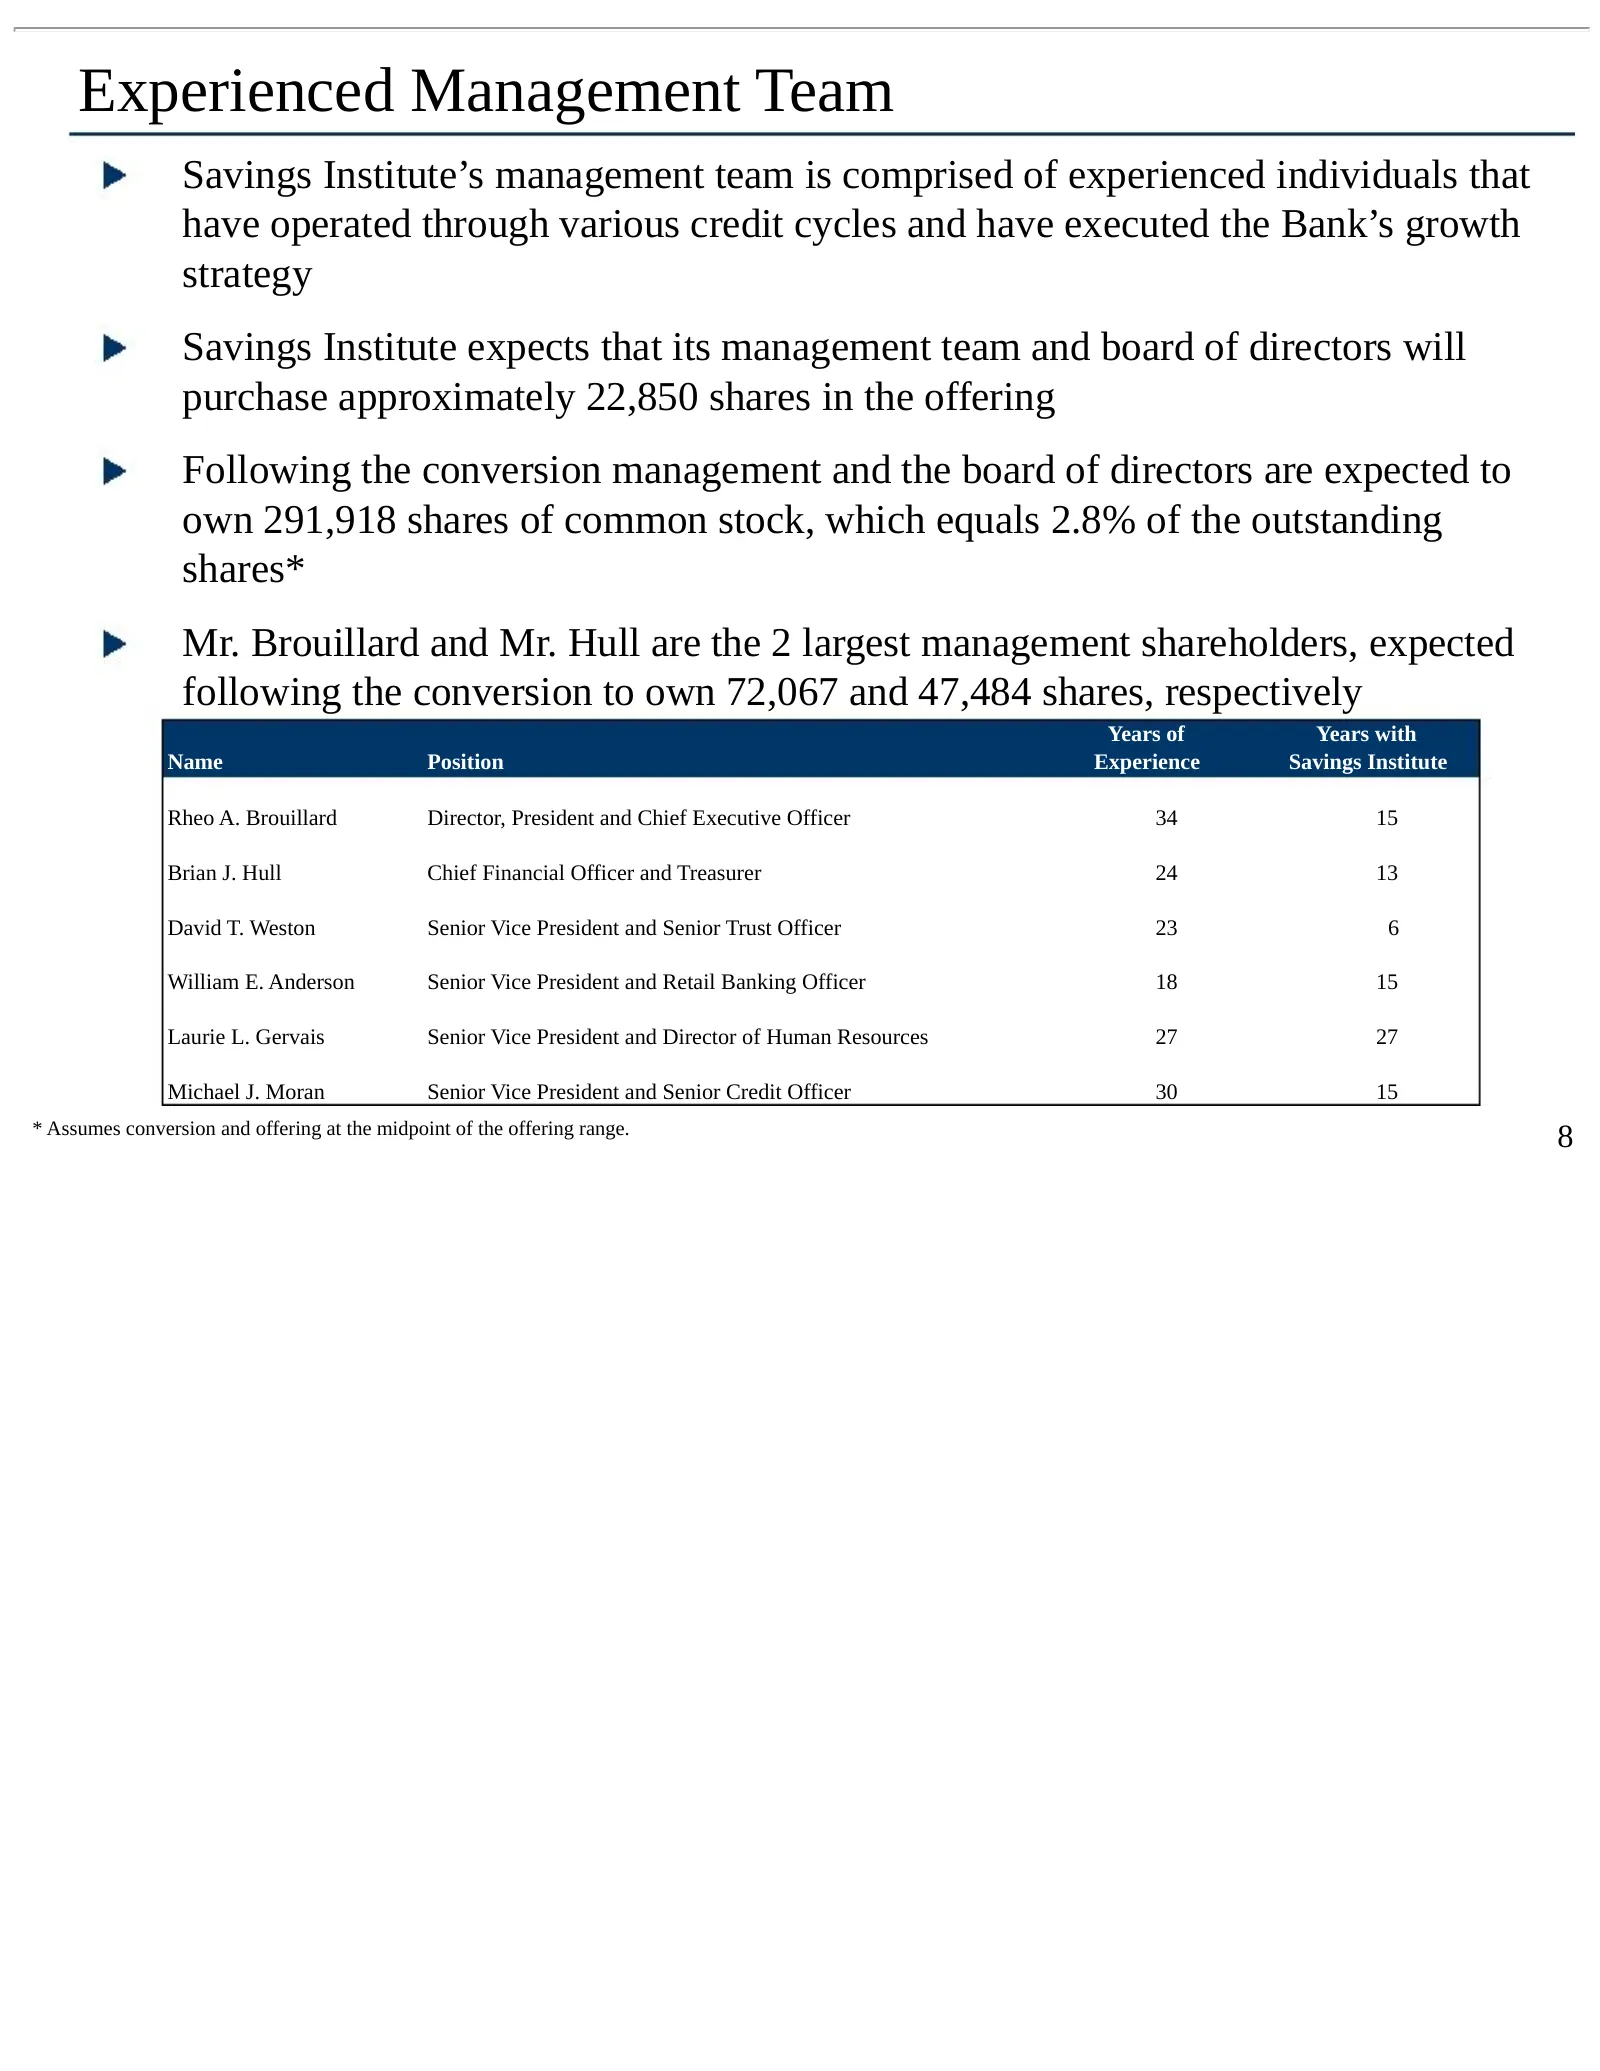
Slide 8: Experienced Management Team
Experienced Management Team Savings Institute’s management team is comprised of experienced individuals that have operated through various credit cycles and have executed the Bank’s growth strategy Savings Institute expects that its management team and board of directors will purchase approximately
Slide 9: Company Profile
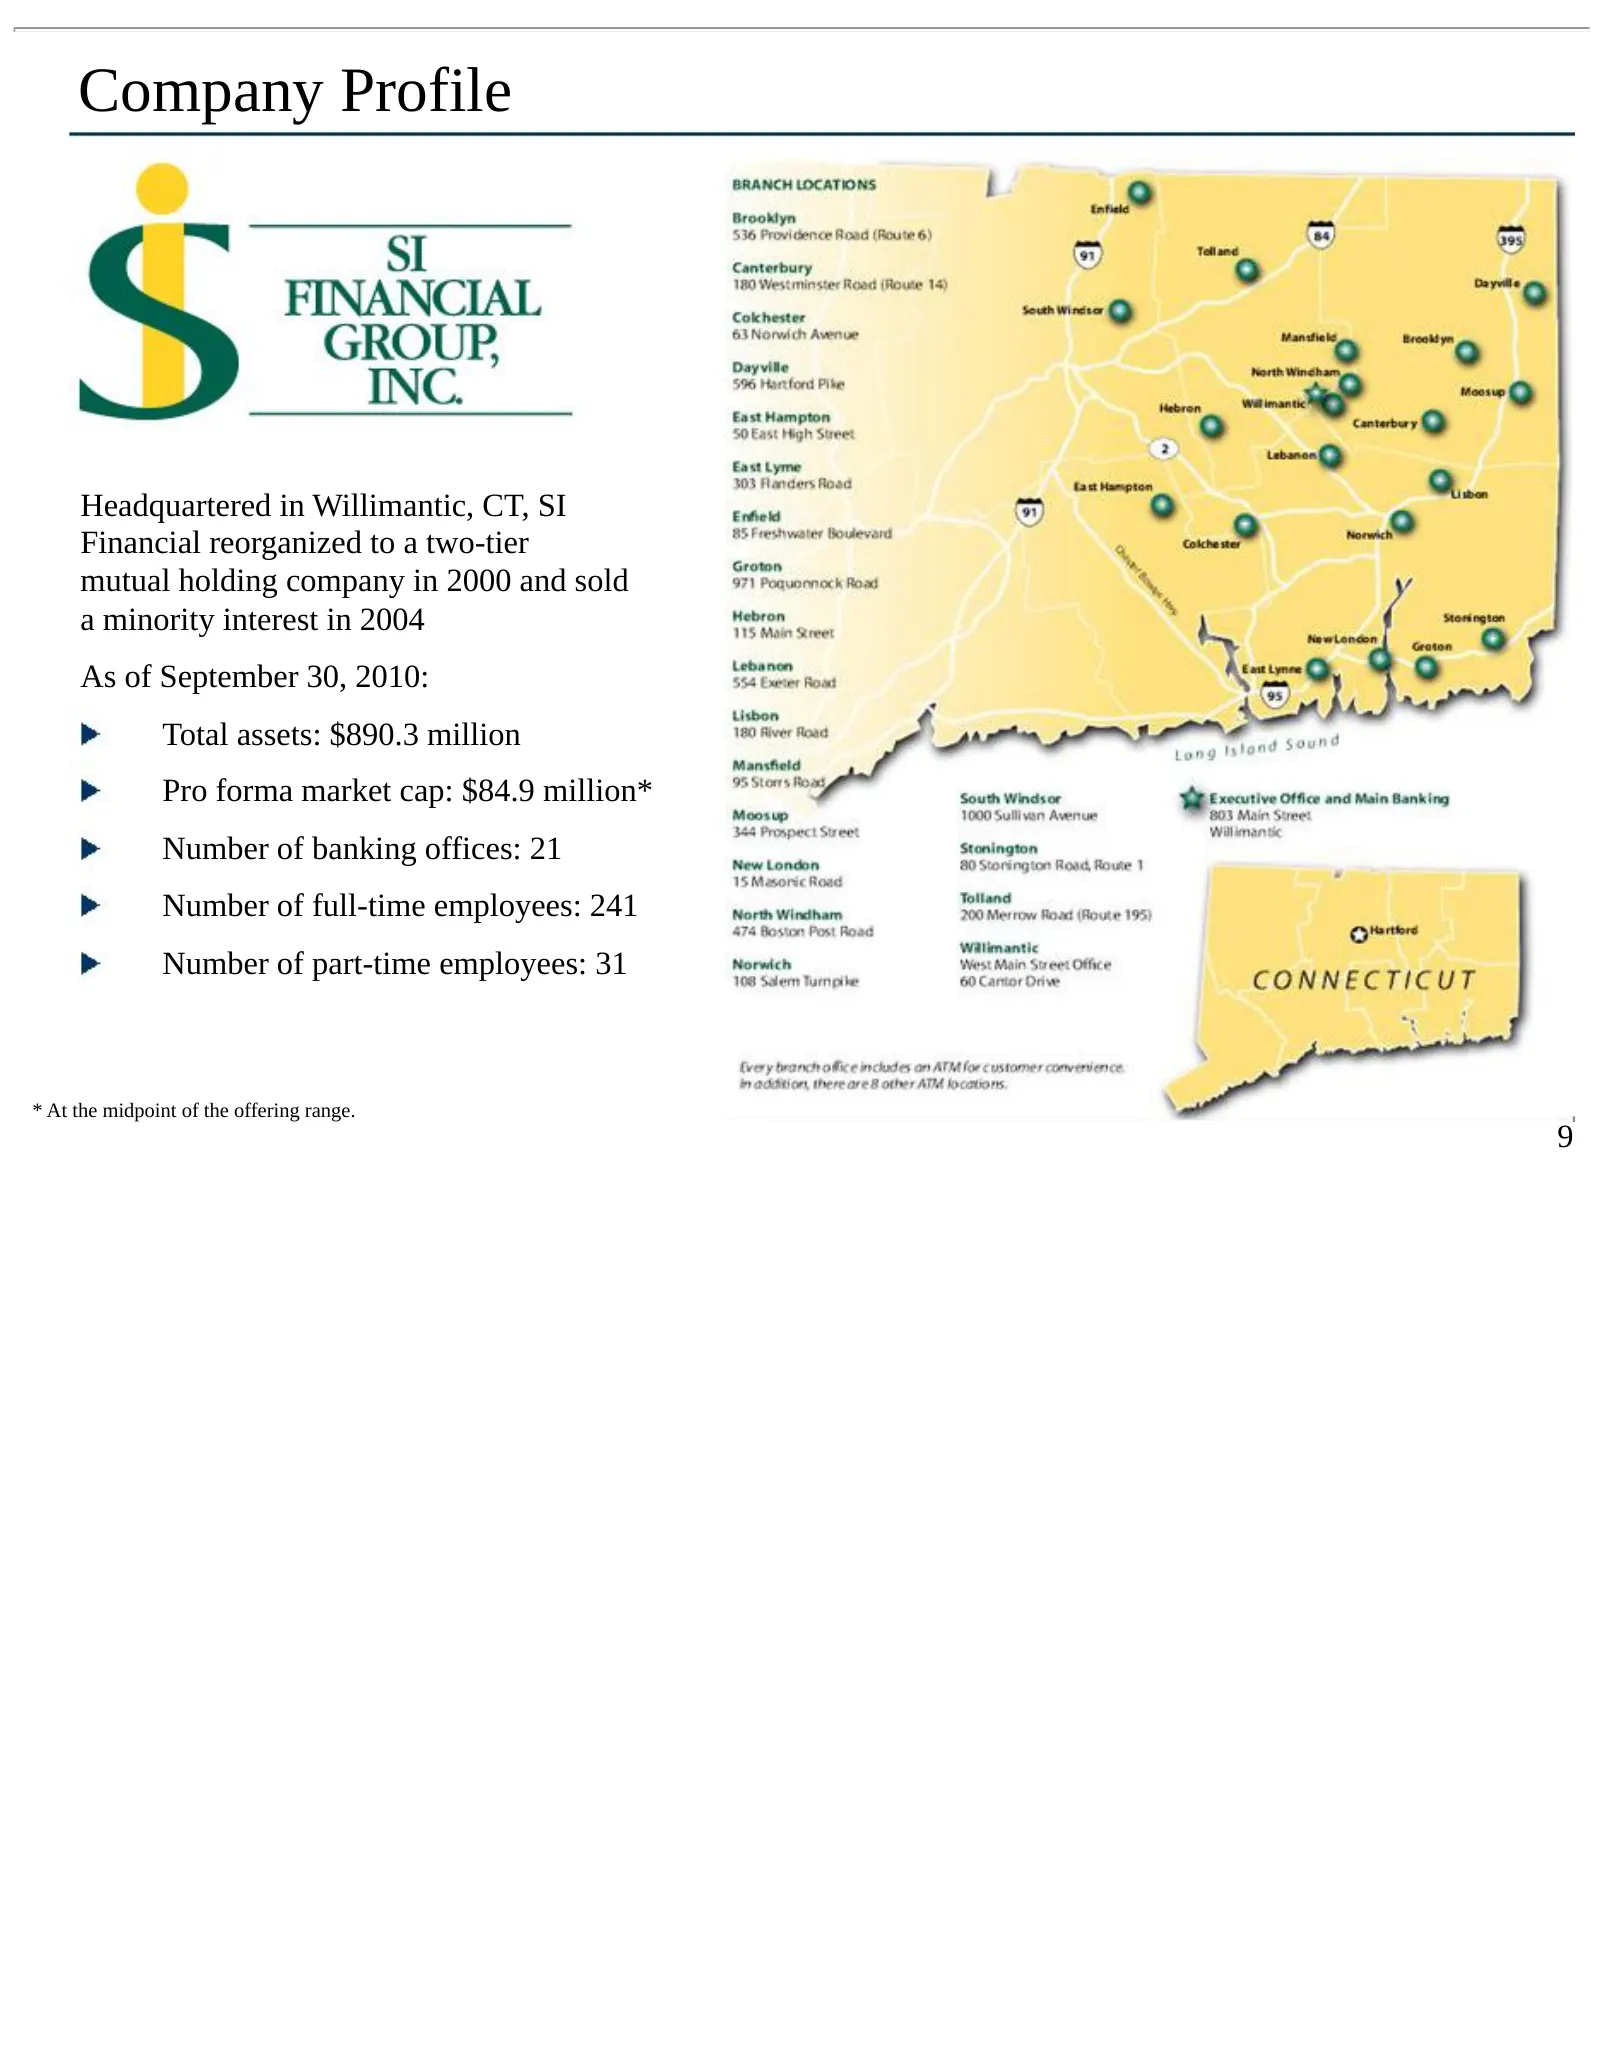
Company Profile Headquartered in Willimantic, CT, SI Financial reorganized to a two-tier mutual holding company in 2000 and sold a minority interest in 2004 As of September 30, 2010: Total assets: $890.3 million Pro forma market cap: $84.9 million* Number of banking offices: 21 Number of full-time e
Slide 10: Market Area Overview
Market Area Overview Savings Institute operates 21 full-service community banking locations in Windham, New London, Tolland, Hartford and Middlesex counties in Connecticut 30 miles east of Hartford, Connecticut Diverse economy primarily oriented to the educational, service, entertainment, manufactur
Slide 11: Market Area Presence
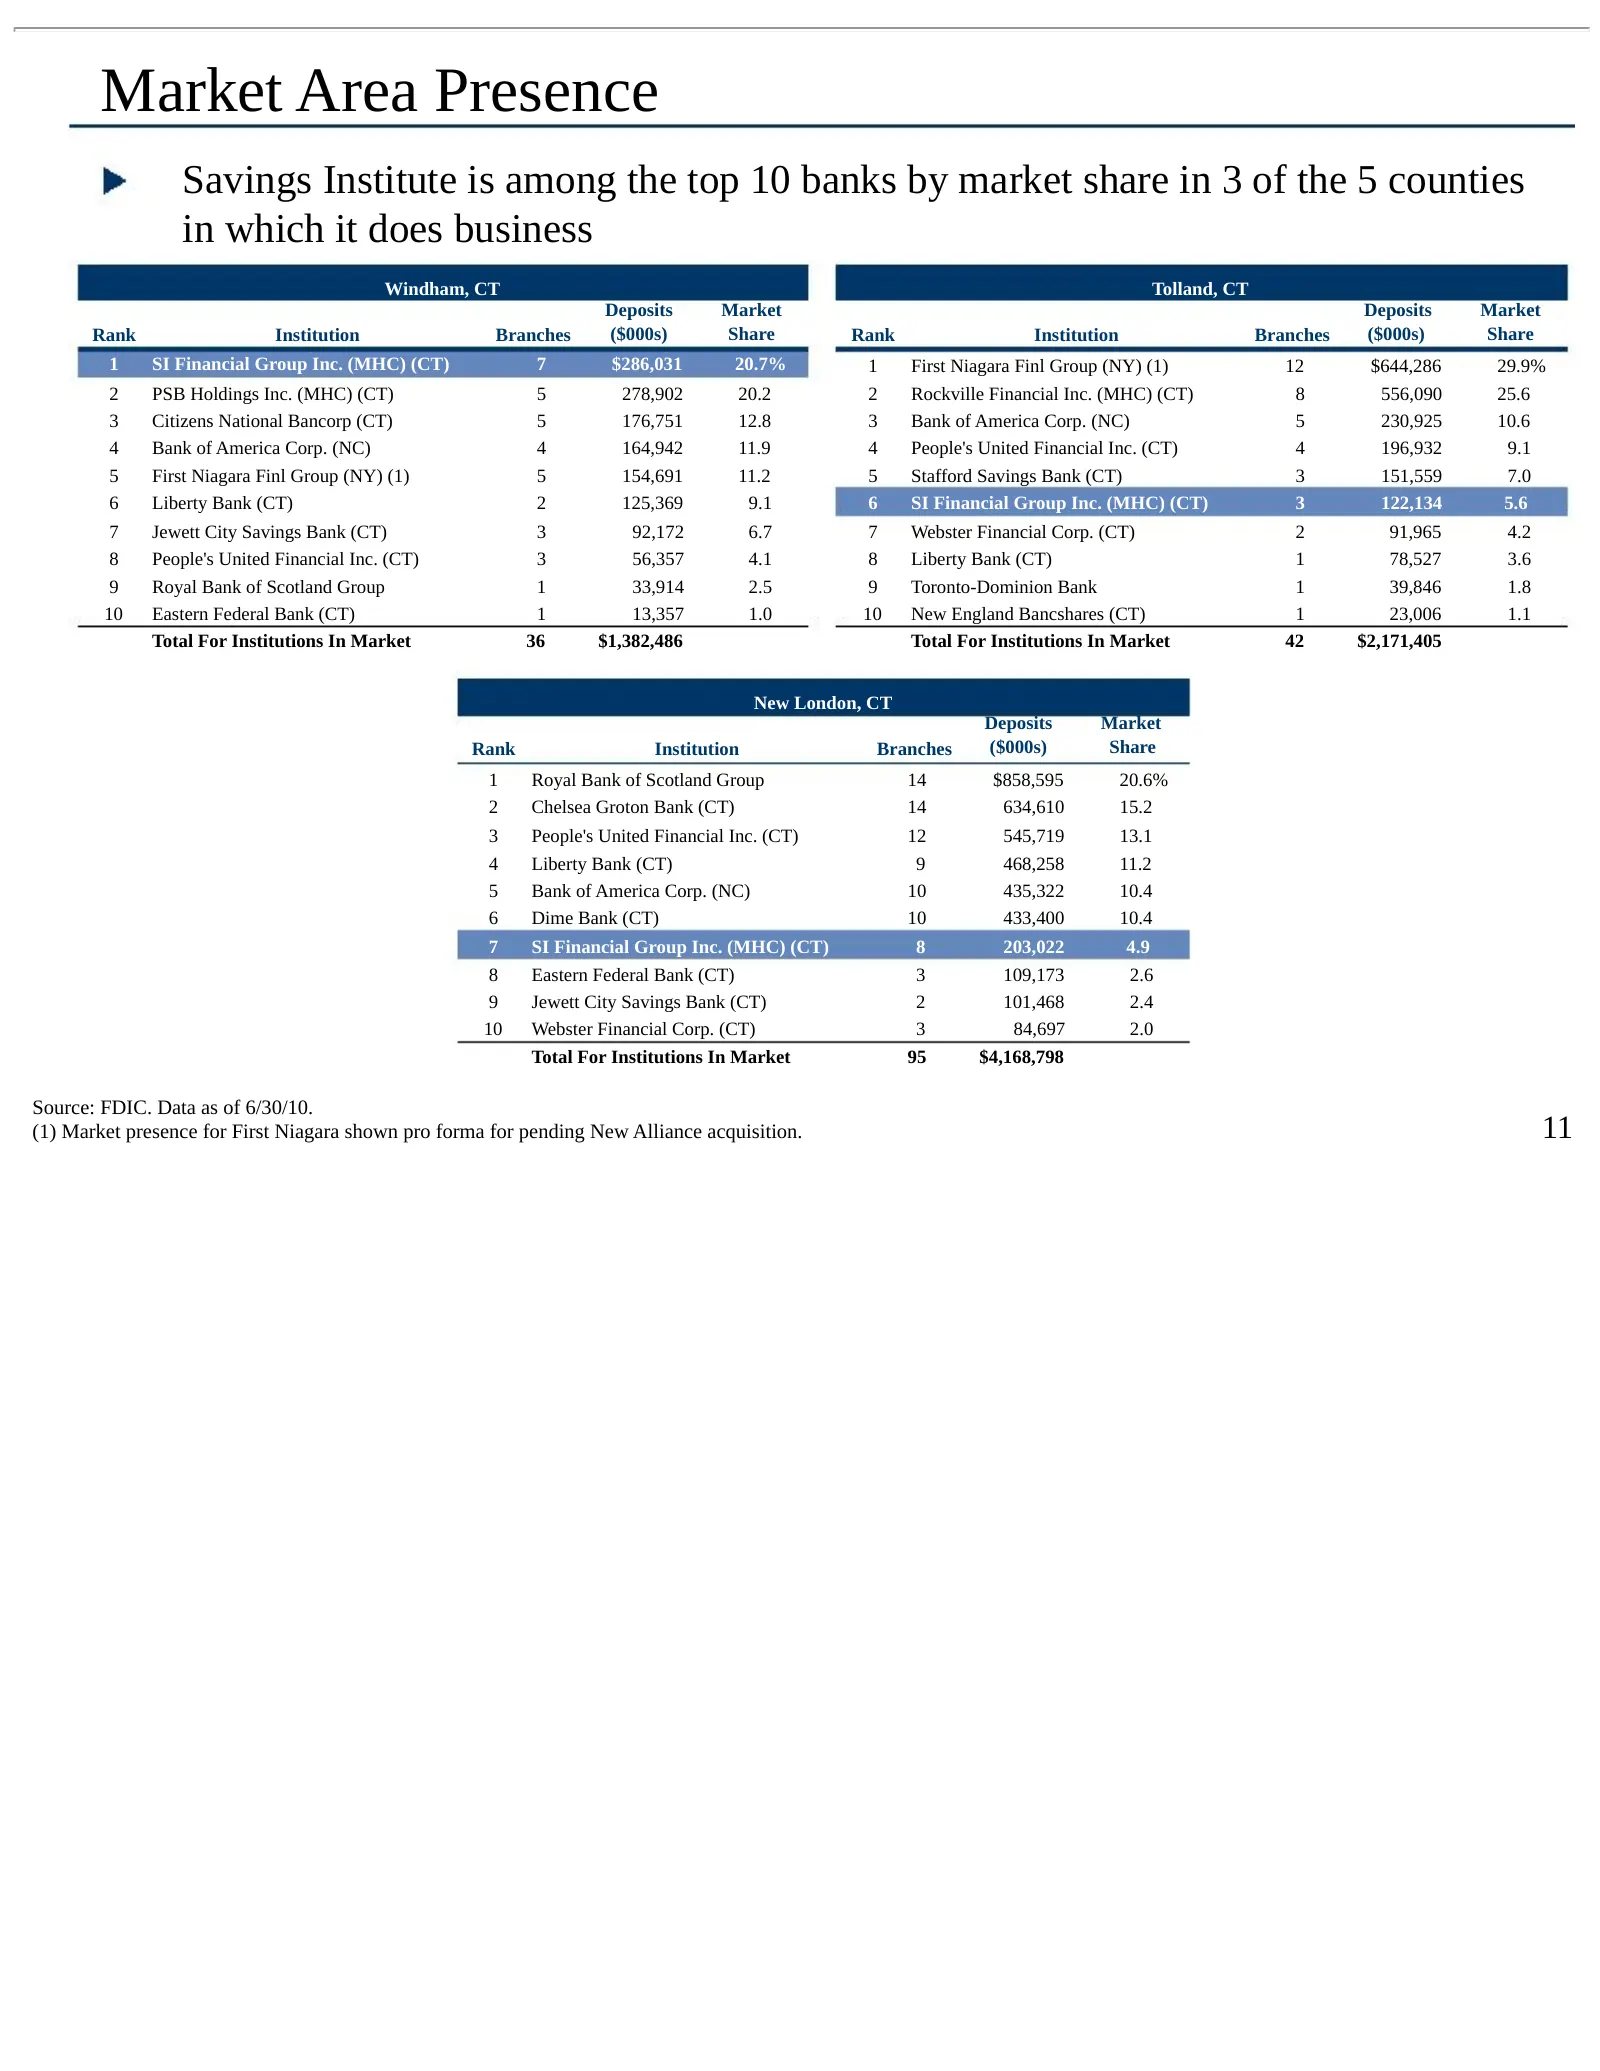
Market Area Presence Savings Institute is among the top 10 banks by market share in 3 of the 5 counties in which it does business Windham, CT Tolland, CT Deposits Market Deposits Market Rank Institution Branches ($000s) Share Rank Institution Branches ($000s) Share 1 SI Financial Group Inc. (MHC) (C
Slide 12: Reasons for the Conversion – Why Now?
Reasons for the Conversion – Why Now? Optimizing future growth opportunities Continue to execute proven business model Consolidation opportunities in current and new markets Support organic growth through community-oriented focus Enhance existing products and services Provide new products and servic
Slide 13: Business Strategy
Business Strategy Continue community oriented focus by offering a full range of financial products and services to its customers Grow through acquisition opportunities in areas in or adjacent to existing market area Actively manage the balance sheet and diversify the asset mix Prudently increase per
Slide 14: Acquisition Opportunities
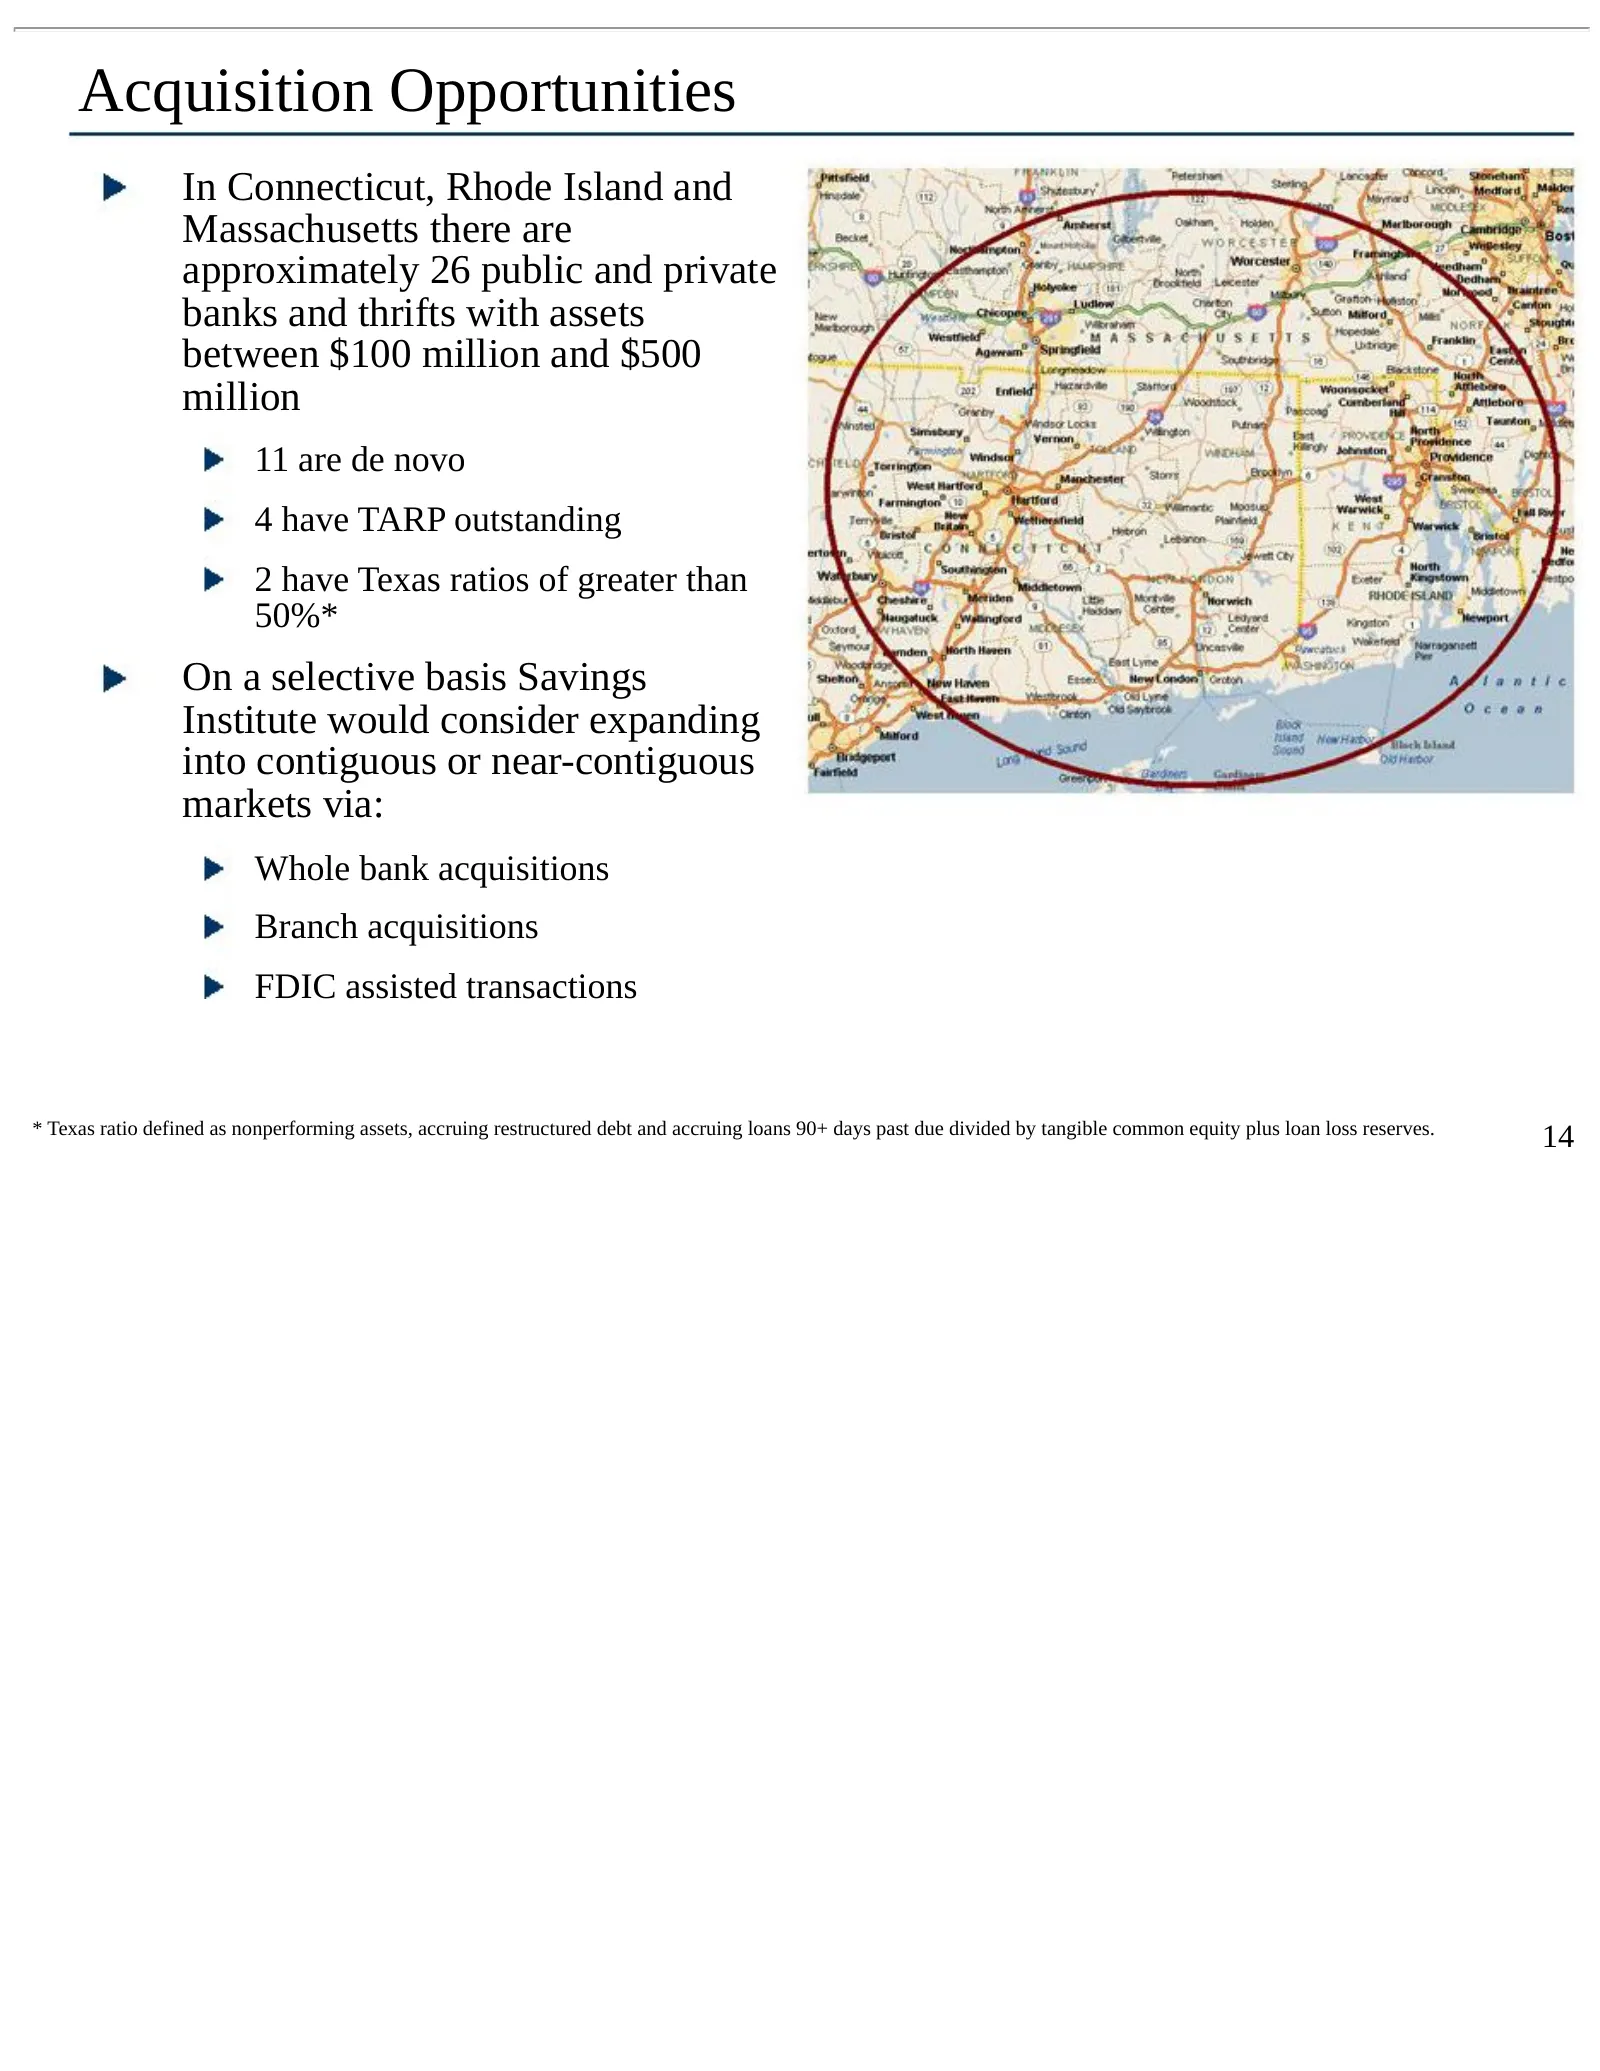
Acquisition Opportunities In Connecticut, Rhode Island and Massachusetts there are approximately 26 public and private banks and thrifts with assets between $100 million and $500 million 11 are de novo 4 have TARP outstanding 2 have Texas ratios of greater than 50%* On a selective basis Savings Inst
Slide 15: Financial Highlights
© SI FINANCIAL GROUP, INC. Financial Highlights
Slide 16: Franchise Growth
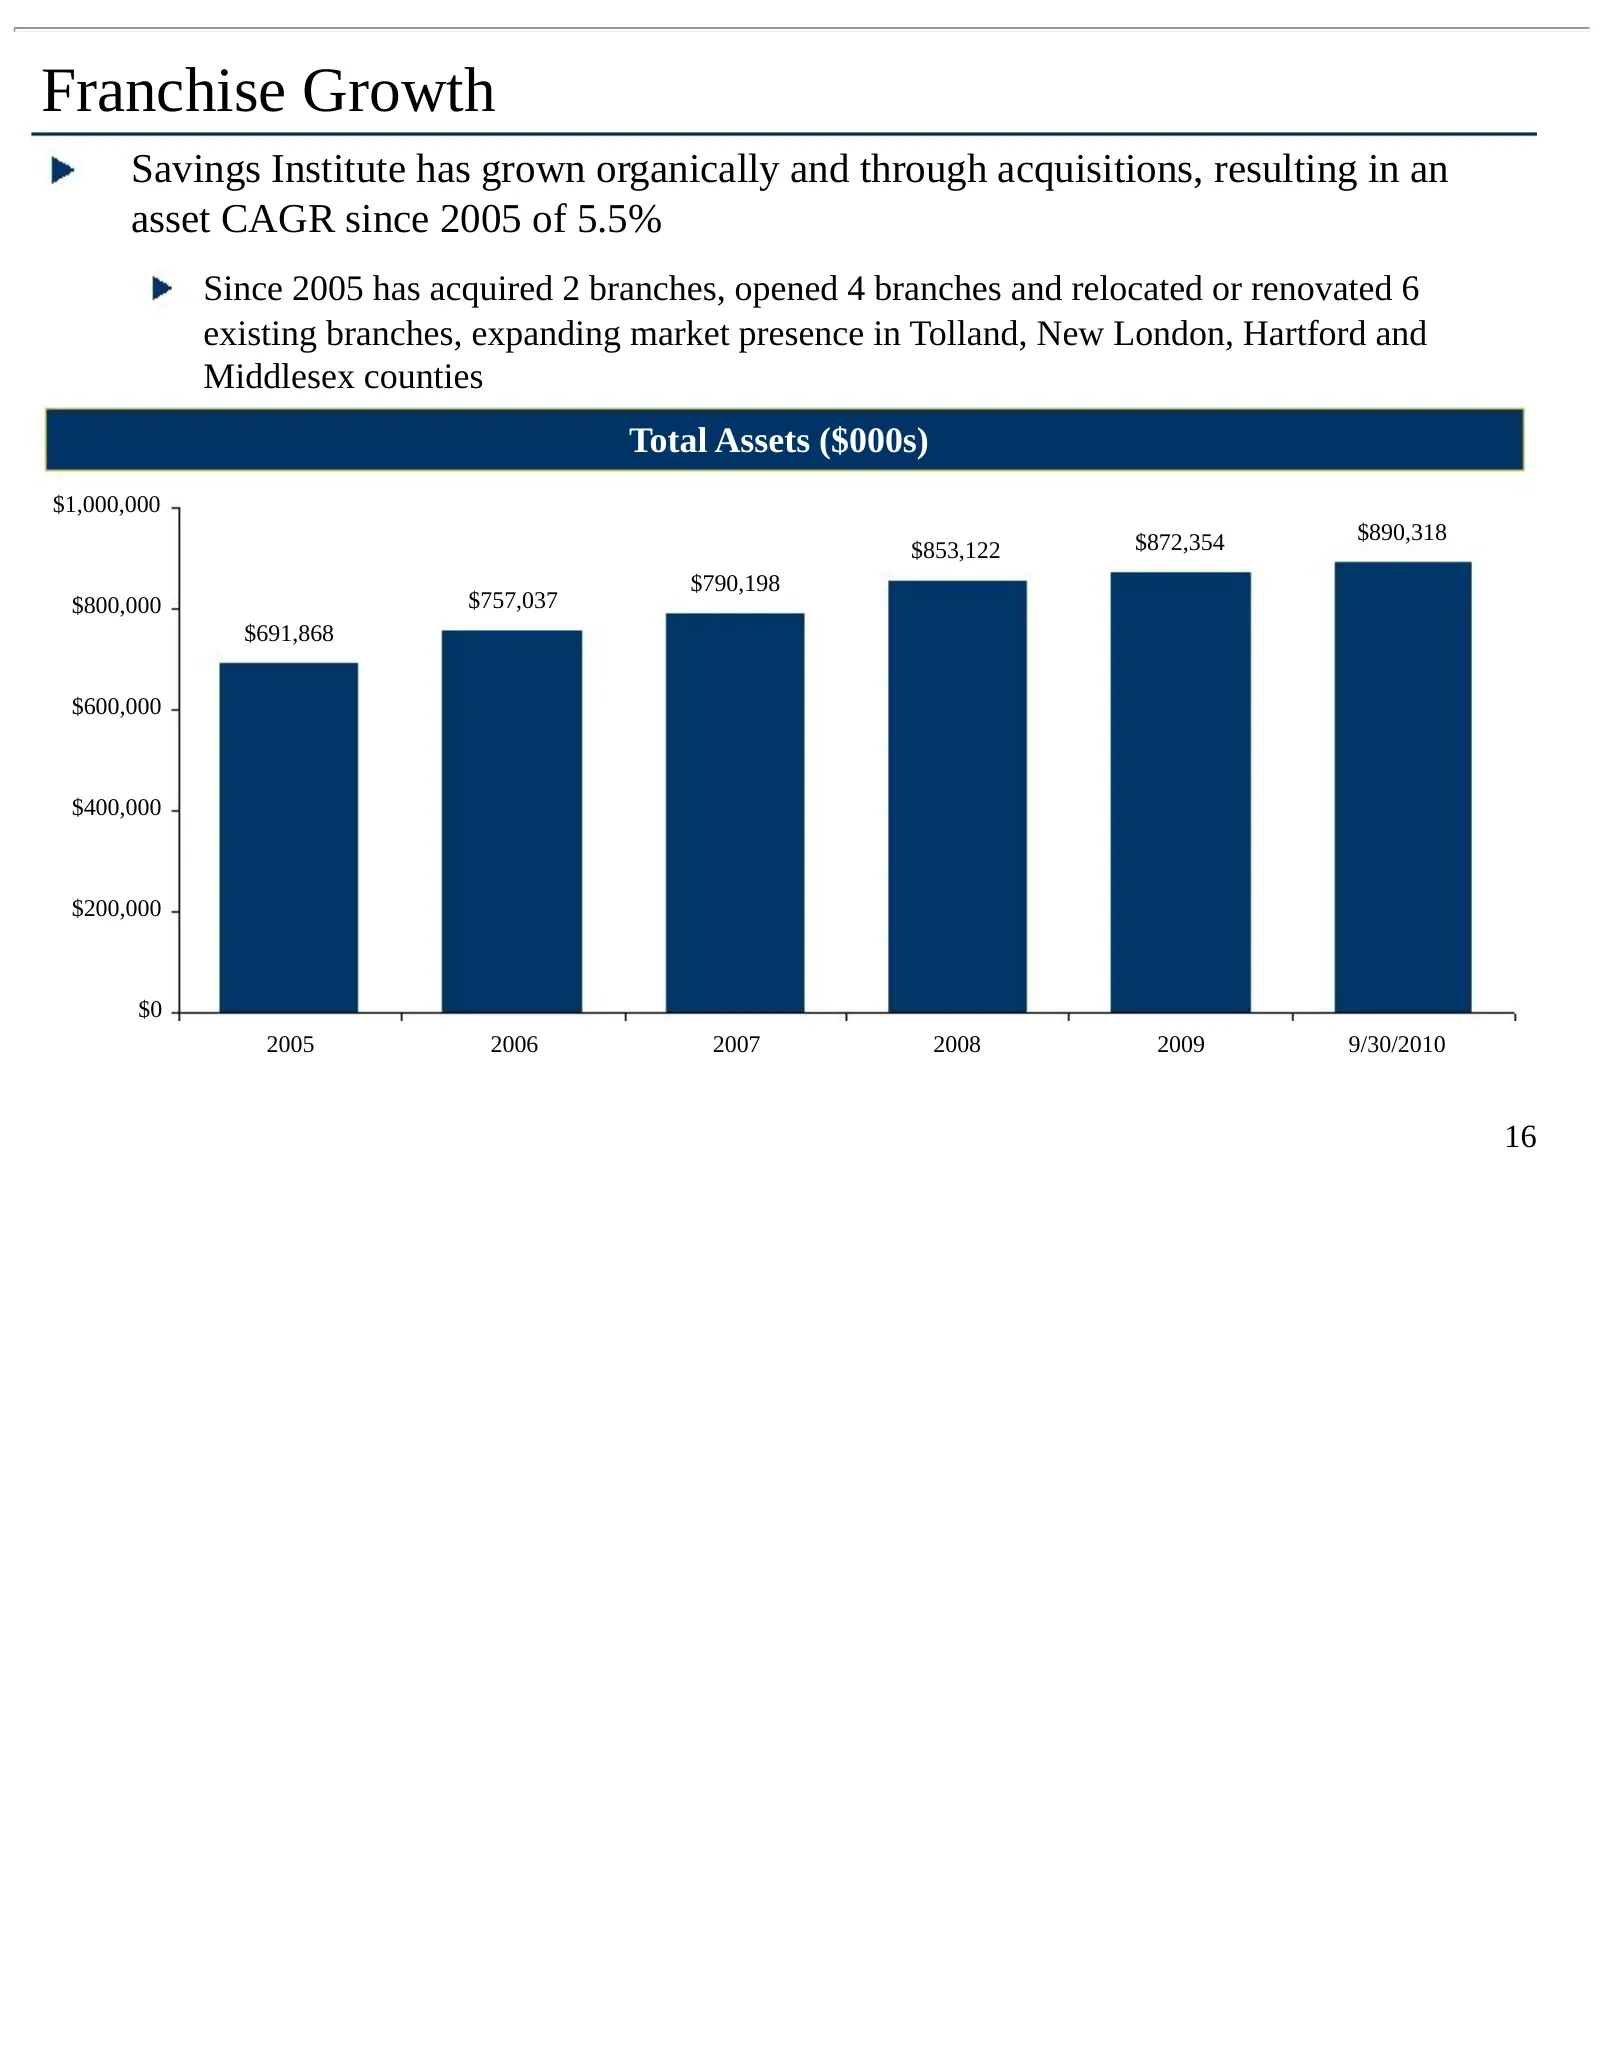
Franchise Growth Savings Institute has grown organically and through acquisitions, resulting in an asset CAGR since 2005 of 5.5% Since 2005 has acquired 2 branches, opened 4 branches and relocated or renovated 6 existing branches, expanding market presence in Tolland, New London, Hartford and Middle
Slide 17: Diversified Loan Portfolio
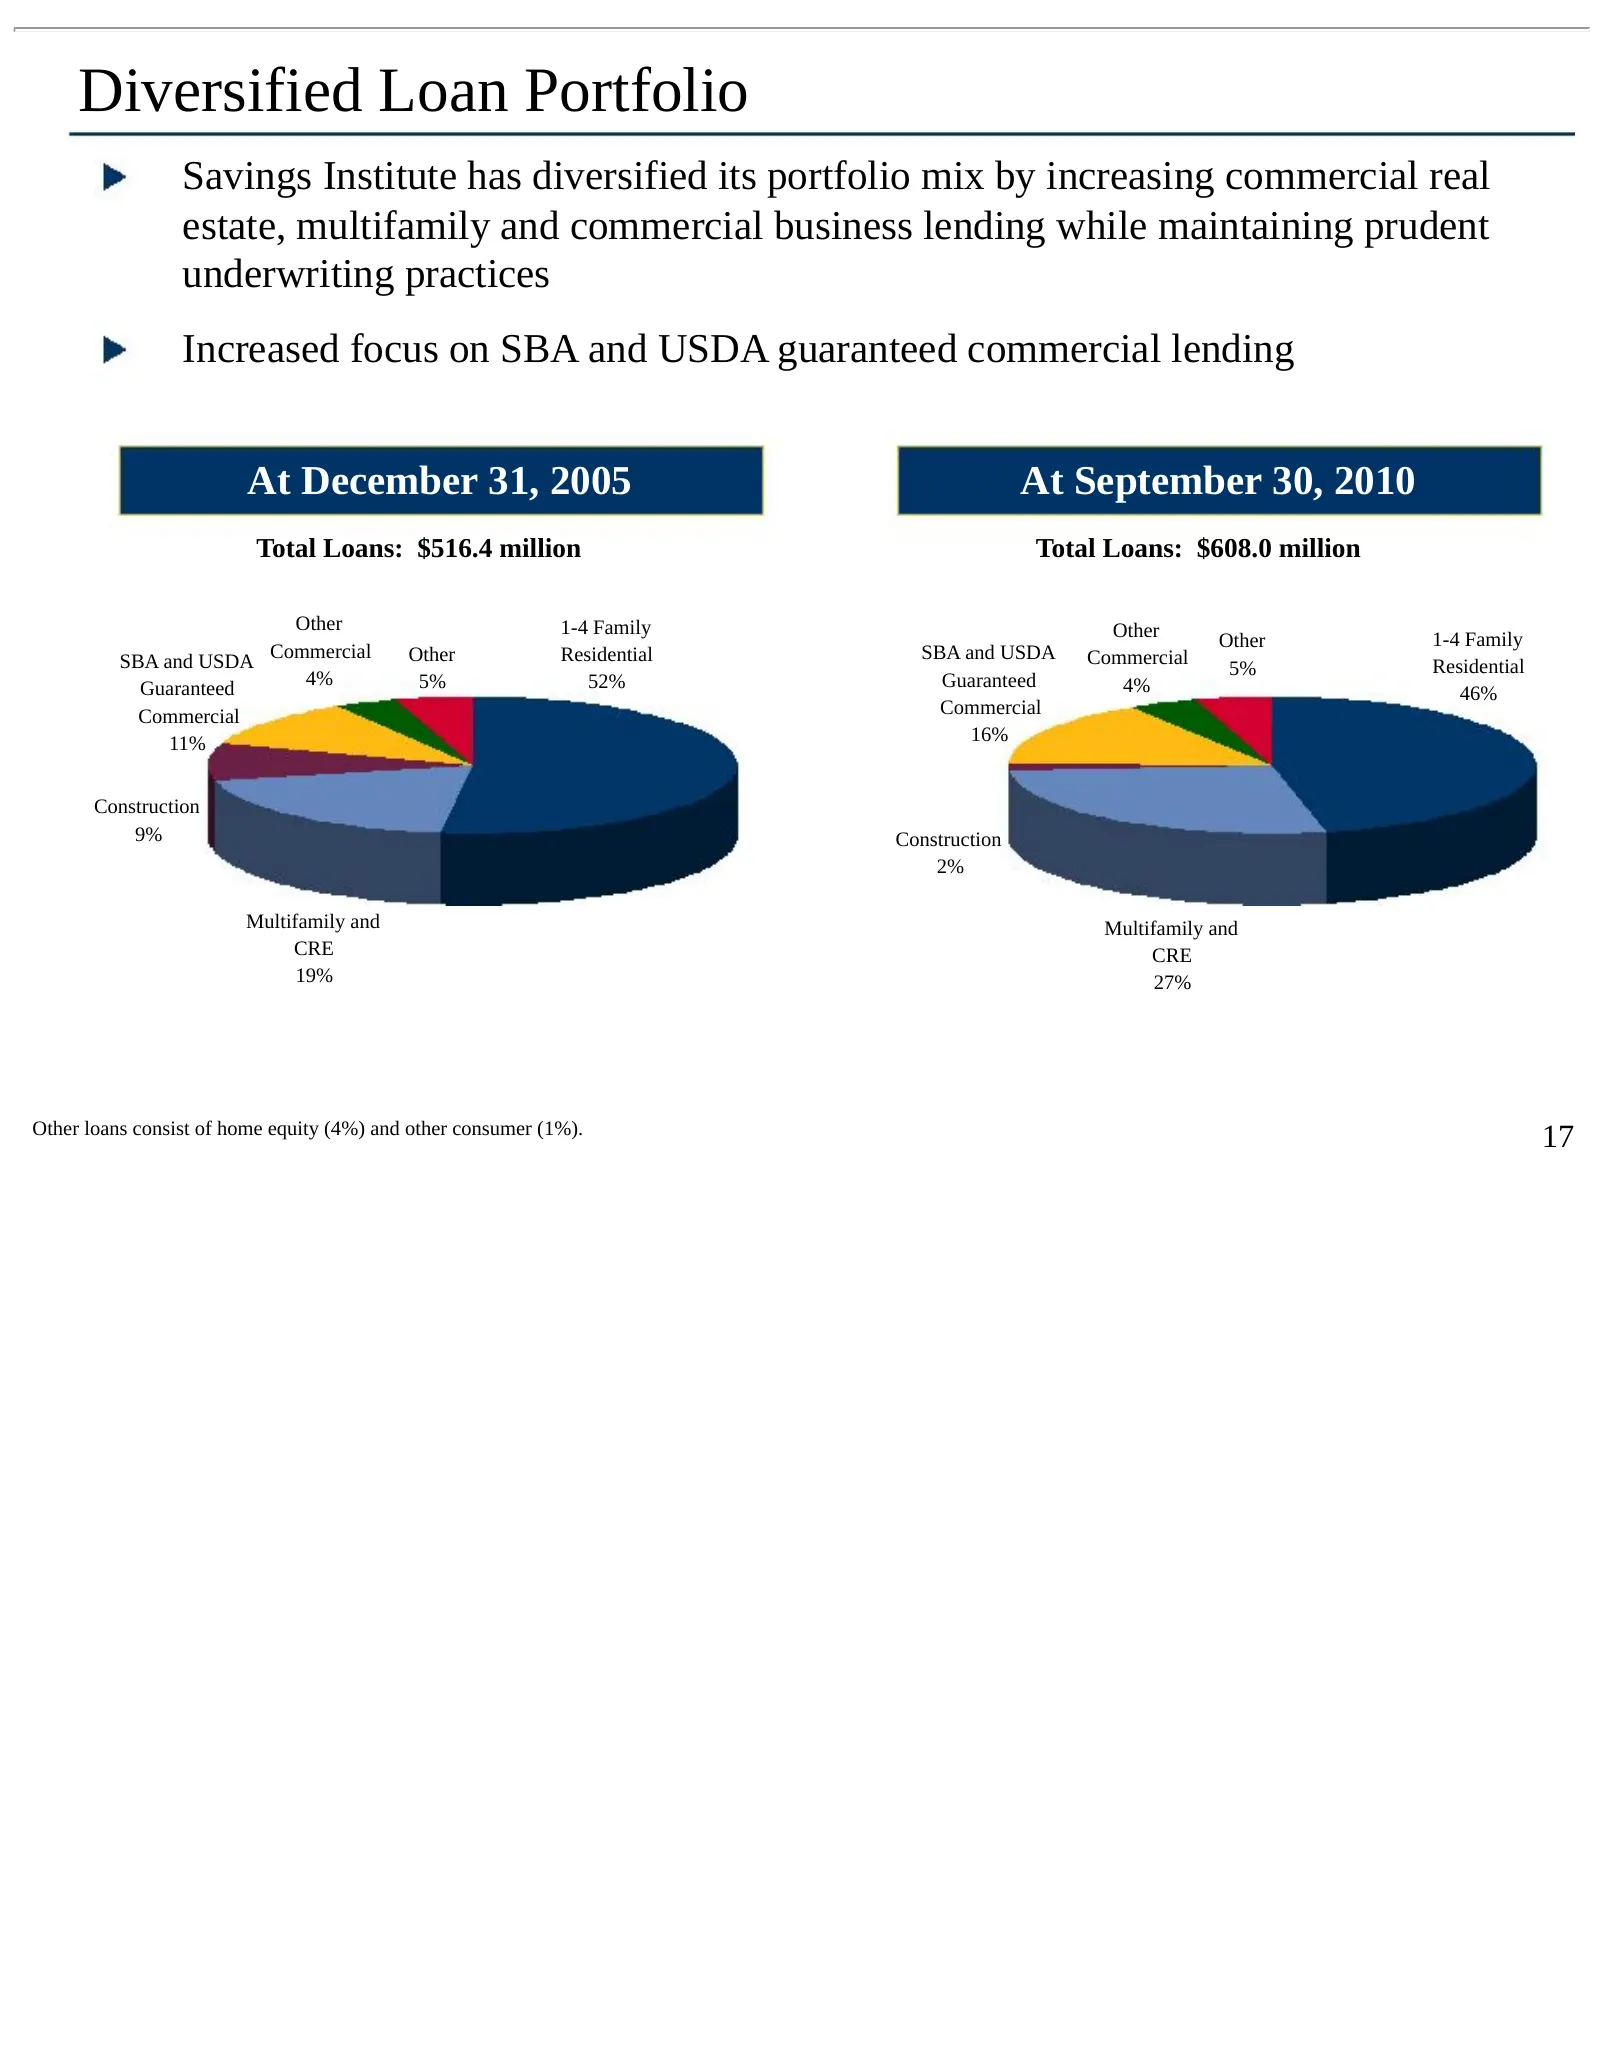
Diversified Loan Portfolio Savings Institute has diversified its portfolio mix by increasing commercial real estate, multifamily and commercial business lending while maintaining prudent underwriting practices Increased focus on SBA and USDA guaranteed commercial lending At December 31, 2005 At Sept
Slide 18: Asset Quality Trends
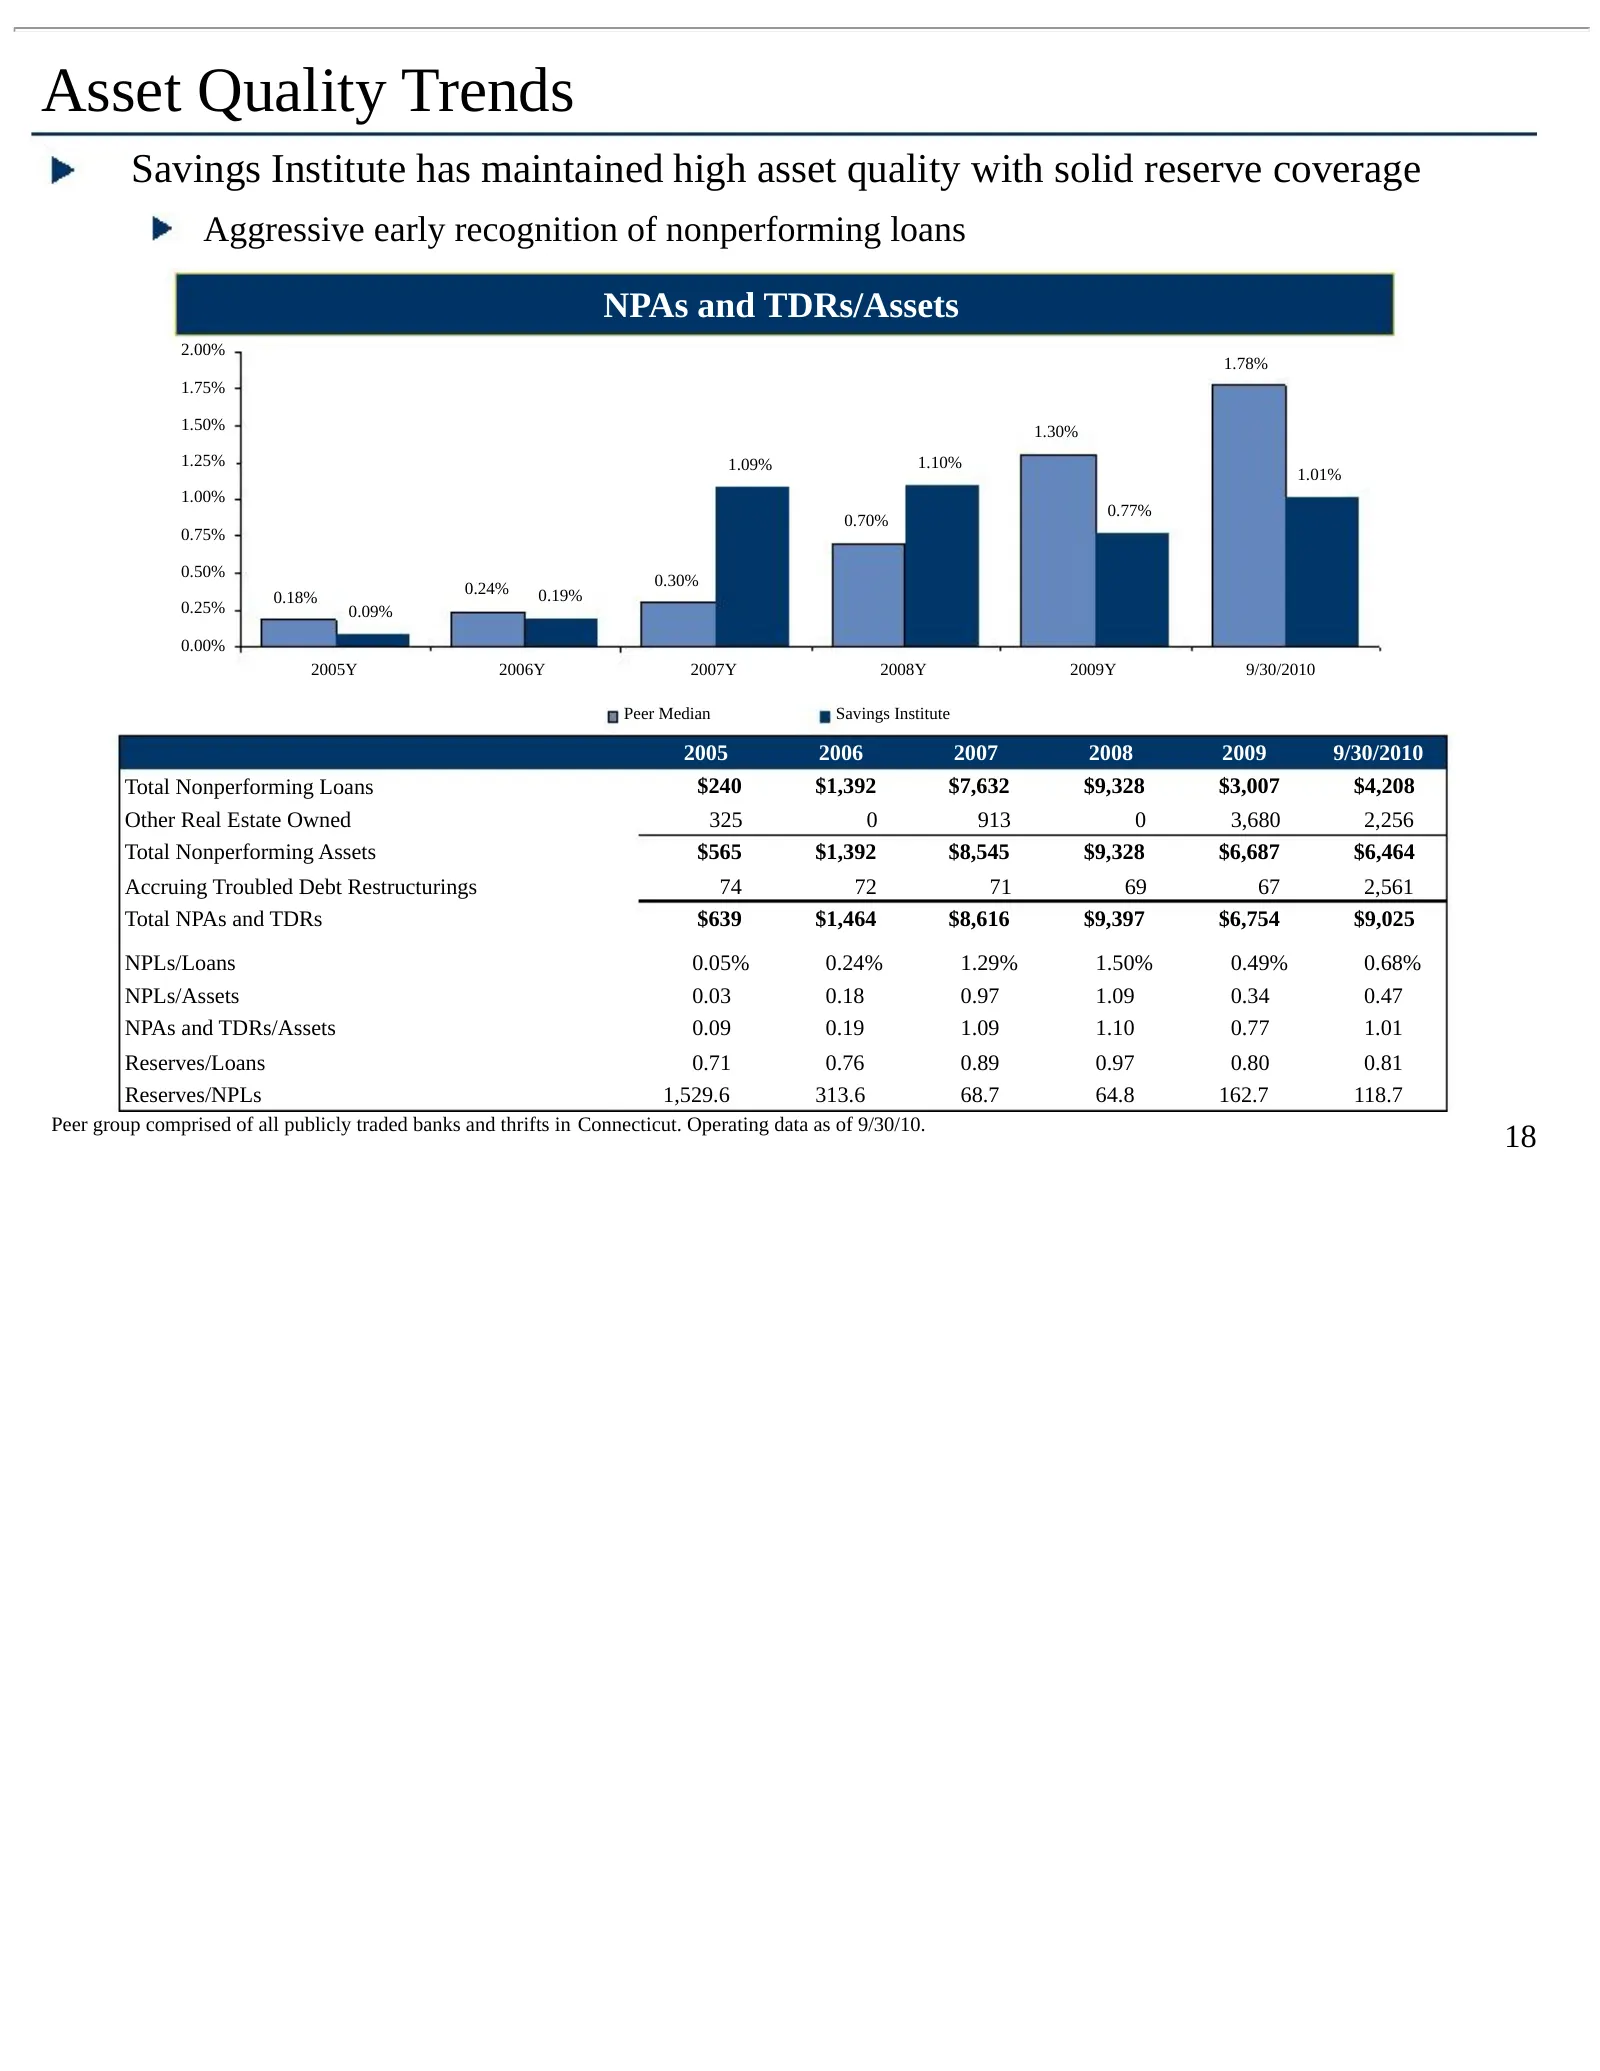
Asset Quality Trends Savings Institute has maintained high asset quality with solid reserve coverage Aggressive early recognition of nonperforming loans NPAs and TDRs/Assets 2.00% 1.78% 1.75% 1.50% 1.30% 1.25% 1.09% 1.10% 1.01% 1.00% 0.77% 0.70% 0.75% 0.50% 0.24% 0.30% 0.18% 0.19% 0.25% 0.09% 0.00%
Slide 19: Securities Portfolio
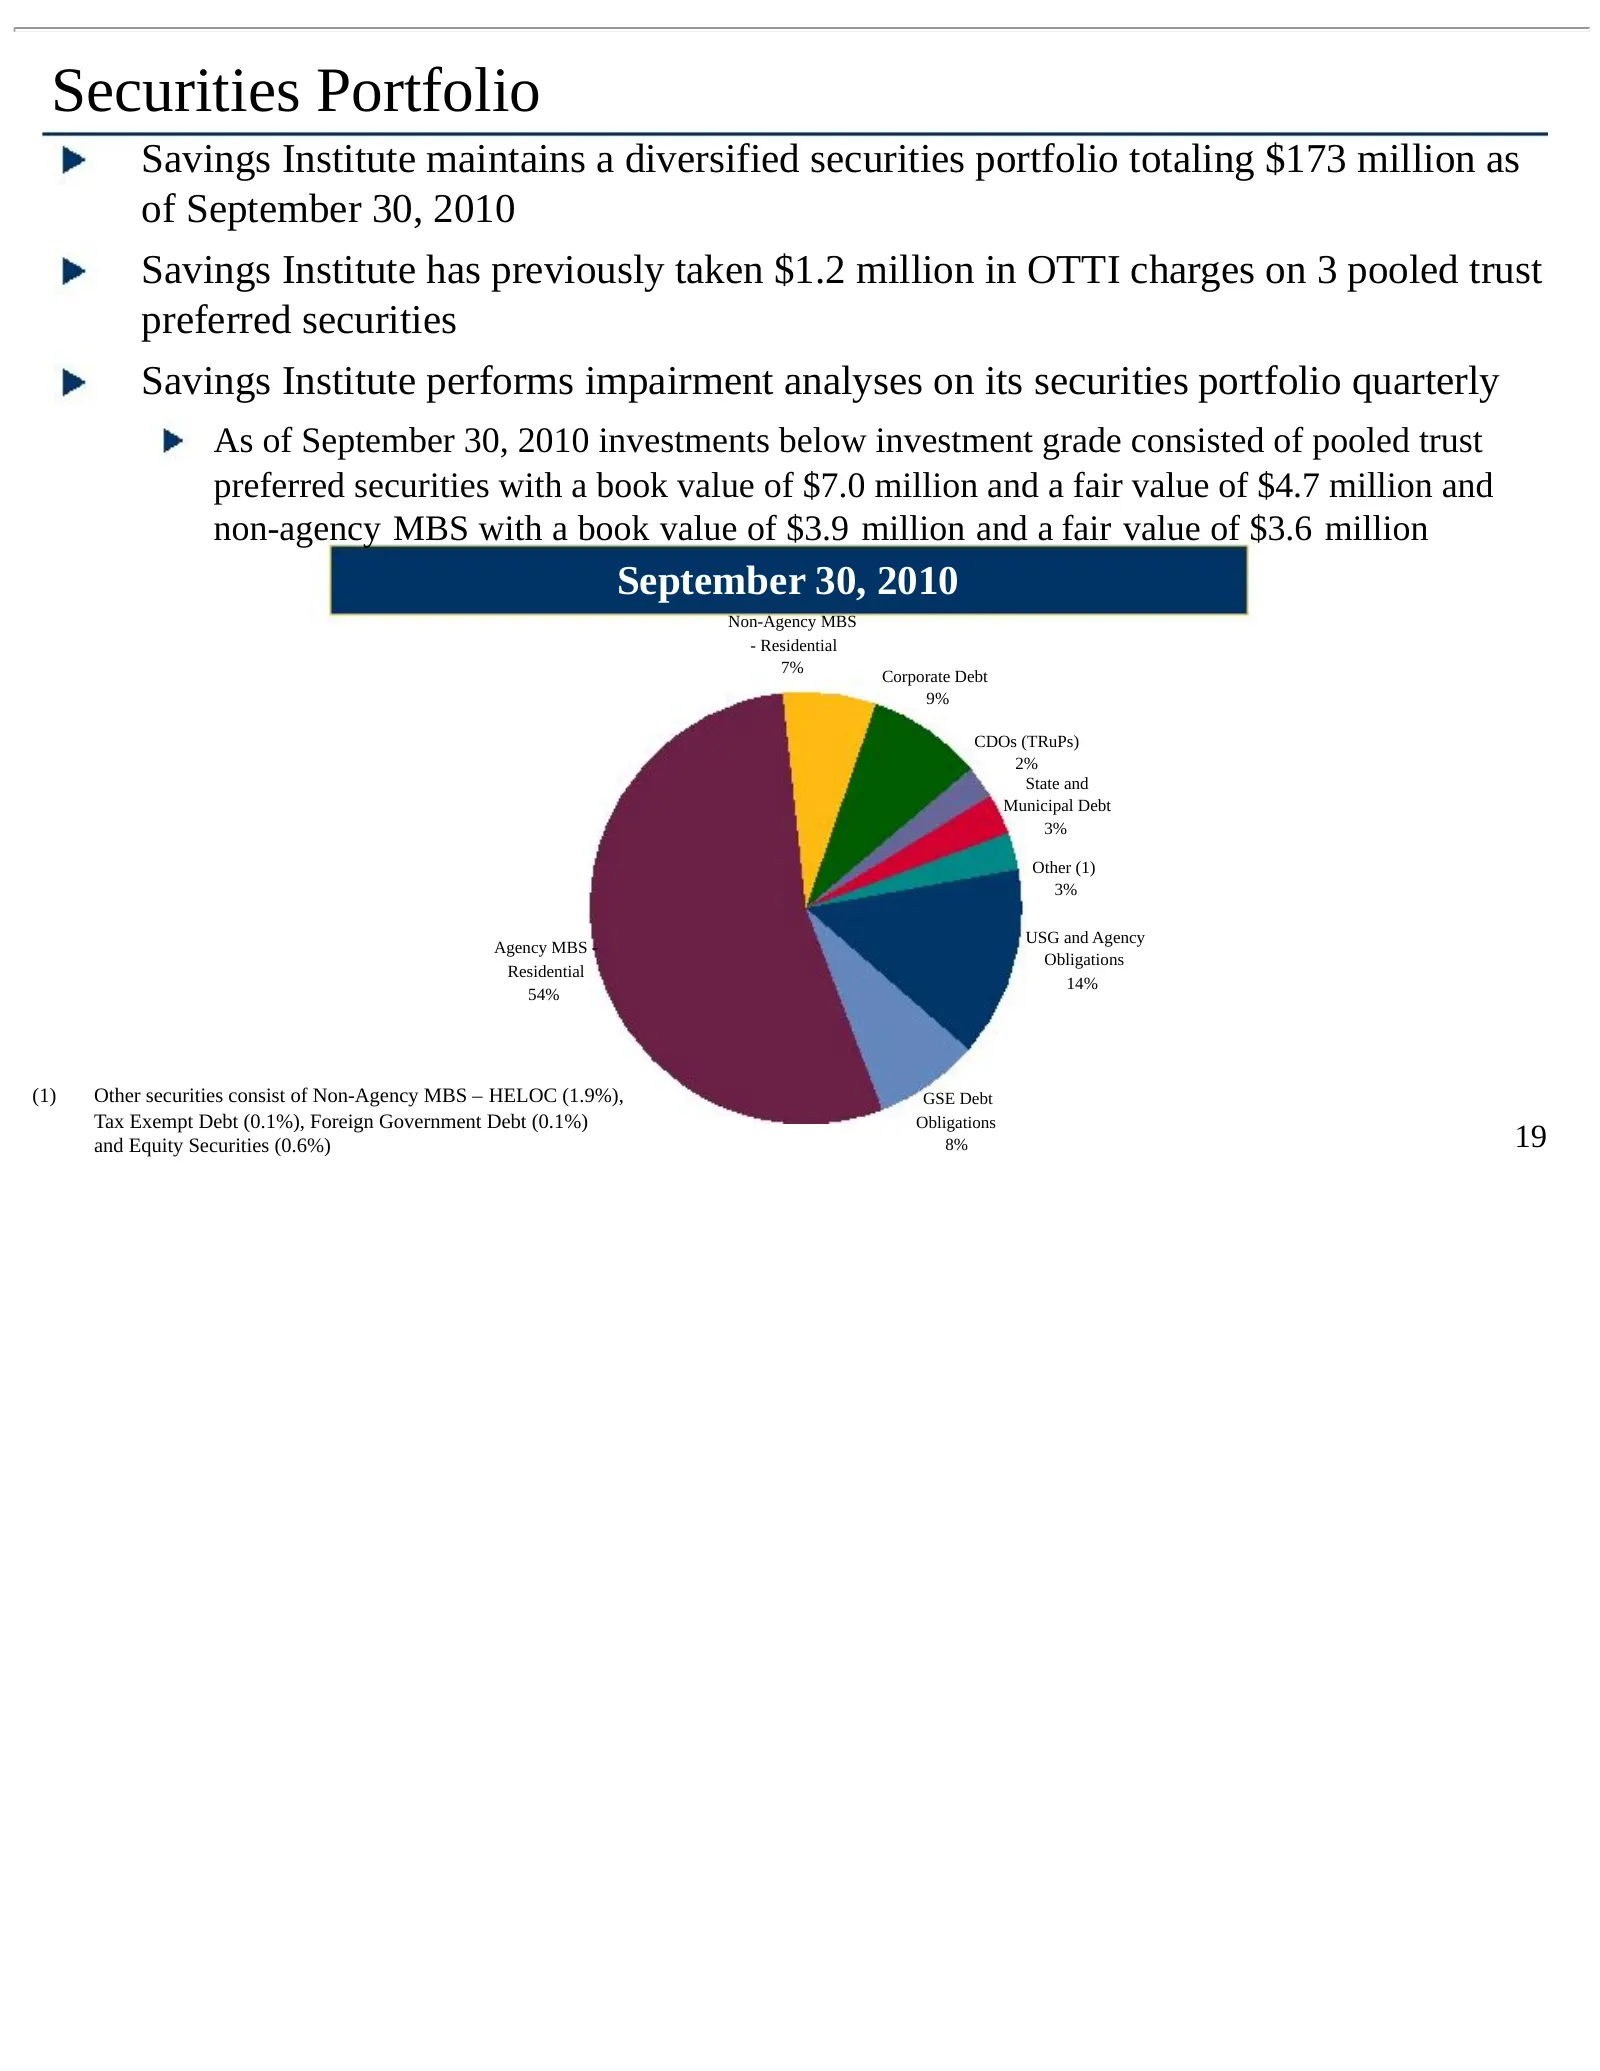
Securities Portfolio Savings Institute maintains a diversified securities portfolio totaling $173 million as of September 30, 2010 Savings Institute has previously taken $1.2 million in OTTI charges on 3 pooled trust preferred securities Savings Institute performs impairment analyses on its securiti
Slide 20: Improving Deposit Mix
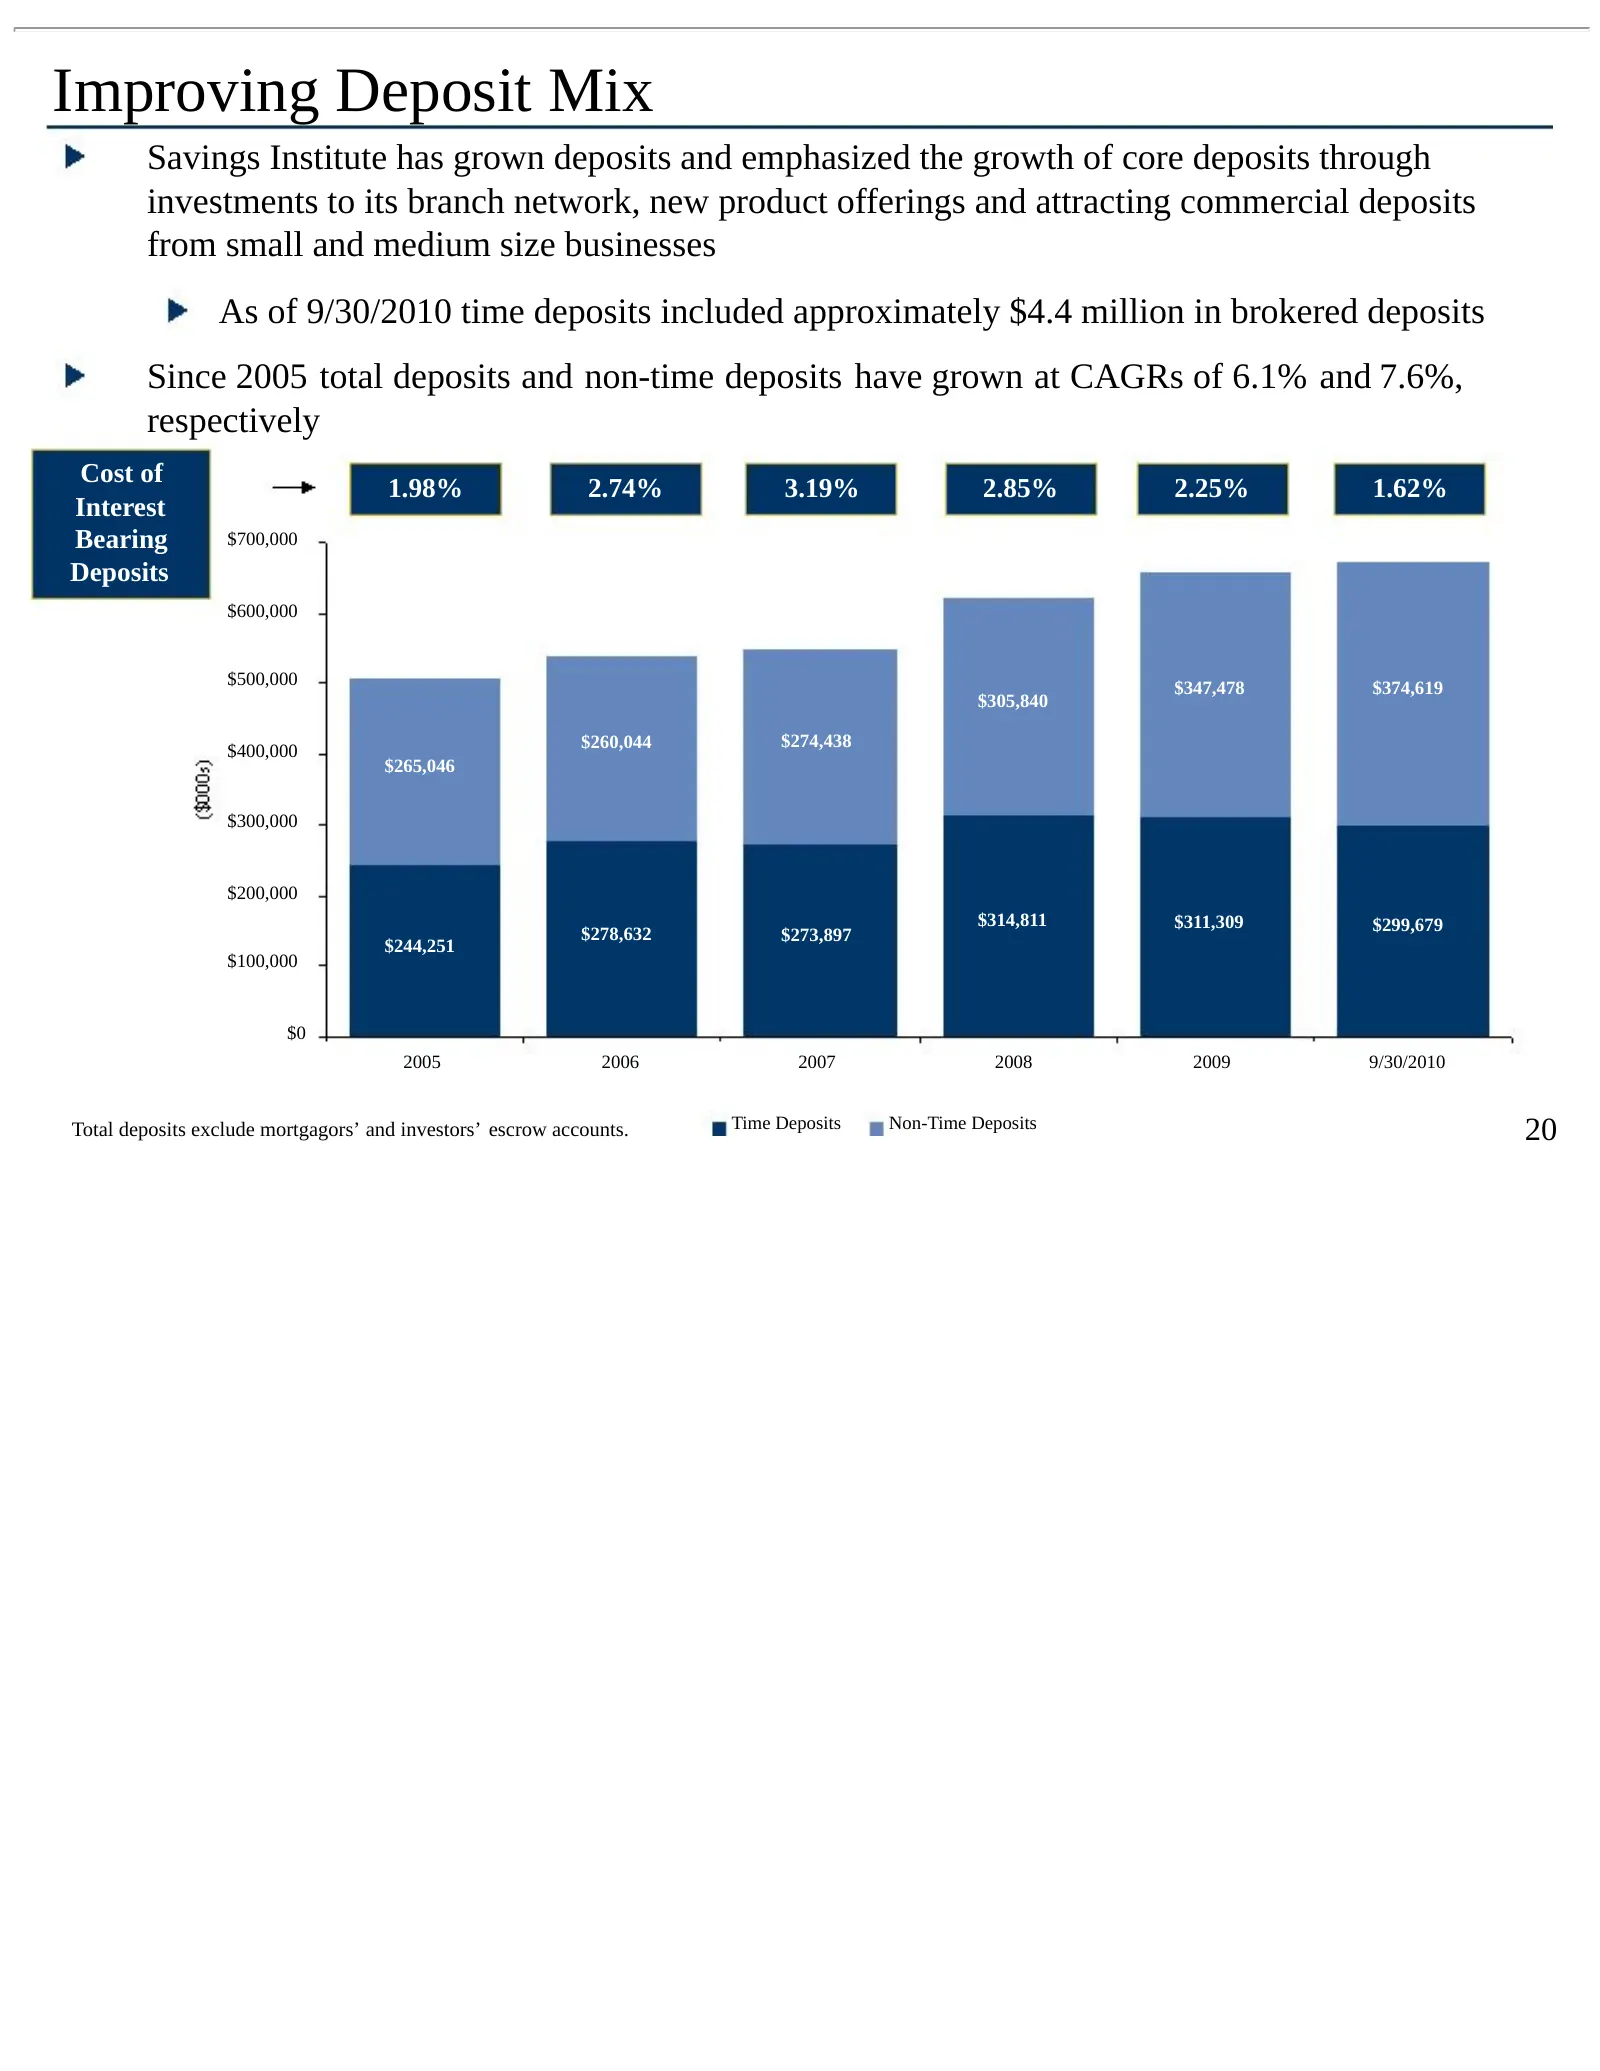
Improving Deposit Mix Savings Institute has grown deposits and emphasized the growth of core deposits through investments to its branch network, new product offerings and attracting commercial deposits from small and medium size businesses As of 9/30/2010 time deposits included approximately $4.4 mi
Slide 21: Core Profitability
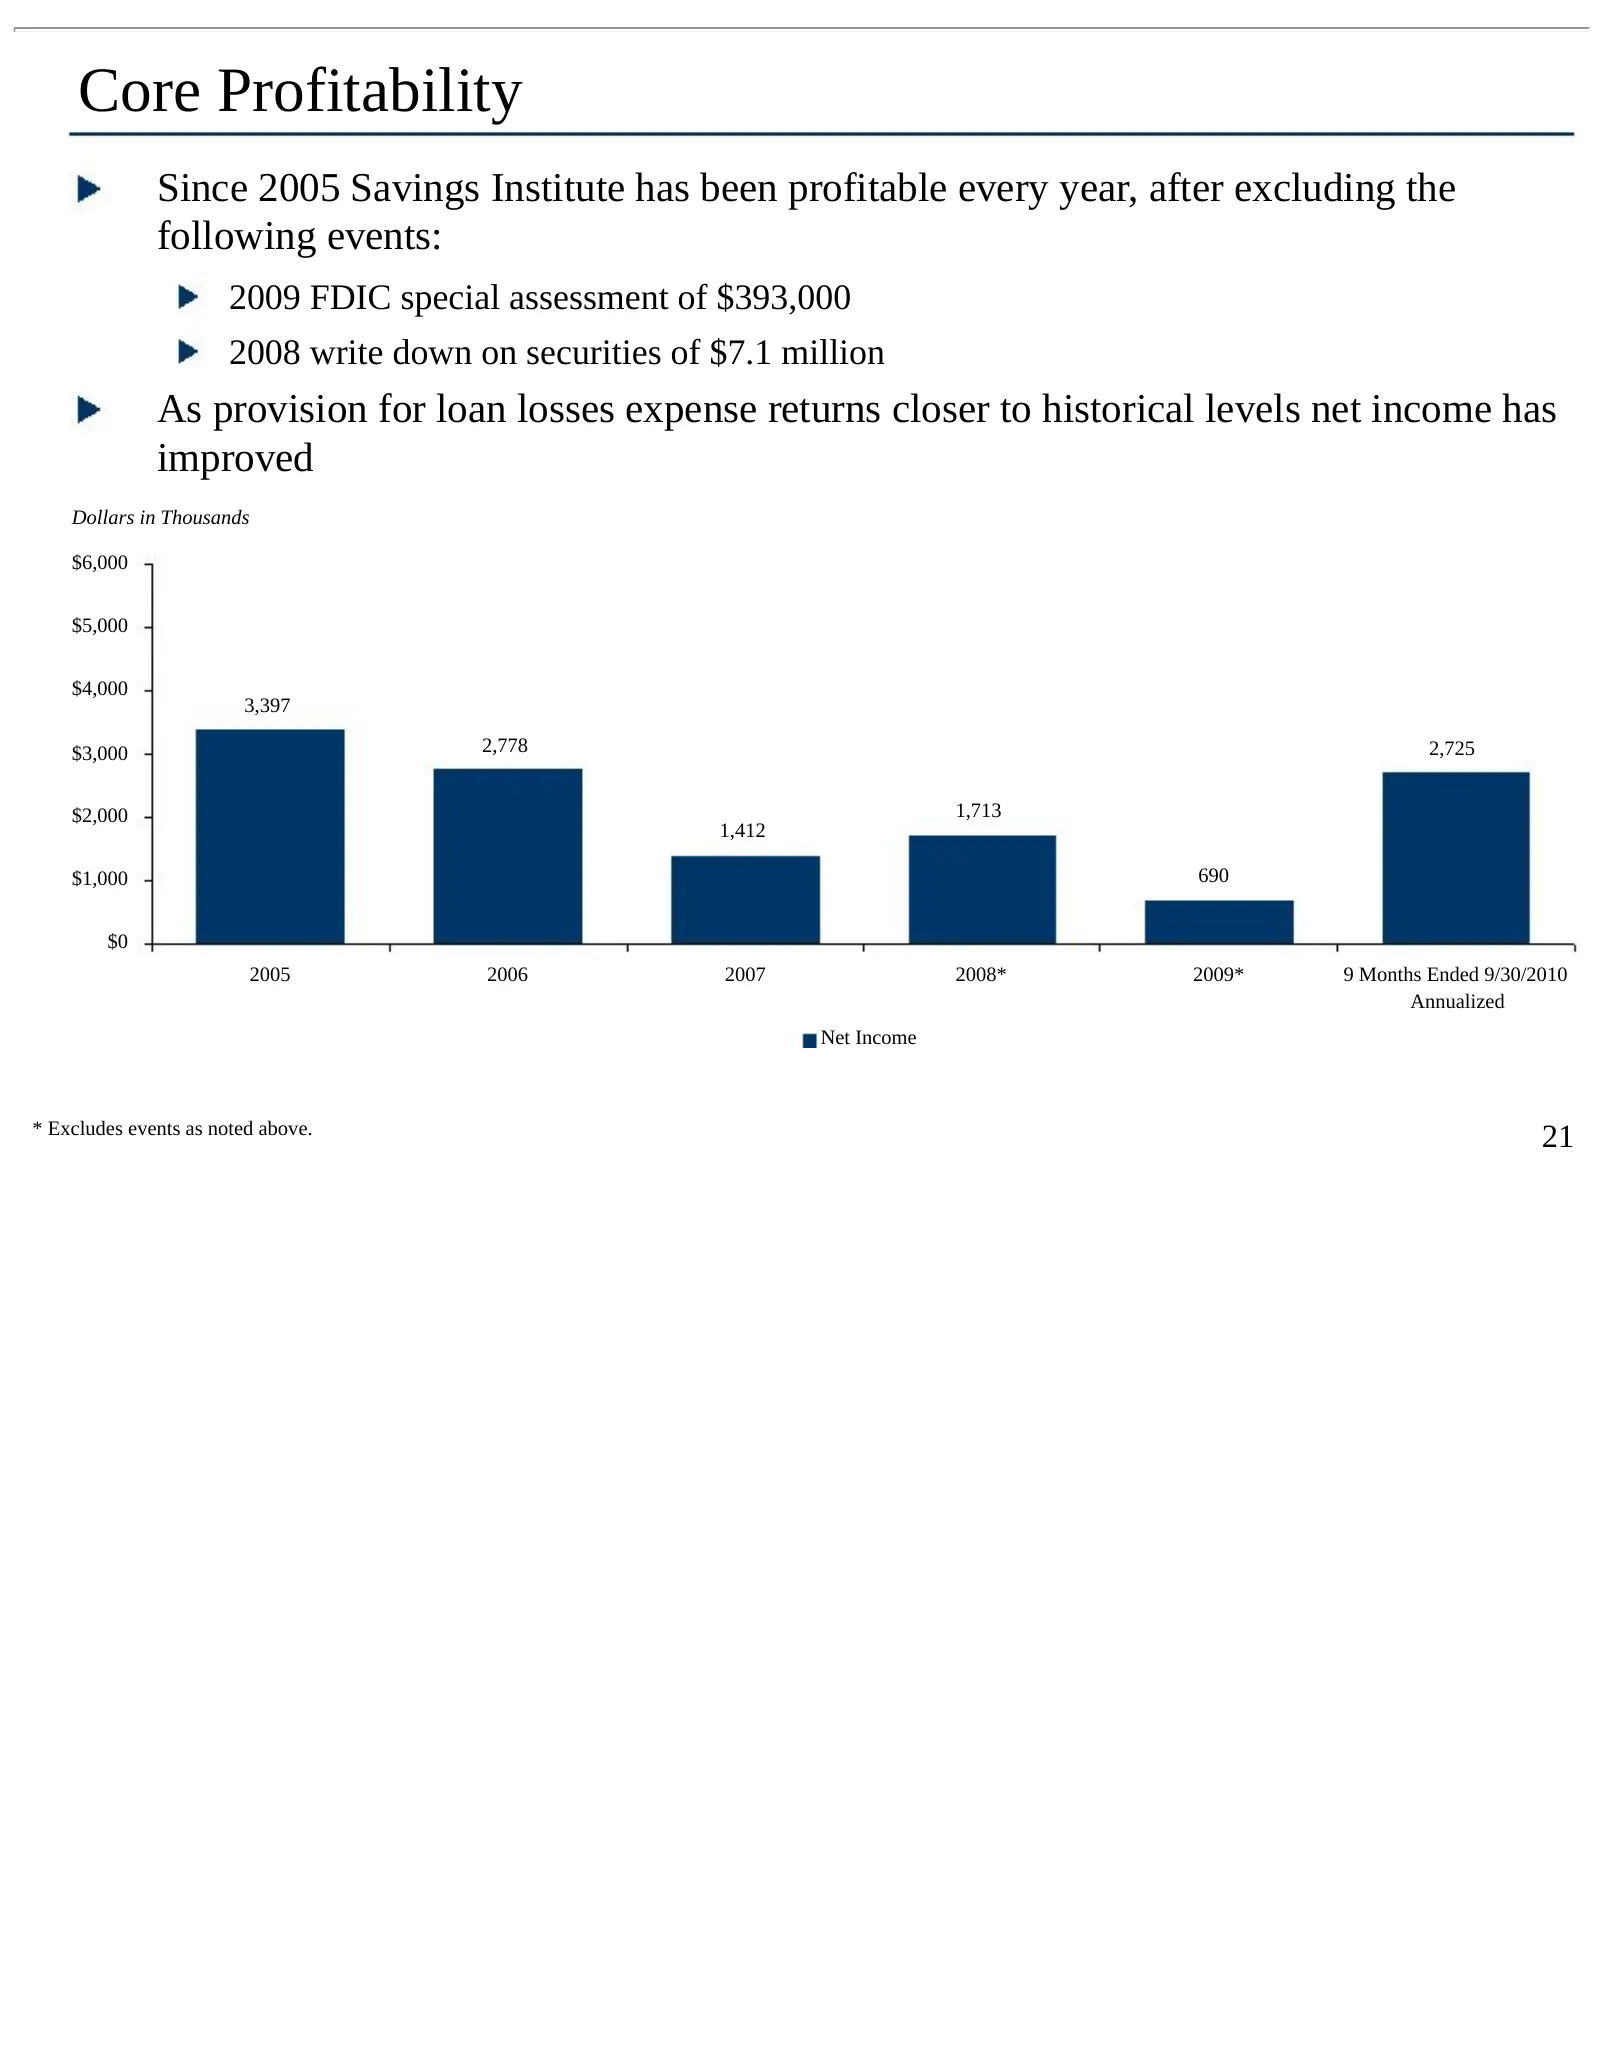
Core Profitability Since 2005 Savings Institute has been profitable every year, after excluding the following events: 2009 FDIC special assessment of $393,000 2008 write down on securities of $7.1 million As provision for loan losses expense returns closer to historical levels net income has improve
Slide 22: Strong Capital Profile
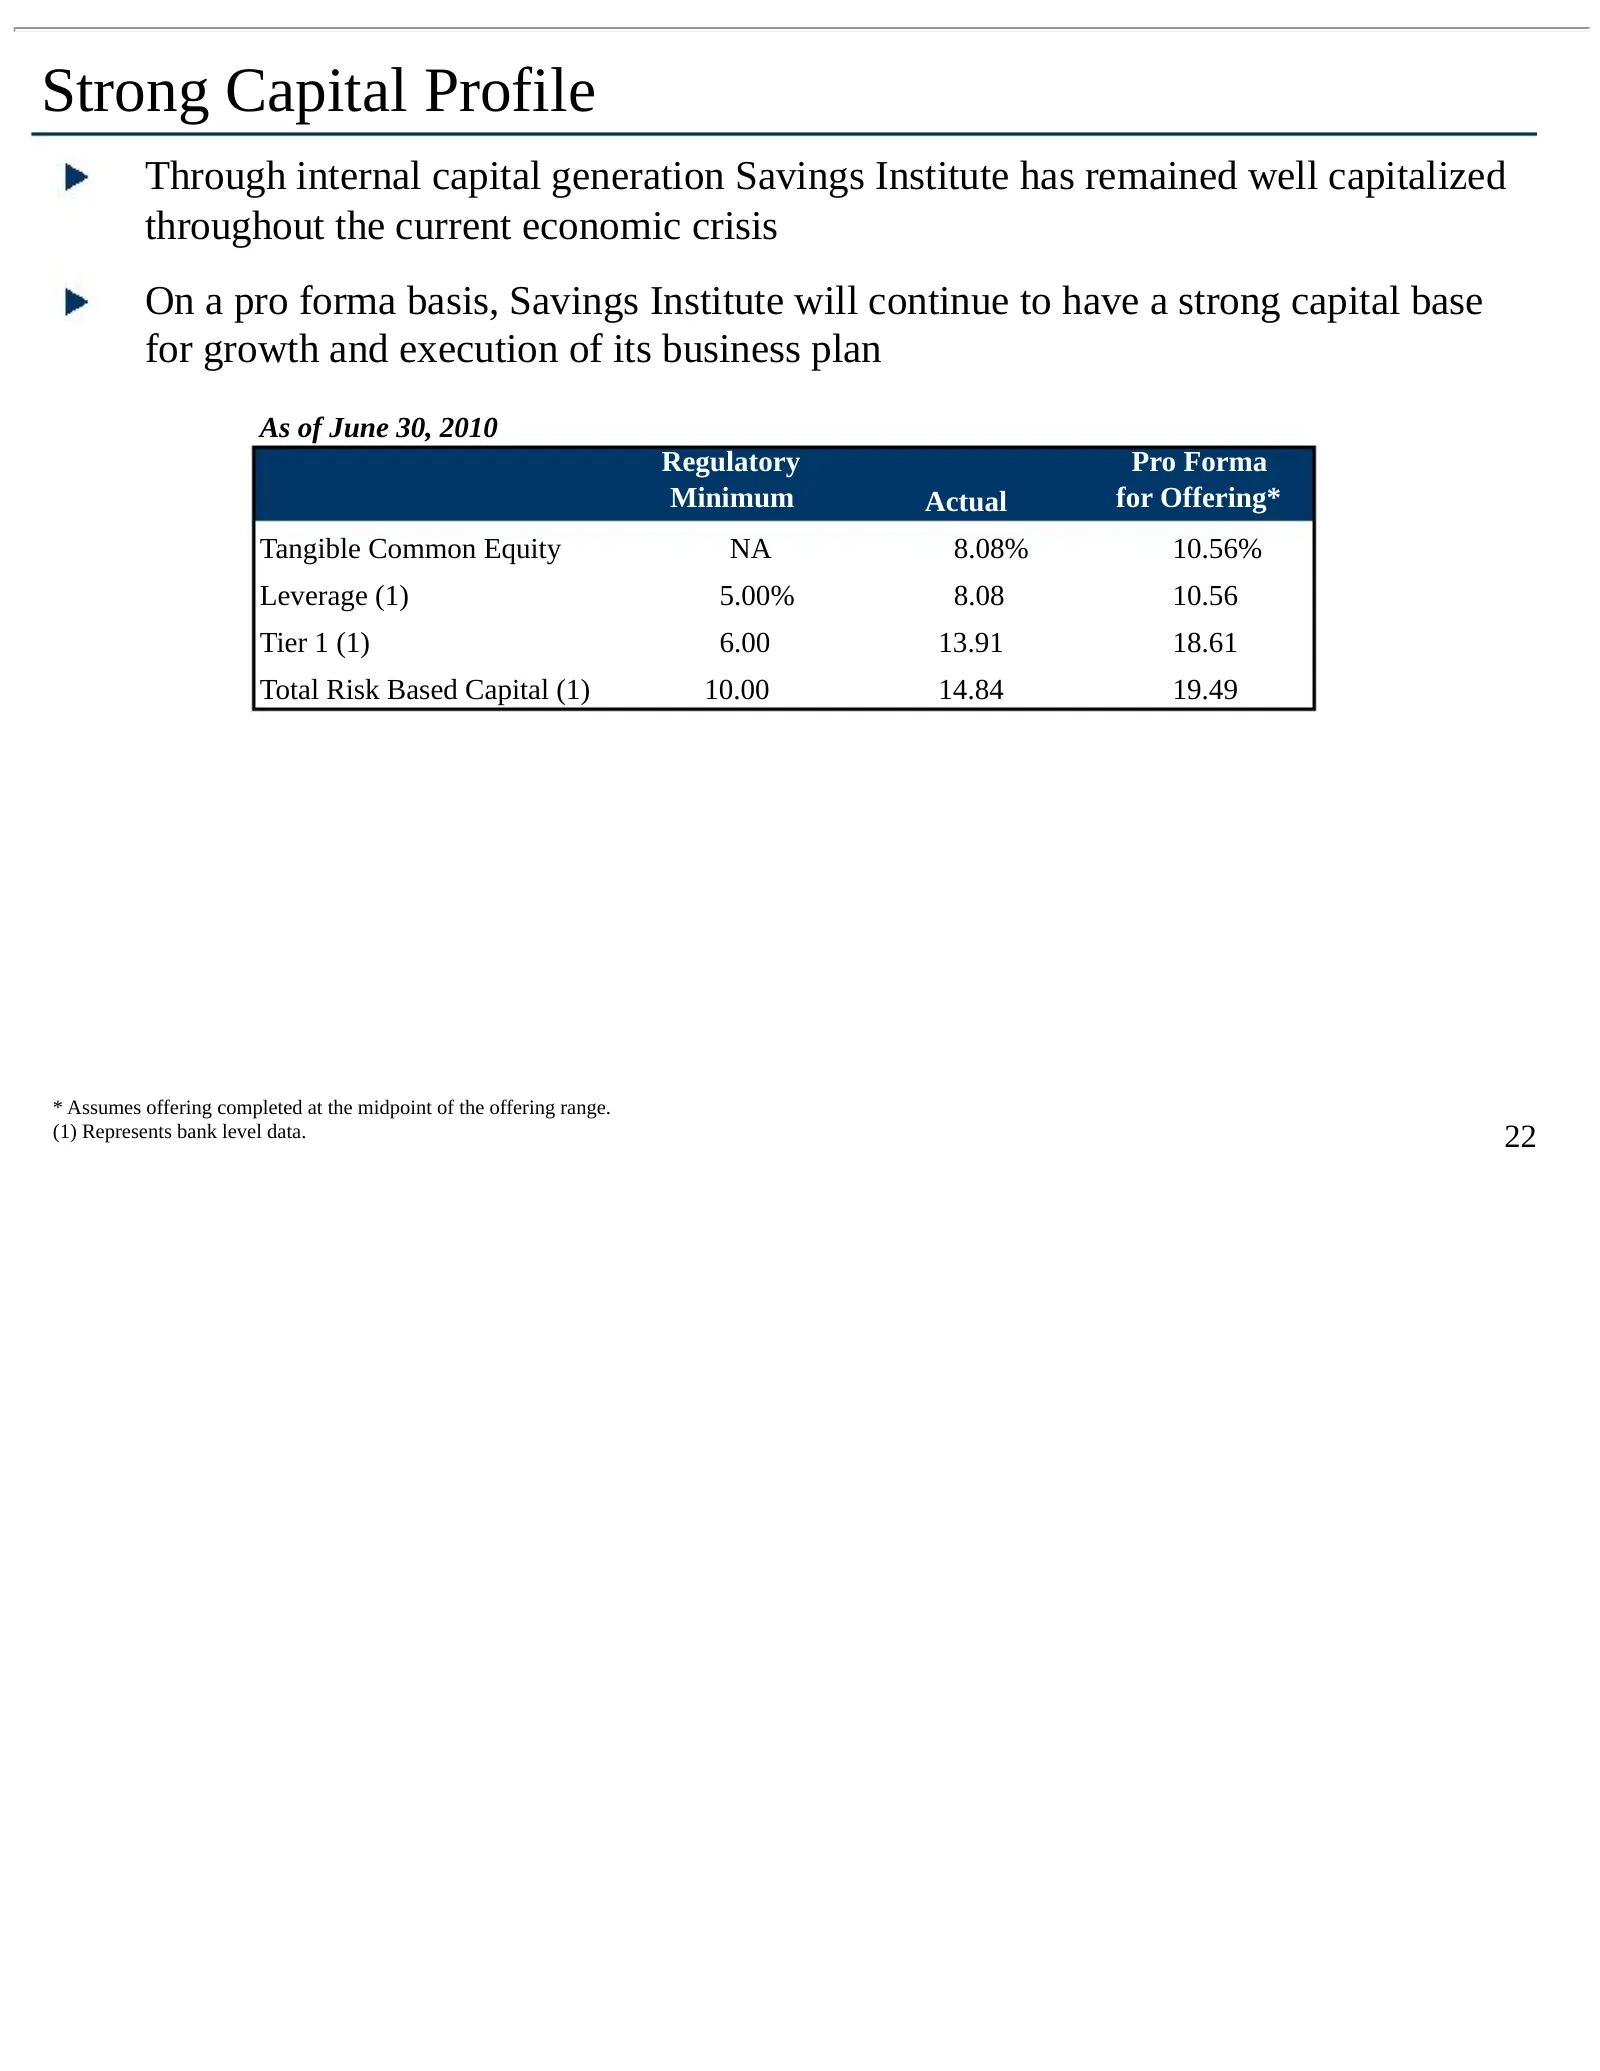
Strong Capital Profile Through internal capital generation Savings Institute has remained well capitalized throughout the current economic crisis On a pro forma basis, Savings Institute will continue to have a strong capital base for growth and execution of its business plan As of June 30, 2010 Regu
Slide 23: Stock Buybacks and Dividends
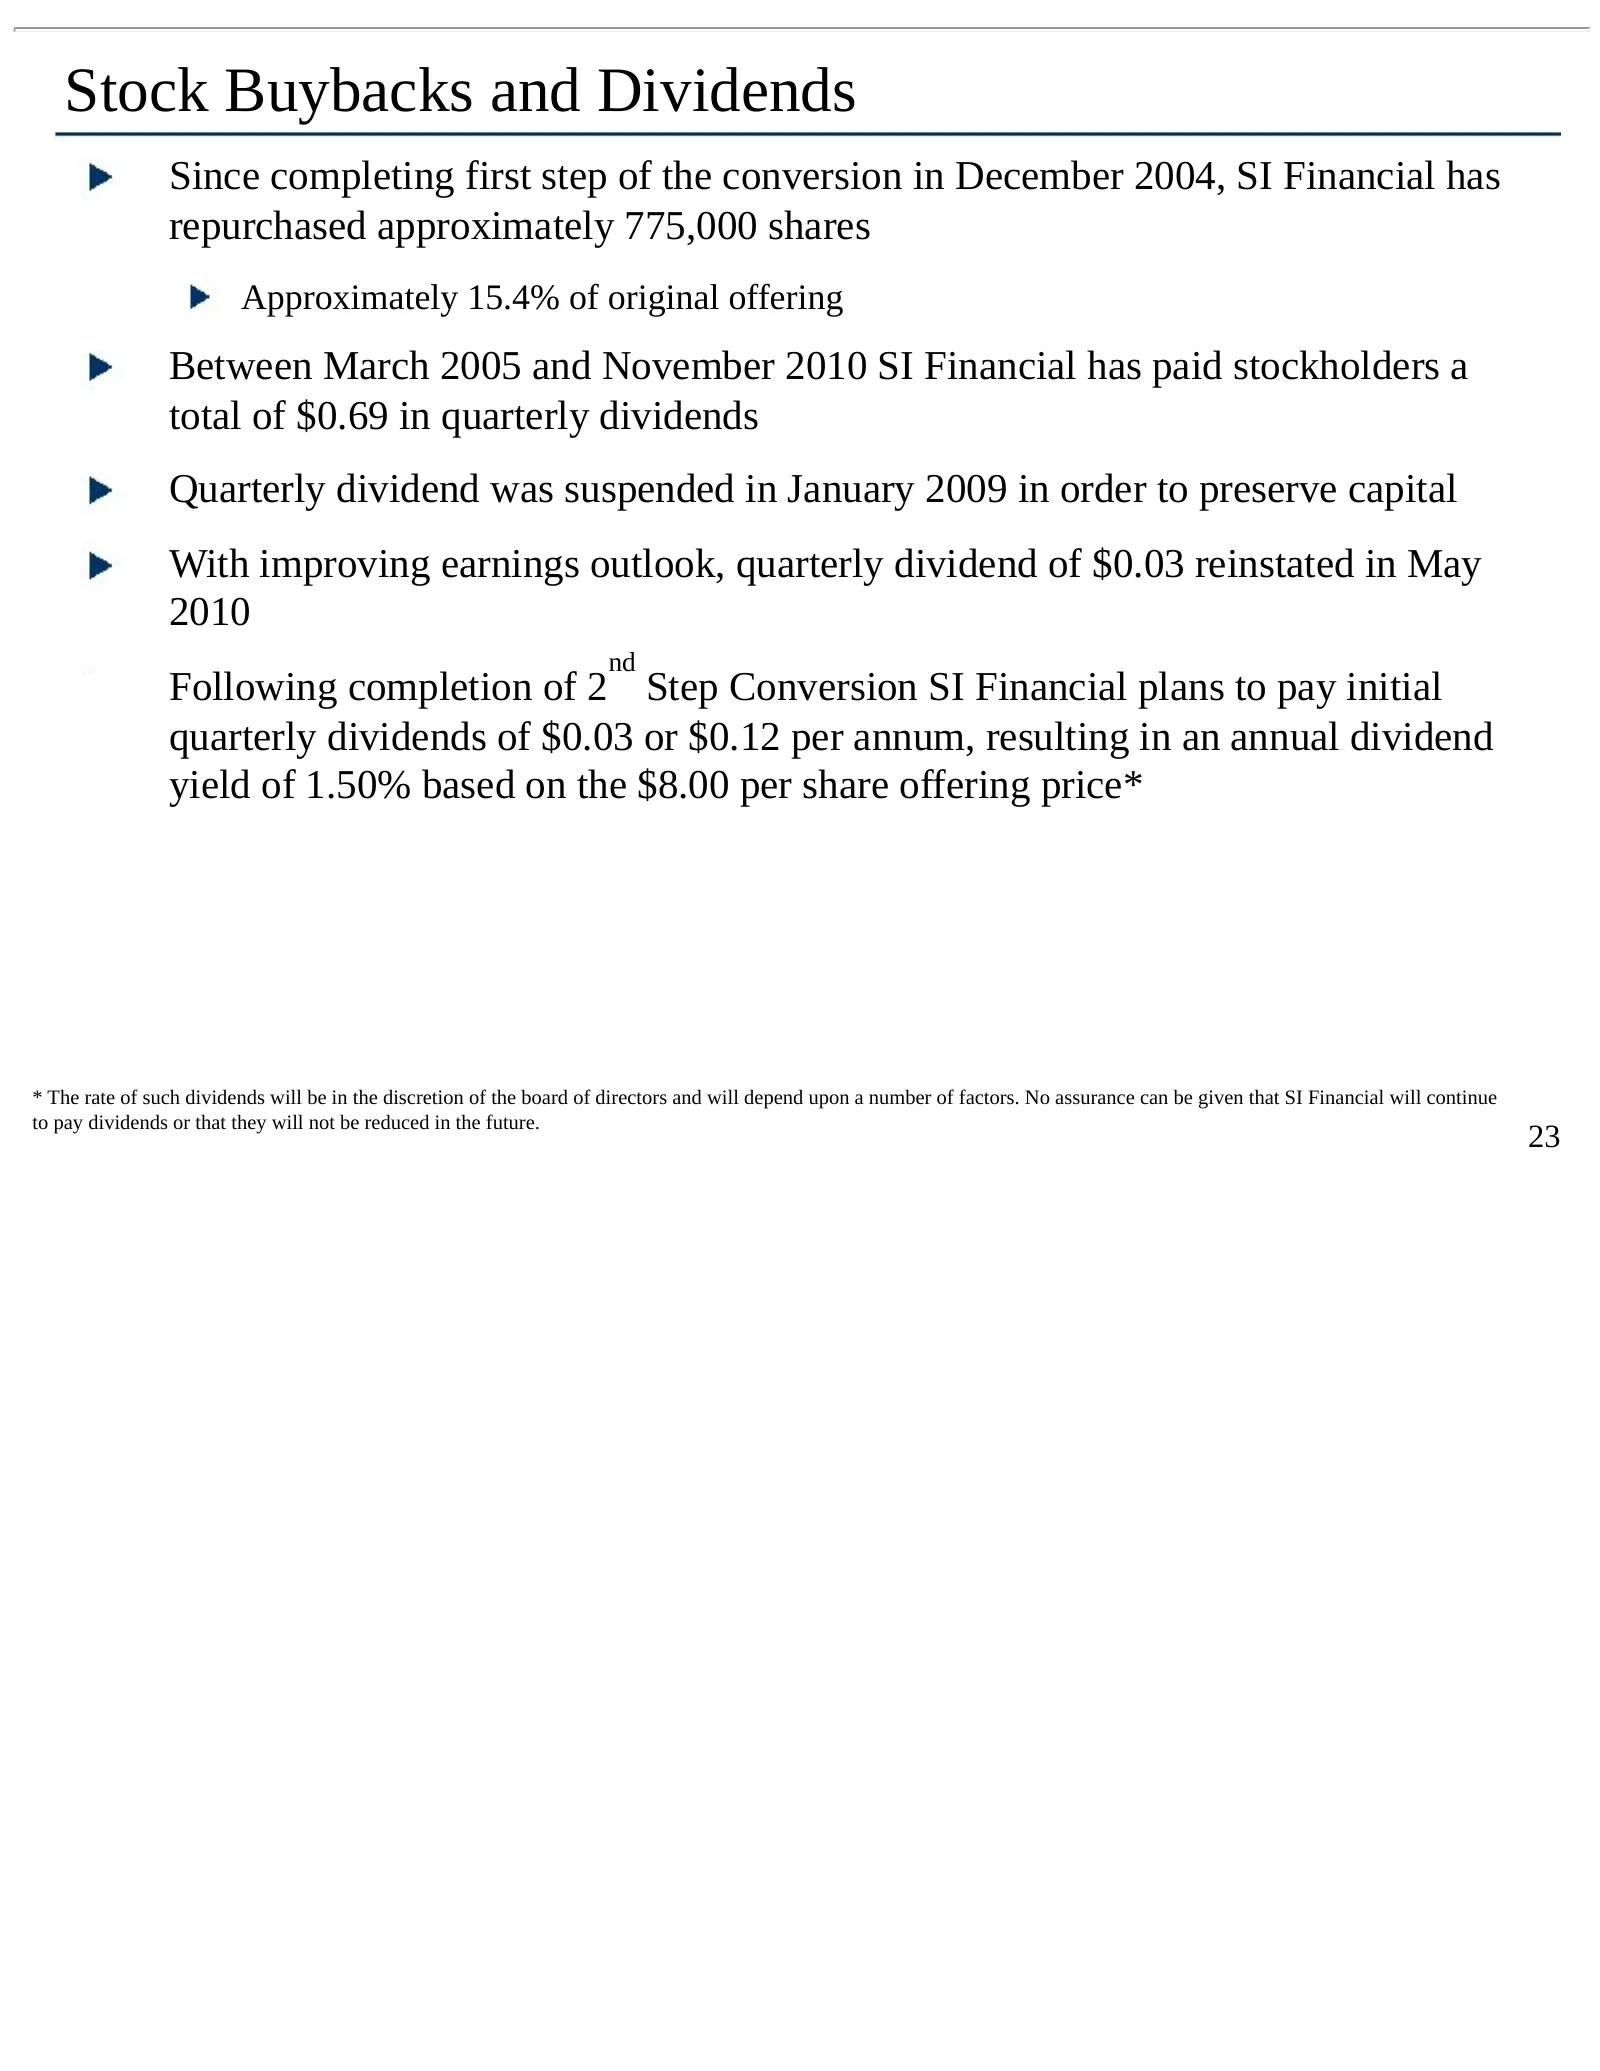
Stock Buybacks and Dividends Since completing first step of the conversion in December 2004, SI Financial has repurchased approximately 775,000 shares Approximately 15.4% of original offering Between March 2005 and November 2010 SI Financial has paid stockholders a total of $0.69 in quarterly divide
Slide 24: Use of Proceeds
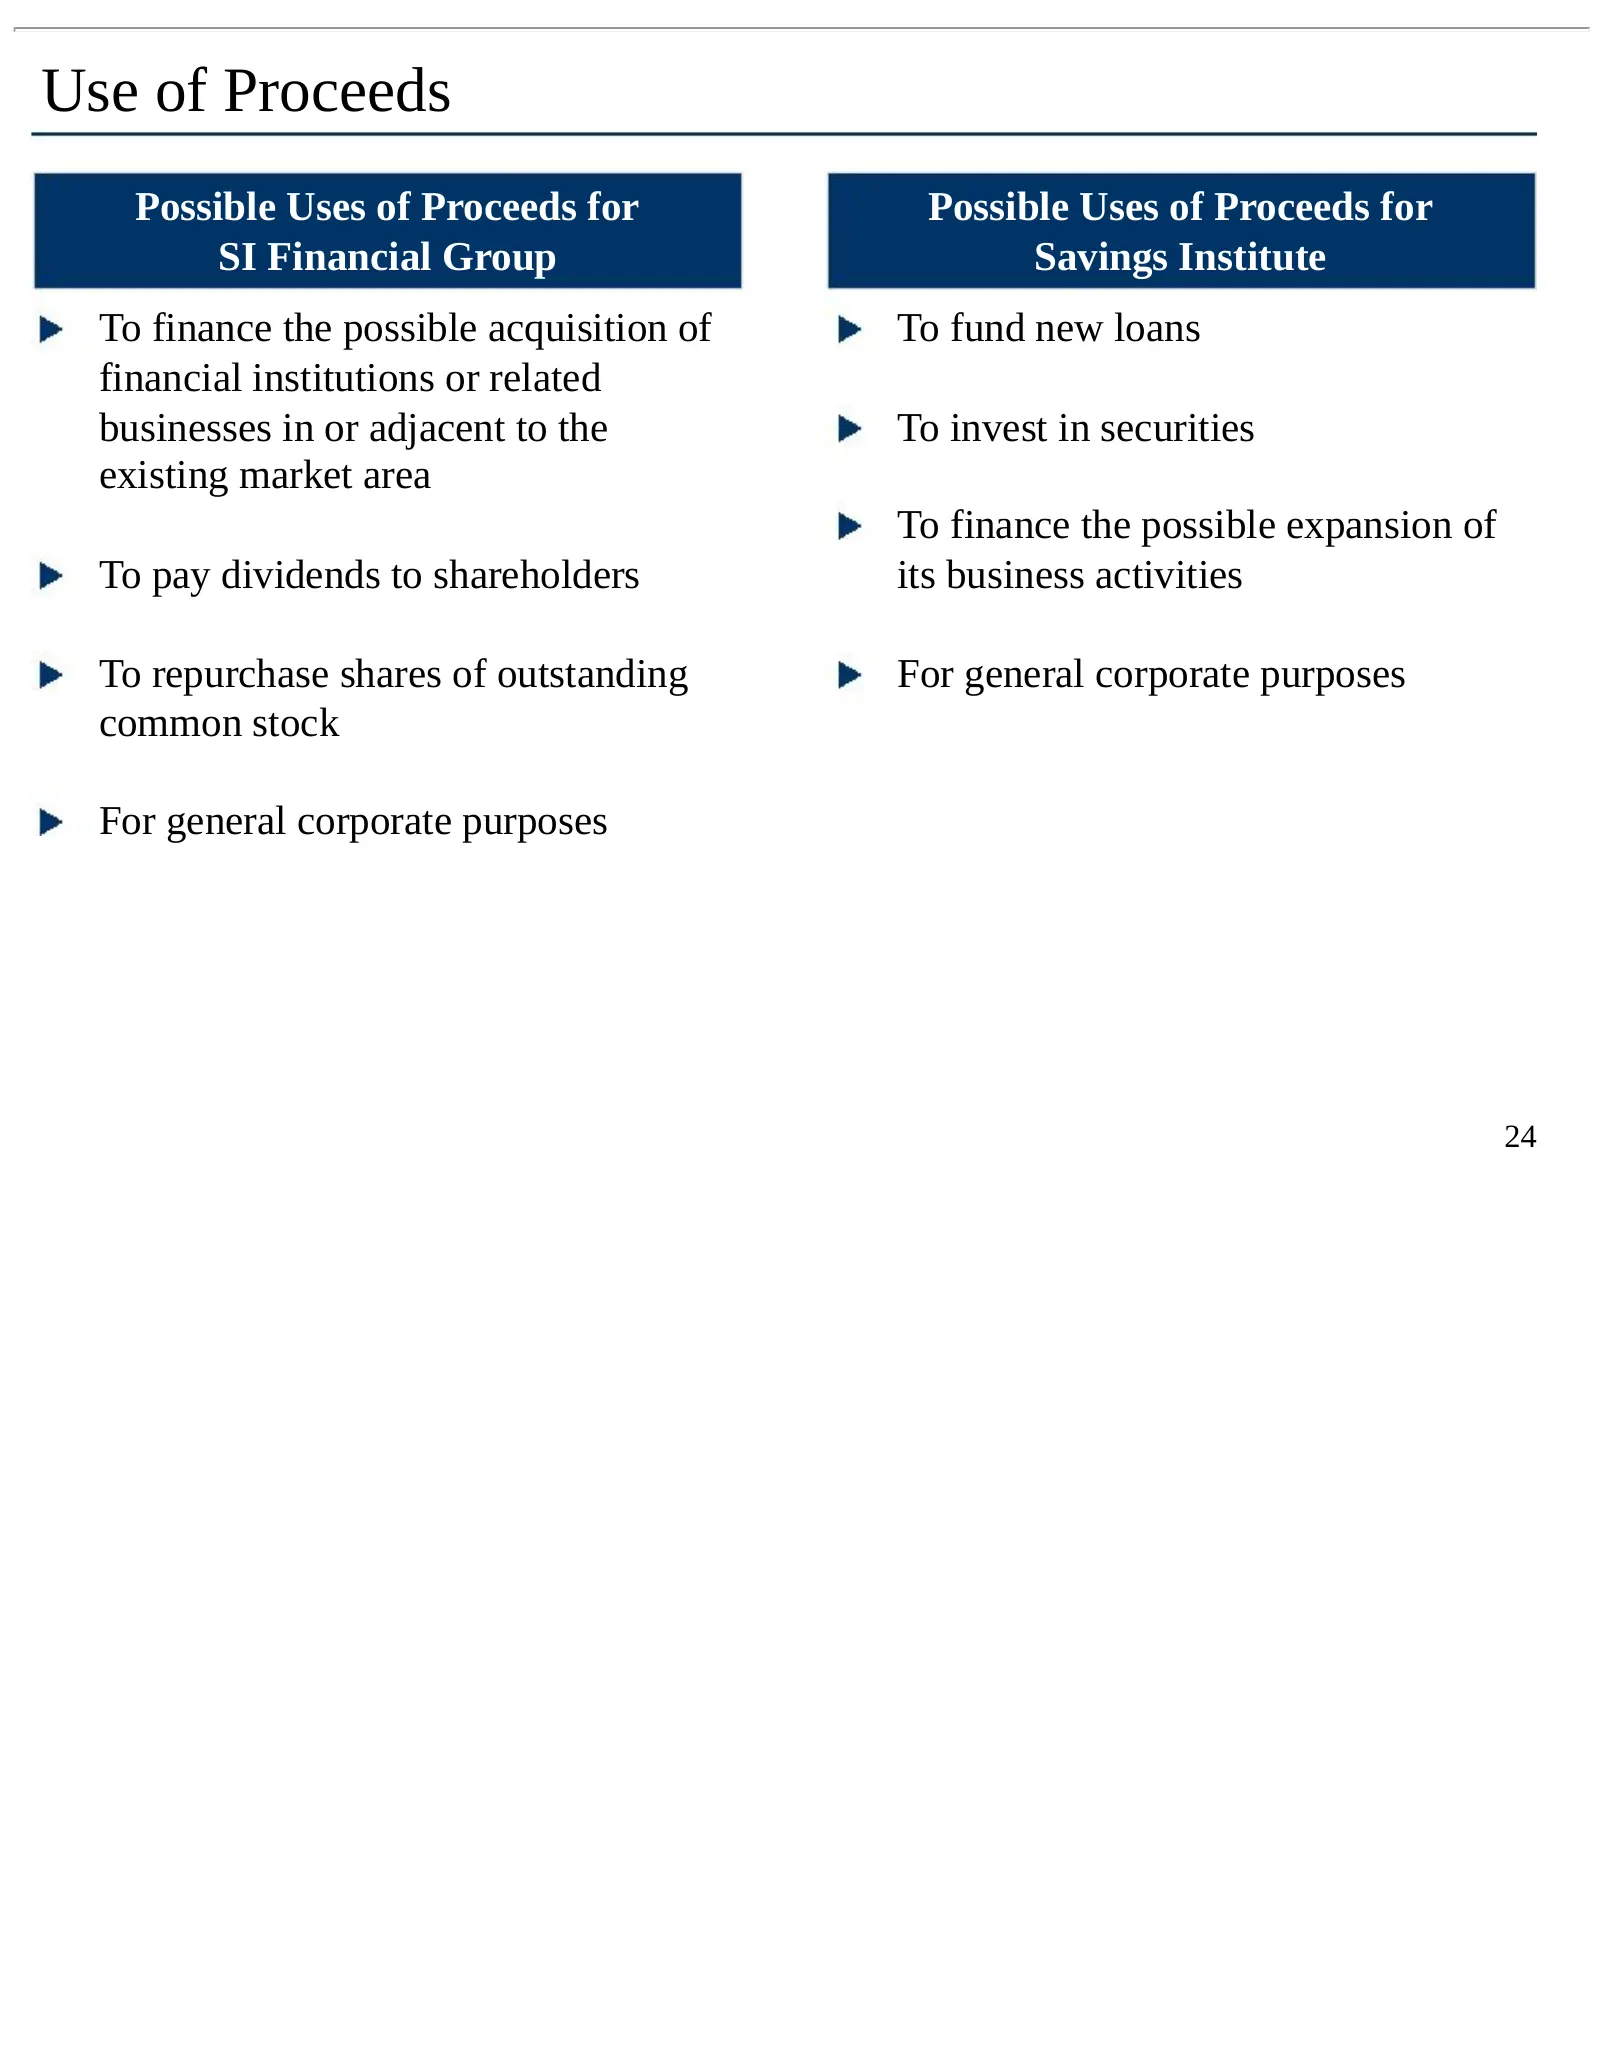
Use of Proceeds Possible Uses of Proceeds for Possible Uses of Proceeds for SI Financial Group Savings Institute To finance the possible acquisition of To fund new loans financial institutions or related businesses in or adjacent to the To invest in securities existing market area To finance the pos
Slide 25: Investment Merits
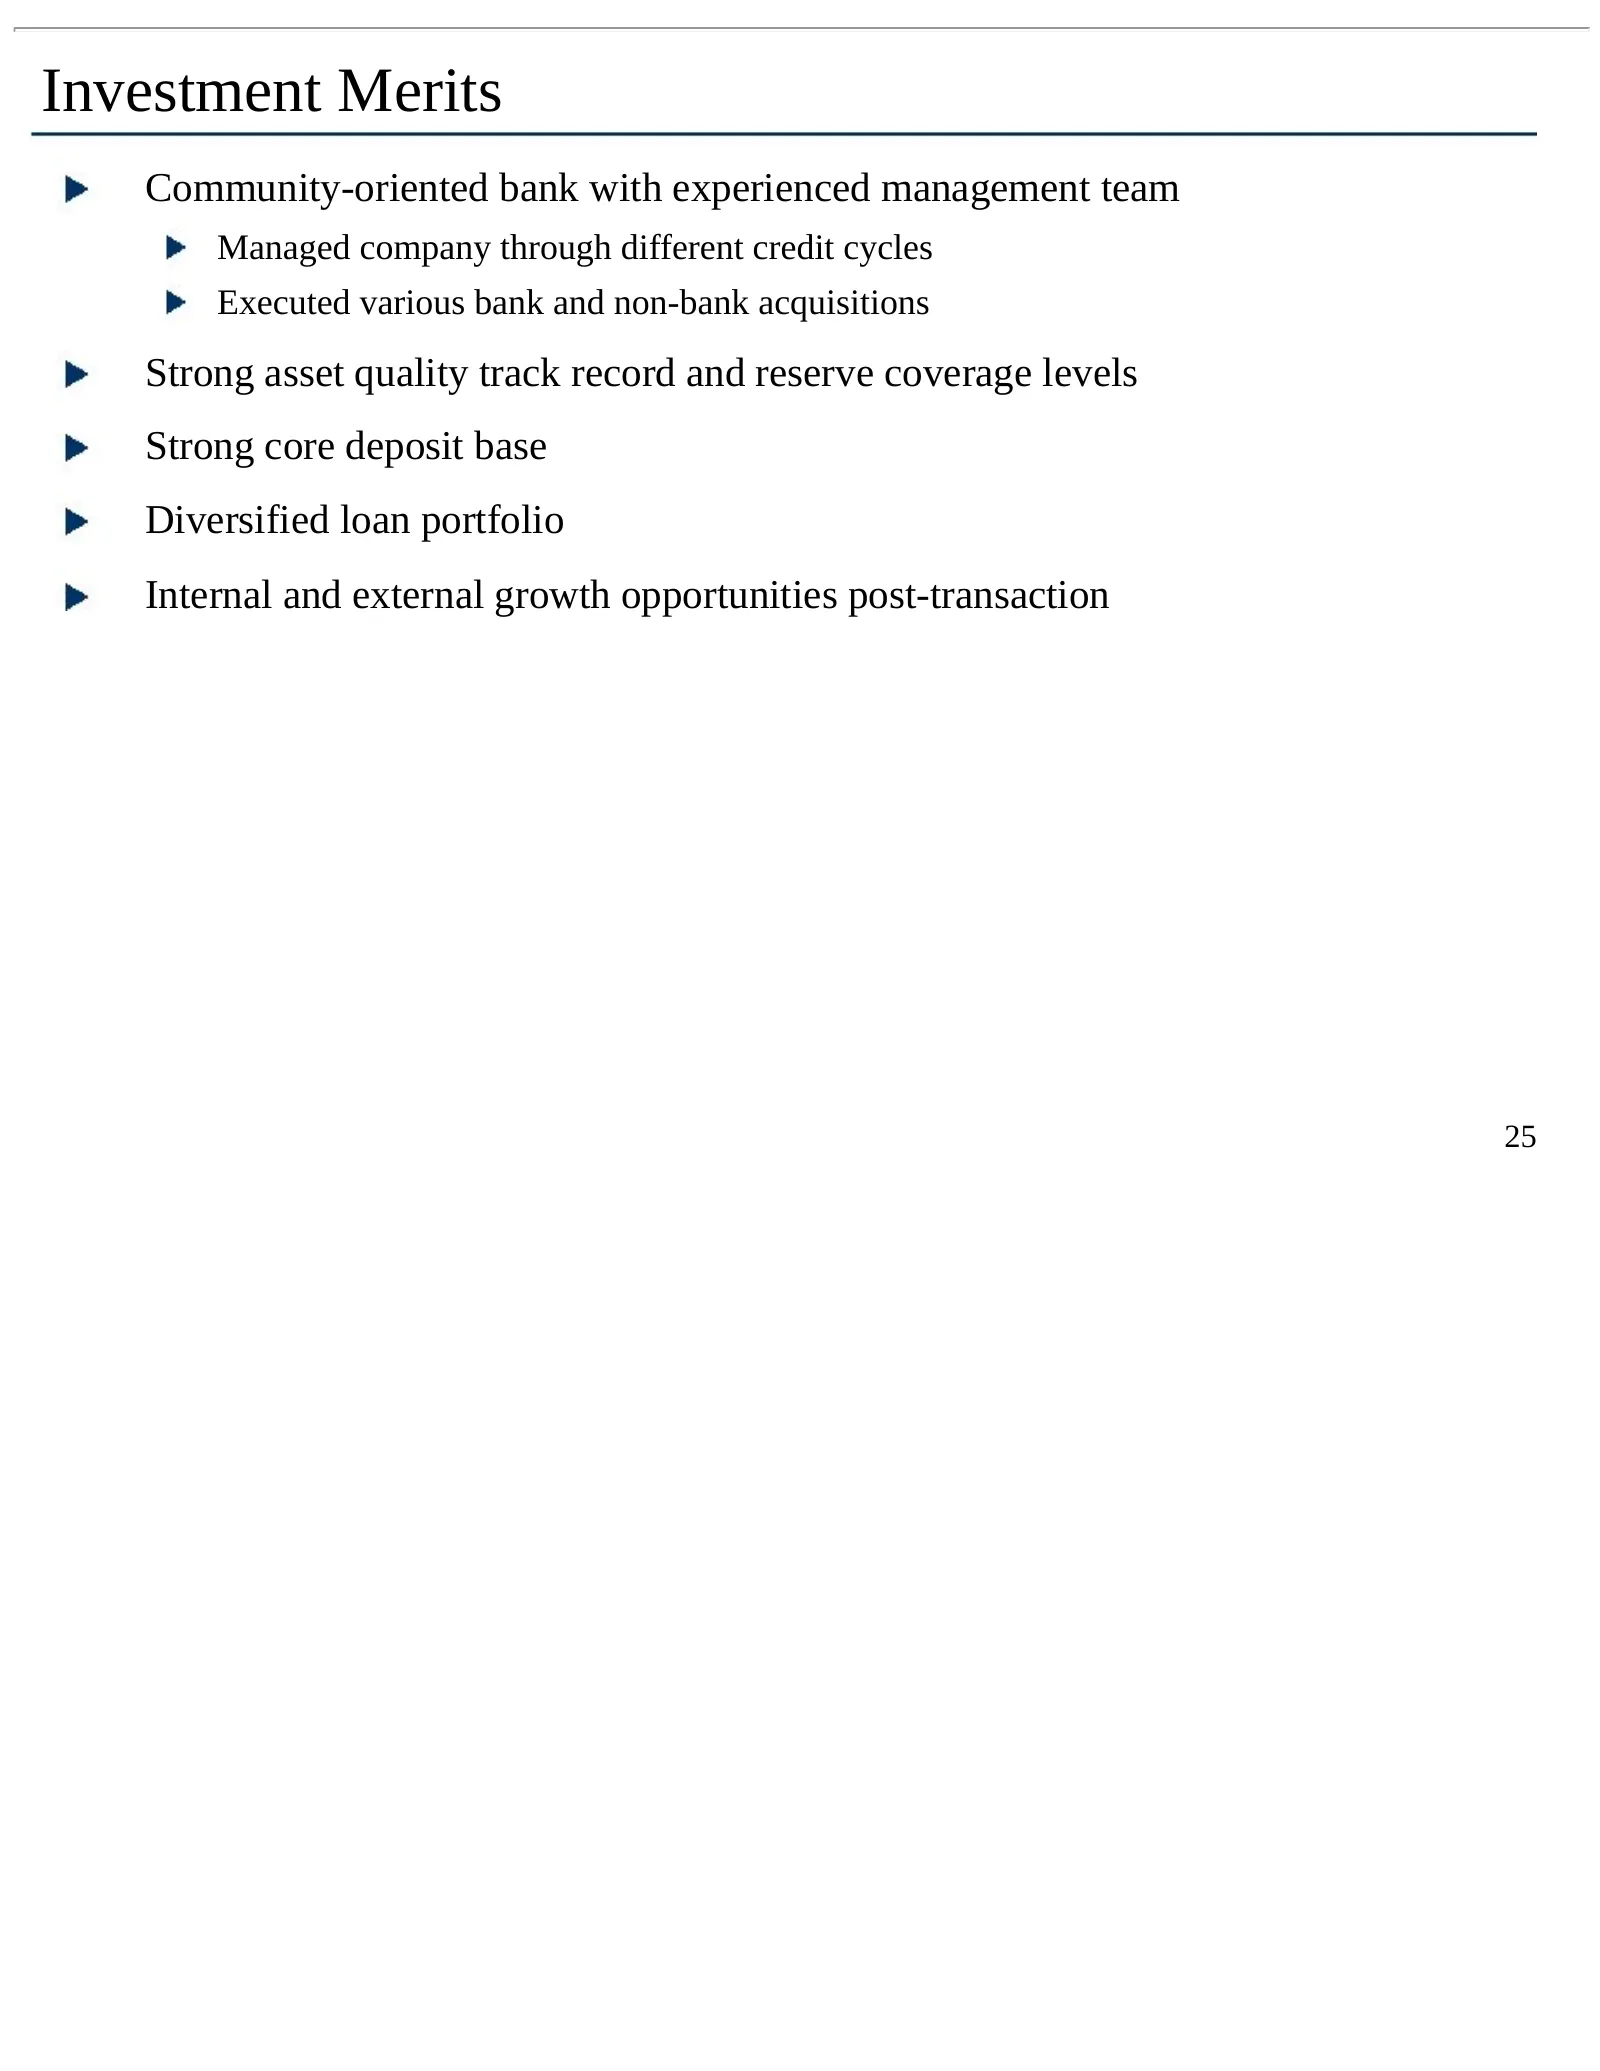
Investment Merits Community-oriented bank with experienced management team Managed company through different credit cycles Executed various bank and non-bank acquisitions Strong asset quality track record and reserve coverage levels Strong core deposit base Diversified loan portfolio Internal and ex
Slide 26: Offering Overview
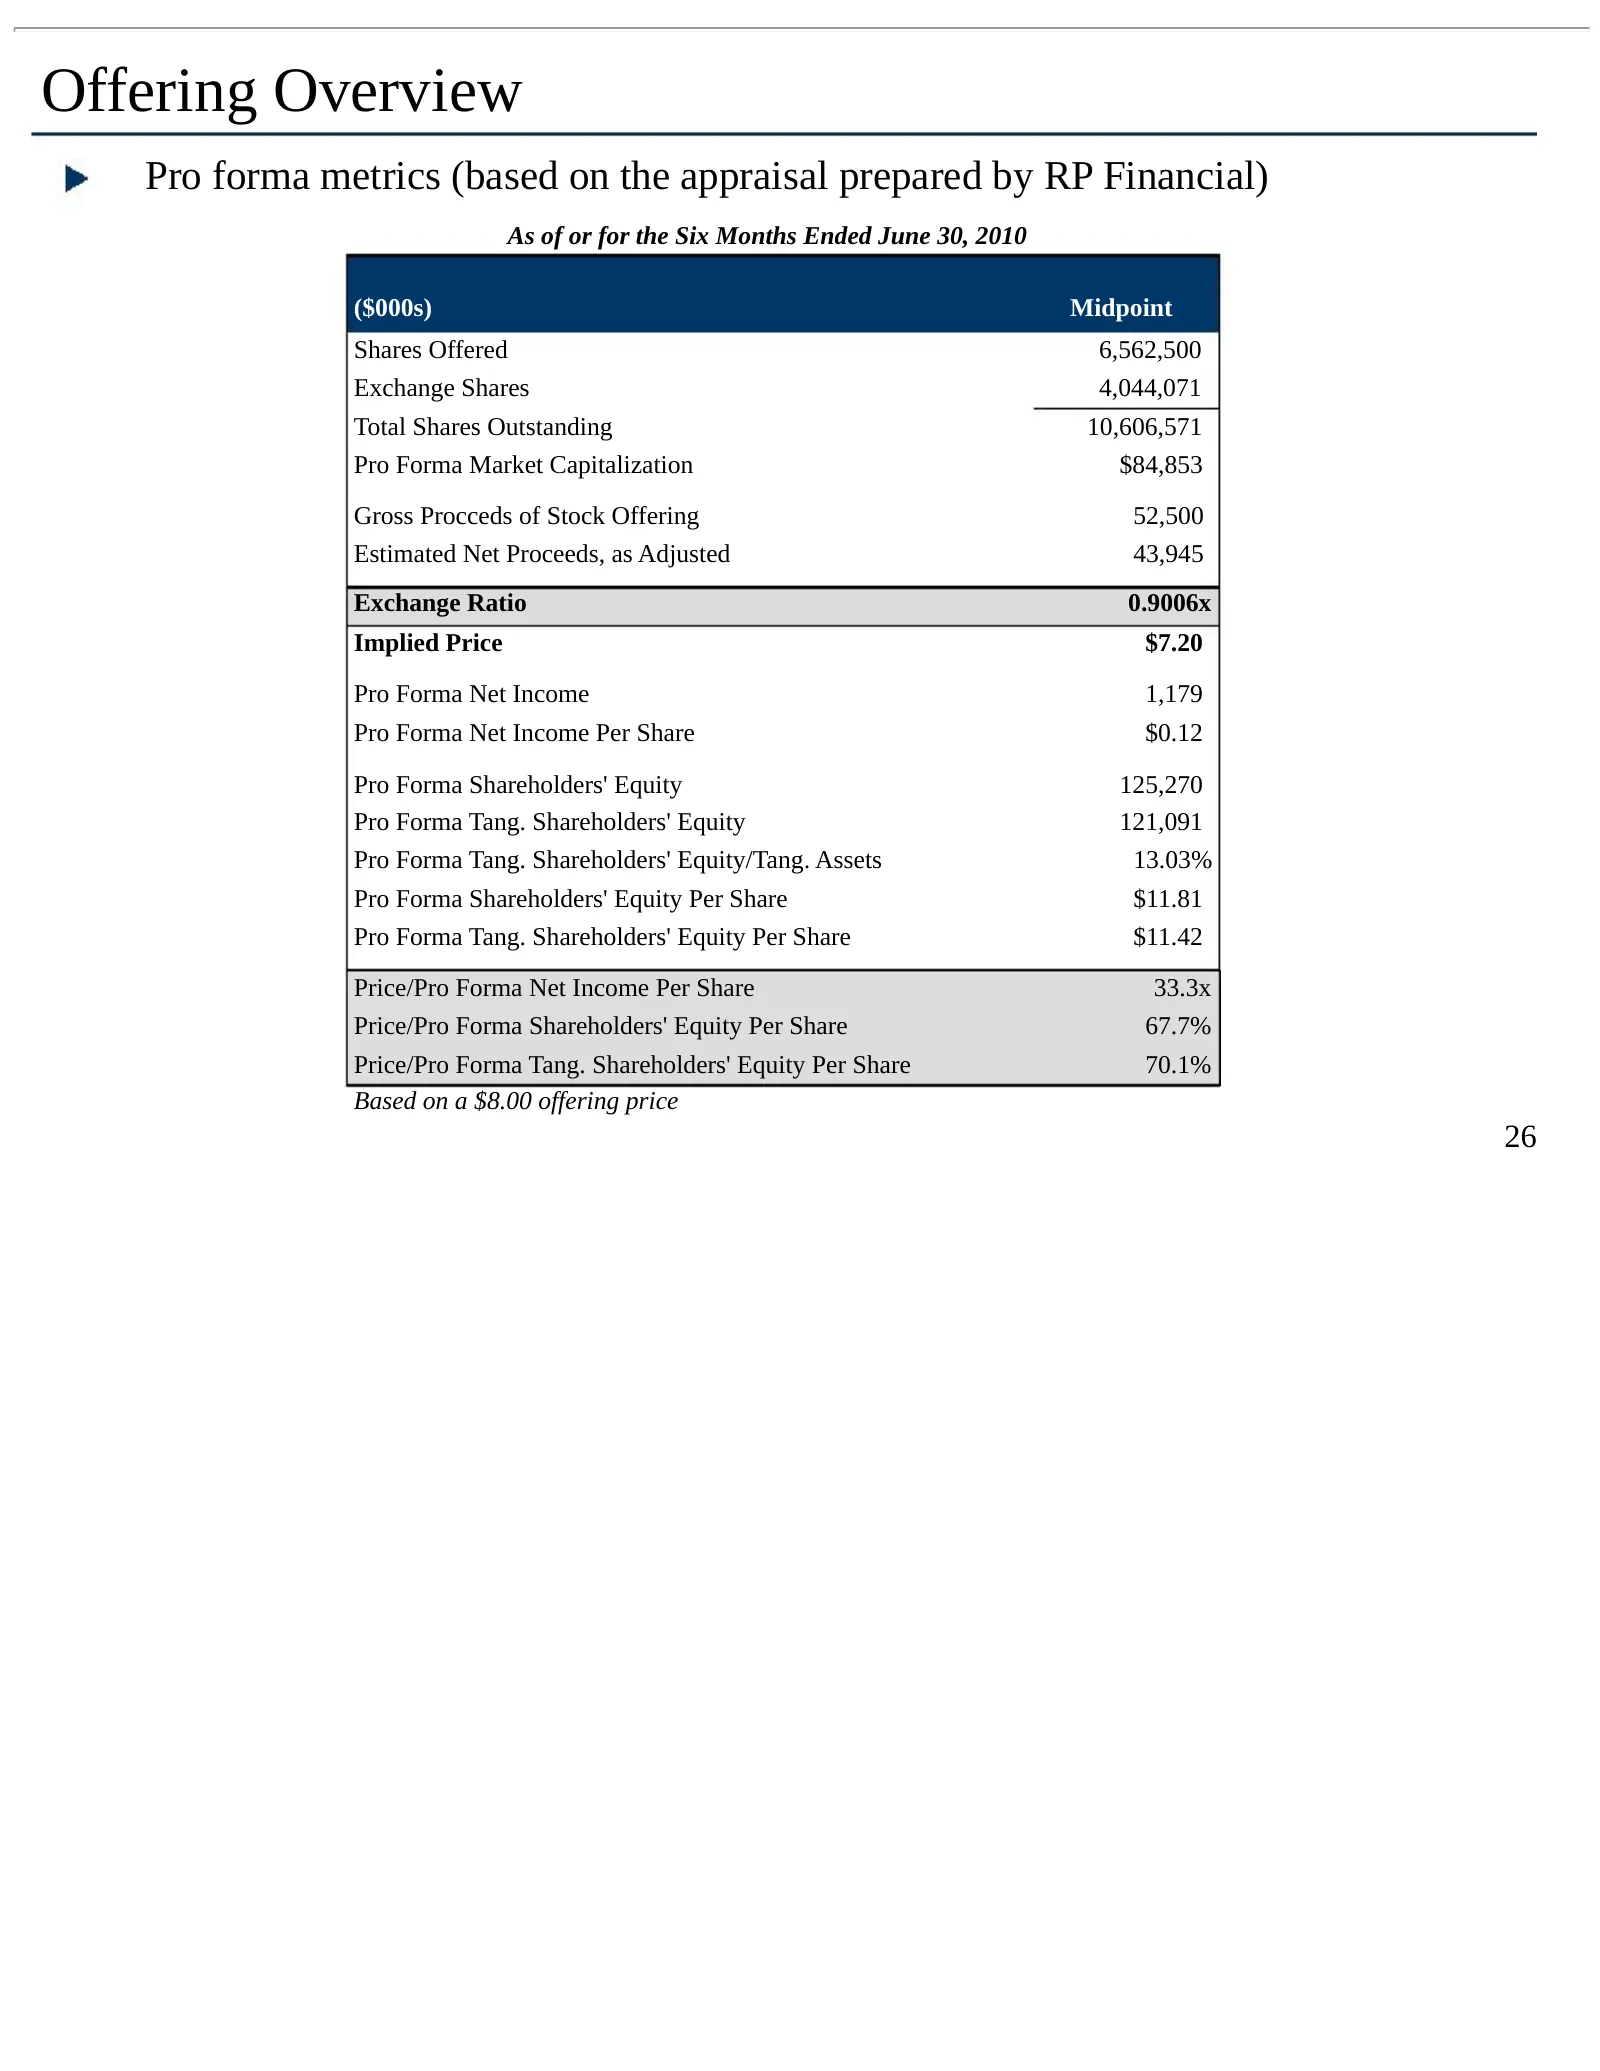
Offering Overview Pro forma metrics (based on the appraisal prepared by RP Financial) As of or for the Six Months Ended June 30, 2010 ($000s) Midpoint Shares Offered 6,562,500 Exchange Shares 4,044,071 Total Shares Outstanding 10,606,571 Pro Forma Market Capitalization $84,853 Gross Procceds of Stoc
Slide 27: Valuation Overview
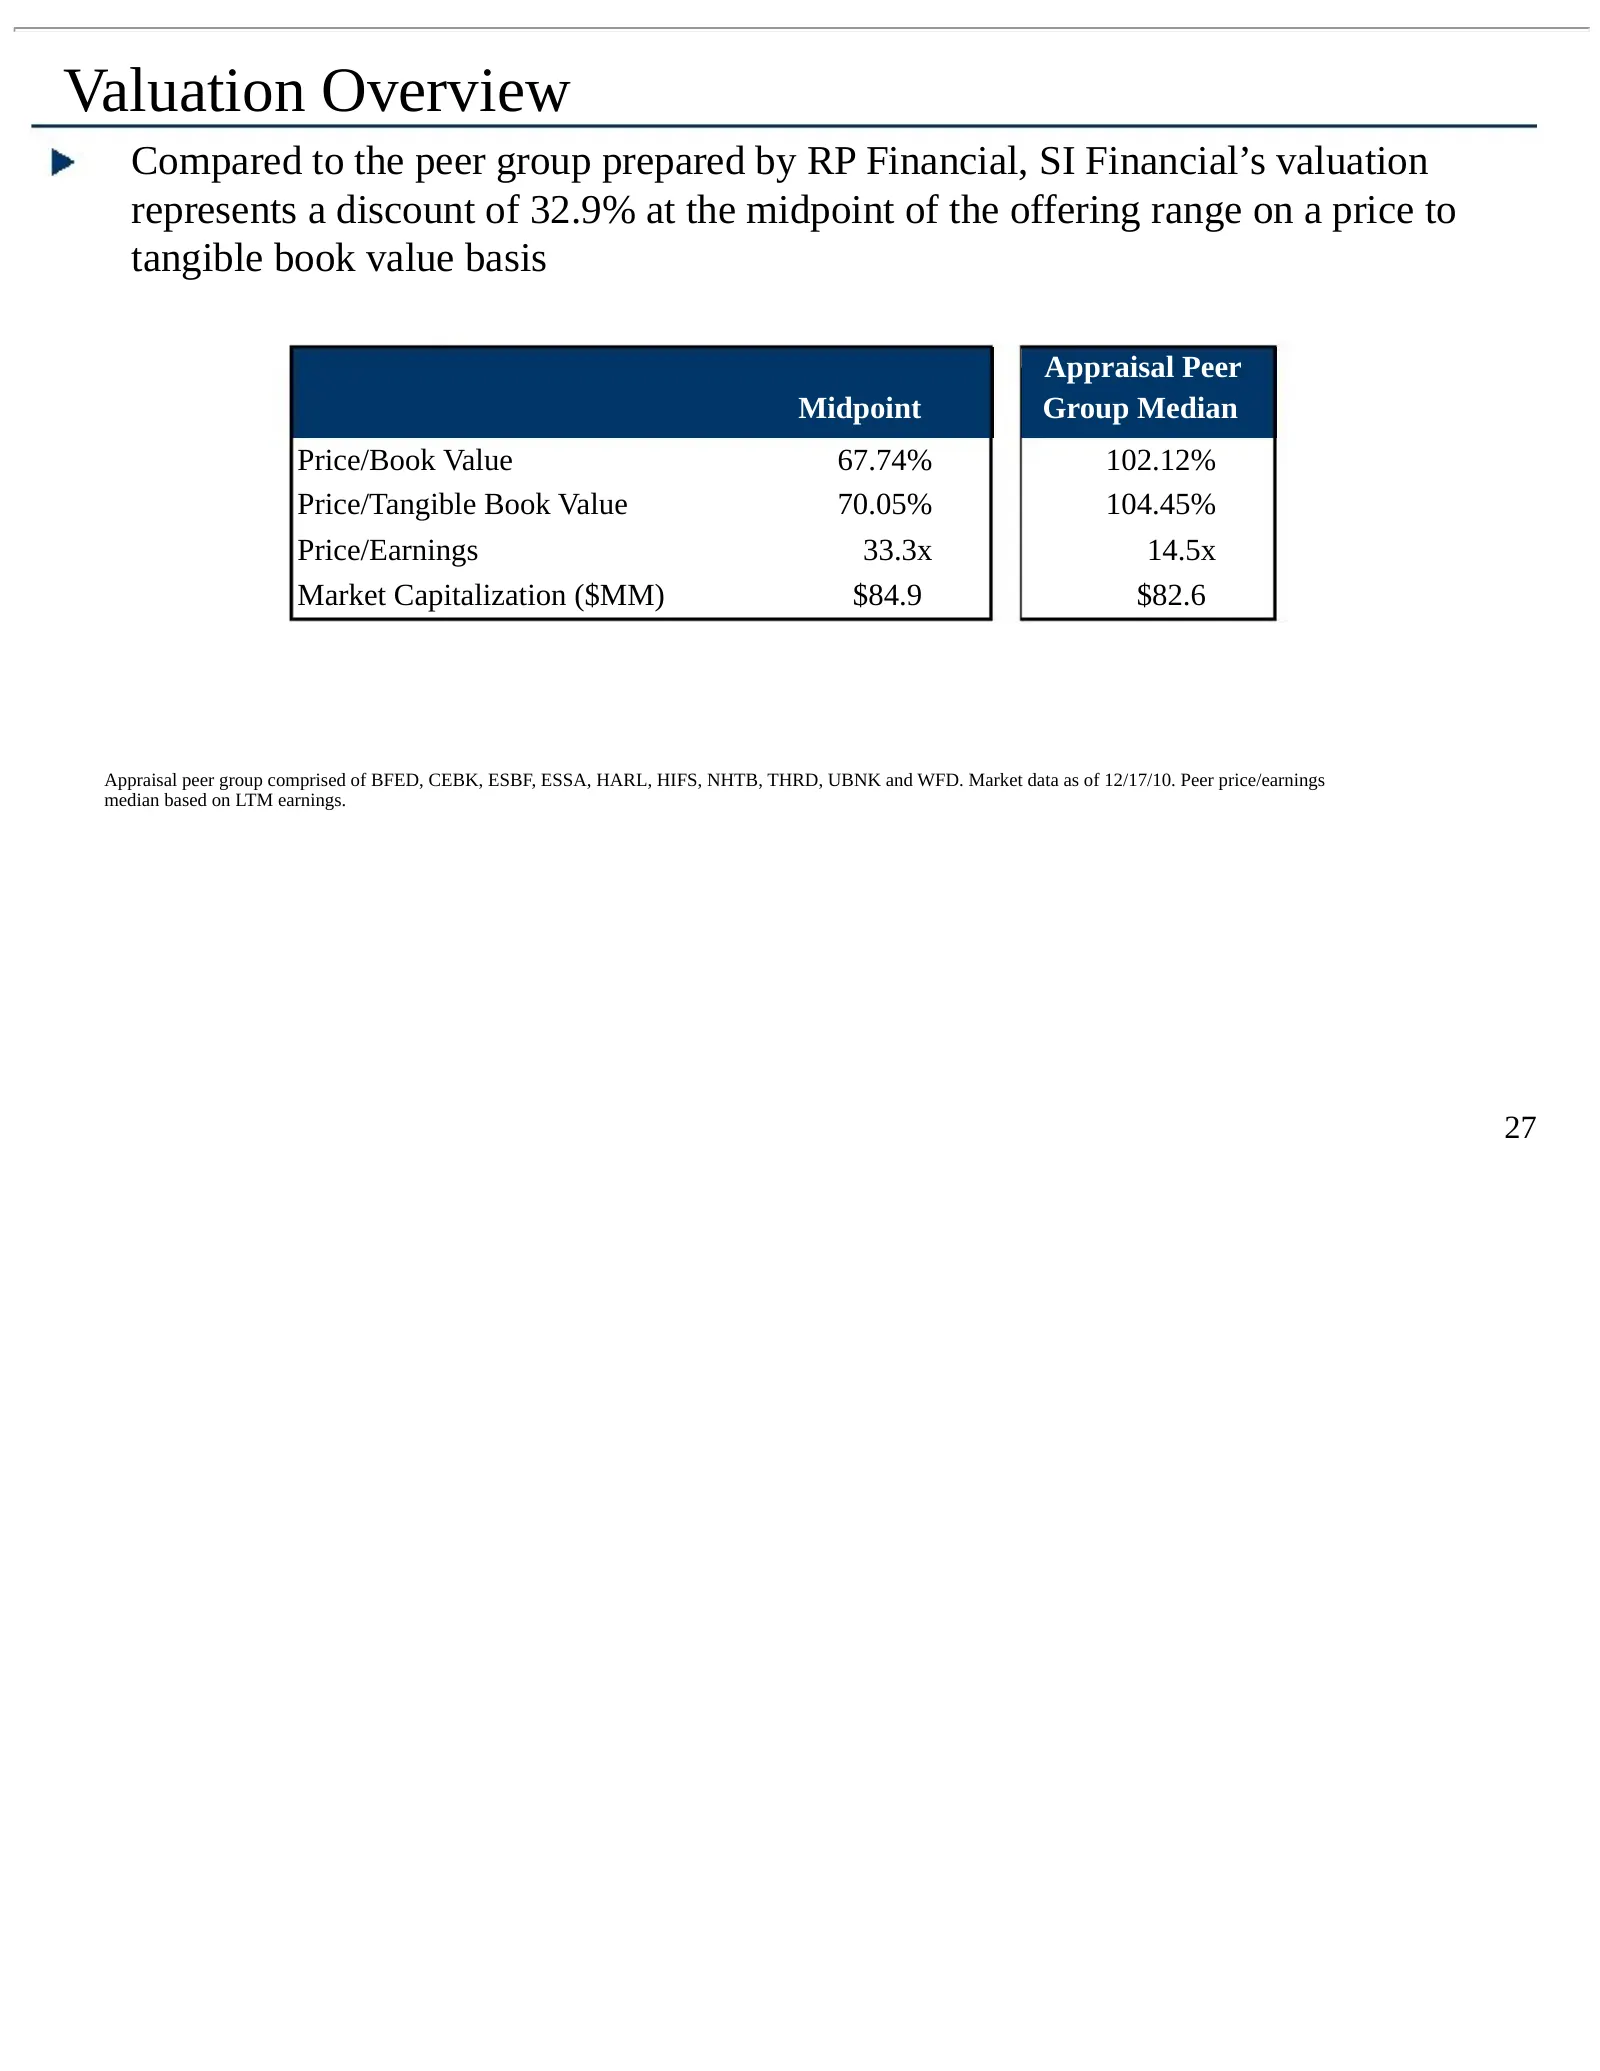
Valuation Overview Compared to the peer group prepared by RP Financial, SI Financial’s valuation represents a discount of 32.9% at the midpoint of the offering range on a price to tangible book value basis Appraisal Peer Midpoint Group Median Price/Book Value 67.74% 102.12% Price/Tangible Book Value
Source: SEC EDGAR · FWP filed Jan 4, 2011
More decks from SI Financial Group Inc
 Merger or Acquisition (December 2018)13 slides · Dec 11, 2018
 Investor Presentation (September 2018)18 slides · Sep 20, 2018
 Shareholder Meeting (May 2018)19 slides · May 9, 2018
 Investor Presentation (May 2017)18 slides · May 10, 2017
 Investor Presentation (May 2016)19 slides · May 11, 2016
 Shareholder Meeting (May 2015)19 slides · May 13, 2015