SI Financial — Investor Presentation (May 2017)
18 slides from SI Financial's investor presentation, May 10, 2017
Slide 1: Forward Looking Statements
2 Forward Looking Statements This presentation may contain forward-looking statements, which can be identified by the use of words such as “believes,” “expects,” “anticipates,” “estimates” or similar expressions. These forward-looking statements include, but are not limited to: statements of our goa
Slide 2: Forward Looking Statements
SI Financial Group, Inc. » Forward Looking Statements This presentation may contain forward-looking statements, which can be identified by the use of words such as “believes,” “expects, “anticipates,” “estimates” or similar expressions. These forward-looking statements include, but are not limited t
Slide 3: Market Summary
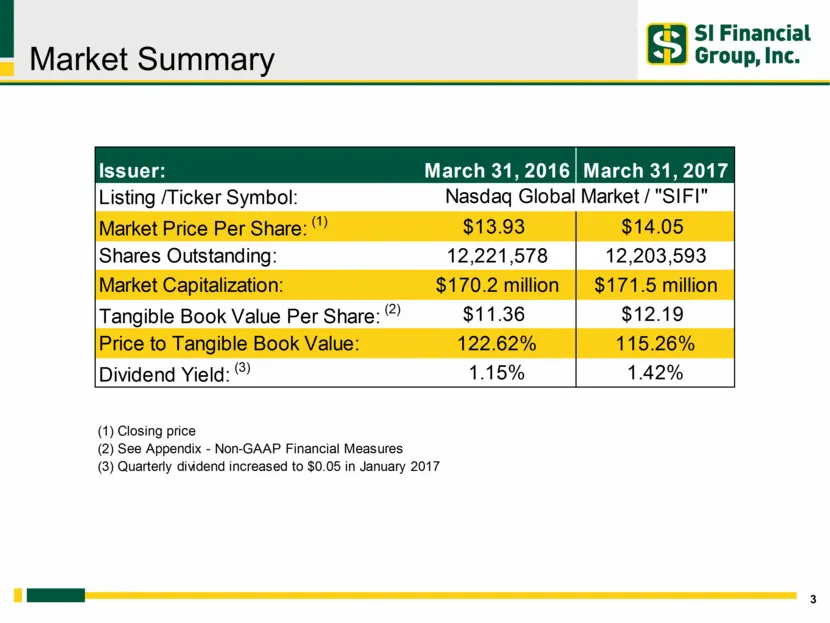
SI Financial Group, Inc. » Market Summary Issuel March 31, 2016 | March 31, 2017 Listing /Ticker Symbol: Nasdaq Global Market /"SIFI" Shares Outstanding: 12,221,578 12,203,593 Tangible Book Value Per Share: ”) $11.36 $12.19 Dividend Yield: 1.15% 142% (1) Closing price (2) See Appendix - Non-GAAP Fin
Slide 4: An Overview of SI Financial
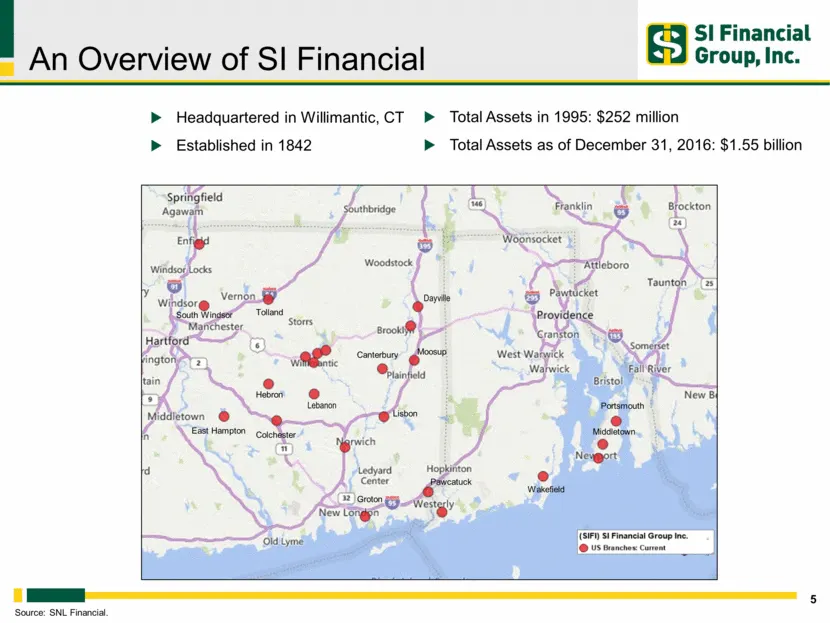
An Overview of SI Financial 5 Headquartered in Willimantic, CT Established in 1842 Source: SNL Financial. Total Assets in 1995: $252 million Total Assets as of December 31, 2016: $1.55 billion Dayville Dayville Canterbury Lisbon Lebanon Groton Hebron Colchester East Hampton Tolland South Windsor Paw
Slide 5: Business Strategy
Business Strategy 6 Community oriented focus with a full range of financial products and services Prudently diversify the asset mix and geographic concentration by selectively increasing the percentage of commercial business loans, multi-family and commercial real estate loans locally and in the New

Slide 6: Assets as of December 31, 2016 - $1.55 billion
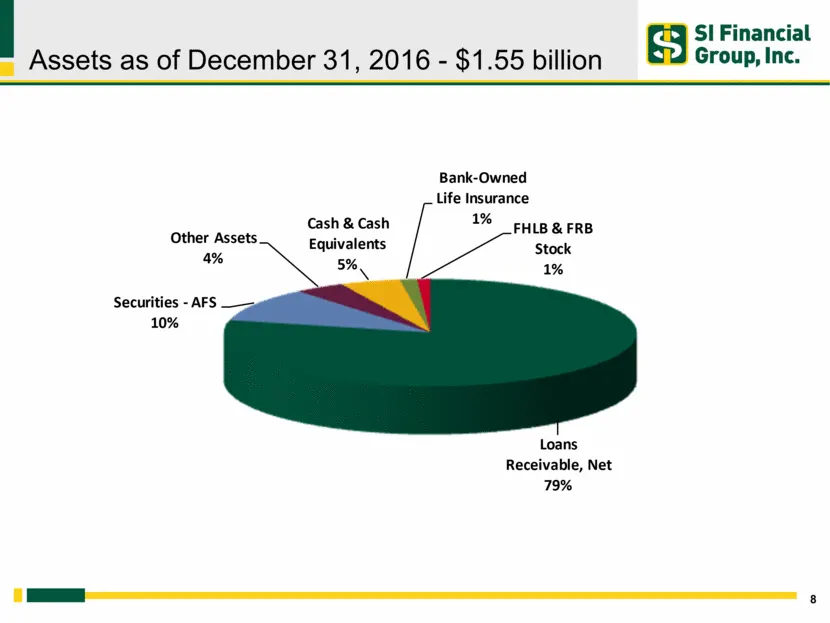
Assets as of December 31, 2016 - $1.55 billion 8
Slide 7: Securities Portfolio Comparison
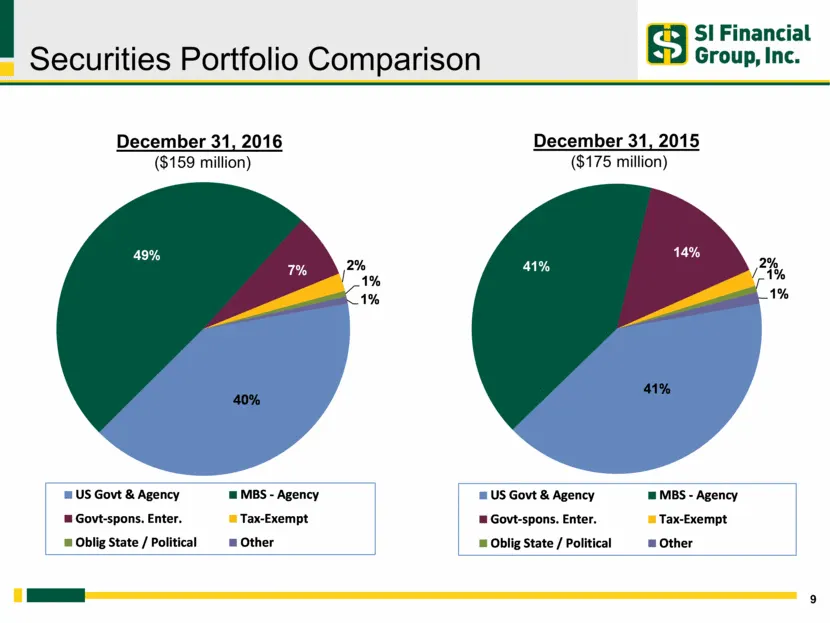
Securities Portfolio Comparison 9 December 31, 2016 ($159 million) December 31, 2015 ($175 million) 41% 41% 14% 2% 1% 1% US Govt & Agency MBS - Agency Govt-spons. Enter. Tax-Exempt Oblig State / Political Other 40% 49% 7% 2% 1% 1% US Govt & Agency MBS - Agency Govt-spons. Enter. Tax-Exempt Oblig Sta
Slide 8: Loan Portfolio Comparison
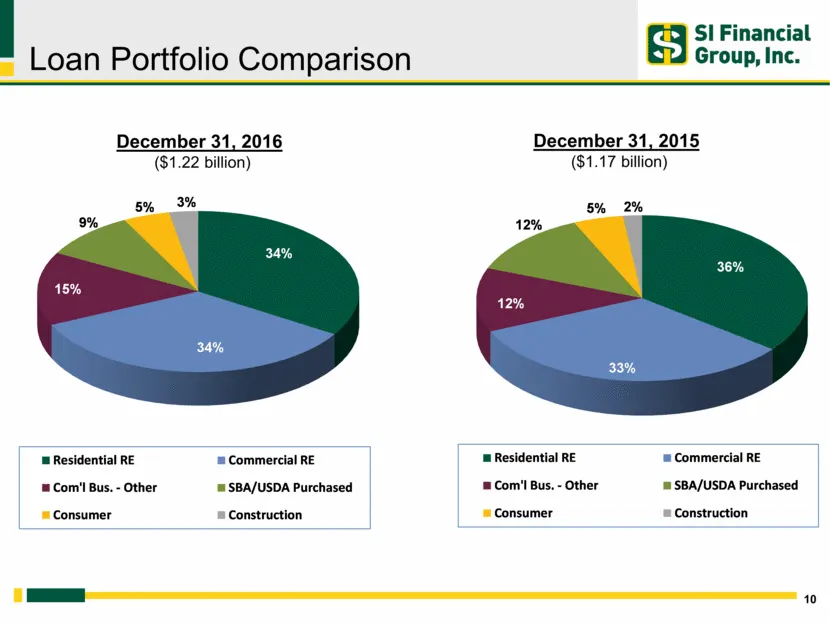
Loan Portfolio Comparison 10 December 31, 2016 ($1.22 billion) December 31, 2015 ($1.17 billion) 34% 34% 15% 9% 5% 3% Residential RE Commercial RE Com'l Bus. - Other SBA/USDA Purchased Consumer Construction 36% 33% 12% 12% 5% 2% Residential RE Commercial RE Com'l Bus. - Other SBA/USDA Purchased Cons
Slide 9: Asset Quality
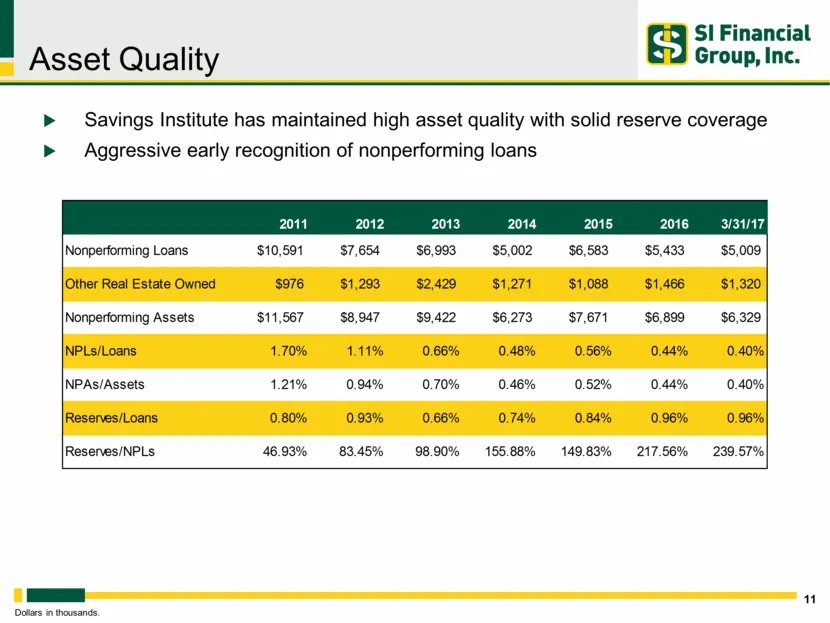
Asset Quality 11 Savings Institute has maintained high asset quality with solid reserve coverage Aggressive early recognition of nonperforming loans Dollars in thousands.
Slide 10: Deposits
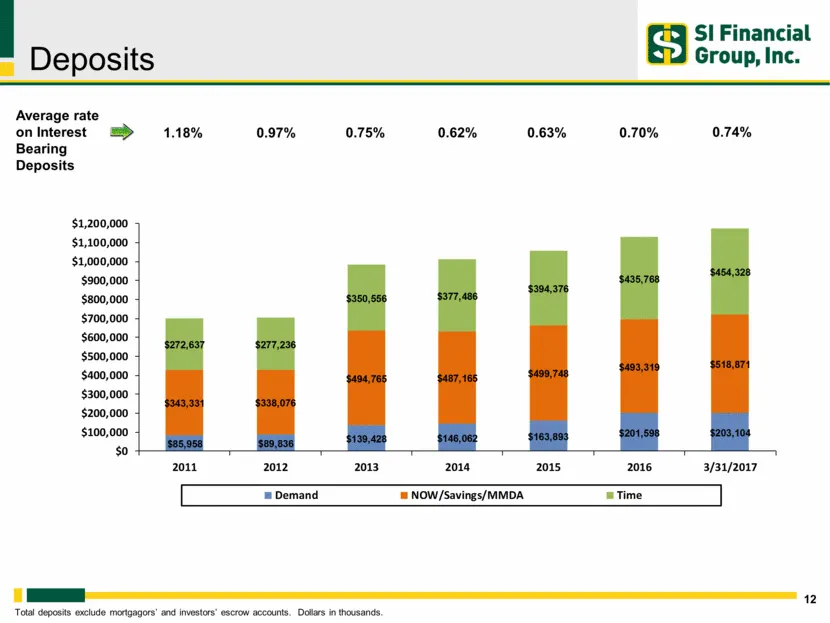
Deposits 12 Total deposits exclude mortgagors’ and investors’ escrow accounts. Dollars in thousands. Average rate on Interest Bearing Deposits 0.97% 1.18% 0.75% 0.70% 0.63% 0.62% 0.74%
Slide 11: Deposits
SI Financial Group, Inc. Deposits Average rate oninterest => 1.18% 0.97% 0.75% 0.62% 0.63% 0.70% 0.74% Bearing Deposits $1,200,000 $1,100,000 $1,000,000 $900,000 $800,000 $700,000 $600,000 $500,000 $400,000 $300,000 $200,000 $100,000 $0 2012 2013 2014 3/31/2017 = Demand = NOW/Savings/MMDA_ me Time i
Slide 12: Operating Results
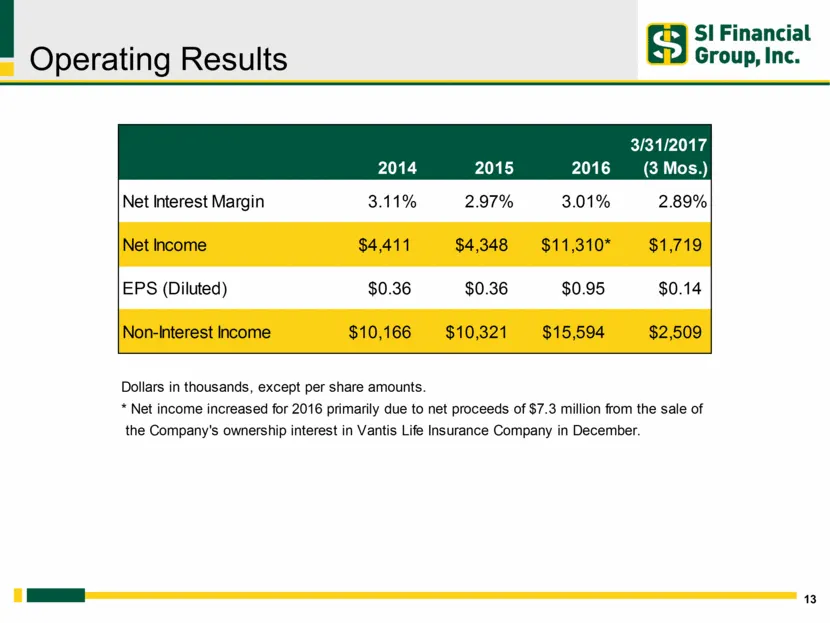
SI Financial Group, Inc. ~ Operating Results 3/31/2017 2014 2015 2016 (3 Mos.) Net Interest Margin 3.11% 2.97% 3.01% 2.89% EPS (Diluted) $0.36 $0.36 $0.95 $0.14 Dollars in thousands, except per share amounts. * Net income increased for 2016 primarily due to net proceeds of $7.3 million from the sale
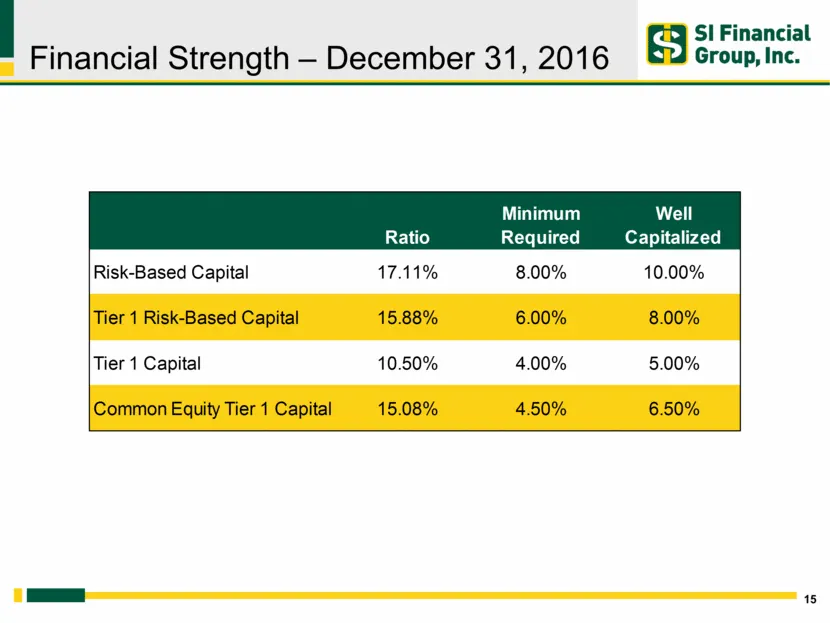
Slide 13: Financial Strength – December 31, 2016
Financial Strength – December 31, 2016 15
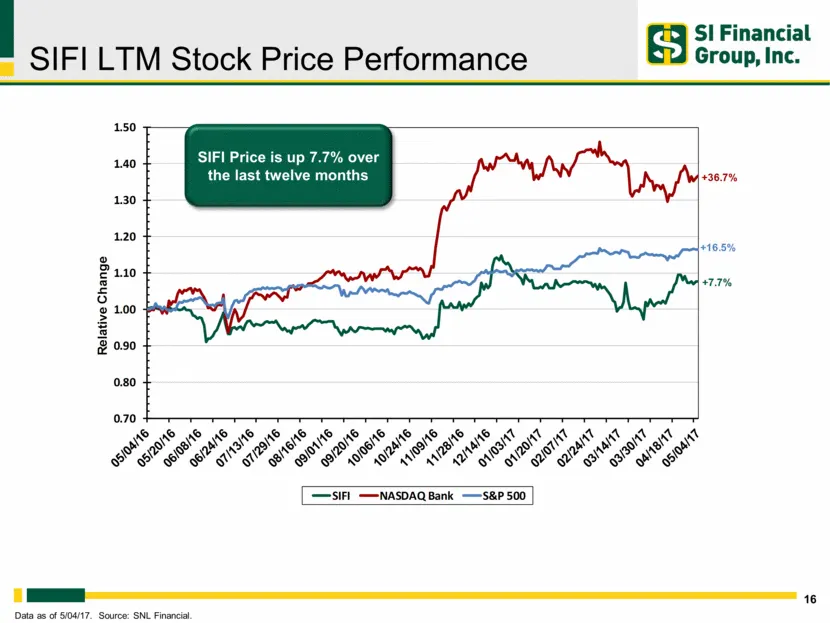
Slide 14: SIFI LTM Stock Price Performance
SIFI LTM Stock Price Performance 16 Data as of 5/04/17. Source: SNL Financial. SIFI Price is up 7.7% over the last twelve months
Slide 15: Appendix – Non-GAAP Financial Measures
Appendix – Non-GAAP Financial Measures
Slide 16: Non-GAAP Financial Measures
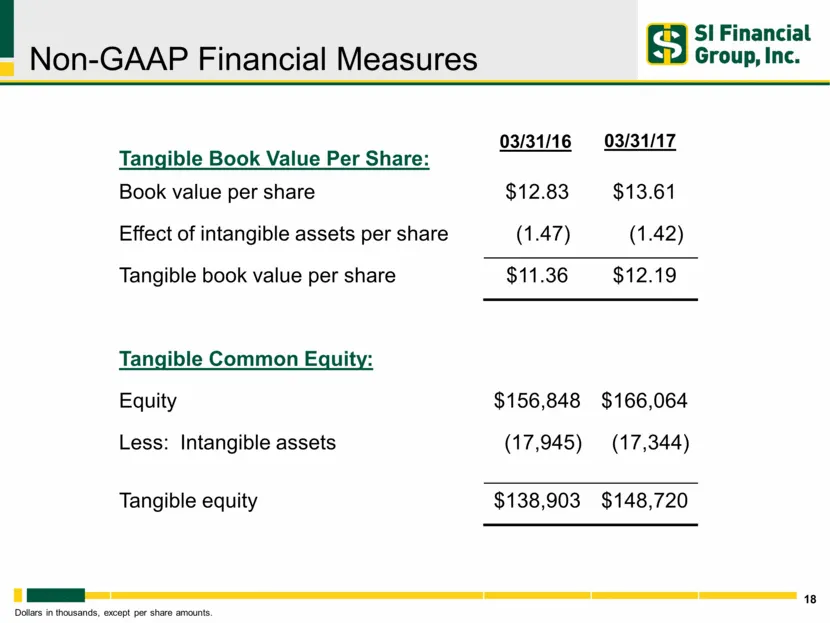
Non-GAAP Financial Measures 18 Tangible Book Value Per Share: 12 Book value per share $12.83 $13.61 Effect of intangible assets per share (1.47) (1.42) Tangible book value per share $11.36 $12.19 Tangible Common Equity: Equity $156,848 $166,064 Less: Intangible assets (17,945) (17,344) Tangible equi
Slide 17: Non-GAAP Financial Measures
SI Financial Group, Inc. = Non-GAAP Financial Measures 03/31/16 03/34/17 Tangible Book Value Per Share: Book value per share $12.83 $13.61 Effect of intangible assets per share (1.47) (1.42) Tangible book value per share $11.36 $12.19 Tangible Common Equity: Equity $156,848 $166,064 Less: Intangible
Slide 18: Questions & Answers
QUESTIONS & ANSWERS Hf SI Financial > Group, Inc.
Source: SEC EDGAR · 8-K filed May 10, 2017
More decks from SI Financial Group Inc
 Merger or Acquisition (December 2018)13 slides · Dec 11, 2018
 Investor Presentation (September 2018)18 slides · Sep 20, 2018
 Shareholder Meeting (May 2018)19 slides · May 9, 2018
 Investor Presentation (May 2016)19 slides · May 11, 2016
 Shareholder Meeting (May 2015)19 slides · May 13, 2015
 Sterne Agee Investor Conference 201520 slides · Feb 12, 2015