SI Financial — Shareholder Meeting (May 2018)
19 slides from SI Financial's shareholder meeting presentation, May 9, 2018
Slide 1: Annual Shareholders' Meeting May 9, 2018
Annual Shareholders’ Meeting May 9, 2018
Slide 2: Forward Looking Statements
2 Forward Looking Statements This presentation may contain forward-looking statements, which can be identified by the use of words such as “believes,” “expects,” “anticipates,” “estimates” or similar expressions. These forward-looking statements include, but are not limited to: statements of our g
Slide 3: Market Summary
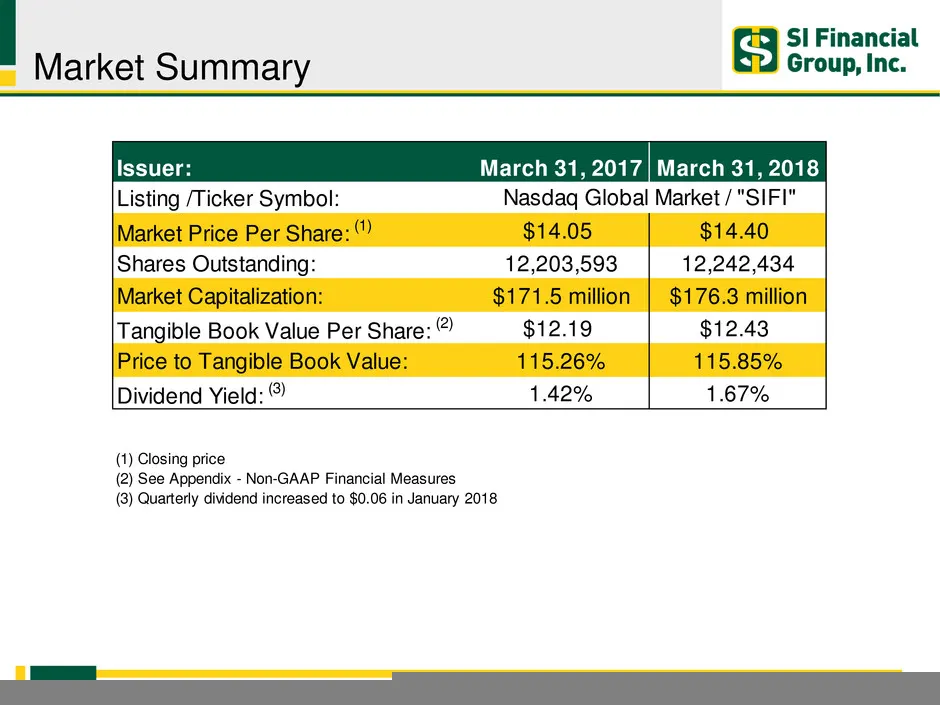
Market Summary 3 Issuer: March 31, 2017 March 31, 2018 Listing /Ticker Symbol: Market Price Per Share: (1) $14.05 $14.40 Shares Outstanding: 12,203,593 12,242,434 Market Capitalization: $171.5 million $176.3 million Tangible Book Value Per Share: (2) $12.19 $12.43 Price to Tangible Book Value: 115.2
Slide 4: Company Overview
{} SI Financial > Group, Inc. Company Overview
Slide 5: An Overview of SI Financial
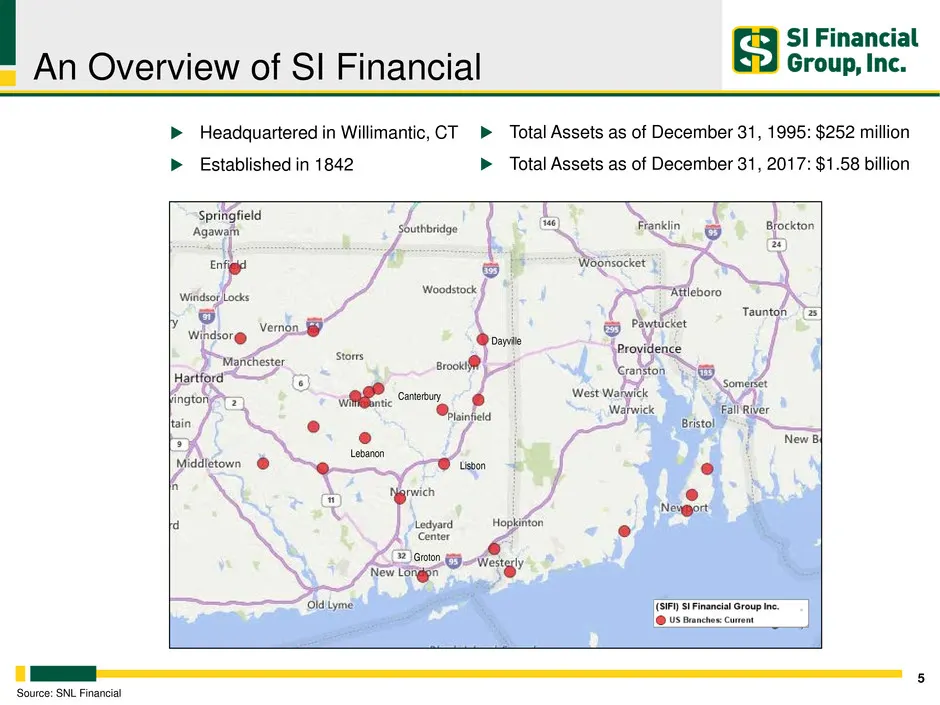
An Overview of SI Financial 5 Headquartered in Willimantic, CT Established in 1842 Source: SNL Financial Total Assets as of December 31, 1995: $252 million Total Assets as of December 31, 2017: $1.58 billion Dayville Dayville Canterbury Lisbon Lebanon Groton
Slide 6: Business Strategy
Business Strategy 6 Community oriented focus with a full range of financial products and services Prudently diversify the asset mix and geographic concentration by selectively increasing the percentage of commercial business, multi-family and commercial real estate loans locally and throughout N
Slide 7: Financial Highlights
{} SI Financial > Group, Inc. Financial Highlights
Slide 8: Improving Profitability: Core Income & Core ROAA
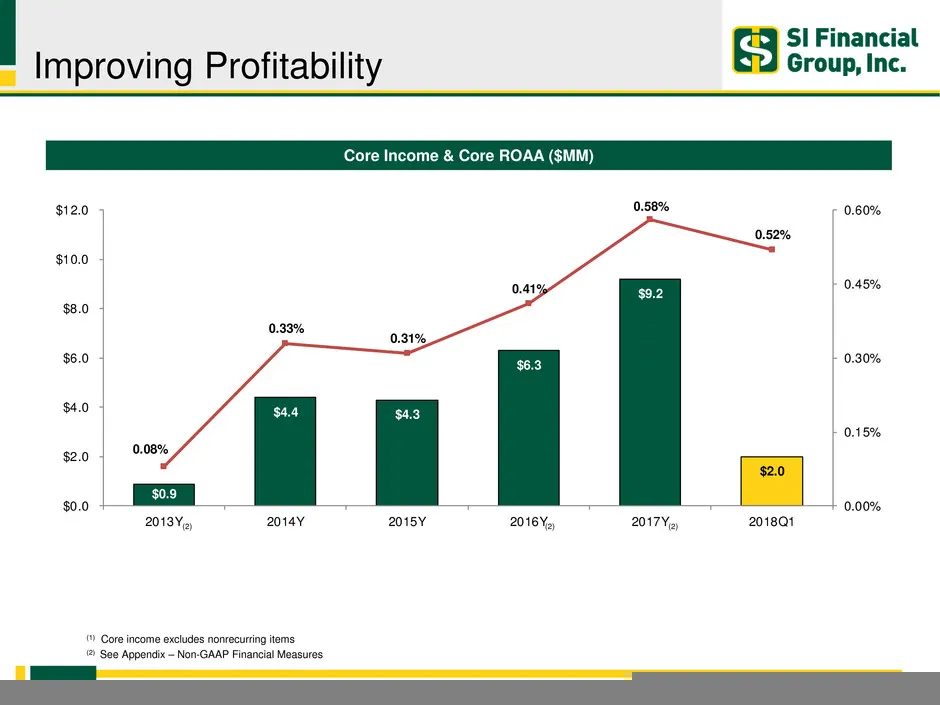
$0.9 $4.4 $4.3 $6.3 $9.2 $2.0 0.08% 0.33% 0.31% 0.41% 0.58% 0.52% 0.00% 0.15% 0.30% 0.45% 0.60% $0.0 $2.0 $4.0 $6.0 $8.0 $10.0 $12.0 2013Y 2014Y 2015Y 2016Y 2017Y 2018Q1 Improving Profitability 8 Core Income & Core ROAA ($MM) (1) Core income excludes nonrecurring items (2) See Appendix – Non-GAAP Fi
Slide 9: Improving Profitability: Net Interest Margin
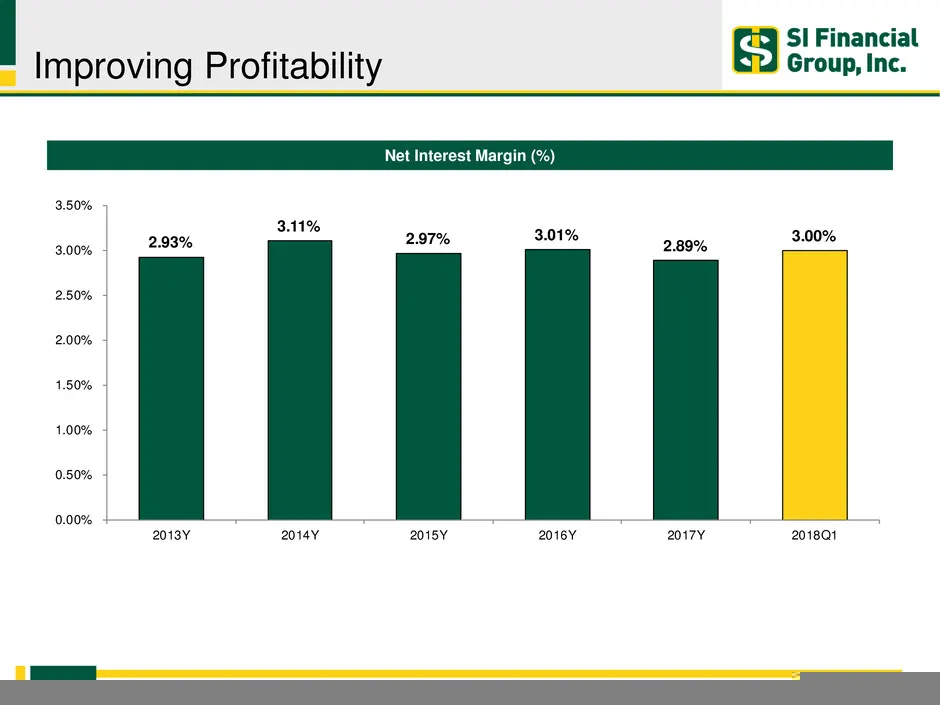
Improving Profitability 9 Net Interest Margin (%) 2.93% 3.11% 2.97% 3.01% 2.89% 3.00% 0.00% 0.50% 1.00% 1.50% 2.00% 2.50% 3.00% 3.50% 2013Y 2014Y 2015Y 2016Y 2017Y 2018Q1
Slide 10: Improving Profitability: Efficiency Ratio
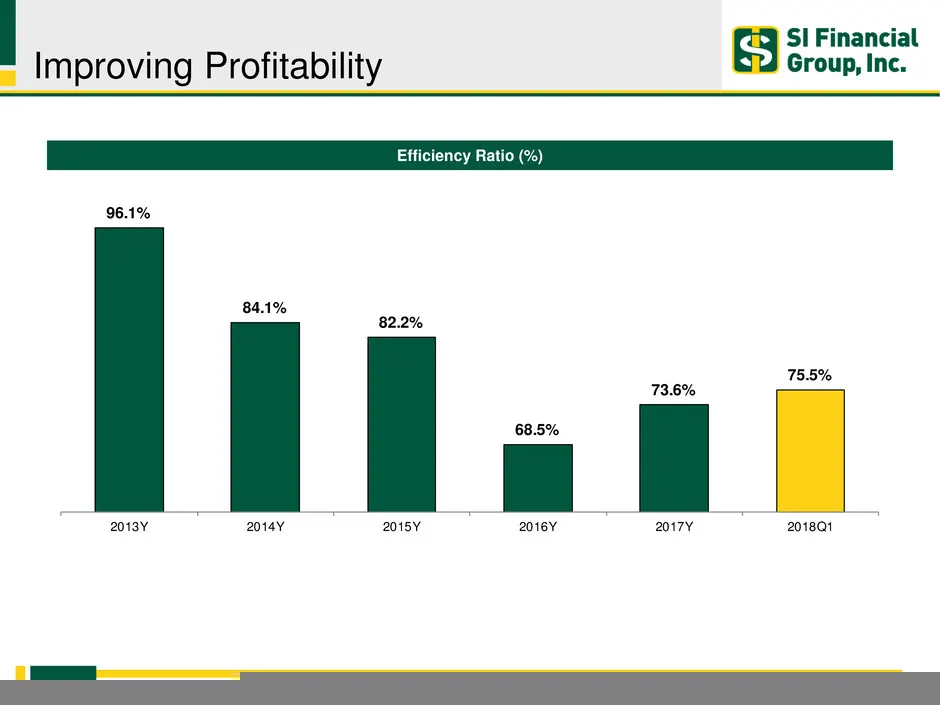
Improving Profitability 10 Efficiency Ratio (%) 96.1% 84.1% 82.2% 68.5% 73.6% 75.5% 2013Y 2014Y 2015Y 2016Y 2017Y 2018Q1
Slide 11: Consistent Loan Growth
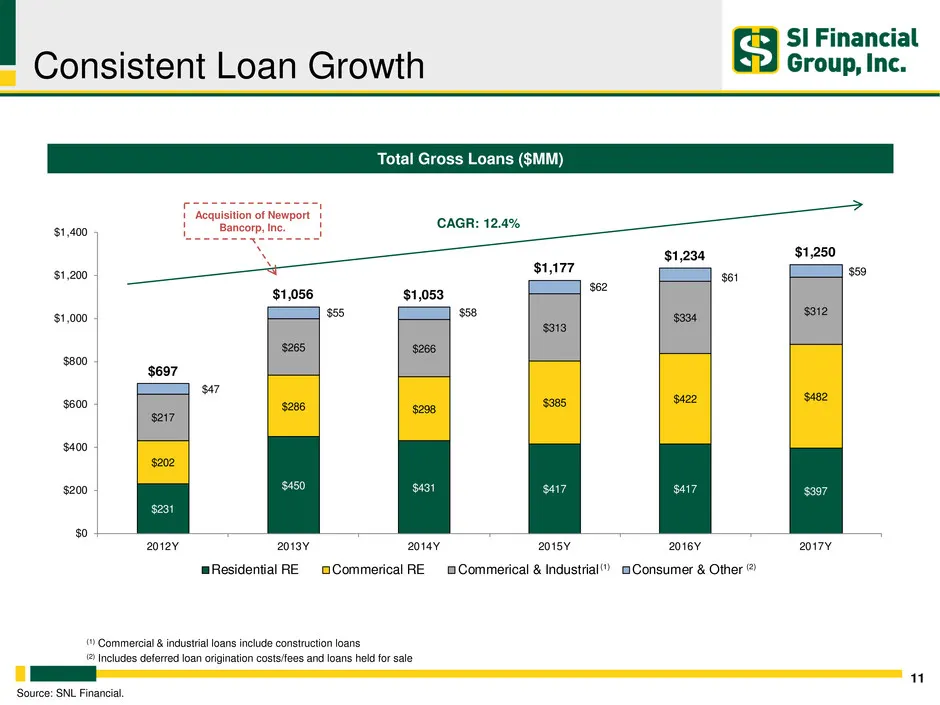
$231 $450 $431 $417 $417 $397 $202 $286 $298 $385 $422 $482 $217 $265 $266 $313 $334 $312 $47 $55 $58 $62 $61 $59 $697 $1,056 $1,053 $1,177 $1,234 $1,250 $0 $200 $400 $600 $800 $1,000 $1,200 $1,400 2012Y 2013Y 2014Y 2015Y 2016Y 2017Y Residential RE Commerical RE Commerical & Industrial Consumer & Ot
Slide 12: Strong Loan Growth
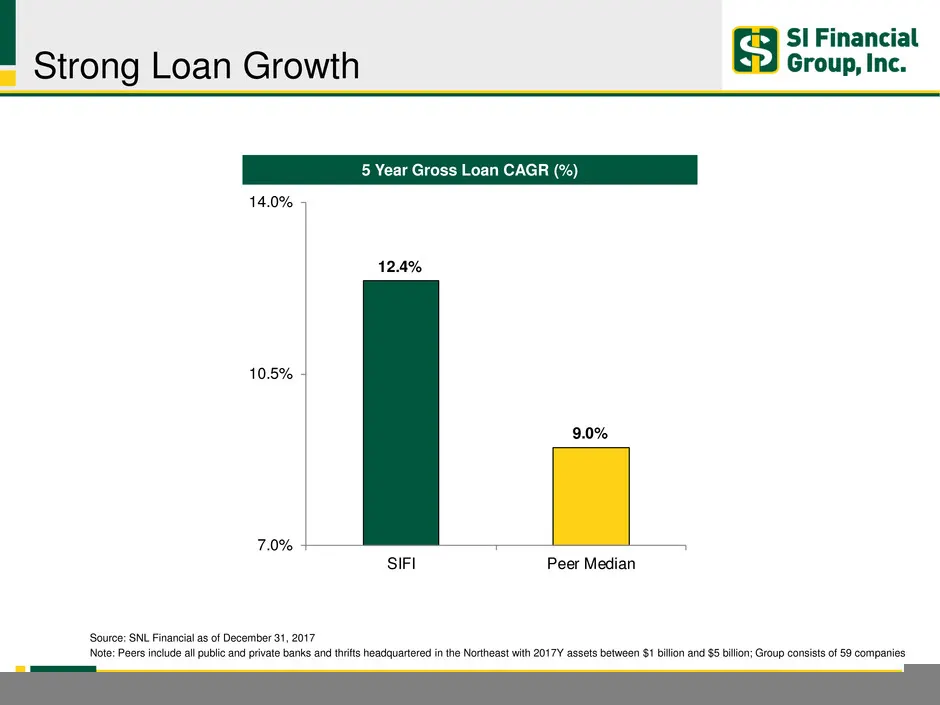
Strong Loan Growth 12 5 Year Gross Loan CAGR (%) Source: SNL Financial as of December 31, 2017 Note: Peers include all public and private banks and thrifts headquartered in the Northeast with 2017Y assets between $1 billion and $5 billion; Group consists of 59 companies 12.4% 9.0% 7.0% 10.5% 14.0% S
Slide 13: Consistent Deposit Growth
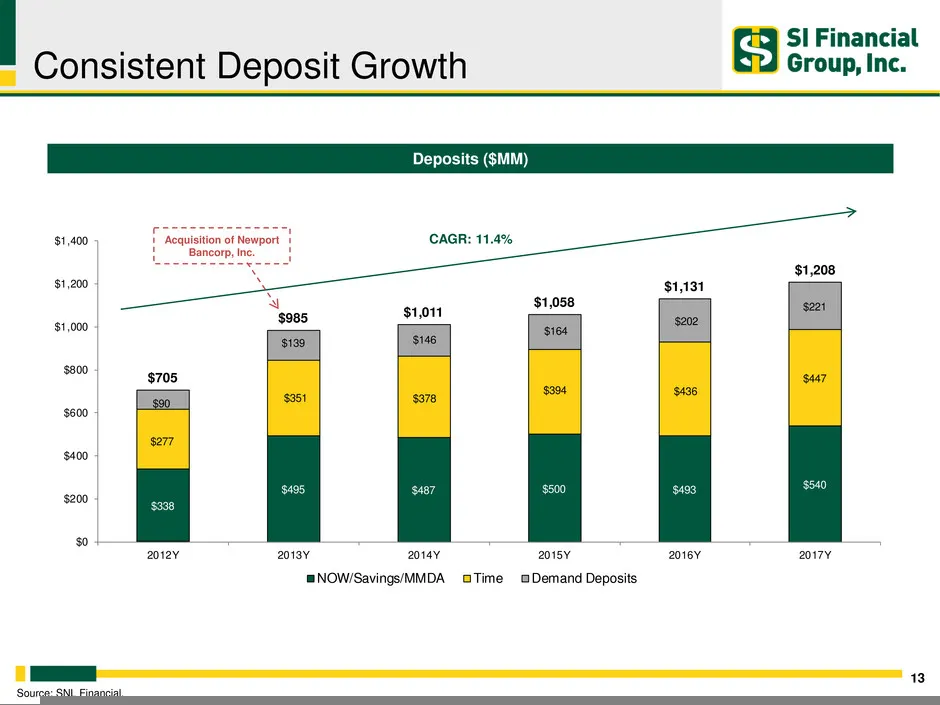
$338 $495 $487 $500 $493 $540 $277 $351 $378 $394 $436 $447 $90 $139 $146 $164 $202 $221 $705 $985 $1,011 $1,058 $1,131 $1,208 $0 $200 $400 $600 $800 $1,000 $1,200 $1,400 2012Y 2013Y 2014Y 2015Y 2016Y 2017Y NOW/Savings/MMDA Time Demand Deposits Consistent Deposit Growth 13 CAGR: 11.4% Acquisition of
Slide 14: Strong Deposit Growth
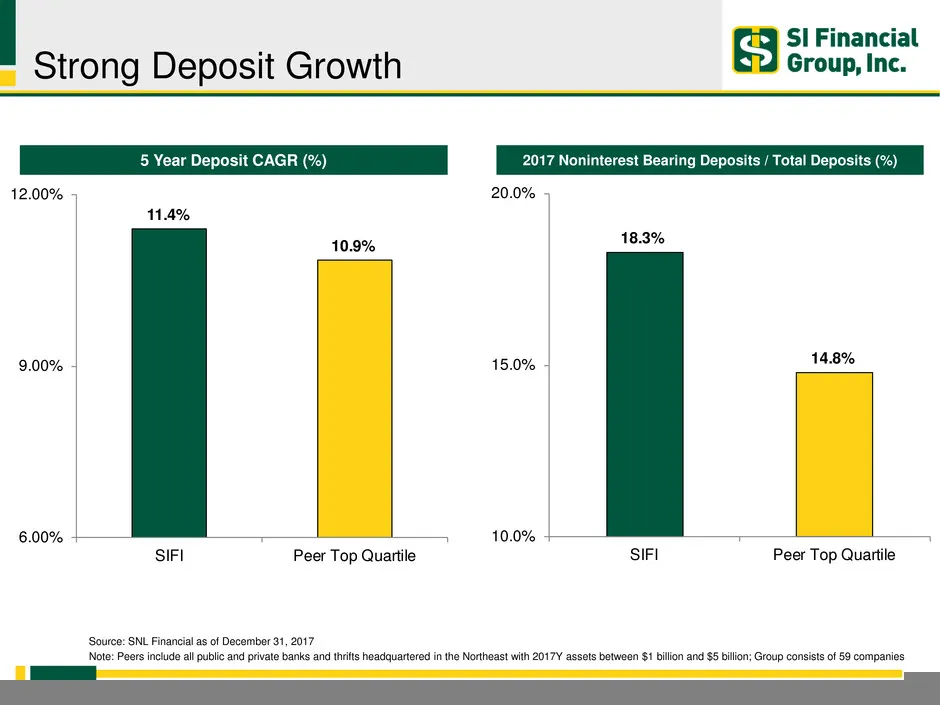
Strong Deposit Growth 14 2017 Noninterest Bearing Deposits / Total Deposits (%) 5 Year Deposit CAGR (%) Source: SNL Financial as of December 31, 2017 Note: Peers include all public and private banks and thrifts headquartered in the Northeast with 2017Y assets between $1 billion and $5 billion; Group
Slide 15: Strong Asset Quality
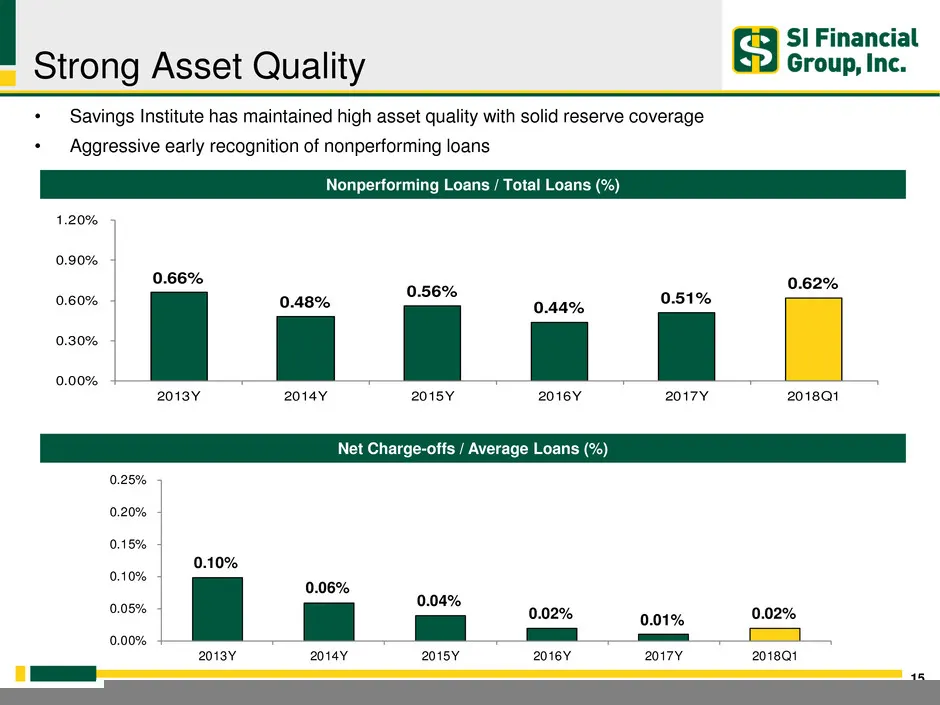
Strong Asset Quality 15 Nonperforming Loans / Total Loans (%) Net Charge-offs / Average Loans (%) • Savings Institute has maintained high asset quality with solid reserve coverage • Aggressive early recognition of nonperforming loans 0.66% 0.48% 0.56% 0.44% 0.51% 0.62% 0.00% 0.30% 0.60% 0.90% 1.20%
Slide 16: Financial Strength – December 31, 2017
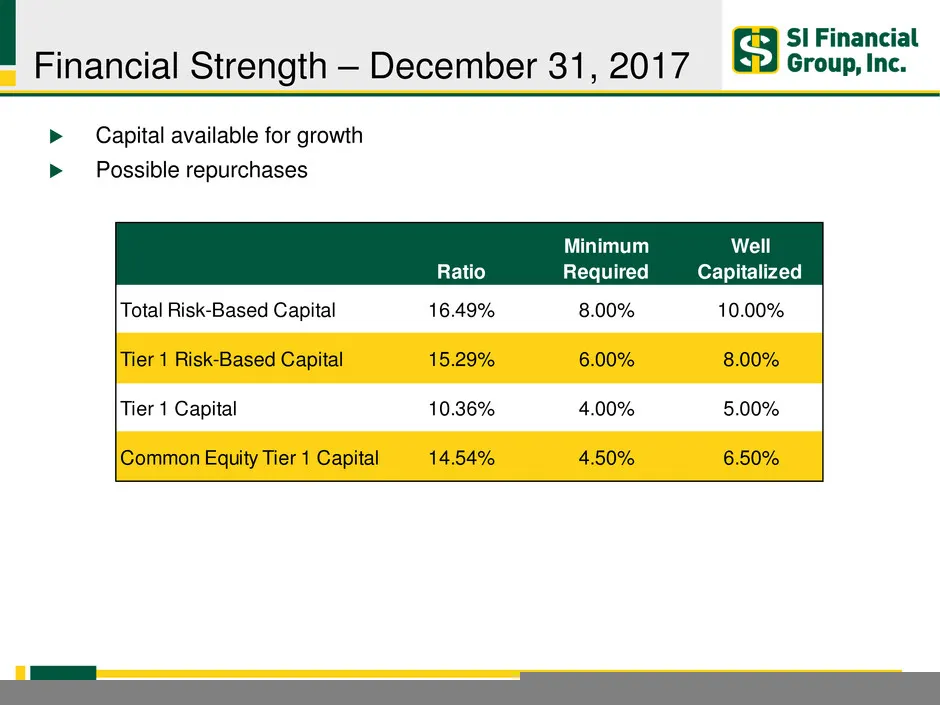
Financial Strength – December 31, 2017 16 Capital available for growth Possible repurchases Ratio Minimum Required Well Capitalized Total Risk-Based Capital 16.49% 8.00% 10.00% Tier 1 Risk-Based Capital 15.29% 6.00% 8.00% Tier 1 Capital 10.36% 4.00% 5.00% Common Equity Tier 1 Capital 14.54% 4.50
Slide 17: Appendix – Non-GAAP Financial Measures
Appendix – Non-GAAP Financial Measures
Slide 18: Non-GAAP Financial Measures
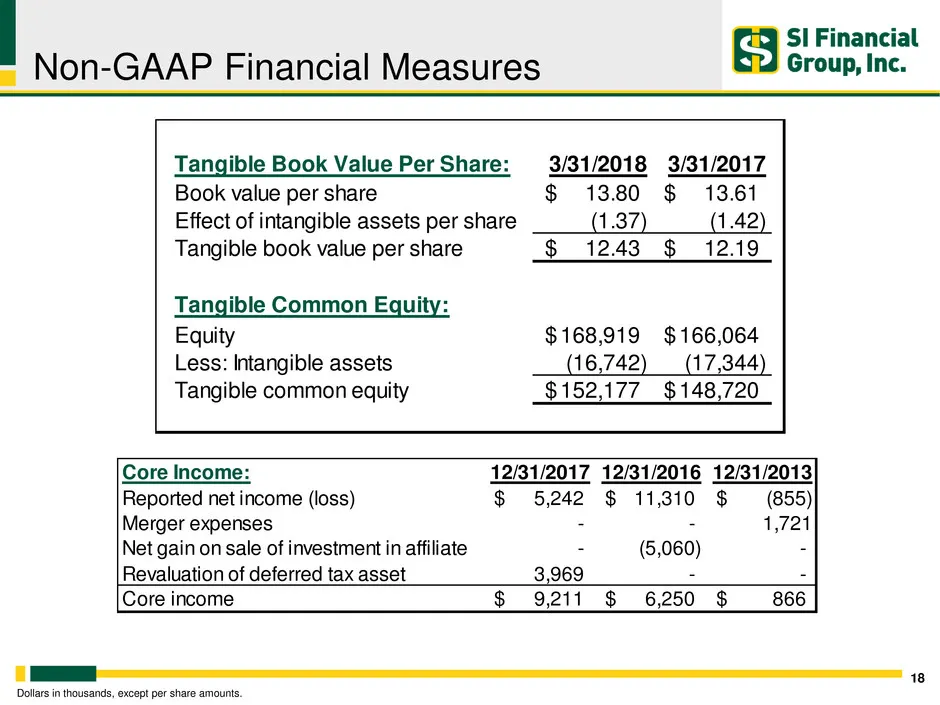
Non-GAAP Financial Measures 18 Dollars in thousands, except per share amounts. Core Income: 12/31/2017 12/31/2016 12/31/2013 Reported net income (loss) 5,242$ 11,310$ (855)$ Merger expenses - - 1,721 Net gain on sale of investment in affiliate - (5,060) - Revaluation of deferred tax asset 3,969 - -
Slide 19: Questions & Answers
QUESTIONS & ANSWERS ty Si Financial > Group, Inc.
Source: SEC EDGAR · 8-K filed May 9, 2018
More decks from SI Financial Group Inc
 Merger or Acquisition (December 2018)13 slides · Dec 11, 2018
 Investor Presentation (September 2018)18 slides · Sep 20, 2018
 Investor Presentation (May 2017)18 slides · May 10, 2017
 Investor Presentation (May 2016)19 slides · May 11, 2016
 Shareholder Meeting (May 2015)19 slides · May 13, 2015
 Sterne Agee Investor Conference 201520 slides · Feb 12, 2015