SI Financial — Investor Presentation (May 2016)
19 slides from SI Financial's investor presentation, May 11, 2016
Slide 1: Forward Looking Statements
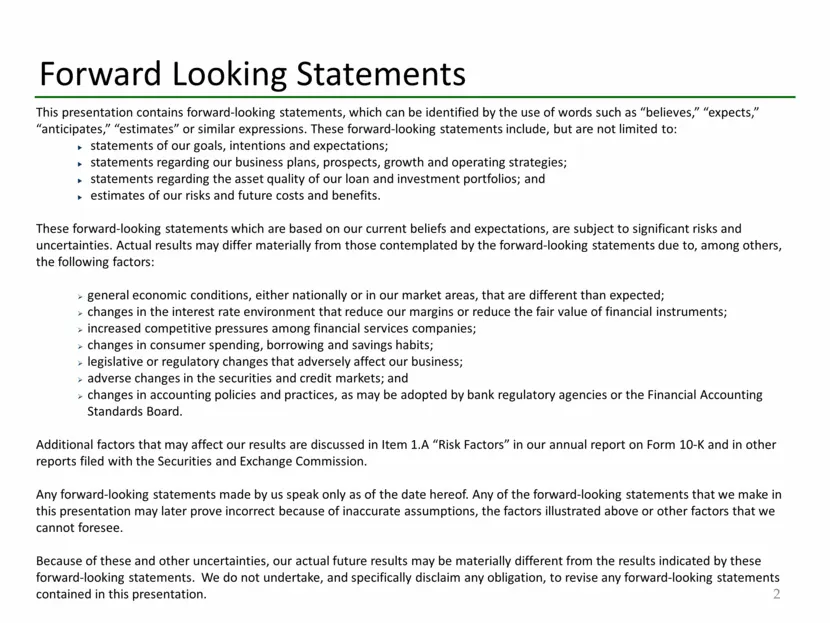
Forward Looking Statements This presentation contains forward-looking statements, which can be identified by the use of words such as “believes,” “expects,” “anticipates,” “estimates” or similar expressions. These forward-looking statements include, but are not limited to: statements of our goals, i
Slide 2: Market Summary
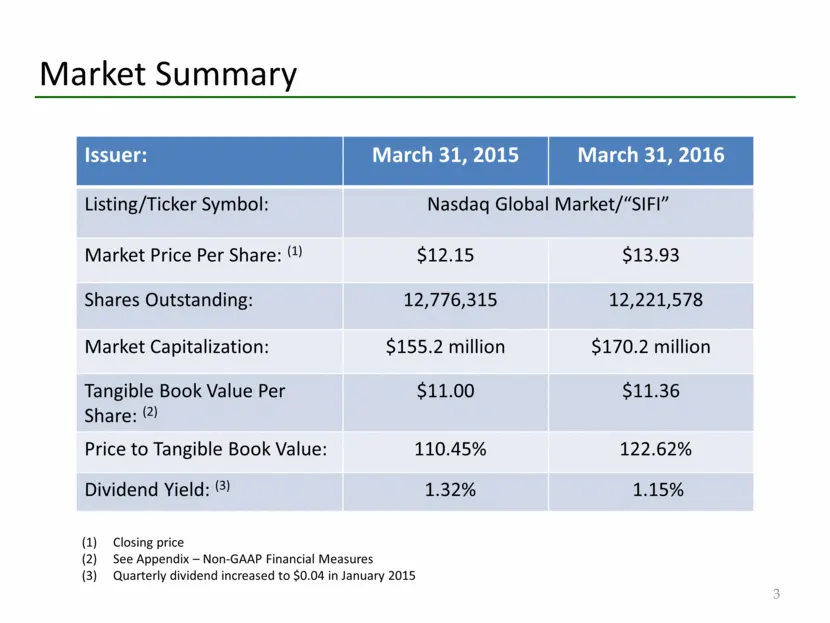
Closing price See Appendix – Non-GAAP Financial Measures Quarterly dividend increased to $0.04 in January 2015 Market Summary Issuer: March 31, 2015 March 31, 2016 Listing/Ticker Symbol: Nasdaq Global Market/“SIFI” Market Price Per Share: (1) $12.15 $13.93 Shares Outstanding: 12,776,315 12,221,578 M
Slide 3: Market Summary
Market Summary issuers March 31, 2015 March 31, 2016 Listing/Ticker Symbol: Nasdaq Global Market/“SIFI” Market Price Per Share: (2) $12.15 $13.93 Shares Outstanding: 12,776,315 12,221,578 Market Capitalization: $155.2 million $170.2 million Tangible Book Value Per $11.00 $11.36 Share: ) Price to Tan
Slide 4: Headquartered in Willimantic, CT
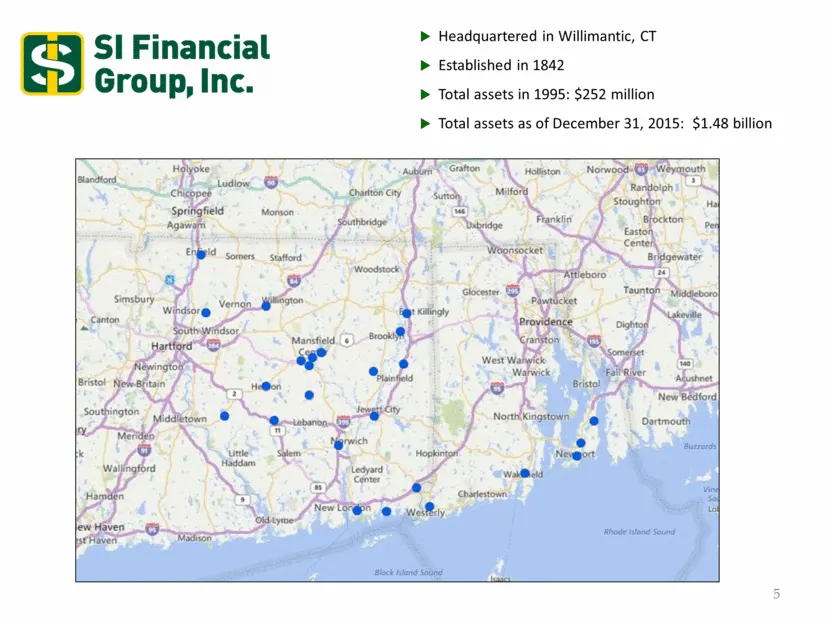
Headquartered in Willimantic, CT Established in 1842 Total assets in 1995: $252 million Total assets as of December 31, 2015: $1.48 billion 5
Slide 5: Business Strategy
Business Strategy Community oriented focus with a full range of financial products and services Optimize future growth opportunities by executing a proven business model and by opportunistically seeking branch or whole bank acquisitions in areas in or adjacent to existing market area Prudently diver
Slide 6: Business Strategy
Business Strategy >» >» Community oriented focus with a full range of financial products and services Optimize future growth opportunities by executing a proven business model and by opportunistically seeking branch or whole bank acquisitions in areas in or adjacent to existing market area Prudently
Slide 7: Assets as of December 31, 2015 - $1.48 billion
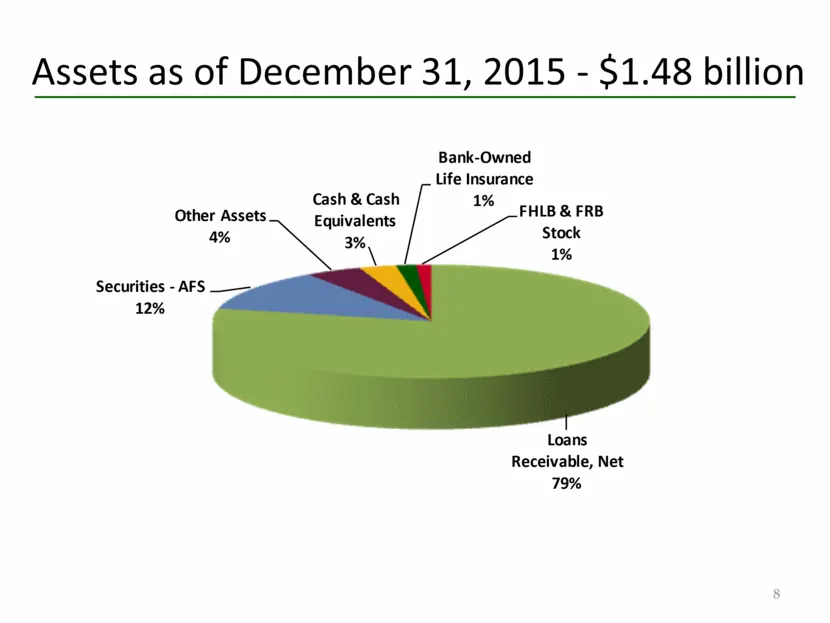
Assets as of December 31, 2015 - $1.48 billion 8
Slide 8: Securities Portfolio Comparison
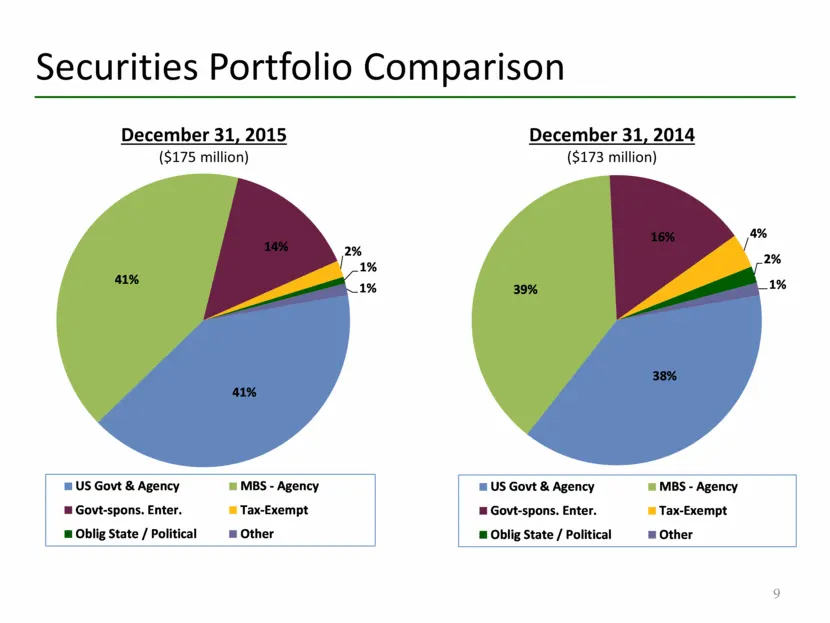
Securities Portfolio Comparison 9 December 31, 2015 ($175 million) December 31, 2014 ($173 million) 38% 39% 16% 4% 2% 1% US Govt & Agency MBS - Agency Govt-spons. Enter. Tax-Exempt Oblig State / Political Other 41% 41% 14% 2% 1% 1% US Govt & Agency MBS - Agency Govt-spons. Enter. Tax-Exempt Oblig St
Slide 9: Loan Portfolio Comparison
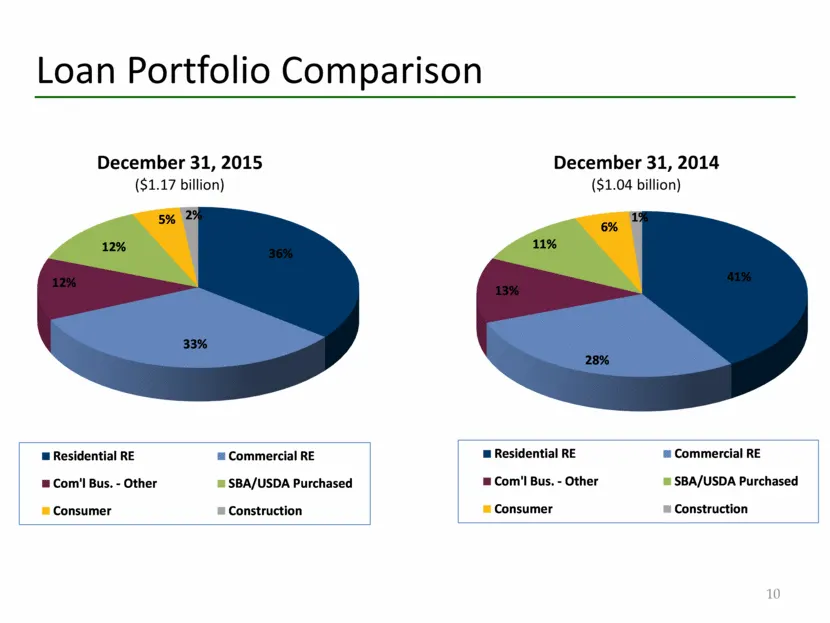
Loan Portfolio Comparison 10 December 31, 2015 ($1.17 billion) December 31, 2014 ($1.04 billion) 36% 33% 12% 12% 5% 2% Residential RE Commercial RE Com'l Bus. - Other SBA/USDA Purchased Consumer Construction 41% 28% 13% 11% 6% 1% Residential RE Commercial RE Com'l Bus. - Other SBA/USDA Purchased Con
Slide 10: Asset Quality
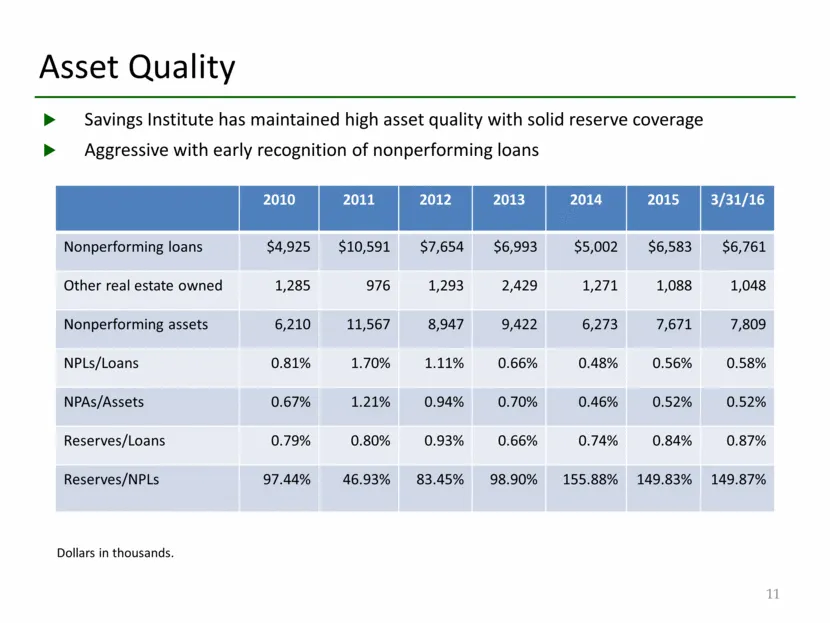
Asset Quality Savings Institute has maintained high asset quality with solid reserve coverage Aggressive with early recognition of nonperforming loans 2010 2011 2012 2013 2014 2015 3/31/16 Nonperforming loans $4,925 $10,591 $7,654 $6,993 $5,002 $6,583 $6,761 Other real estate owned 1,285 976 1,293 2
Slide 11: Deposits
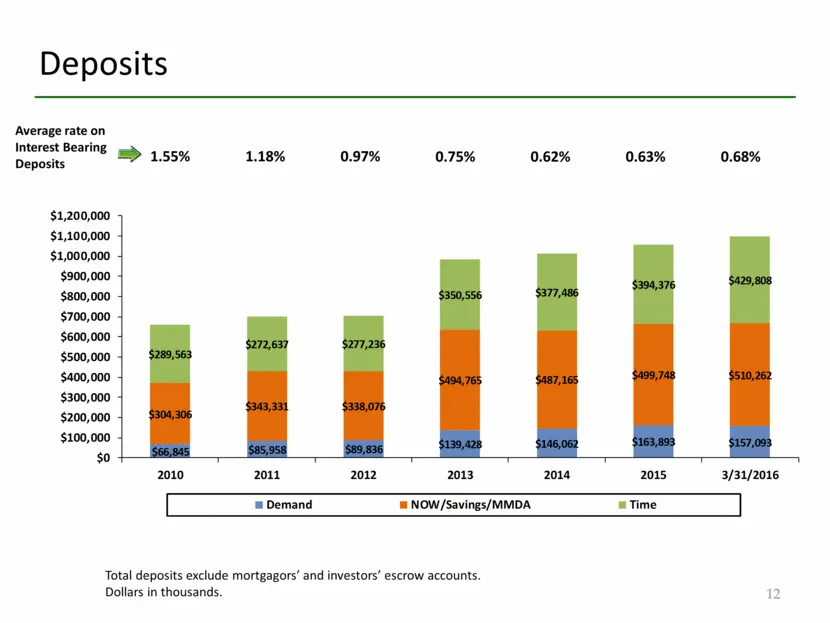
Deposits Total deposits exclude mortgagors’ and investors’ escrow accounts. Dollars in thousands. 12 Average rate on Interest Bearing Deposits 1.55% 0.97% 1.18% 0.75% 0.68% 0.63% 0.62%
Slide 12: Operating Results
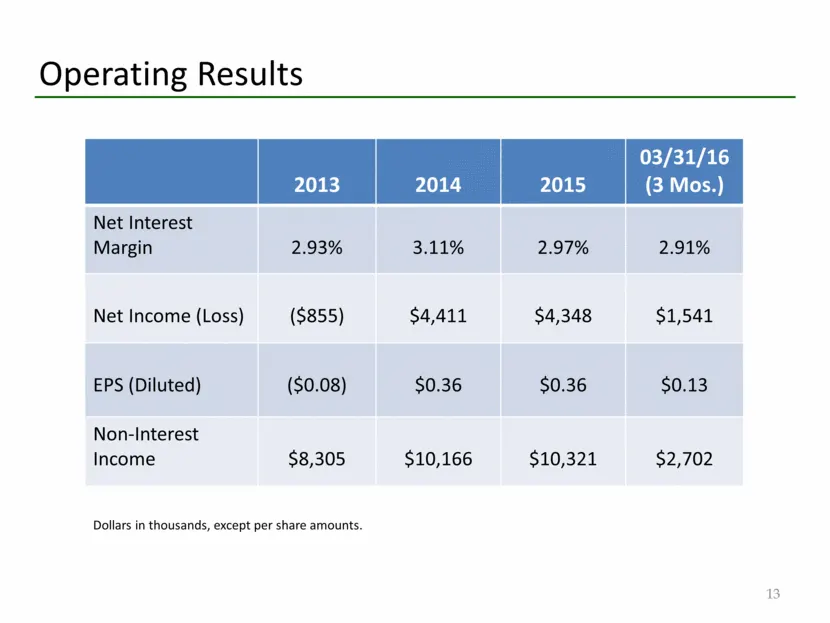
Operating Results 2013 2014 2015 03/31/16 (3 Mos.) Net Interest Margin 2.93% 3.11% 2.97% 2.91% Net Income (Loss) ($855) $4,411 $4,348 $1,541 EPS (Diluted) ($0.08) $0.36 $0.36 $0.13 Non-Interest Income $8,305 $10,166 $10,321 $2,702 Dollars in thousands, except per share amounts. 13
Slide 13: Expenses/Efficiencies
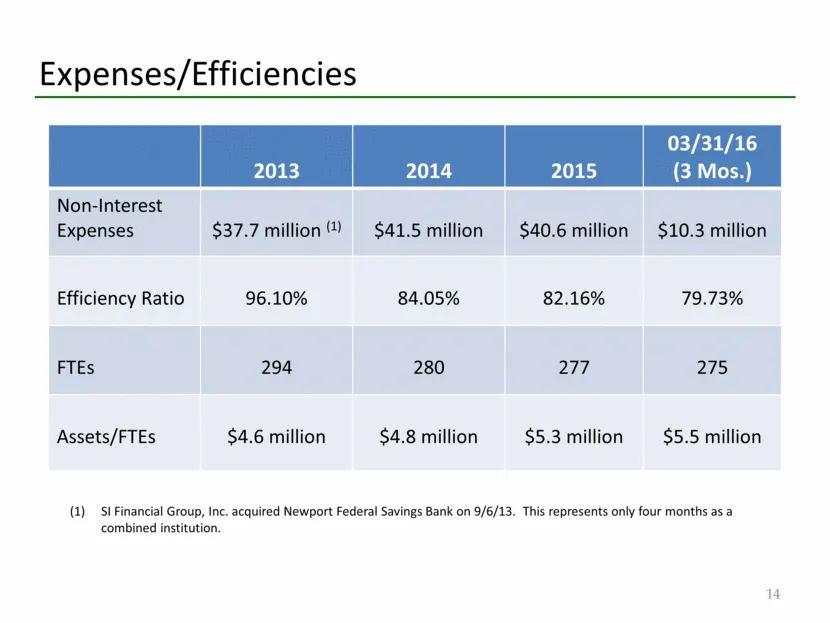
Expenses/Efficiencies 2013 2014 2015 03/31/16 (3 Mos.) Non-Interest Expenses $37.7 million (1) $41.5 million $40.6 million $10.3 million Efficiency Ratio 96.10% 84.05% 82.16% 79.73% FTEs 294 280 277 275 Assets/FTEs $4.6 million $4.8 million $5.3 million $5.5 million SI Financial Group, Inc. acquired
Slide 14: Financial Strength – December 31, 2015
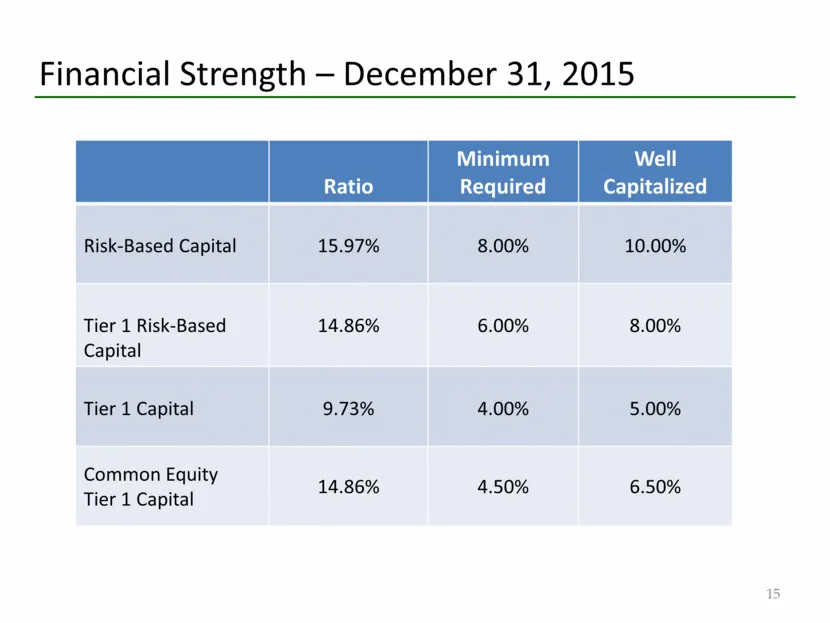
Financial Strength – December 31, 2015 Ratio Minimum Required Well Capitalized Risk-Based Capital 15.97% 8.00% 10.00% Tier 1 Risk-Based Capital 14.86% 6.00% 8.00% Tier 1 Capital 9.73% 4.00% 5.00% Common Equity Tier 1 Capital 14.86% 4.50% 6.50% 15
Slide 15: Stock Repurchase Program
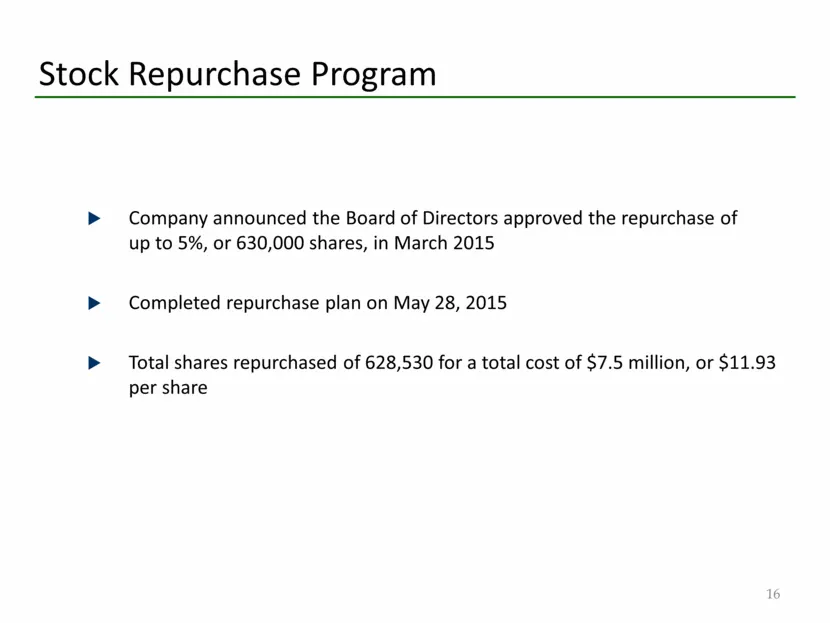
Stock Repurchase Program Company announced the Board of Directors approved the repurchase of up to 5%, or 630,000 shares, in March 2015 Completed repurchase plan on May 28, 2015 Total shares repurchased of 628,530 for a total cost of $7.5 million, or $11.93 per share 16
Slide 16: SIFI LTM Stock Price Performance
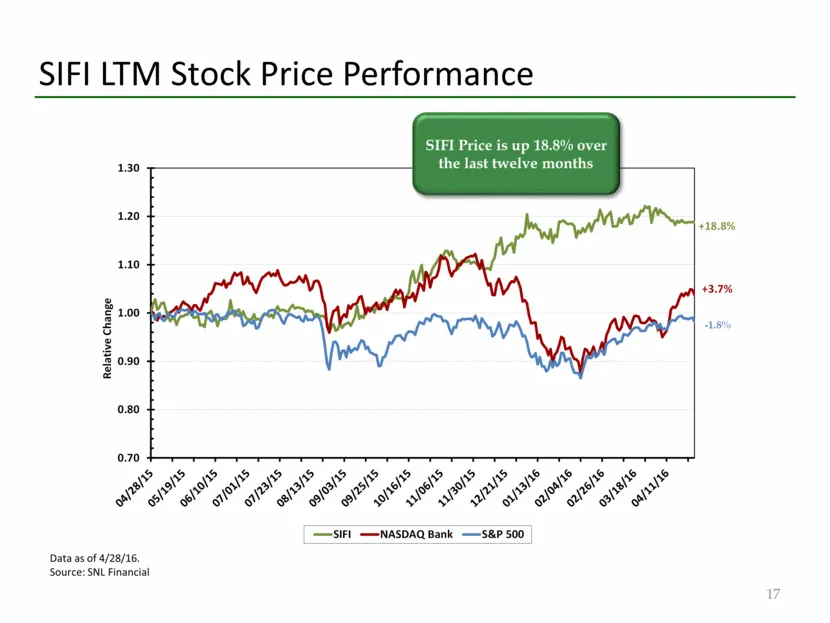
SIFI LTM Stock Price Performance 17 Data as of 4/28/16. Source: SNL Financial SIFI Price is up 18.8% over the last twelve months
Slide 17: Appendix – Non-GAAP Financial Measures
Appendix – Non-GAAP Financial Measures
Slide 18: Non-GAAP Financial Measures
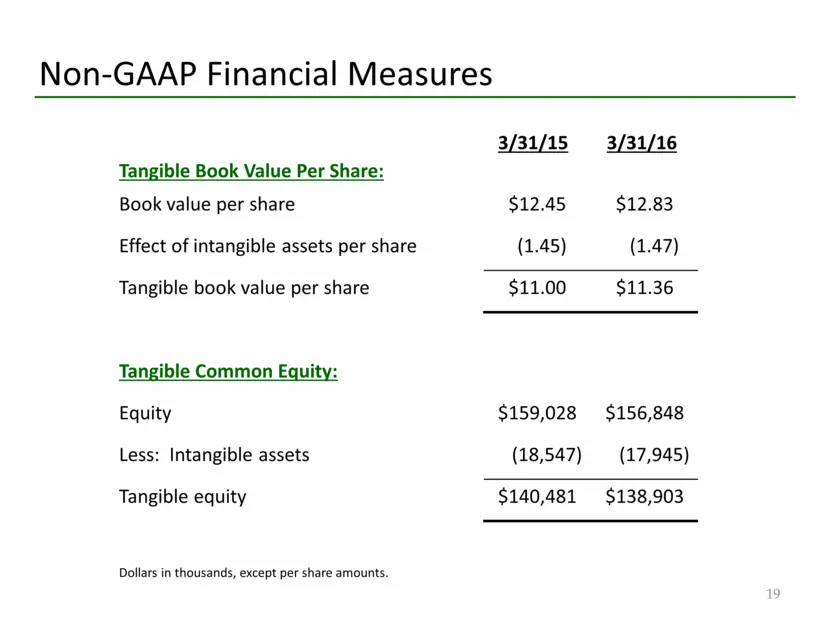
Non-GAAP Financial Measures Tangible Book Value Per Share: 12 Book value per share $12.45 $12.83 Effect of intangible assets per share (1.45) (1.47) Tangible book value per share $11.00 $11.36 Tangible Common Equity: Equity $159,028 $156,848 Less: Intangible assets (18,547) (17,945) Tangible equity
Slide 19: Non-GAAP Financial Measures
Non-GAAP Financial Measures Tangible Book Value Per Share: Book value per share Effect of intangible assets per share Tangible book value per share Equity Less: Intangible assets Tangible equity Dollars in thousands, except per share amounts. 3/31/15 3/31/16 $12.45 $12.83 (1.45) (1.47) $11.00 $11.36
Source: SEC EDGAR · 8-K filed May 11, 2016
More decks from SI Financial Group Inc
 Merger or Acquisition (December 2018)13 slides · Dec 11, 2018
 Investor Presentation (September 2018)18 slides · Sep 20, 2018
 Shareholder Meeting (May 2018)19 slides · May 9, 2018
 Investor Presentation (May 2017)18 slides · May 10, 2017
 Shareholder Meeting (May 2015)19 slides · May 13, 2015
 Sterne Agee Investor Conference 201520 slides · Feb 12, 2015