LaPorte Bancorp — Investor Presentation (February 2013)
16 slides from LaPorte Bancorp's investor presentation, Feb 11, 2013

Slide 1: LaPorte Bancorp, Inc. Investor Presentation
Exhibit 99.1 LaPorte Bancorp, Inc. LPSB Investor Presentation February 2013 Michele M. Thompson – President & Chief Financial Officer
Slide 2: Forward-Looking Statements
Forward-Looking Statements The presentation contains “forward-looking statements” within the meaning of Section 27A of the Securities Act of 1933, as amended and Section 21E of the Securities Exchange Act of 1934, as amended. We intend such forward-looking statements to be covered by the safe harbor
Slide 3: Forward-Looking Statements (continued)
Forward-Looking Statements (continued) The following factors, among others, could cause actual results to differ materially from the anticipated results or other expectations express in the forward-looking statements: general economic conditions, either nationally or in our market areas, that are wo
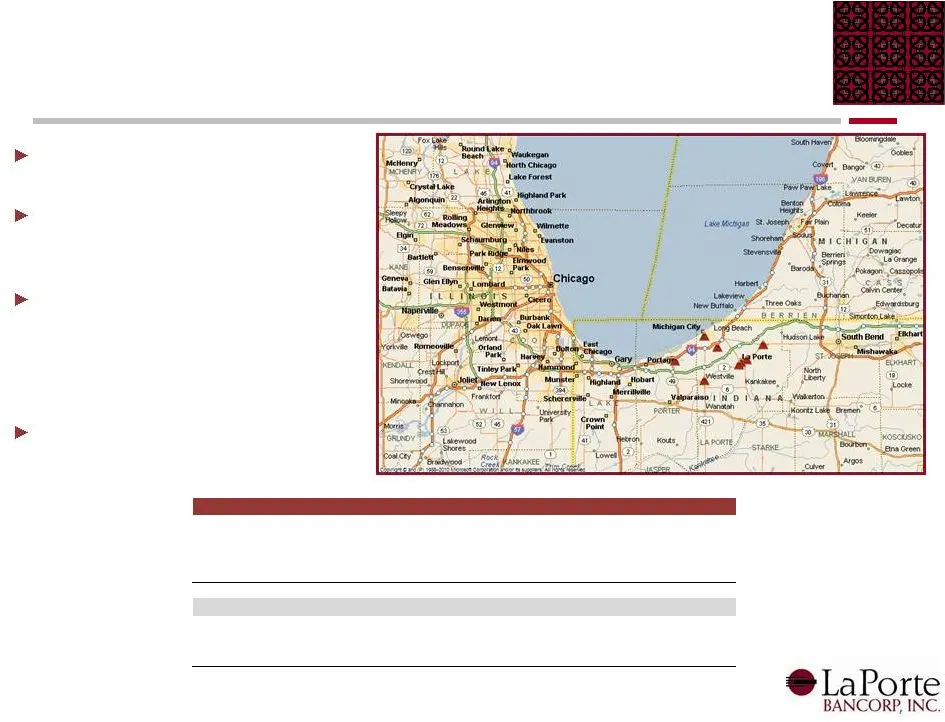
Slide 4: Deposit Market Share - La Porte County, IN
Deposit Market Share - La Porte County, IN 1 Rank Institution (ST) Type Number of Branches Deposits in Market ($000) Market Share (%) Horizon Bancorp (IN) Bank 544,999 33.28 LaPorte Bancorp Inc (IN) Thrift 304,117 18.57 Wells Fargo & Co. (CA) Bank 298,037 18.20 1st Source Corp. (IN) Bank 188,880 11.
Slide 5: Board of Directors / Experienced Management Team
Board of Directors Experienced Management Team Lee A. Brady – Chief Executive Officer & Director • Serves as Chairman & CEO of The LaPorte Savings Bank • Started career at The LaPorte Savings Bank in 1974 • Graduate of Indiana University and the Graduate School of Banking at the University of Wiscon
Slide 6: Our Story
Our Story Strong Balance Sheet – Capital – Clean Asset Quality Consistent Earnings – ROAA increased from 0.65% in 2009 to 0.91% in 2012 Steady Loan Growth: – Commercial – Mortgage Warehouse – Retail Strong Core Deposit Base
Slide 7: Business Strategy
Business Strategy Quality – Maintaining loan portfolio quality – Staff – Product lines Growth – Increasing commercial business lending – Focus on mortgage warehouse lending – Continued growth in core retail banking franchise – Continued growth in earnings and profitability Service – Customers – Comm
Slide 8: (in millions)
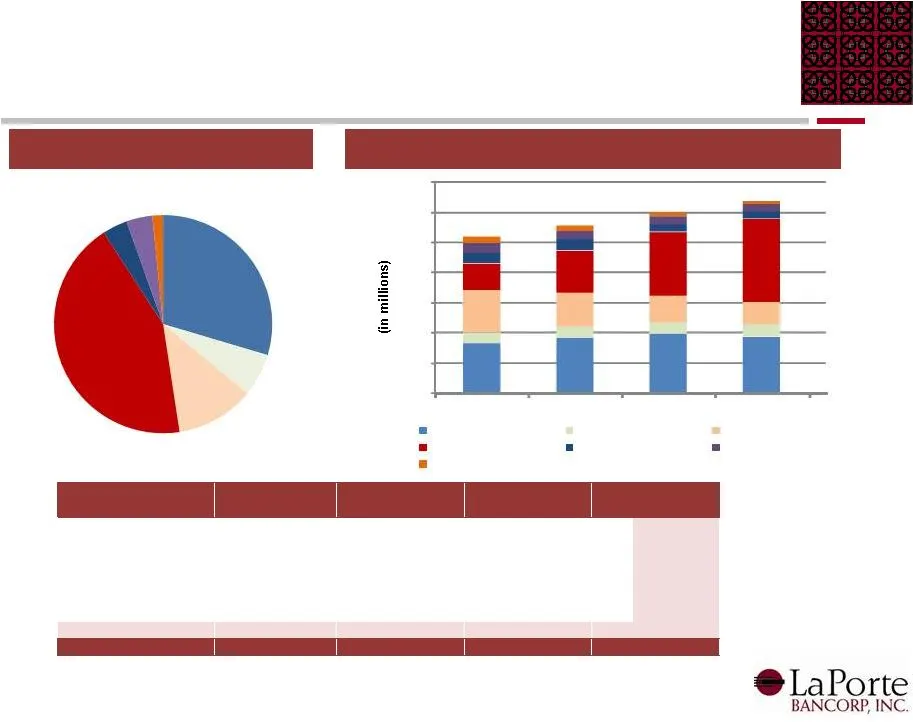
(in millions) . @LaPorte BANCORP, INC.
Slide 9: @LaPorte
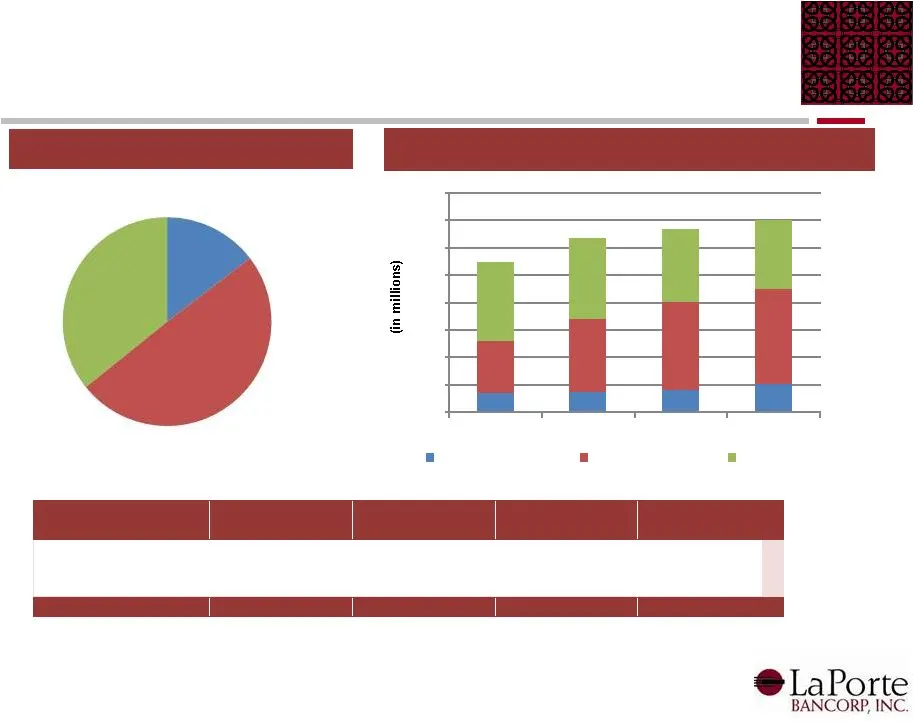
@LaPorte BANCORP, INC.
Slide 10: Asset Quality Profile
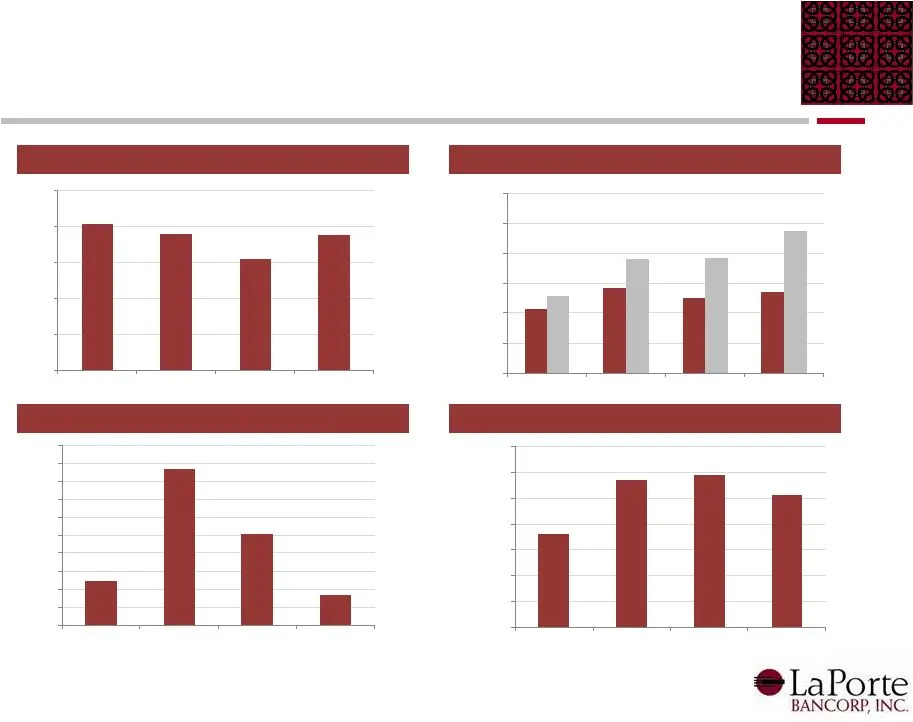
NPAs / Assets (%) 1 LLR / Loans (%) LLR / NPLs (%) Net Charge-Offs / Loans (%) 2.04 1.89 1.55 1.88 0.00 0.50 1.00 1.50 2.00 2.50 2009Y 2010Y 2011Y 2012Y 1.07 1.42 1.26 1.35 1.28 1.90 1.92 2.38 0.00 0.50 1.00 1.50 2.00 2.50 3.00 2009Y 2010Y 2011Y 2012Y 0.25 0.87 0.50 0.17 0.00 0.10 0.20 0.30 0.40 0.5
Slide 11: Profitability
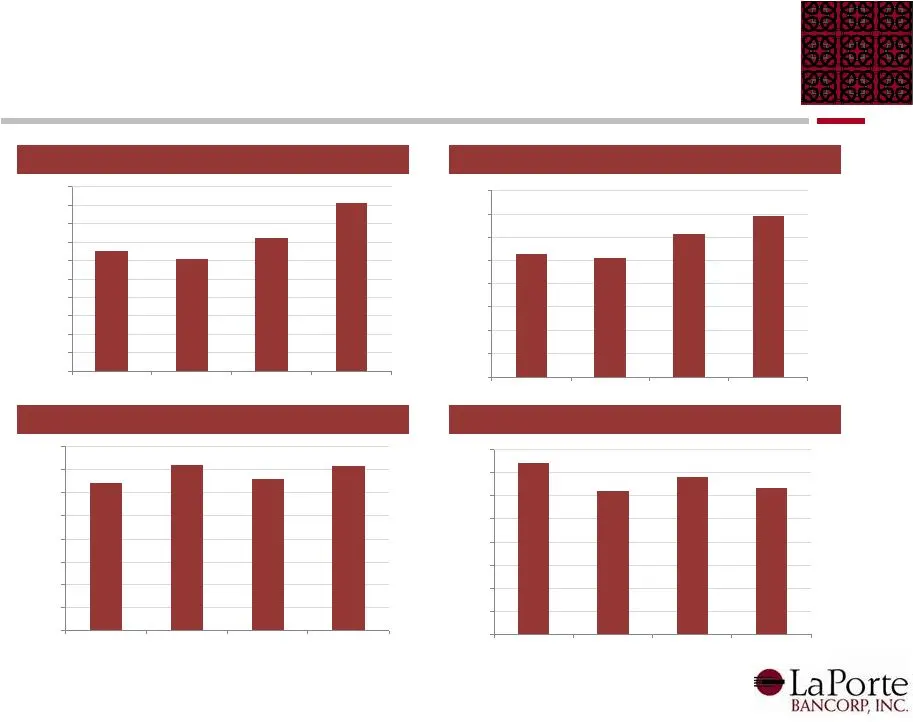
ROAA (%) ROAE (%) Efficiency Ratio (%) Net Interest Margin (%) 0.65 0.61 0.72 0.91 0.00 0.10 0.20 0.30 0.40 0.50 0.60 0.70 0.80 0.90 1.00 2009Y 2010Y 2011Y 2012Y 5.25 5.12 6.15 6.91 0.00 1.00 2.00 3.00 4.00 5.00 6.00 7.00 8.00 2009Y 2010Y 2011Y 2012Y 3.21 3.59 3.31 3.57 0.00 0.50 1.00 1.50 2.00 2.50
Slide 12: Earnings Per Share ($)
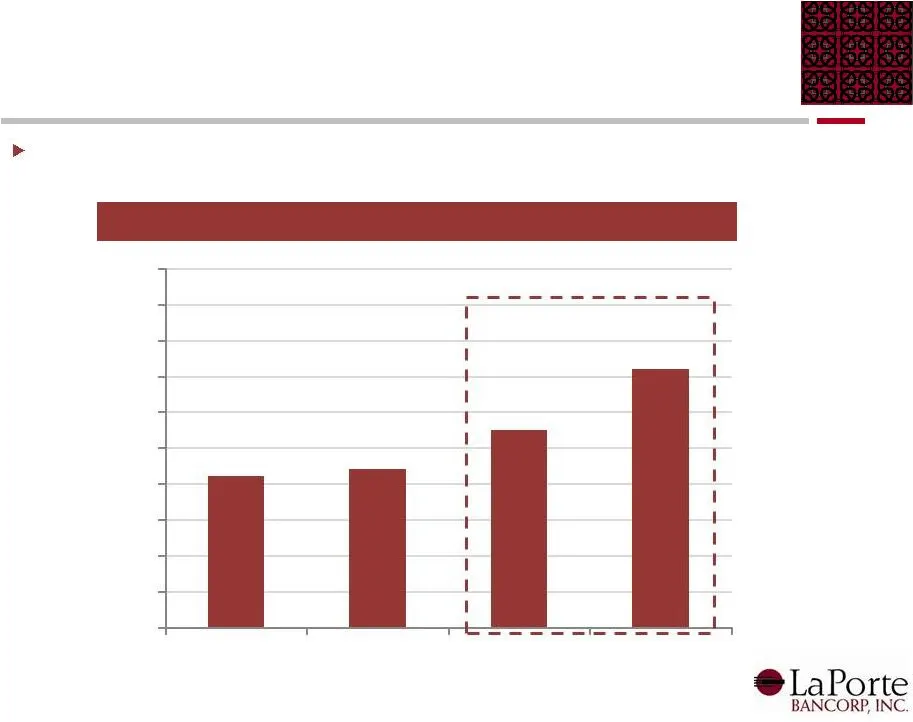
Earnings Per Share ($) 1 Consistent Growth in Earnings Per Share Our management team has been consistently focused on generating profits for our shareholders (1) EPS calculation is exchange ratio adjusted 0.42 0.44 0.55 0.72 - 0.10 0.20 0.30 0.40 0.50 0.60 0.70 0.80 0.90 1.00 2009Y 2010Y 2011Y 2012Y
Slide 13: Strong Capital Levels
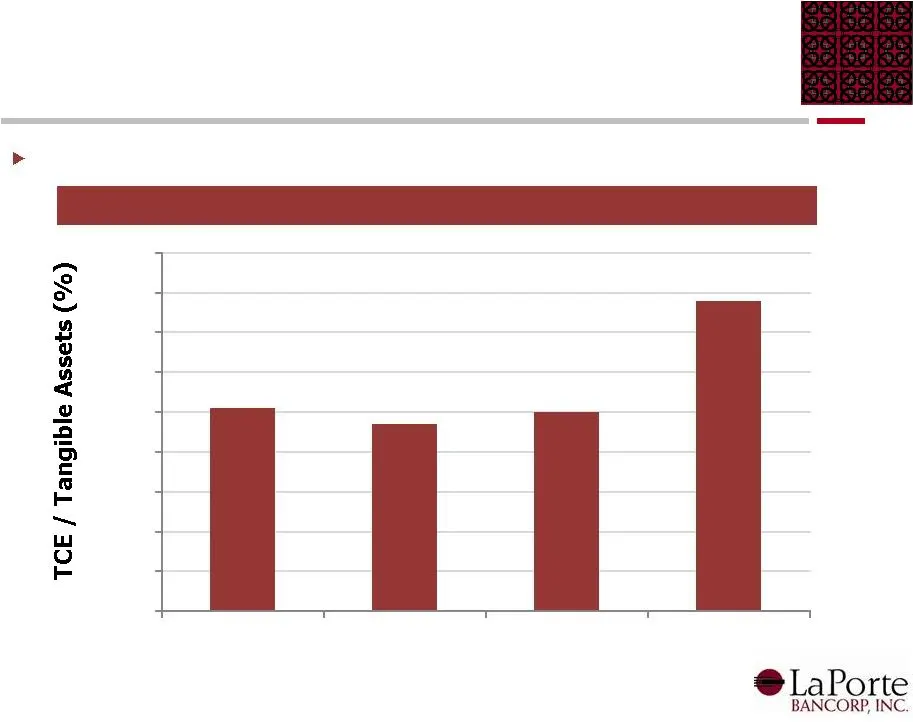
Strong Capital Levels Strong Capital Position LaPorte maintains a low risk profile with strong capital levels 10.2 9.4 10.0 15.6 - 4.0 6.0 8.0 10.0 12.0 14.0 16.0 18.0 2009Y 2010Y 2011Y 2012Y 2.0
Slide 14: Use of Proceeds / Capital Management
Use of Proceeds / Capital Management Deliberate growth – Organic and select acquisitions Cash dividends – LPSB currently pays a $0.04 per share cash dividend Share repurchases, once permitted (1) Under current FRB regulations, we may not repurchase shares of our common stock during the first year fo
Slide 15: Investment Conclusions
Investment Conclusions Experienced community banking team Well positioned for future growth Continued focus on shareholder returns

Slide 16: @ LaPorte
@ LaPorte BANCORP, INC.
Source: SEC EDGAR · 8-K filed Feb 11, 2013
More decks from LaPorte Bancorp Inc
 Merger or Acquisition (May 2016)33 slides · May 5, 2016
 Merger or Acquisition (March 2016)16 slides · Mar 11, 2016
 Shareholder Meeting (May 2015)15 slides · May 12, 2015
 Investor Presentation (February 2015)16 slides · Feb 12, 2015
 Shareholder Meeting (May 2014)16 slides · May 13, 2014
 Investor Presentation (December 2013)16 slides · Dec 16, 2013