Inland Real Estate — Investor Presentation (September 2012)
30 slides from Inland Real Estate's investor presentation, Sep 5, 2012
Slide 1: Investor Presentation Second Quarter 2012
Investor Presentation Second Quarter 2012 www.inlandrealestate.com NYSE: IRC September 2012
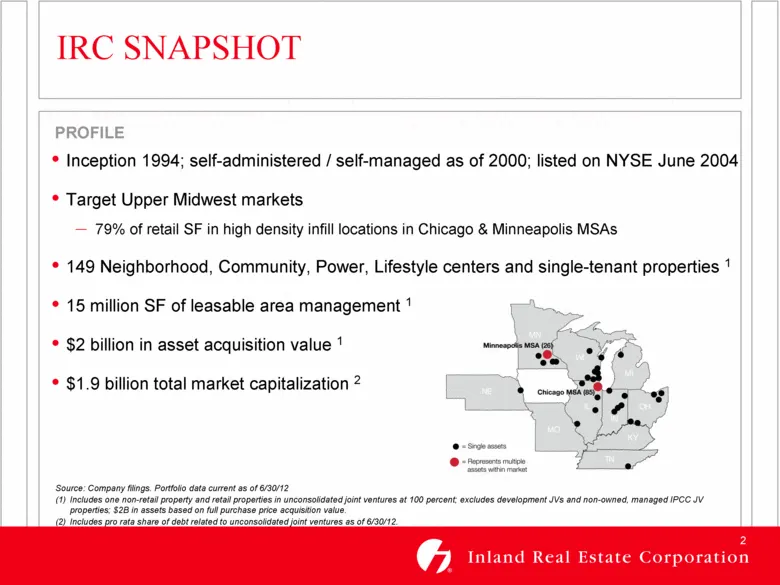
Slide 2: IRC Snapshot Profile
IRC SNAPSHOT PROFILE Inception 1994; self-administered / self-managed as of 2000; listed on NYSE June 2004 Target Upper Midwest markets 79% of retail SF in high density infill locations in Chicago & Minneapolis MSAs 149 Neighborhood, Community, Power, Lifestyle centers and single-tenant properties 1
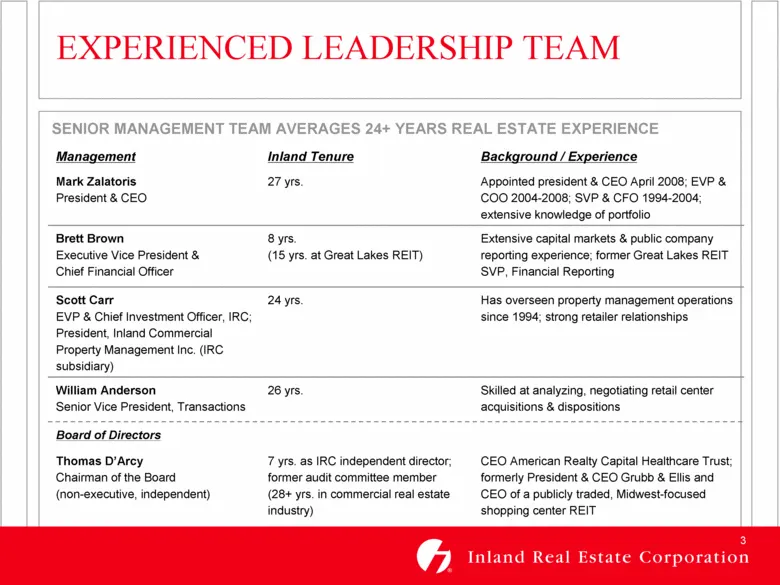
Slide 3: Experienced Leadership Team
EXPERIENCED LEADERSHIP TEAM Management Inland Tenure Background / Experience Mark Zalatoris President & CEO 27 yrs. Appointed president & CEO April 2008; EVP & COO 2004-2008; SVP & CFO 1994-2004; extensive knowledge of portfolio Brett Brown Executive Vice President & Chief Financial Officer 8 yrs. (
Slide 4: Operating Strategy
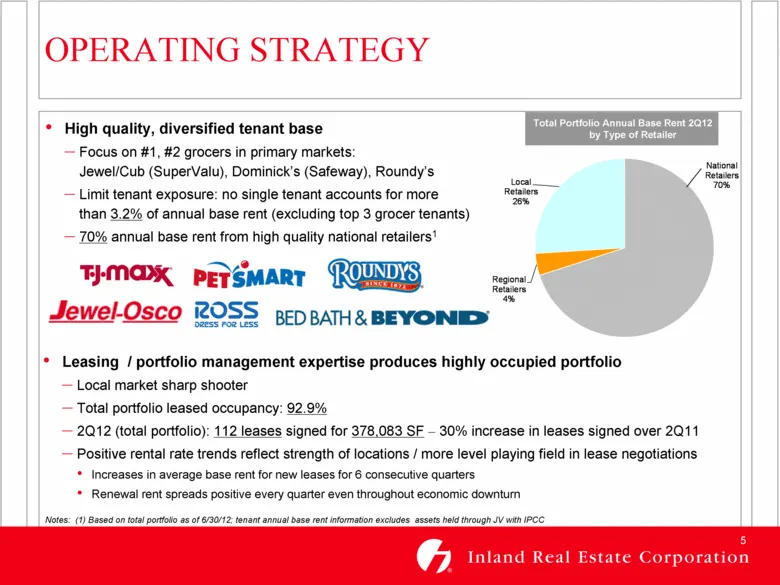
OPERATING STRATEGY Defensive portfolio – meets consumer demand for value and necessity retail Centers with grocer / drug / discount component 77% of total portfolio retail gross leasable area (GLA) 1 Resilient Midwest markets Strong demographics dense populations, high incomes, diverse economies Hig
Slide 5: Operating Strategy: Leasing and portfolio management expertise
Leasing / portfolio management expertise produces highly occupied portfolio Local market sharp shooter Total portfolio leased occupancy: 92.9% 2Q12 (total portfolio): 112 leases signed for 378,083 SF – 30% increase in leases signed over 2Q11 Positive rental rate trends reflect strength of locations
Slide 6: Operating Strategy: Strong balance sheet focus
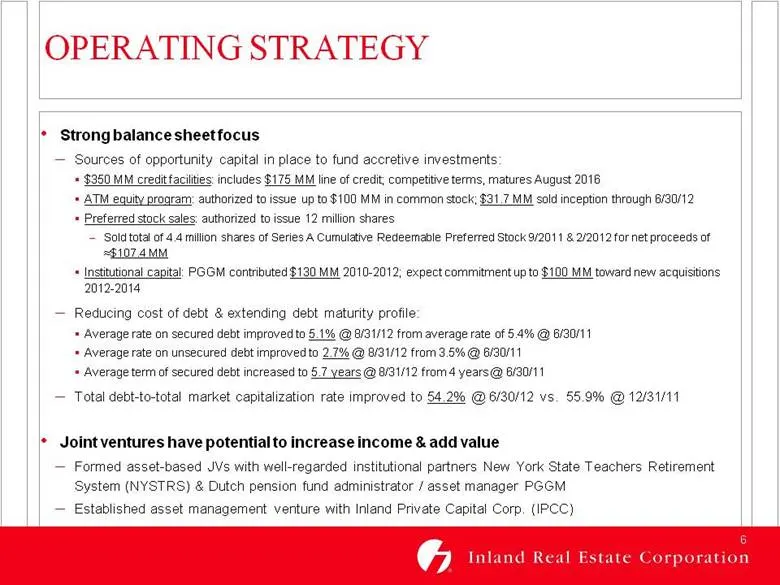
OPERATING STRATEGY Strong balance sheet focus Sources of opportunity capital in place to fund accretive investments: $350 MM credit facilities: includes $175 MM line of credit; competitive terms, matures August 2016 ATM equity program: authorized to issue up to $100 MM in common stock; $31.7 MM sold
Slide 7: Primary Markets: Chicago and Minneapolis-St. Paul
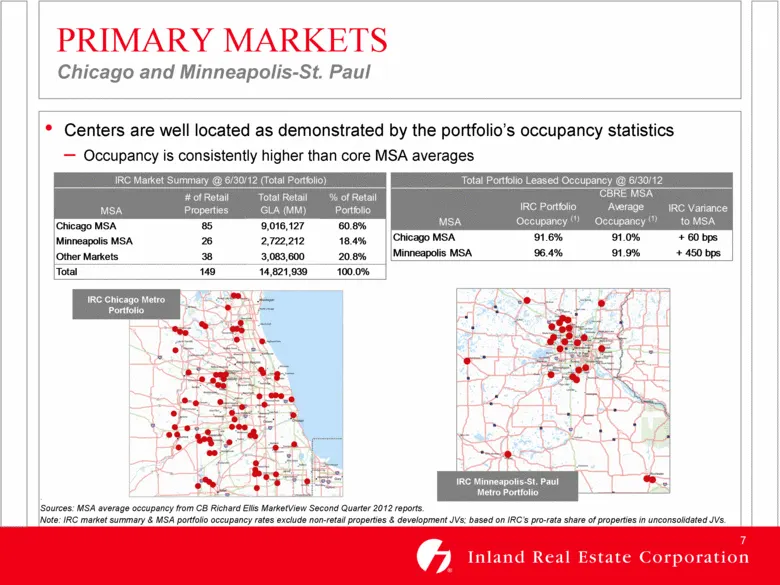
PRIMARY MARKETS Chicago and Minneapolis-St. Paul Sources: MSA average occupancy from CB Richard Ellis MarketView Second Quarter 2012 reports. Note: IRC market summary & MSA portfolio occupancy rates exclude non-retail properties & development JVs; based on IRC’s pro-rata share of properties in uncon
Slide 8: Chicago Market Snapshot
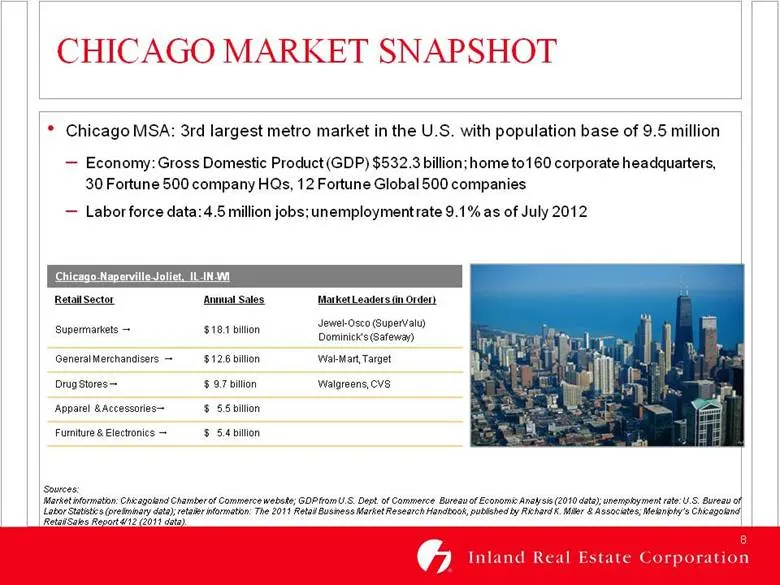
Chicago MSA: 3rd largest metro market in the U.S. with population base of 9.5 million Economy: Gross Domestic Product (GDP) $532.3 billion; home to160 corporate headquarters, 30 Fortune 500 company HQs, 12 Fortune Global 500 companies Labor force data: 4.5 million jobs; unemployment rate 9.1% as of
Slide 9: Minneapolis Market Snapshot
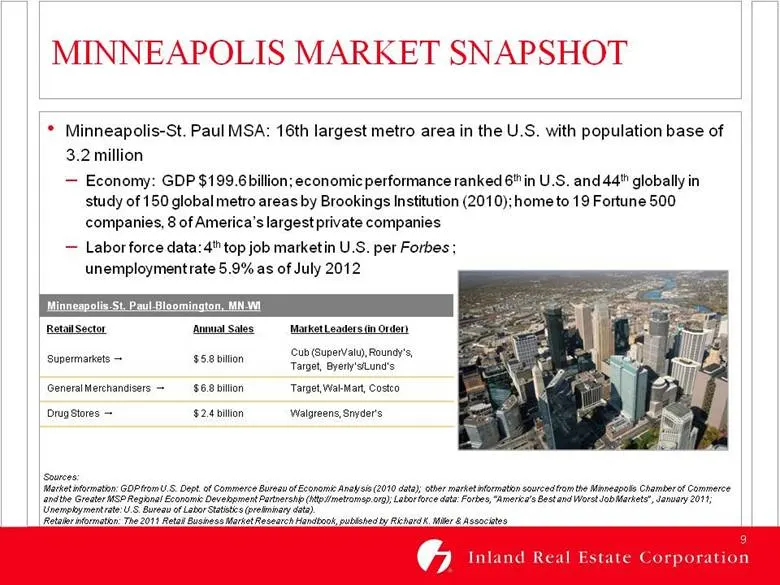
MINNEAPOLIS MARKET SNAPSHOT Sources: Market information: GDP from U.S. Dept. of Commerce Bureau of Economic Analysis (2010 data); other market information sourced from the Minneapolis Chamber of Commerce and the Greater MSP Regional Economic Development Partnership (http://metromsp.org); Labor force
Slide 10: Dominant REIT in Primary Markets
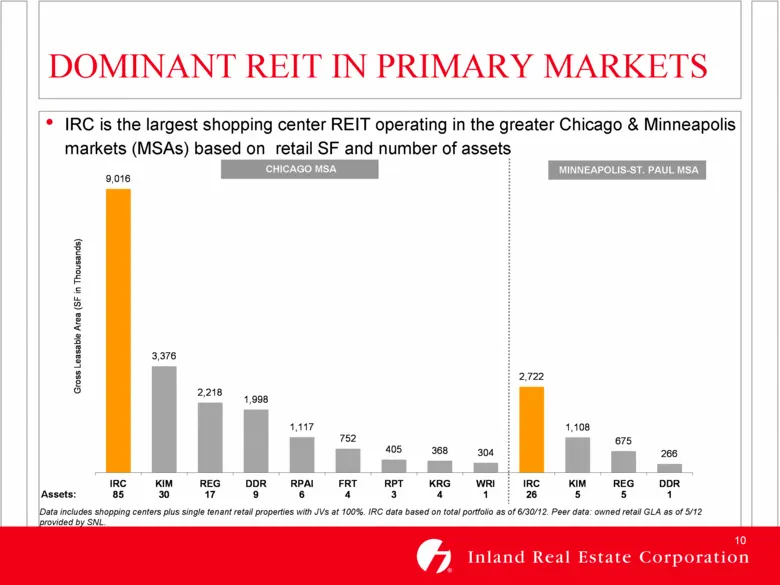
Assets: DOMINANT REIT IN PRIMARY MARKETS IRC is the largest shopping center REIT operating in the greater Chicago & Minneapolis markets (MSAs) based on retail SF and number of assets MINNEAPOLIS-ST. PAUL MSA Data includes shopping centers plus single tenant retail properties with JVs at 100%. IRC da
Slide 11: Strong Market Demographics
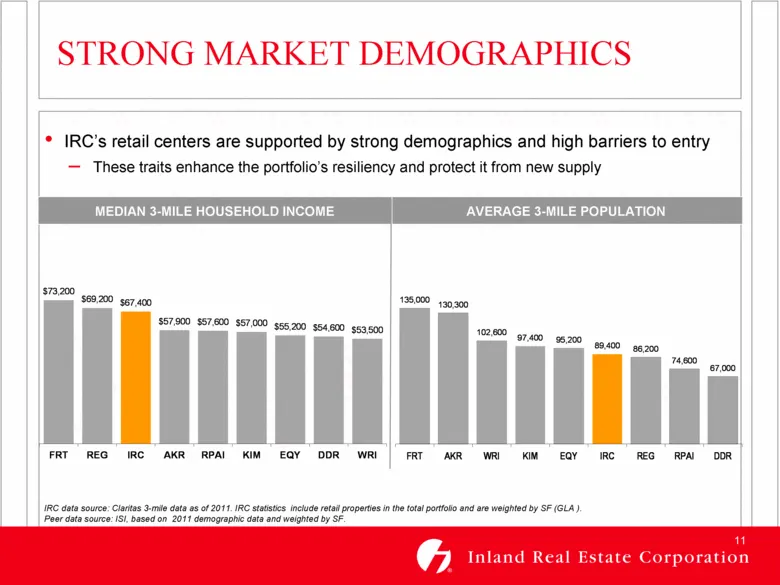
STRONG MARKET DEMOGRAPHICS IRC’s retail centers are supported by strong demographics and high barriers to entry These traits enhance the portfolio’s resiliency and protect it from new supply MEDIAN 3-MILE HOUSEHOLD INCOME AVERAGE 3-MILE POPULATION IRC data source: Claritas 3-mile data as of 2011. IR
Slide 12: Total Portfolio Composition
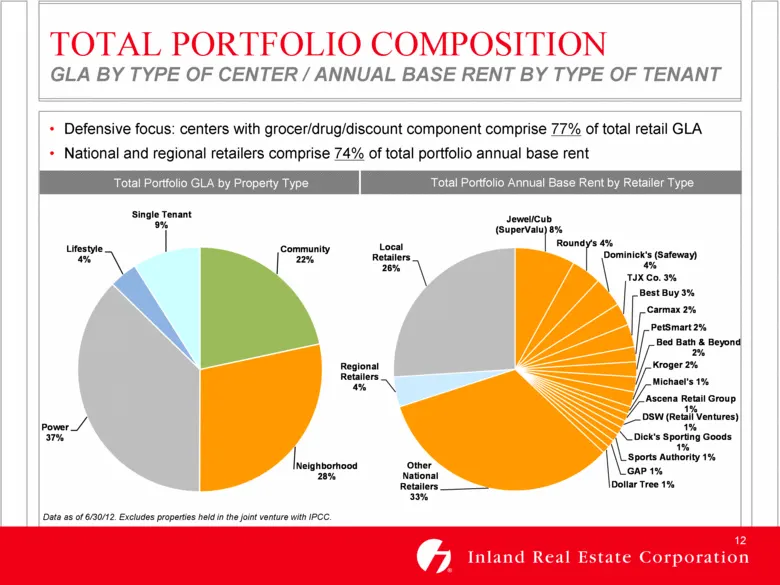
TOTAL PORTFOLIO COMPOSITION GLA BY TYPE OF CENTER / ANNUAL BASE RENT BY TYPE OF TENANT (1) Data as of 6/30/12. Excludes properties held in the joint venture with IPCC. Total Portfolio GLA by Property Type Total Portfolio Annual Base Rent by Retailer Type Defensive focus: centers with grocer/drug/dis
Slide 13: Diversified Tenant Base
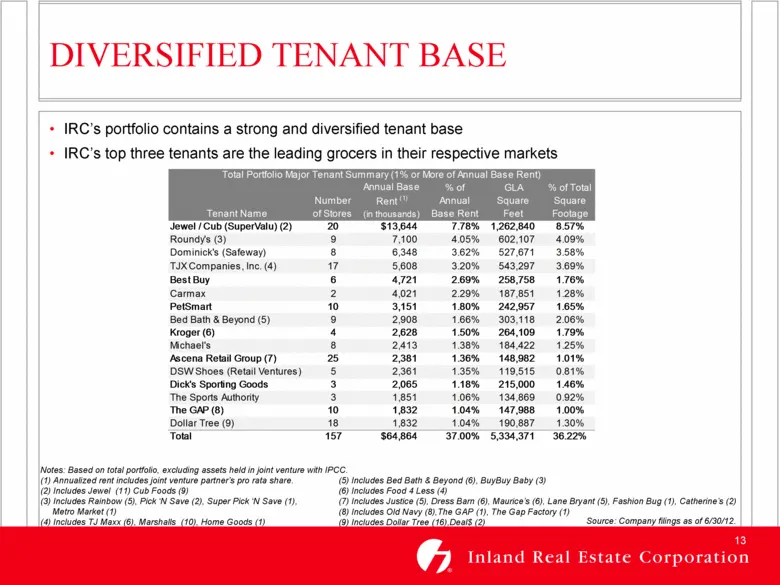
(5) Includes Bed Bath & Beyond (6), BuyBuy Baby (3) (6) Includes Food 4 Less (4) (7) Includes Justice (5), Dress Barn (6), Maurice’s (6), Lane Bryant (5), Fashion Bug (1), Catherine’s (2) (8) Includes Old Navy (8),The GAP (1), The Gap Factory (1) (9) Includes Dollar Tree (16),Deal$ (2) DIVERSIFIED T
Slide 14: Leasing Efficiencies
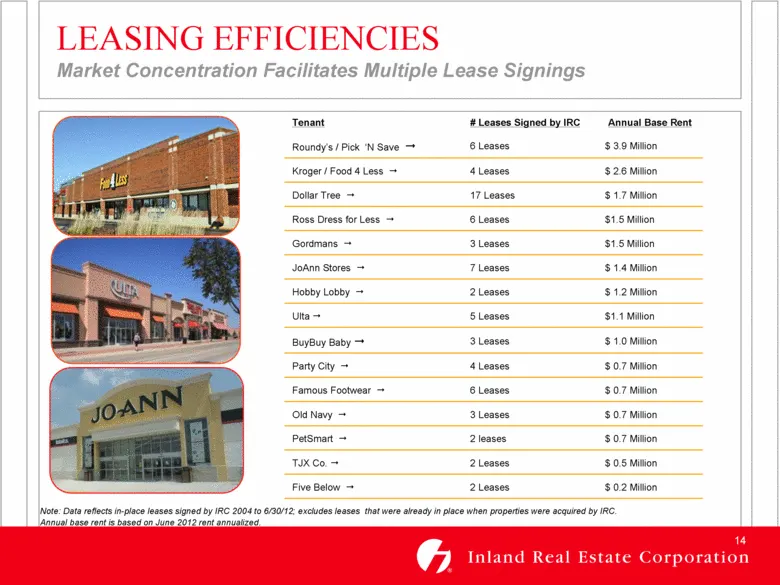
Tenant # Leases Signed by IRC Annual Base Rent Roundy’s / Pick ‘N Save 6 Leases $ 3.9 Million Kroger / Food 4 Less 4 Leases $ 2.6 Million Dollar Tree 17 Leases $ 1.7 Million Ross Dress for Less 6 Leases $1.5 Million Gordmans 3 Leases $1.5 Million JoAnn Stores 7 Leases $ 1.4 Million Hobby Lobby 2 Lea
Slide 15: Positive Leasing Spreads
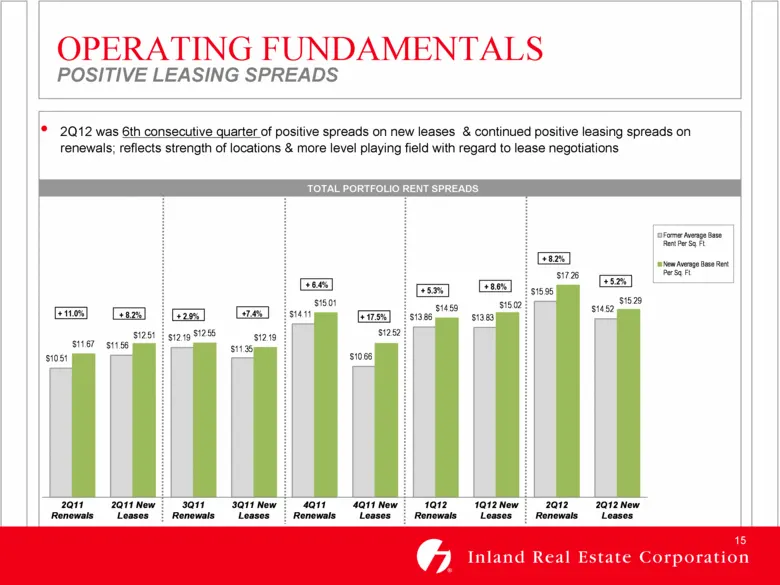
2Q12 was 6th consecutive quarter of positive spreads on new leases & continued positive leasing spreads on renewals; reflects strength of locations & more level playing field with regard to lease negotiations TOTAL PORTFOLIO RENT SPREADS OPERATING FUNDAMENTALS POSITIVE LEASING SPREADS + 6.4% + 17.5%
Slide 16: Same Store NOI Growth
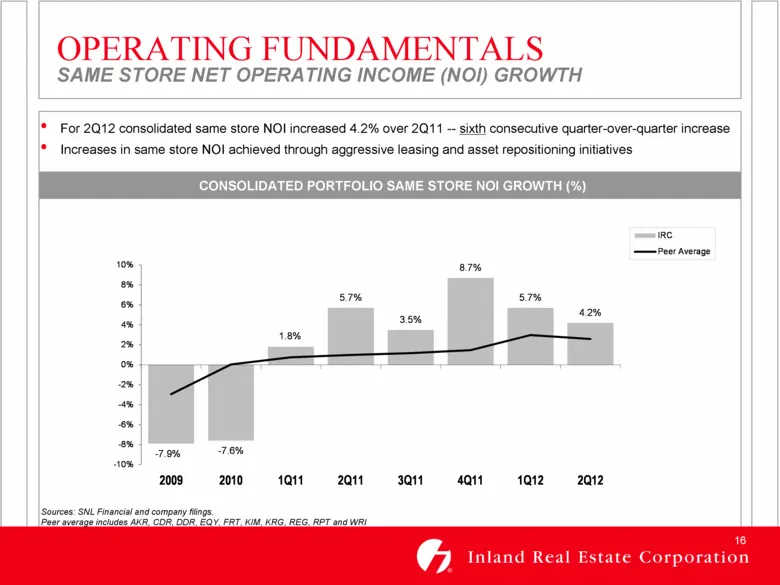
For 2Q12 consolidated same store NOI increased 4.2% over 2Q11 -- sixth consecutive quarter-over-quarter increase Increases in same store NOI achieved through aggressive leasing and asset repositioning initiatives CONSOLIDATED PORTFOLIO SAME STORE NOI GROWTH (%) OPERATING FUNDAMENTALS SAME STORE NET
Slide 17: Re-development of Existing Assets
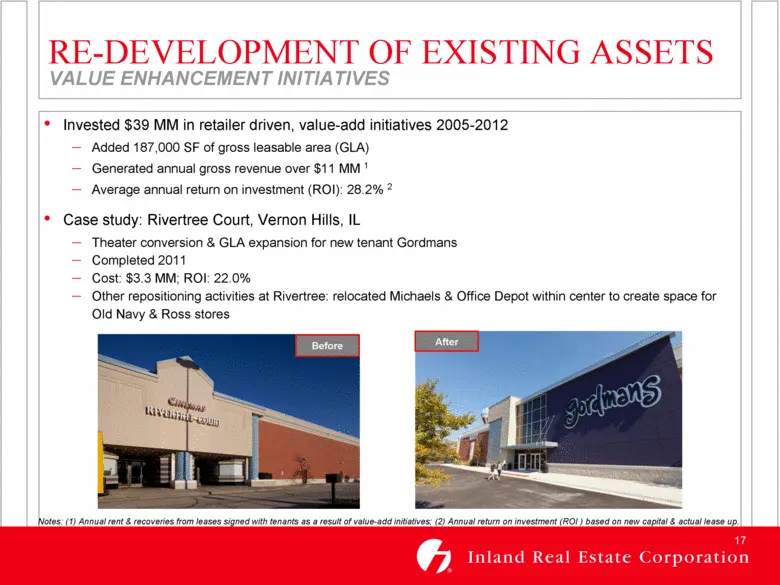
RE-DEVELOPMENT OF EXISTING ASSETS VALUE ENHANCEMENT INITIATIVES Invested $39 MM in retailer driven, value-add initiatives 2005-2012 Added 187,000 SF of gross leasable area (GLA) Generated annual gross revenue over $11 MM 1 Average annual return on investment (ROI): 28.2% 2 Case study: Rivertree Cour
Slide 18: Development Joint Ventures
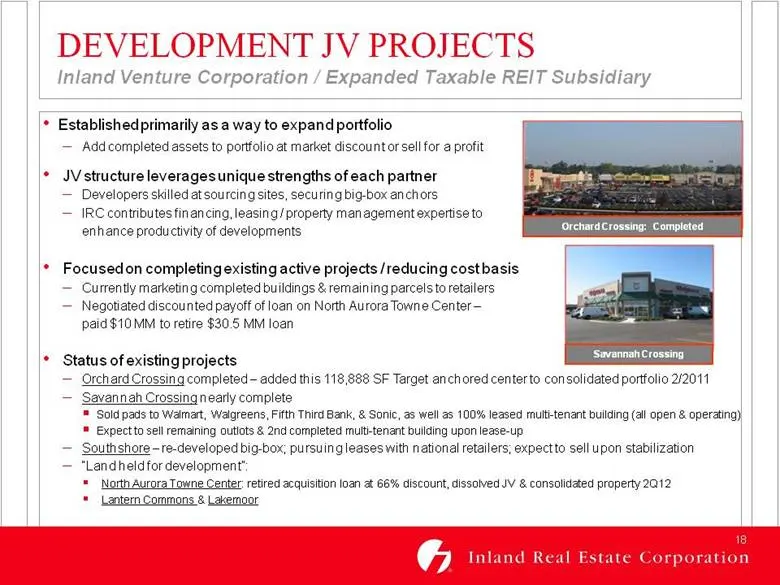
Established primarily as a way to expand portfolio Add completed assets to portfolio at market discount or sell for a profit JV structure leverages unique strengths of each partner Developers skilled at sourcing sites, securing big-box anchors IRC contributes financing, leasing / property management
Slide 19: Investment Strategy
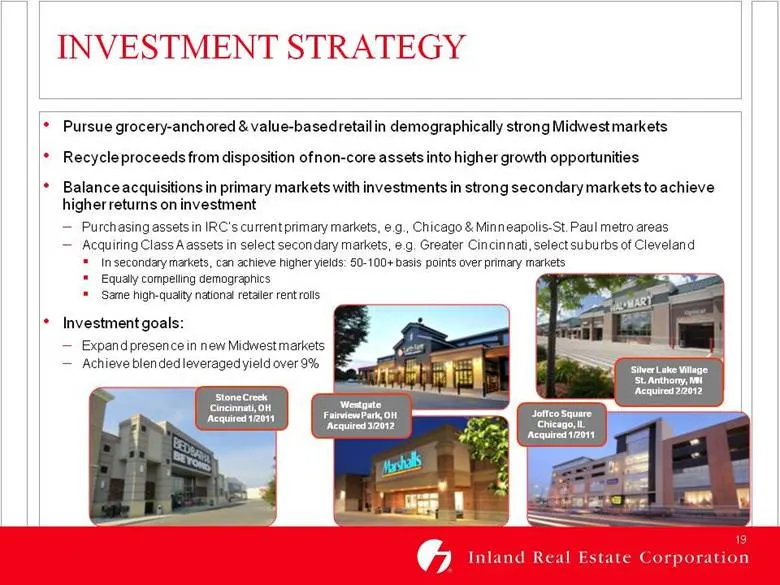
INVESTMENT STRATEGY Pursue grocery-anchored & value-based retail in demographically strong Midwest markets Recycle proceeds from disposition of non-core assets into higher growth opportunities Balance acquisitions in primary markets with investments in strong secondary markets to achieve higher retu
Slide 20: Transaction History
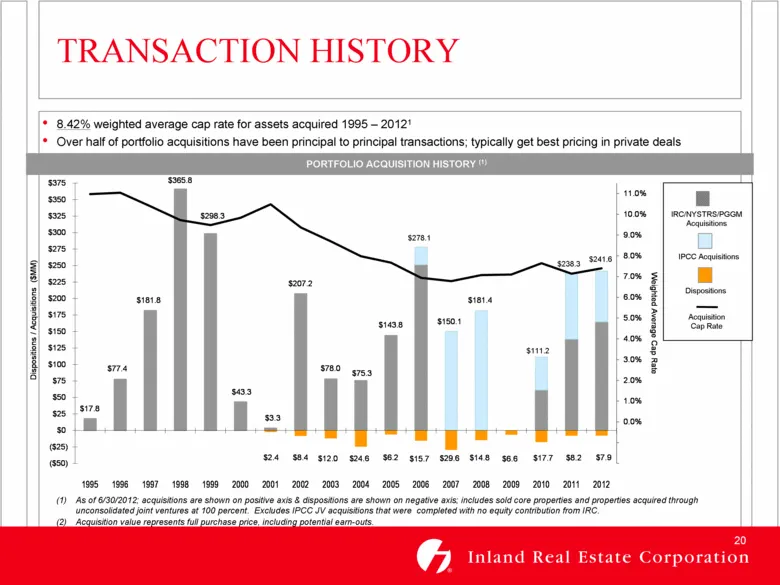
As of 6/30/2012; acquisitions are shown on positive axis & dispositions are shown on negative axis; includes sold core properties and properties acquired through unconsolidated joint ventures at 100 percent. Excludes IPCC JV acquisitions that were completed with no equity contribution from IRC. Acqu
Slide 21: Maintaining a Strong Balance Sheet
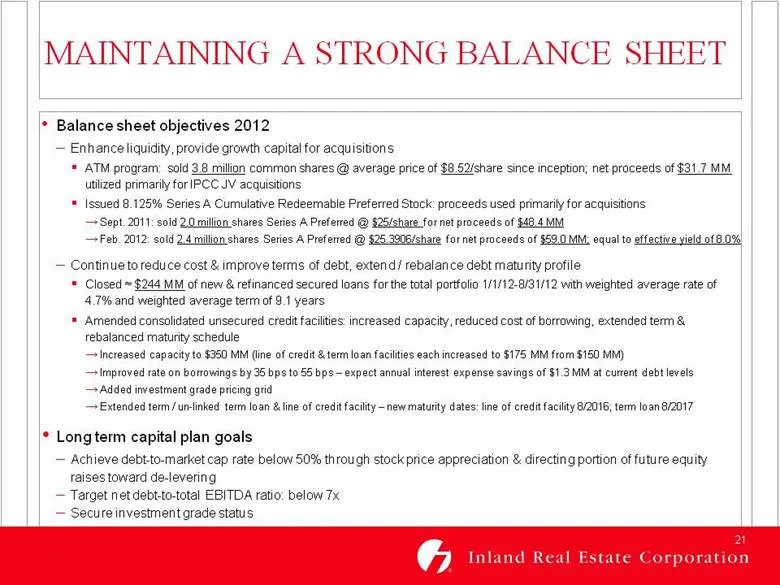
MAINTAINING A STRONG BALANCE SHEET Balance sheet objectives 2012 Enhance liquidity, provide growth capital for acquisitions ATM program: sold 3.8 million common shares @ average price of $8.52/share since inception; net proceeds of $31.7 MM utilized primarily for IPCC JV acquisitions Issued 8.125% S
Slide 22: Consolidated Debt Maturities
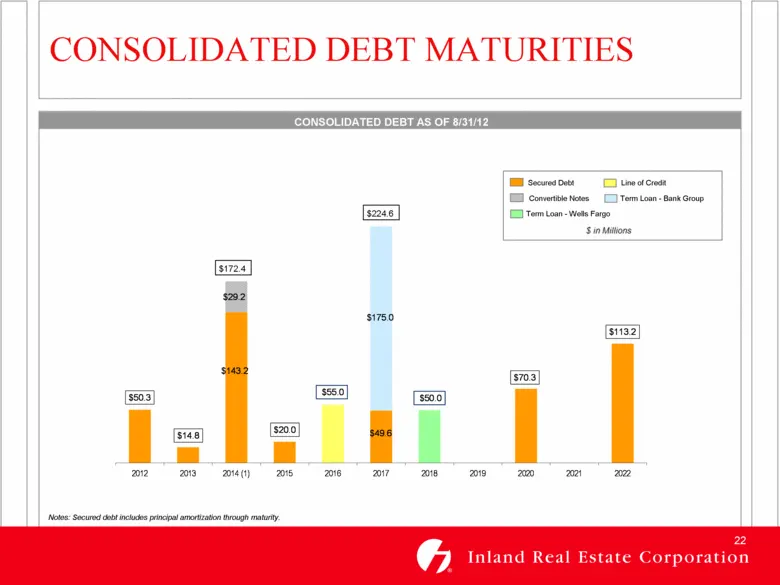
CONSOLIDATED DEBT MATURITIES CONSOLIDATED DEBT AS OF 8/31/12 Term Loan - Bank Group Term Loan - Wells Fargo Notes: Secured debt includes principal amortization through maturity. $172.4 $224.6 $50.3 $14.8 $143.2 $20.0 $49.6 $70.3 $113.2 $175.0 $50.0 $29.2 $55.0 2012 2013 2014 (1) 2015 2016 2017 2018
Slide 23: Joint Venture Growth Strategies
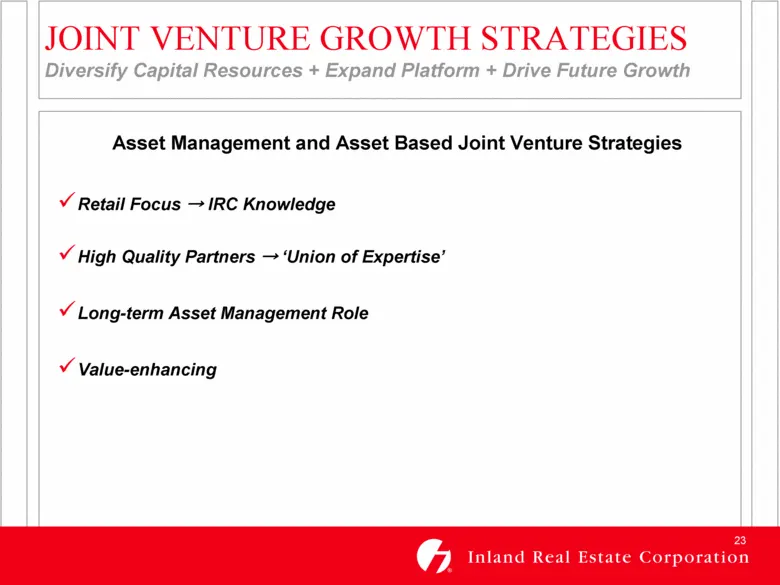
JOINT VENTURE GROWTH STRATEGIES Diversify Capital Resources + Expand Platform + Drive Future Growth Asset Management and Asset Based Joint Venture Strategies Retail Focus IRC Knowledge High Quality Partners ‘Union of Expertise’ Long-term Asset Management Role Value-enhancing
Slide 24: Joint Venture Fee Income
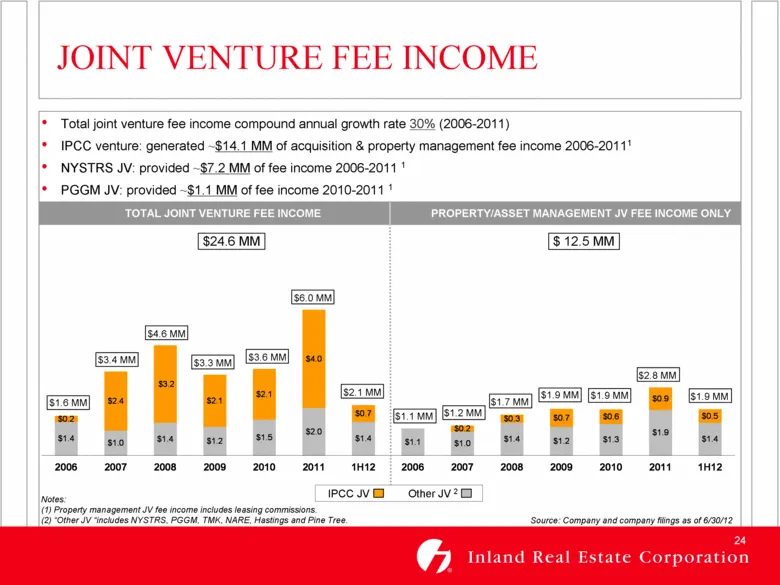
$3.4 MM $3.3 MM $1.6 MM $4.6 MM $3.6 MM $6.0 MM $1.1 MM $1.2 MM $1.7 MM $1.9 MM $2.8 MM $1.9 MM JOINT VENTURE FEE INCOME Total joint venture fee income compound annual growth rate 30% (2006-2011) IPCC venture: generated ~$14.1 MM of acquisition & property management fee income 2006-20111 NYSTRS JV:
Slide 25: Asset Management Venture: IPCC
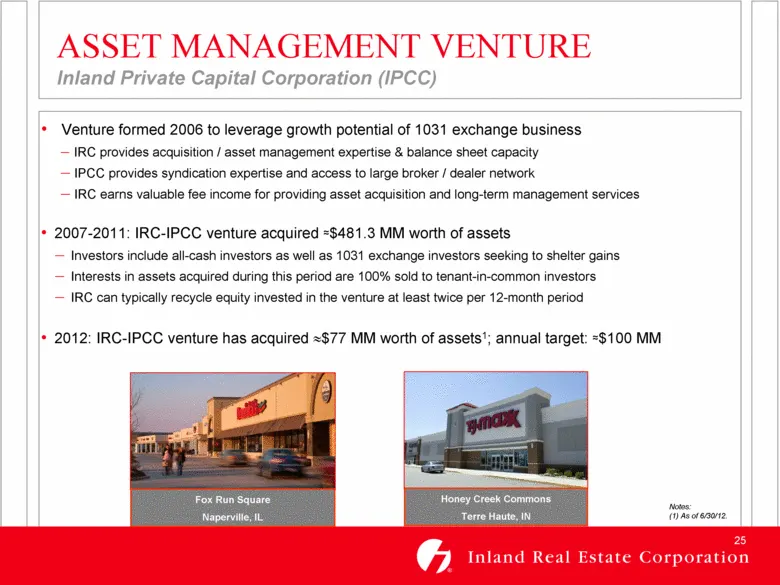
ASSET MANAGEMENT VENTURE Inland Private Capital Corporation (IPCC) Venture formed 2006 to leverage growth potential of 1031 exchange business IRC provides acquisition / asset management expertise & balance sheet capacity IPCC provides syndication expertise and access to large broker / dealer network
Slide 26: Joint Venture with NYSTRS
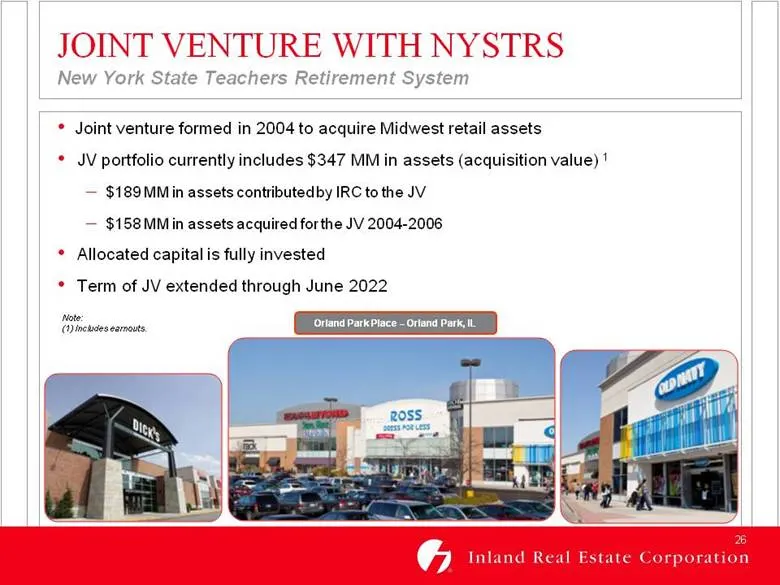
JOINT VENTURE WITH NYSTRS New York State Teachers Retirement System Joint venture formed in 2004 to acquire Midwest retail assets JV portfolio currently includes $347 MM in assets (acquisition value) 1 $189 MM in assets contributed by IRC to the JV $158 MM in assets acquired for the JV 2004-2006 All
Slide 27: Joint Venture with PGGM
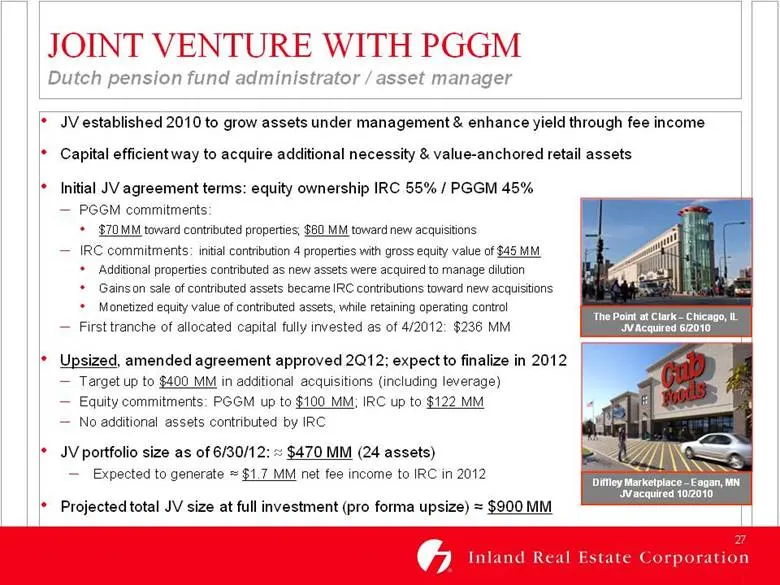
JOINT VENTURE WITH PGGM Dutch pension fund administrator / asset manager JV established 2010 to grow assets under management & enhance yield through fee income Capital efficient way to acquire additional necessity & value-anchored retail assets Initial JV agreement terms: equity ownership IRC 55% /
Slide 28: Joint Venture with PGGM: JV Structure
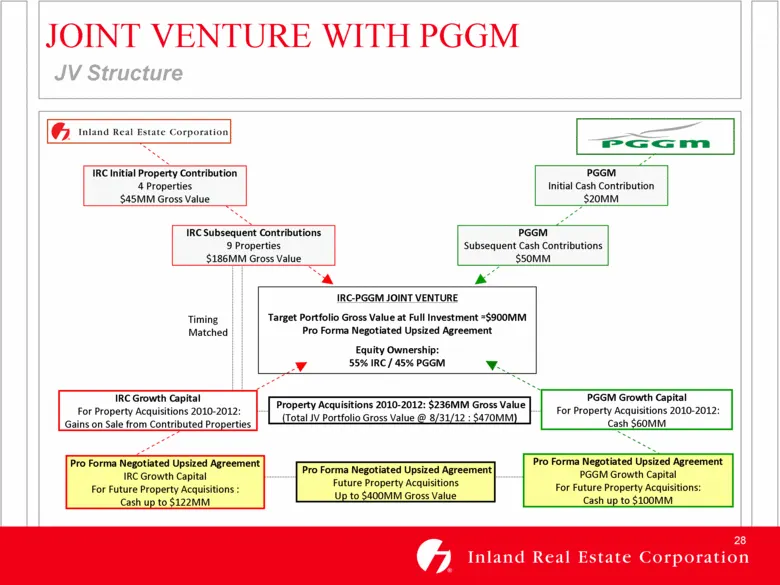
JOINT VENTURE WITH PGGM JV Structure IRC-PGGM JOINT VENTURE Target Portfolio Gross Value at Full Investment ≈$900MM Pro Forma Negotiated Upsized Agreement Equity Ownership: 55% IRC / 45% PGGM Timing Matched Pro Forma Negotiated Upsized Agreement IRC Growth Capital For Future Property Acquisitions :
Slide 29: Summary
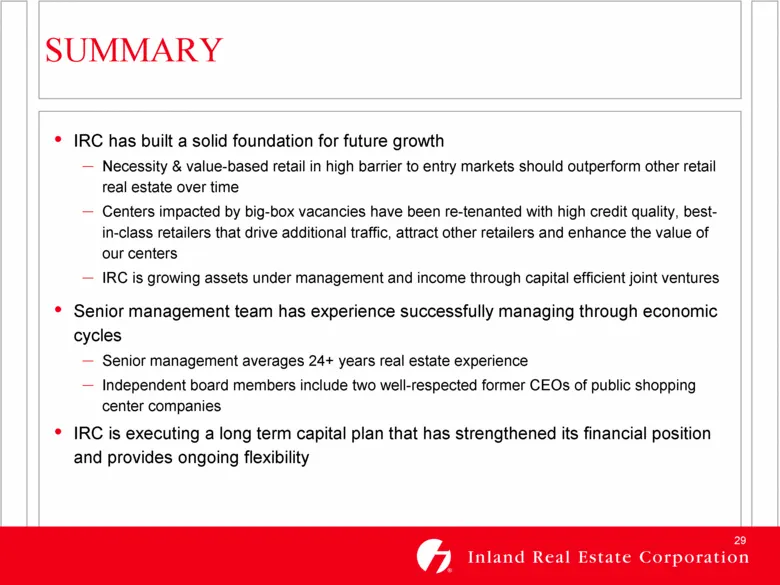
IRC has built a solid foundation for future growth Necessity & value-based retail in high barrier to entry markets should outperform other retail real estate over time Centers impacted by big-box vacancies have been re-tenanted with high credit quality, best-in-class retailers that drive additional
Slide 30: Forward-Looking Statements
FORWARD-LOOKING STATEMENTS Certain statements in this presentation constitute "forward-looking statements" within the meaning of the Federal Private Securities Litigation Reform Act of 1995. These forward-looking statements are not historical facts but are the intent, belief or current expectations
Source: SEC EDGAR · 8-K filed Sep 5, 2012
More decks from Inland Real Estate Corp
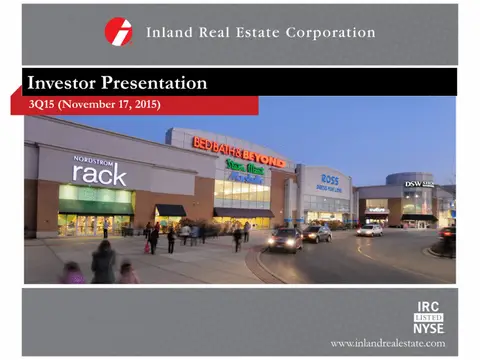 Investor Presentation (November 2015)30 slides · Nov 17, 2015
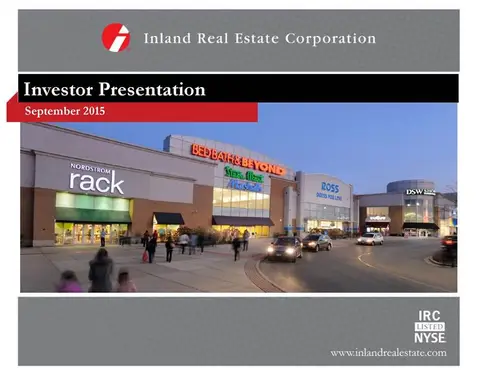 Investor Presentation (September 2015)29 slides · Sep 16, 2015
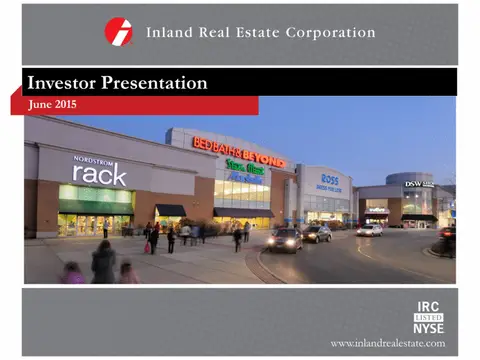 Investor Presentation (June 2015)29 slides · Jun 9, 2015
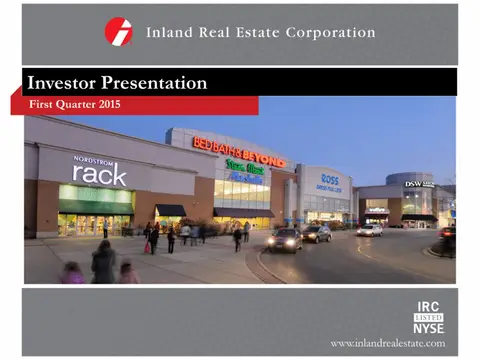 Investor Presentation (May 2015)26 slides · May 15, 2015
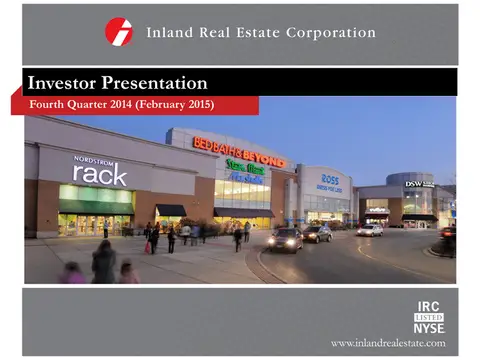 Investor Presentation (February 2015)26 slides · Feb 24, 2015
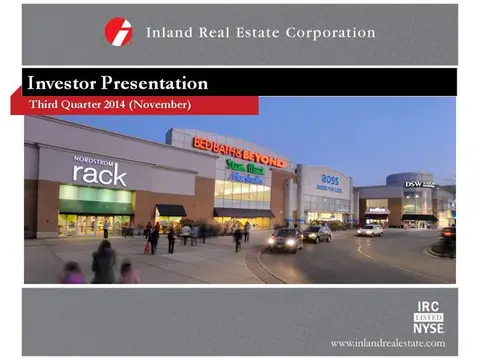 Investor Presentation (November 2014)26 slides · Nov 5, 2014