Home Loan Servicing Solutions Ltd
Home Loan Servicing Solutions — Debt Investor Presentation (June 2013)
44 slides from Home Loan Servicing Solutions's debt investor presentation, Jun 11, 2013
Slide 1: Lender Public-Side Meeting Presentation - Senior Secured Term Loan
Lender Public-Side June 11,Meeting 2013 Presentation Senior Secured Term Loan
Slide 2: Forward-Looking Statements and Non-GAAP Measures
FORWARD-LOOKING This statements operations, materially Factors” forward any reflect NON-GAAP In revenue prior 2The addition other information presentation periods. new and looking and person from regarding to are information servicing “Management’s MEASURES: Non-GAAP financial forward those statemen
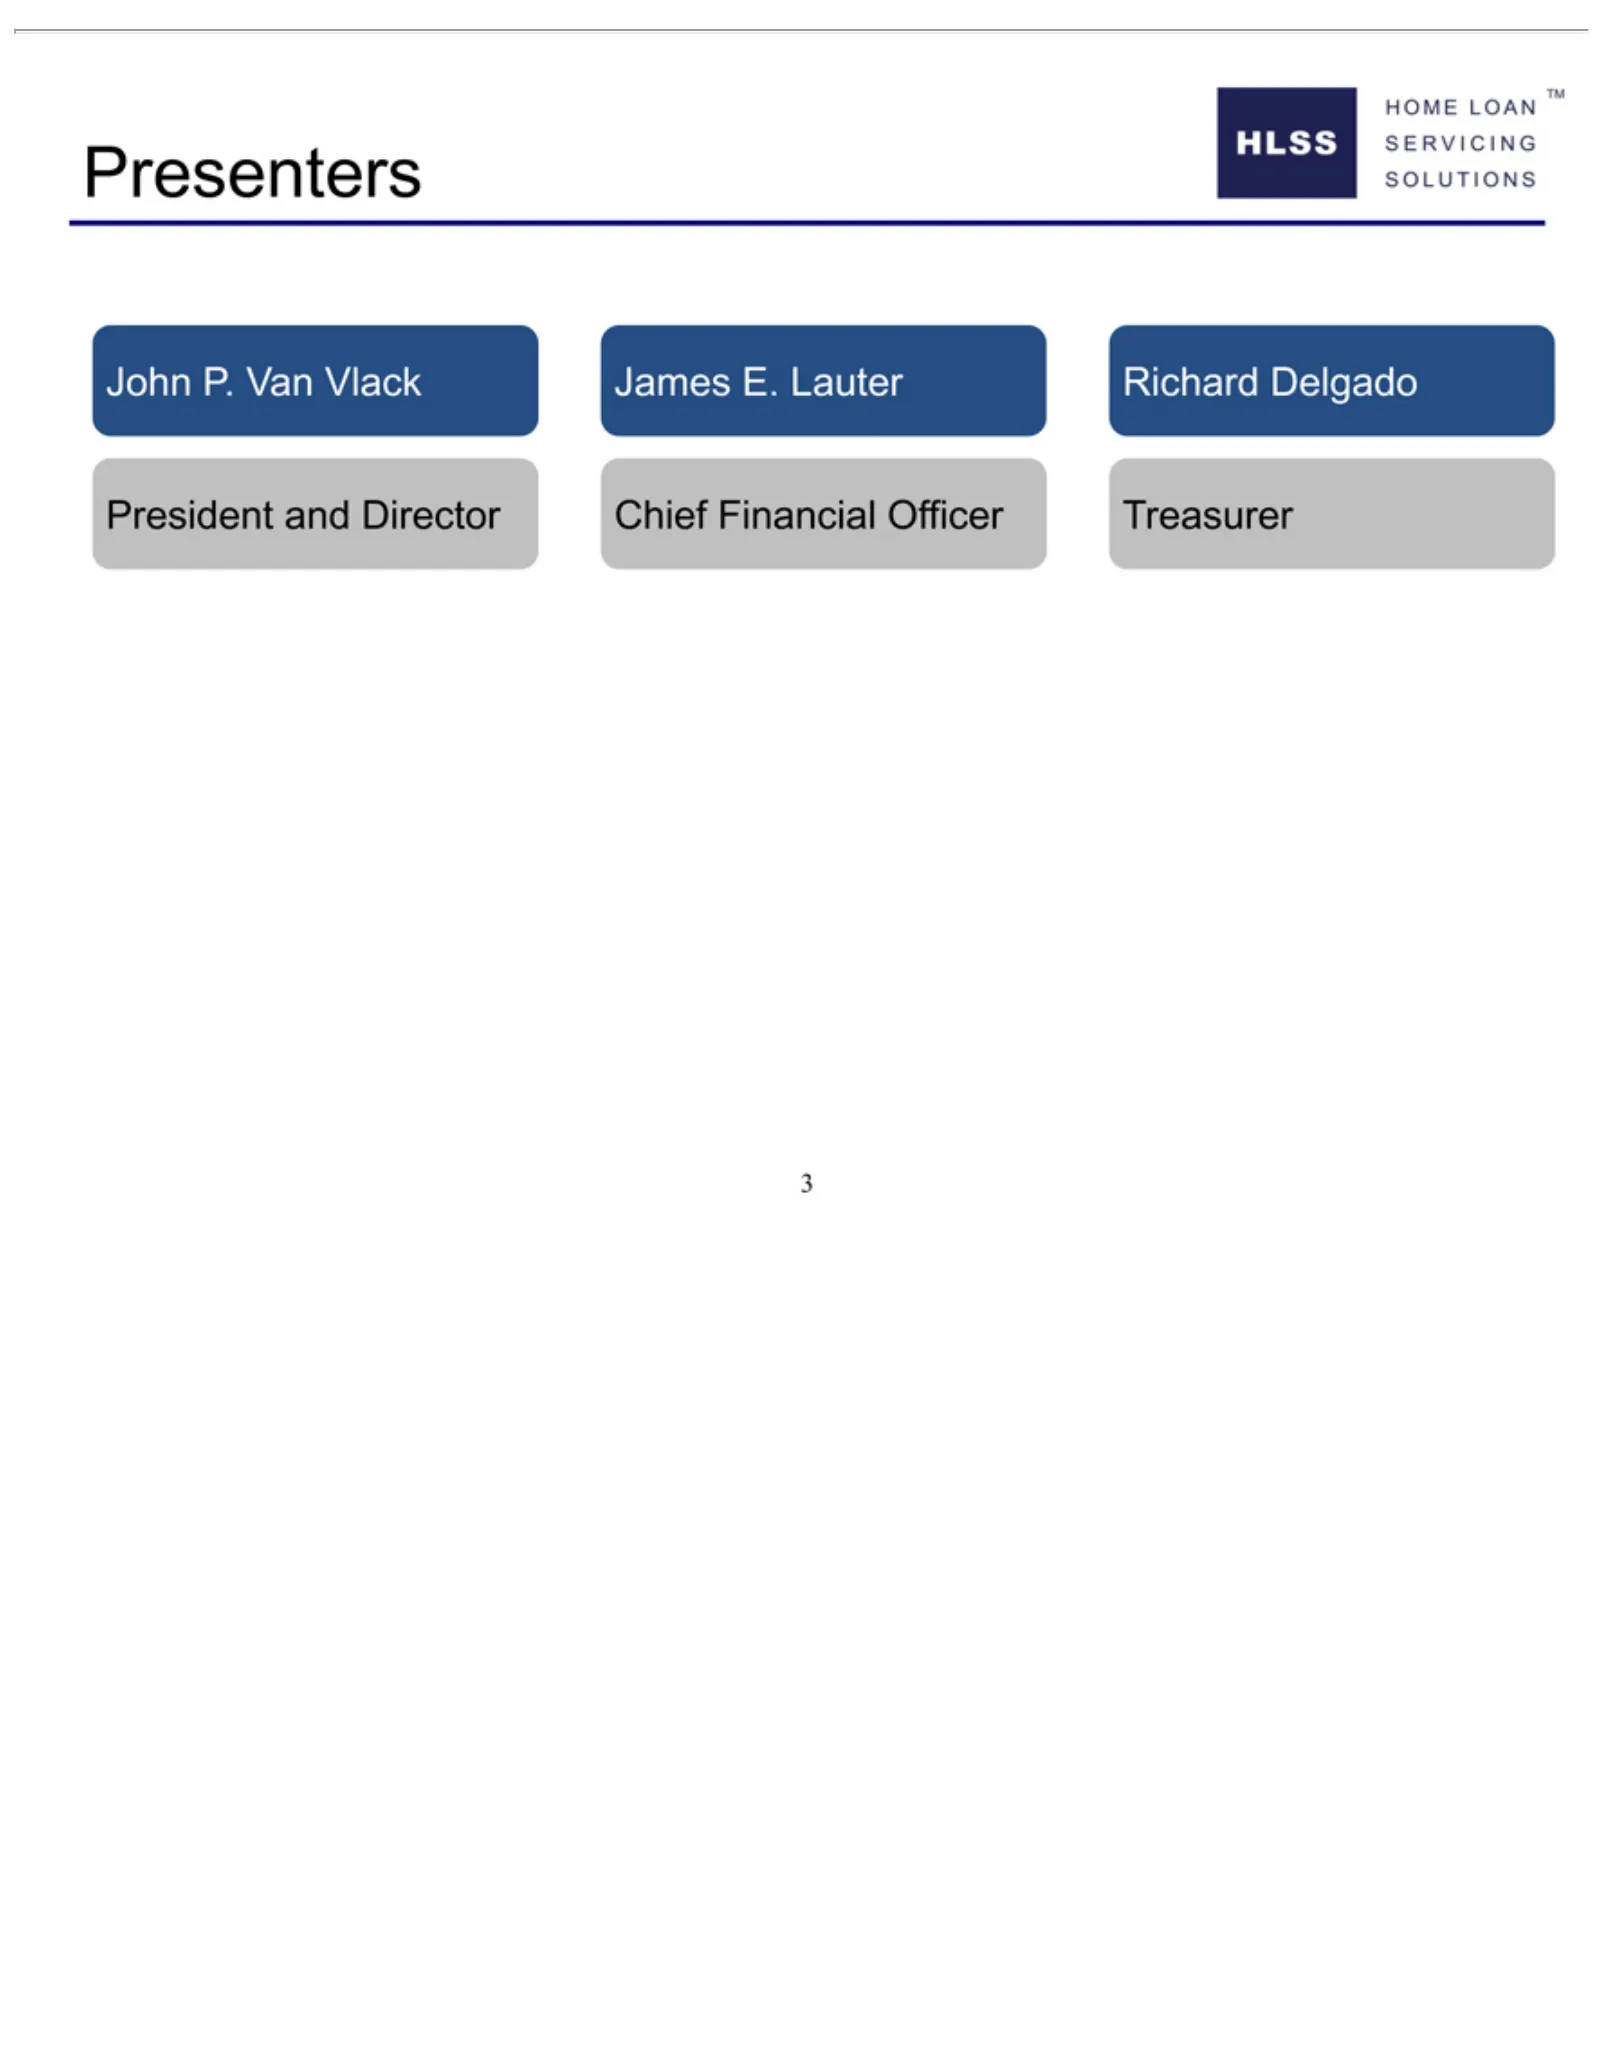
Slide 3: Presenters
John P. Van Presenters 3President and Vlack Director JamesChief E. Lauter Financial Richard Officer Delgado Treasurer
Slide 4: Company Overview and Strategy
4Company Overview and Strategy
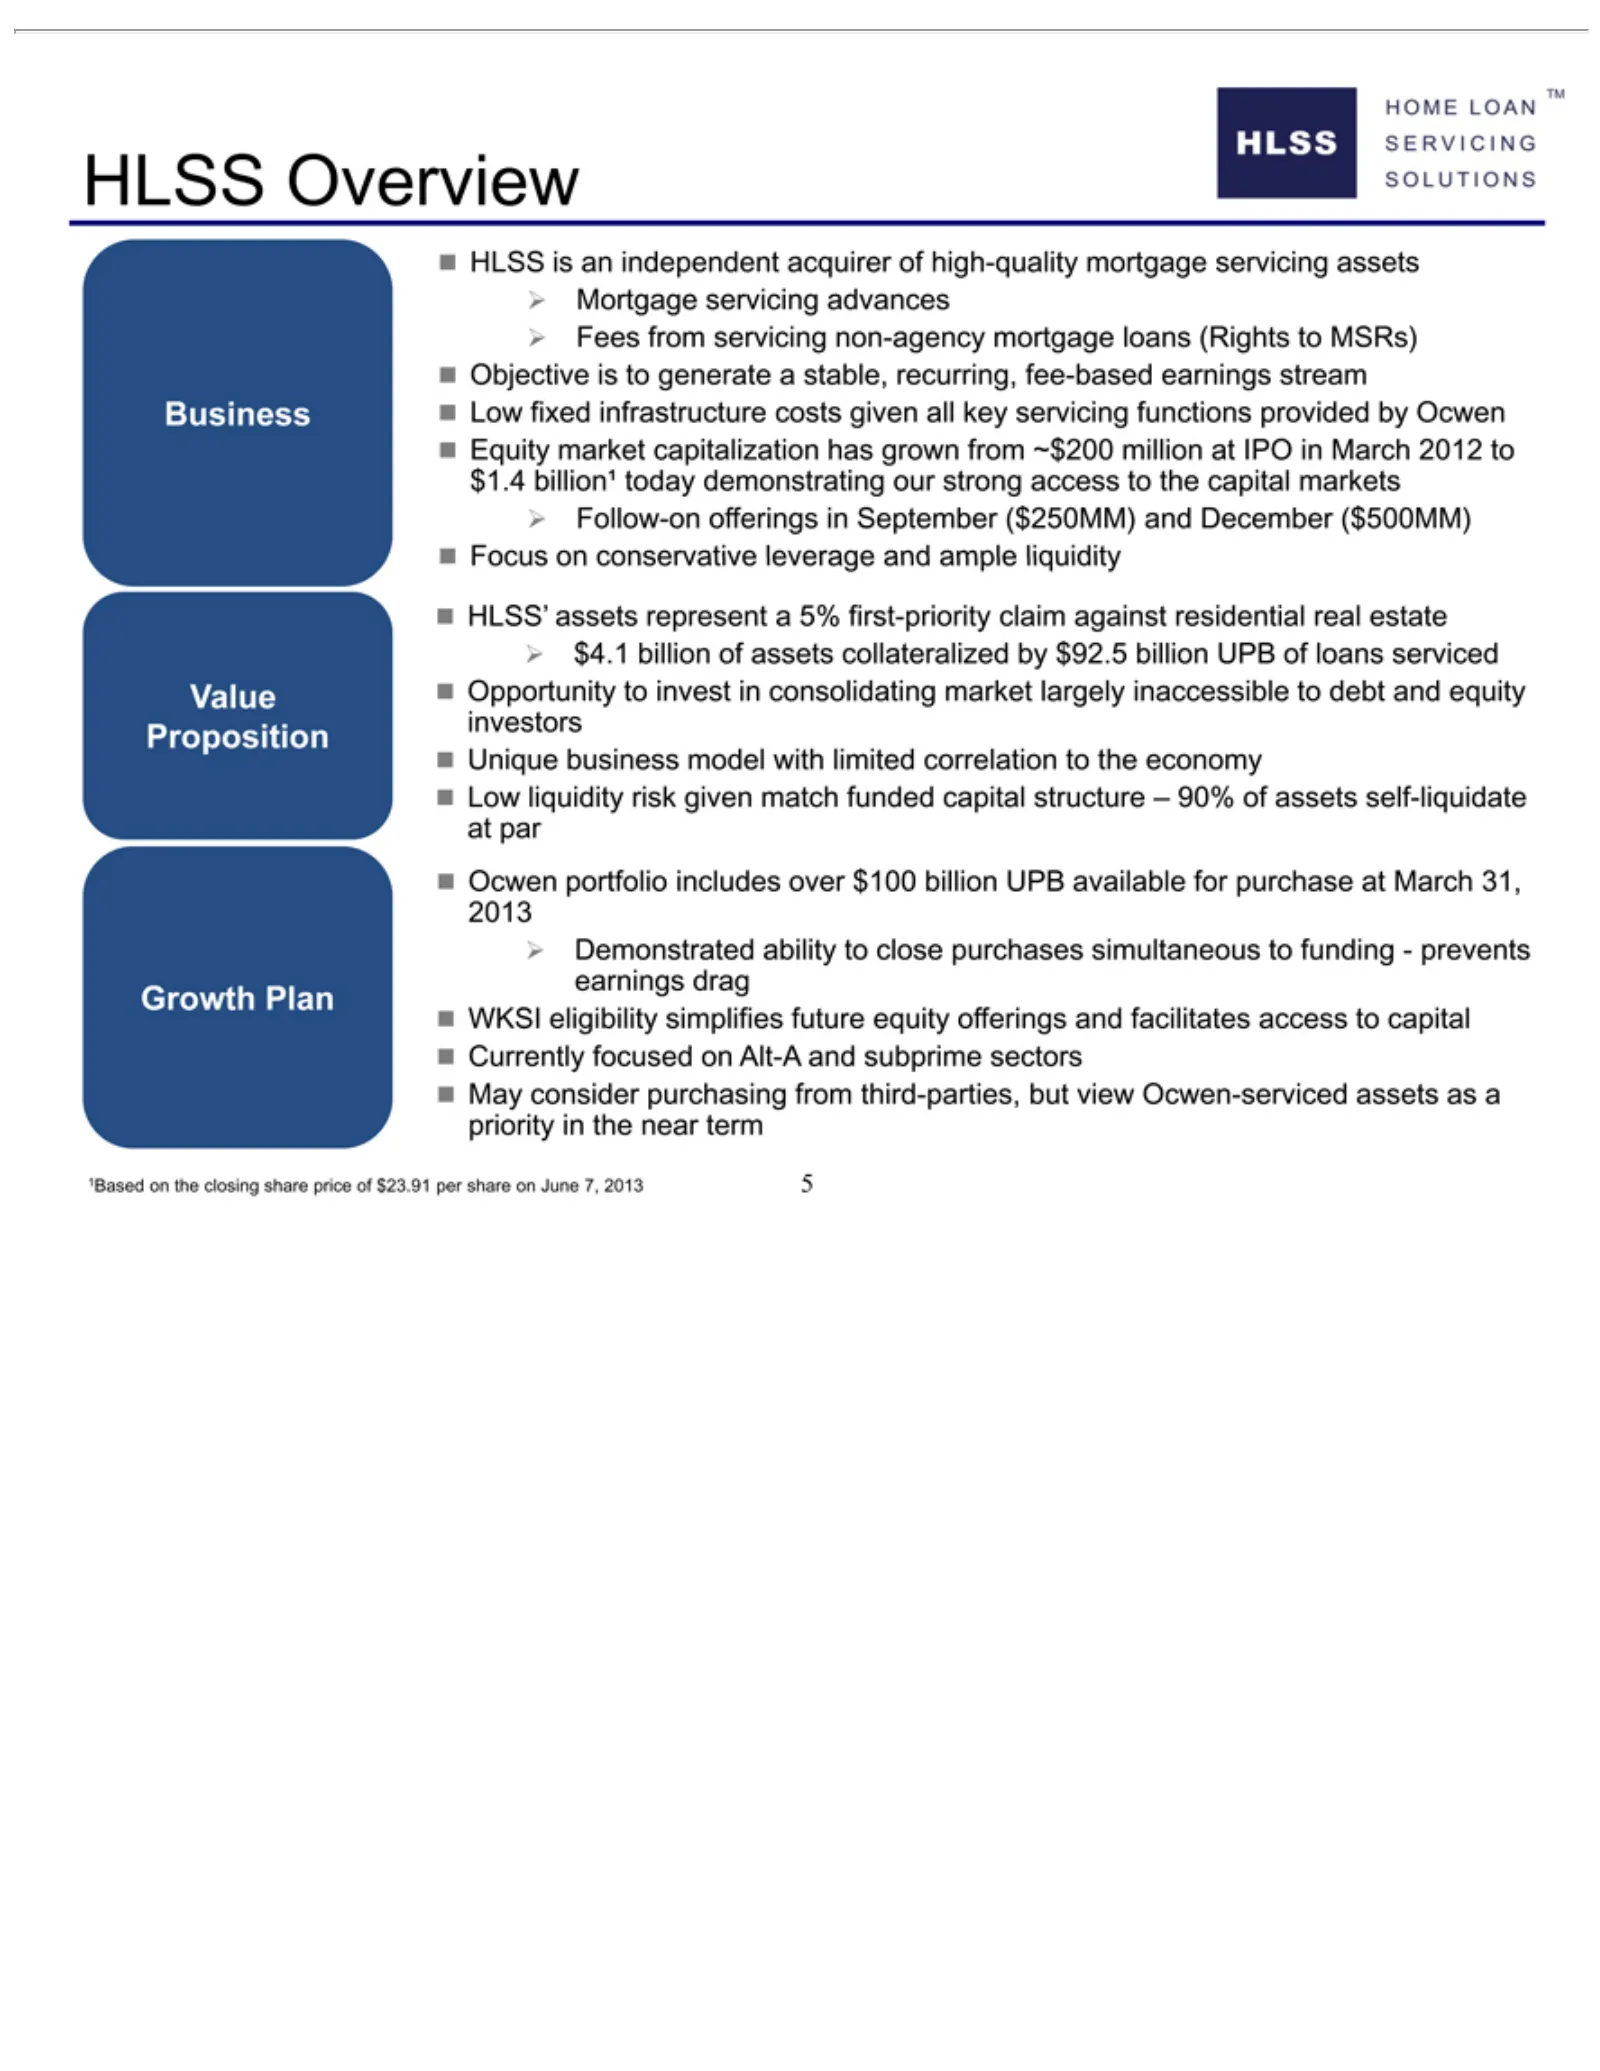
Slide 5: HLSS Value Proposition and Business Overview
HLSS Proposition Business fee-based demonstrating Value HLSS’ inaccessible Growth Ocwen equity 51BasedOverview is offerings assets portfolio on Plan anearnings the independent torepresent closing our debt and includes strong stream and facilitates share aequity acquirer 5% access over Low price firs
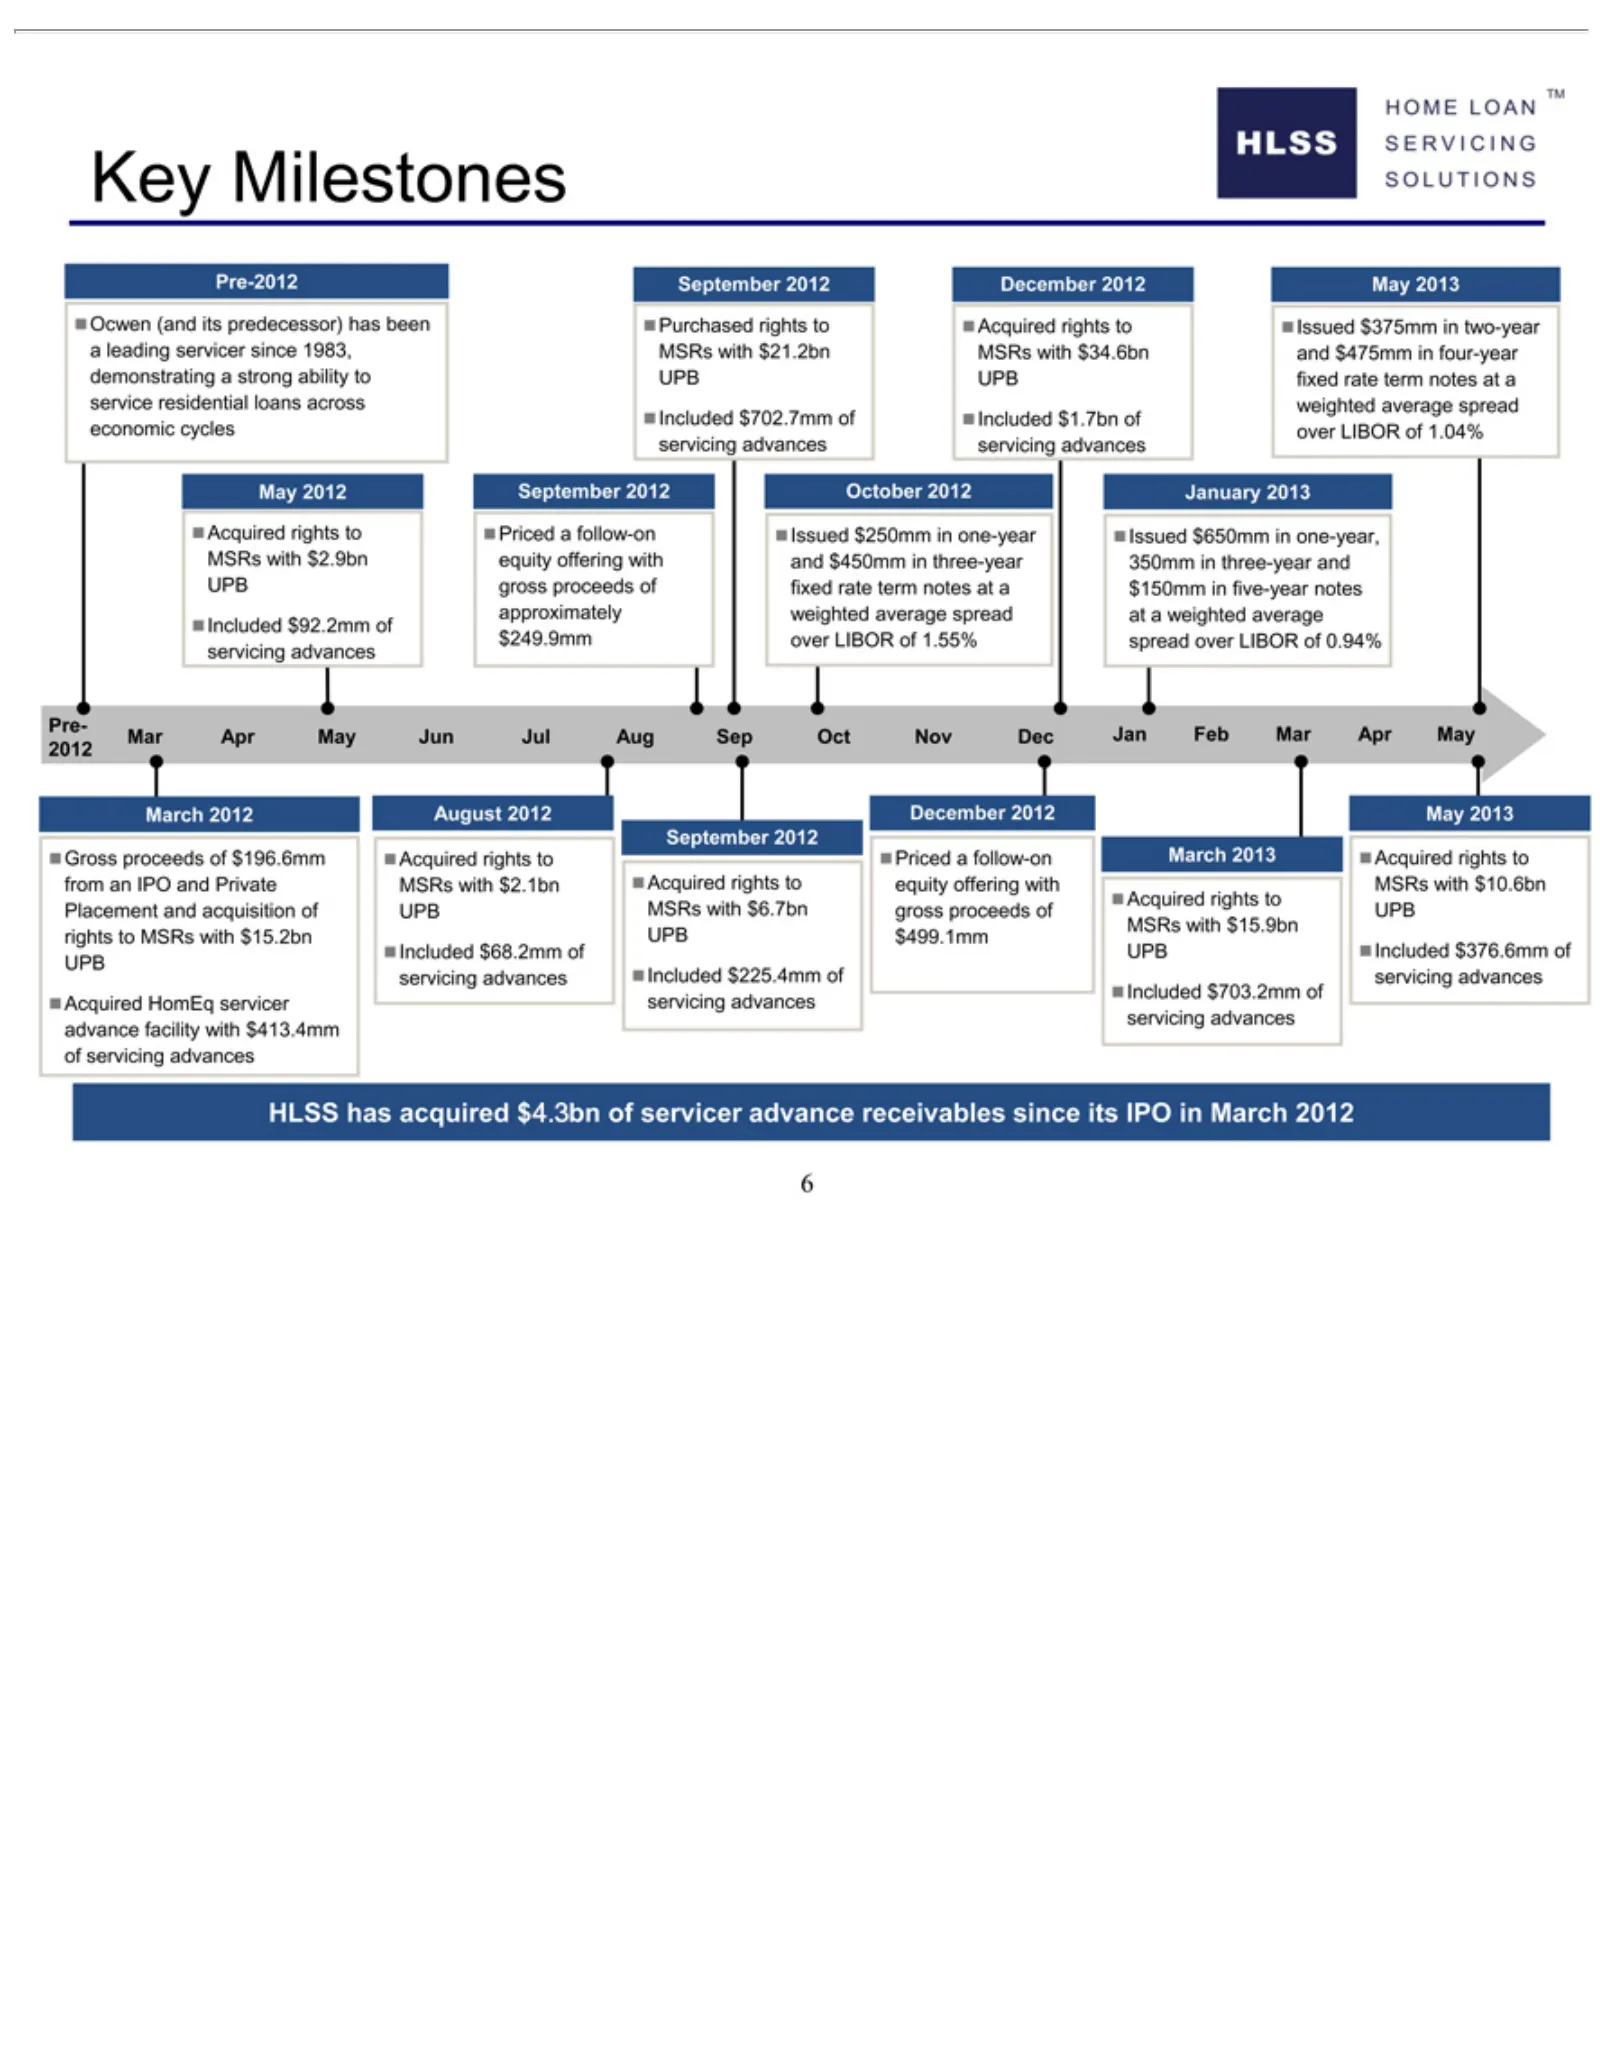
Slide 6: Key HLSS Milestones
Key Jan Ocwen Pre-2012 Purchased October January Issued Pre- Gross August September December Priced March May Acquired Included 6HLSSMilestones 2012 2013 proceeds has a$650mm $375mm $250mm 2012 2013 (and 2012 2013 2012 follow-on Feb $702.7mm $1.7bn $92.2mm $68.2mm $225.4mm $703.2mm $376.6mm HomEq ri
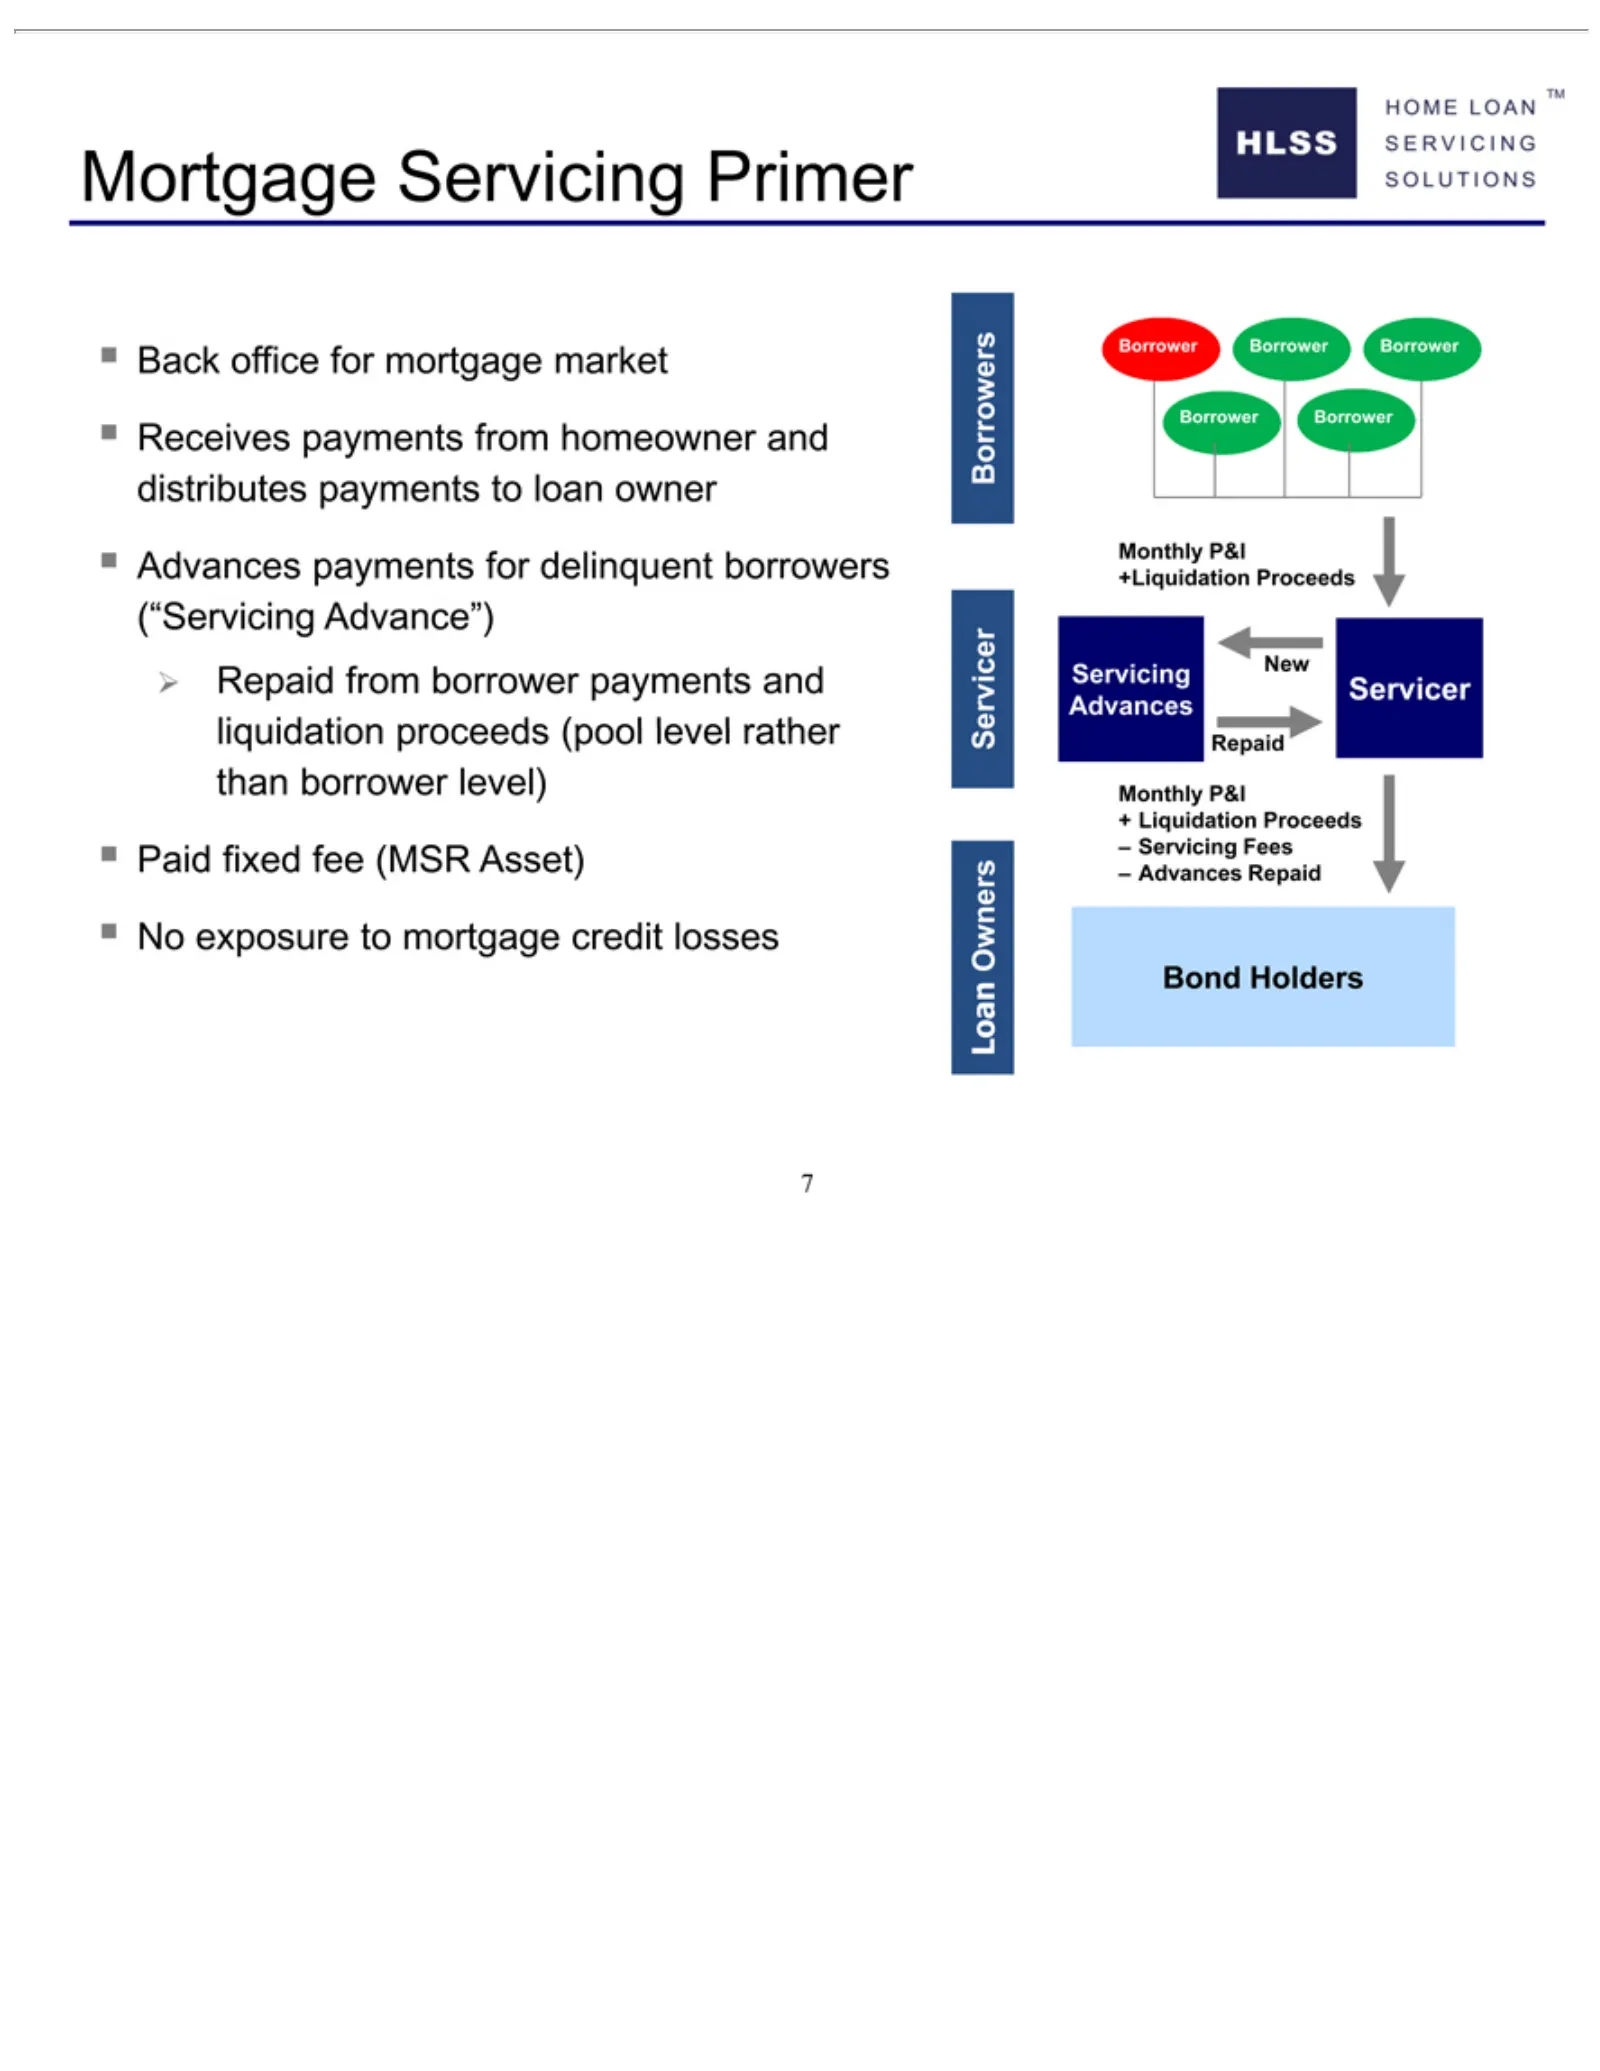
Slide 7: Mortgage Servicing Advances Explained
Mortgage Back Receives Advances Paid No Loan Borrower +Liquidation Servicing Monthly Repaid –+ 7Bond Advances Servicing Liquidation exposure fixed Owners office Holders P&I payments Borrower New Servicing payments fee Fees for Repaid to Proceeds Servicer Proceeds (MSR Servicer mortgage from Borrower
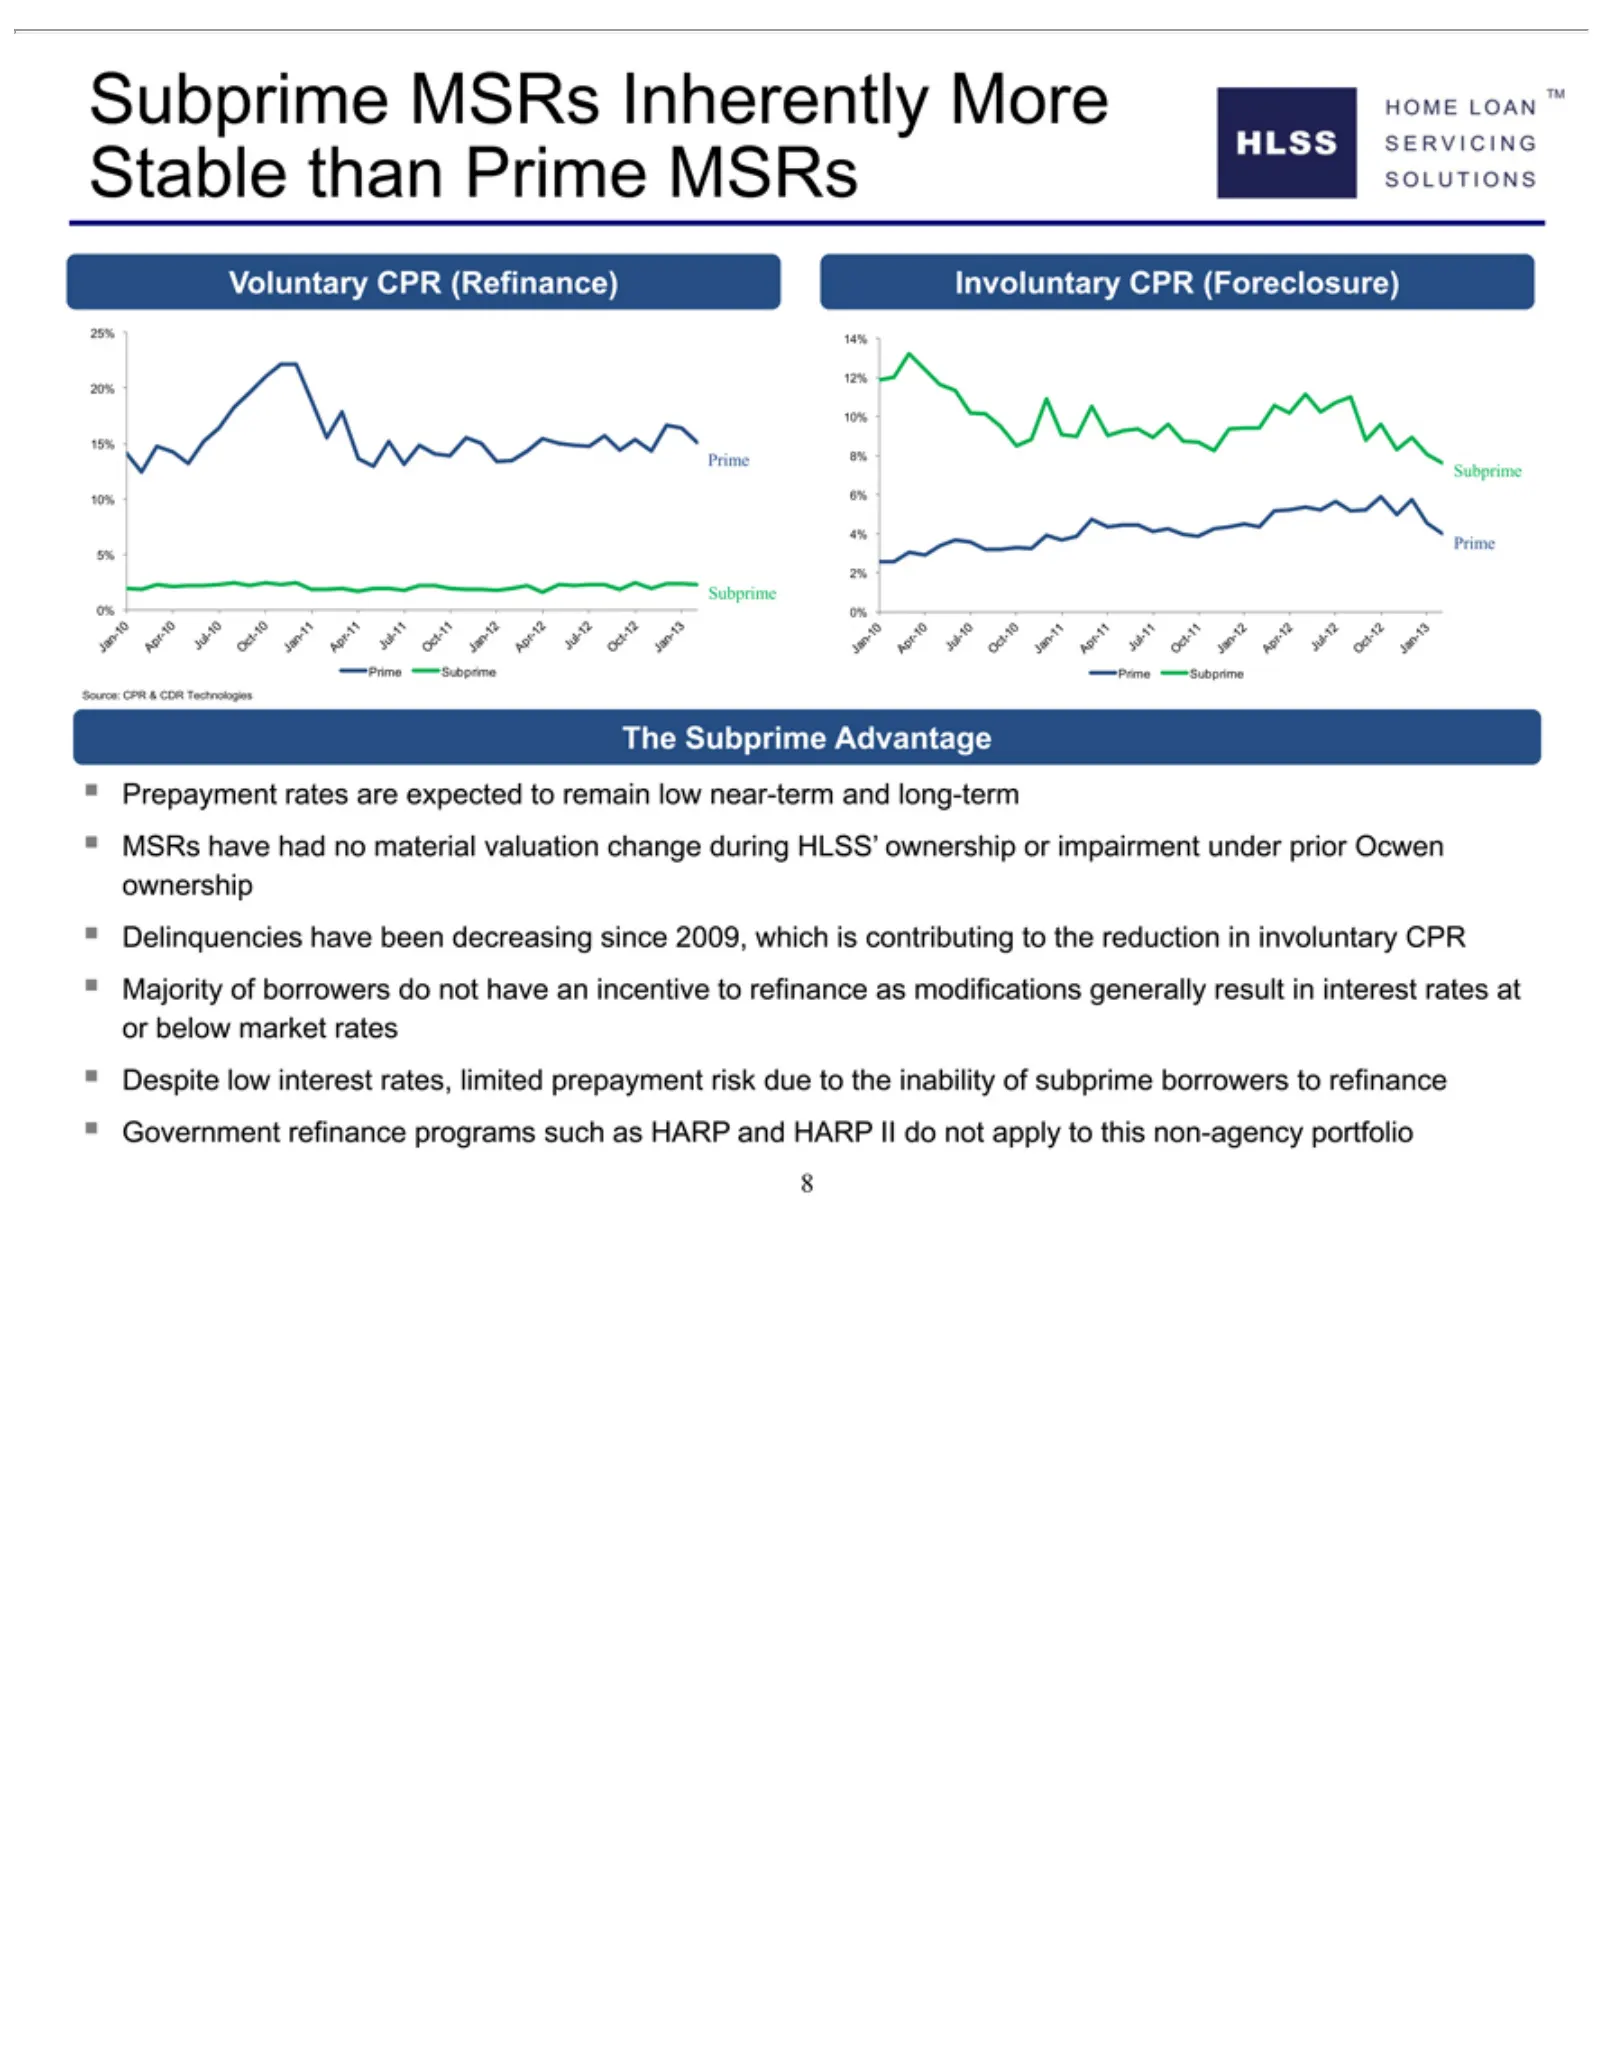
Slide 8: Subprime MSRs Inherently Stable Prepayment Advantage
Voluntary Subprime 5% 10% 15% 20% 25% Source: Involuntary 14% 8% 0% 2% Prime 4% 6% The Prepayment MSRs involuntary 8inability Subprime Subprime 12% Subprime have CPR ofMSRs 10% CPR subprime CPR had rates &Advantage (Refinance) CDR no Inherently Majority (Foreclosure) are material expected borrowers
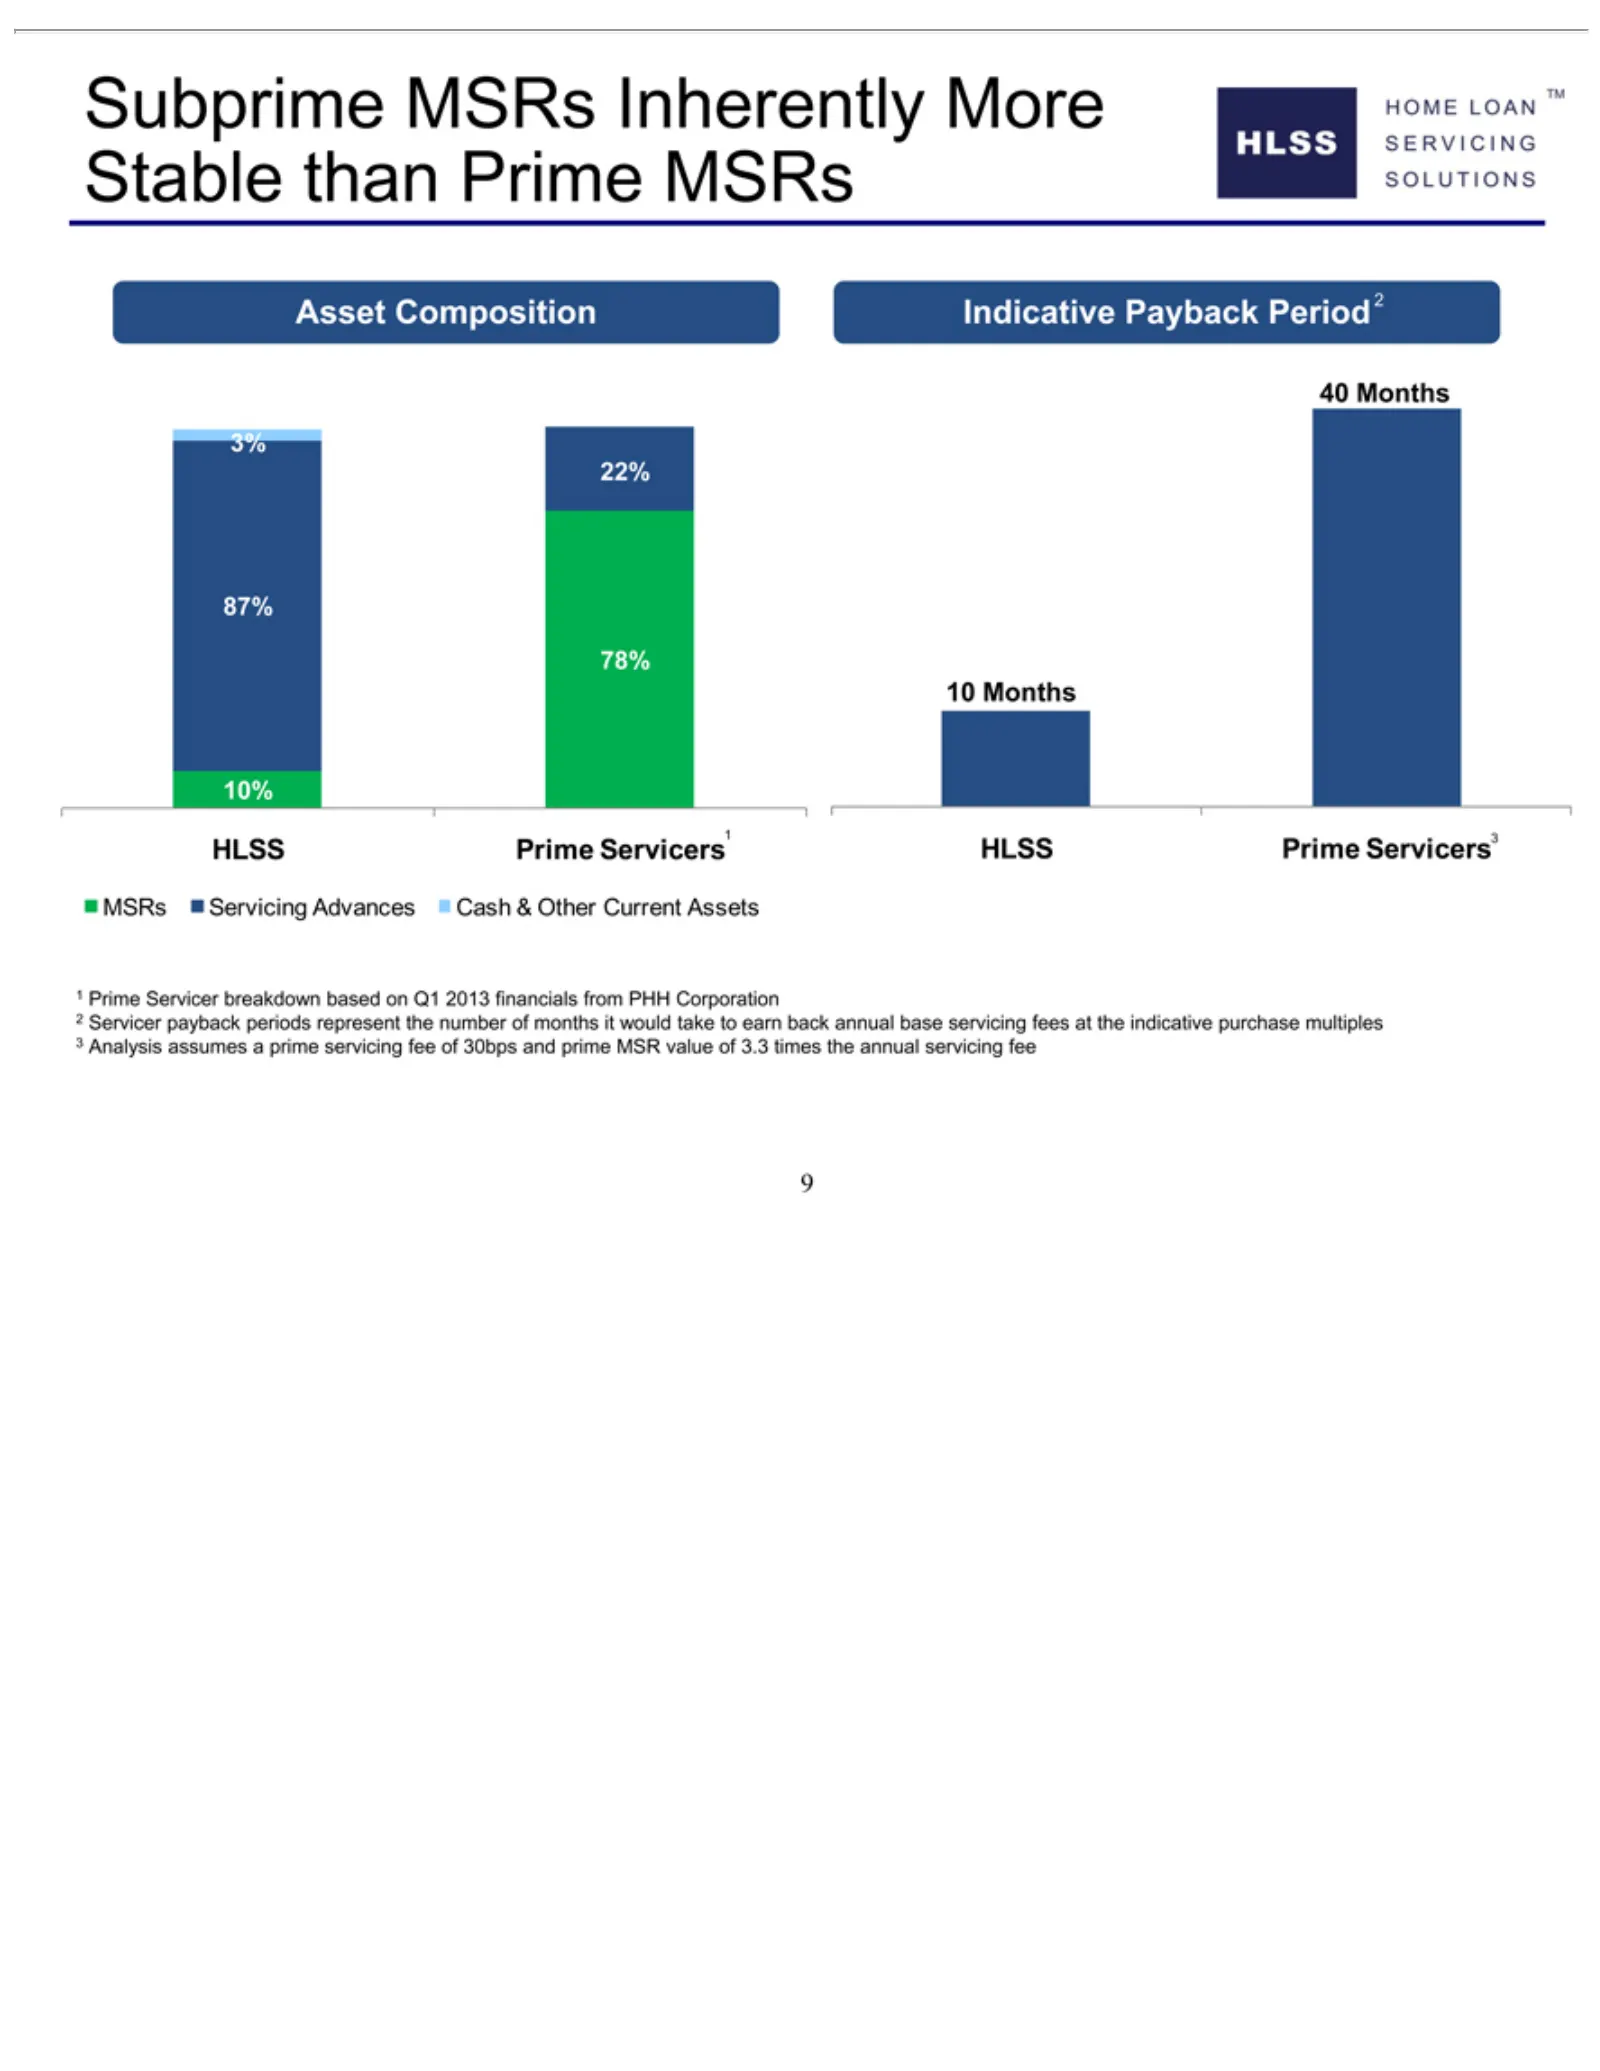
Slide 9: Subprime Asset Composition and Payback Analysis
Subprime Asset 40 10 78% 87% 22% 3% 110% Months Composition Indicative MSRs HLSS 932 Servicer MSRsPrime Servicing Prime Analysis Inherently Payback payback Servicers3 Servicer Advances Period2 assumes periods More breakdown aCash HLSS &Stable represent prime thePrime Other based than Prime Servicers
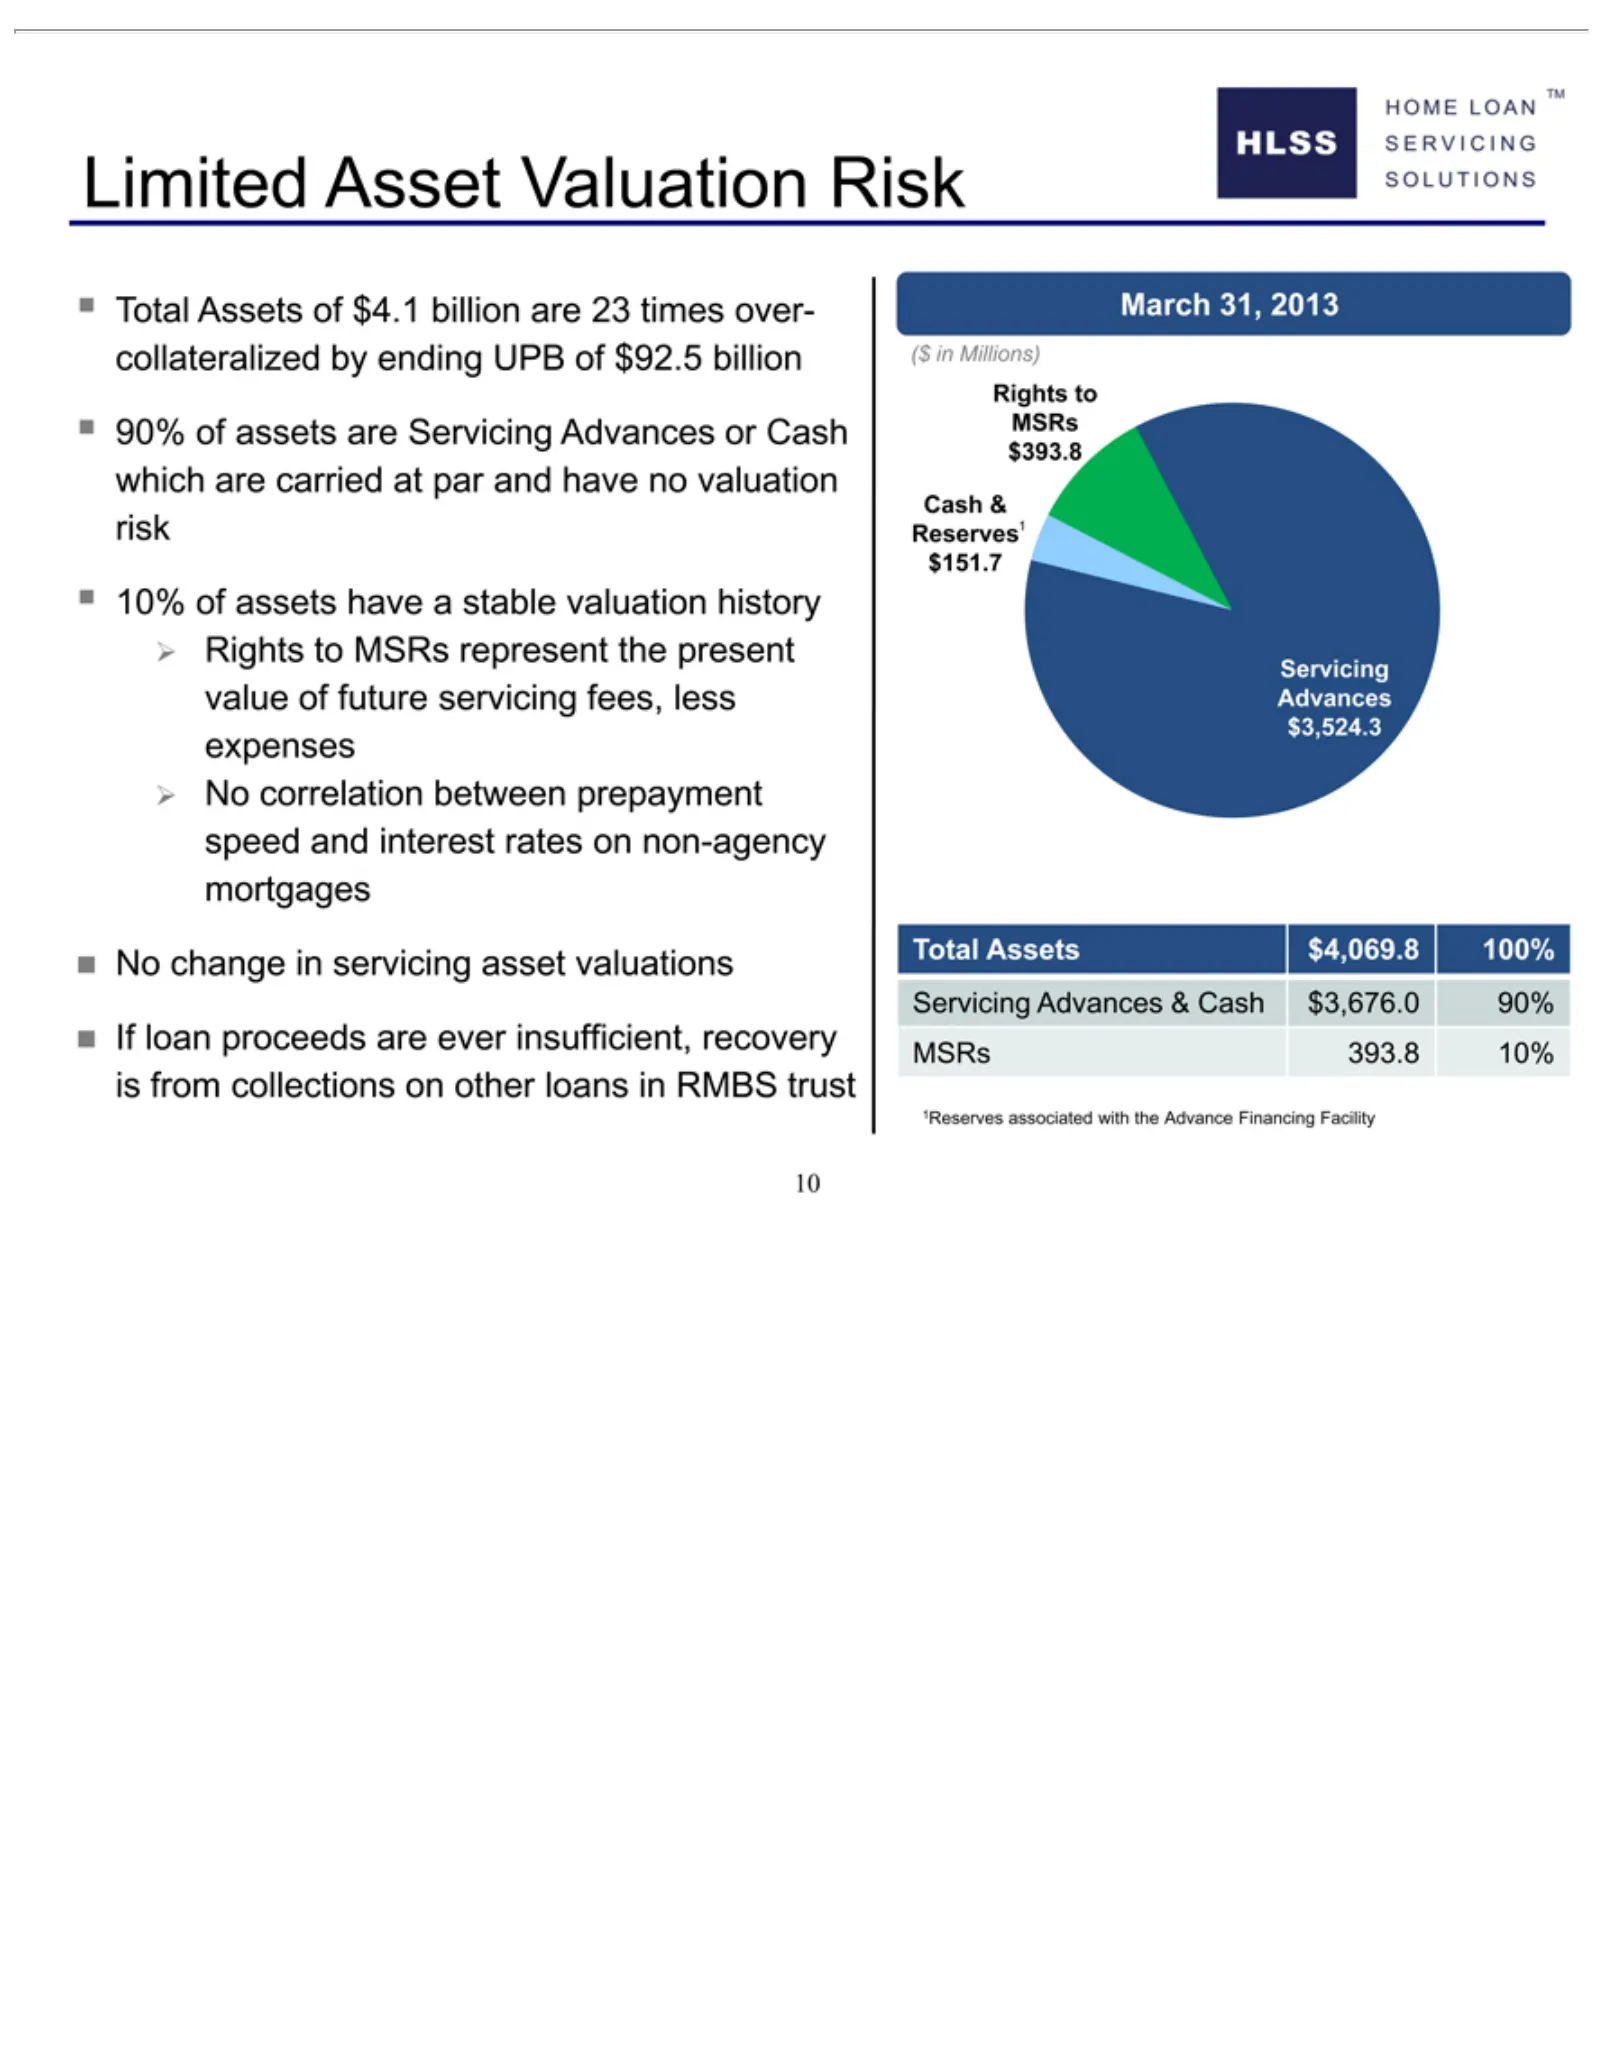
Slide 10: Limited Asset Valuation Risk
Limited 90% 10% No If March ($ Rights Cash Total Servicing 10 loan inchange of Millions) Assets &31, to proceeds assets Reserves1 Asset MSRs Advances 2013 in$4,069.8 ofservicing are have Valuation $4.1 $393.8 are Servicing $151.7 aever billion $3,524.3 &stable 100% Cash asset Risk insufficient, are
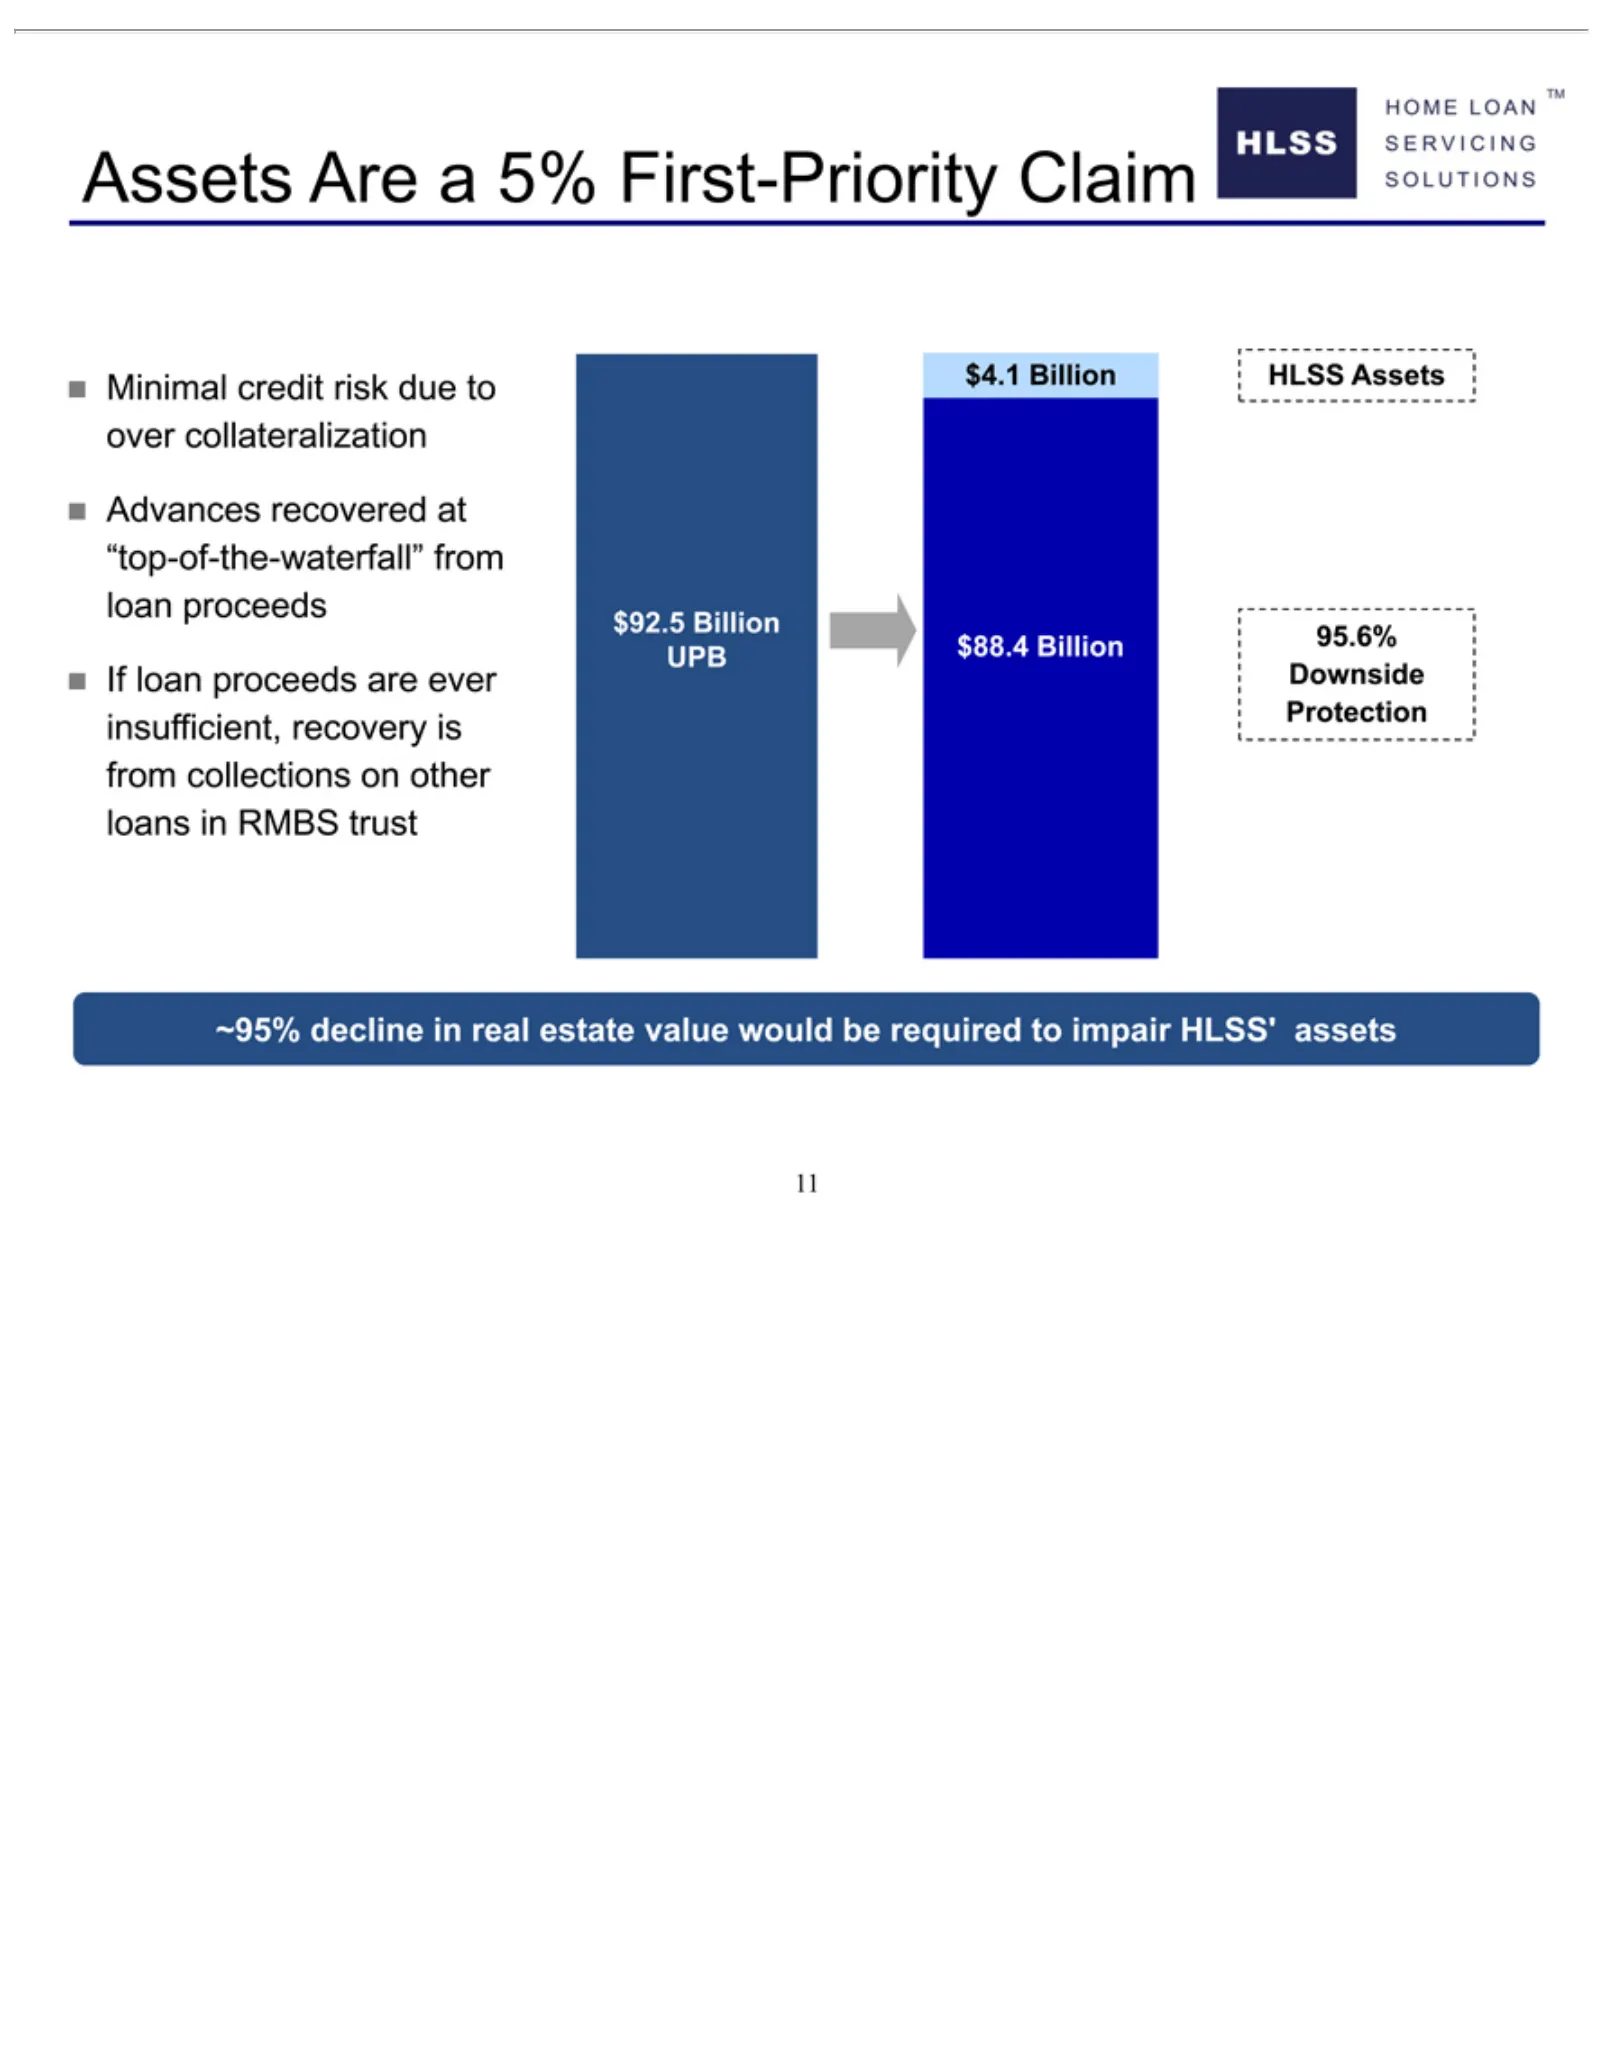
Slide 11: Minimal Advances Downside Protection
Assets Minimal Advances If $92.5 $4.1 $88.4 HLSS 95.6% ~95% 11 loan Billion Billion decline Assets Are Downside proceeds credit recovered a 5% UPB inrisk are real First-Priority Protection due ever at estate “top-of-the-waterfall” toinsufficient, over value Claim collateralization wouldrecovery be r
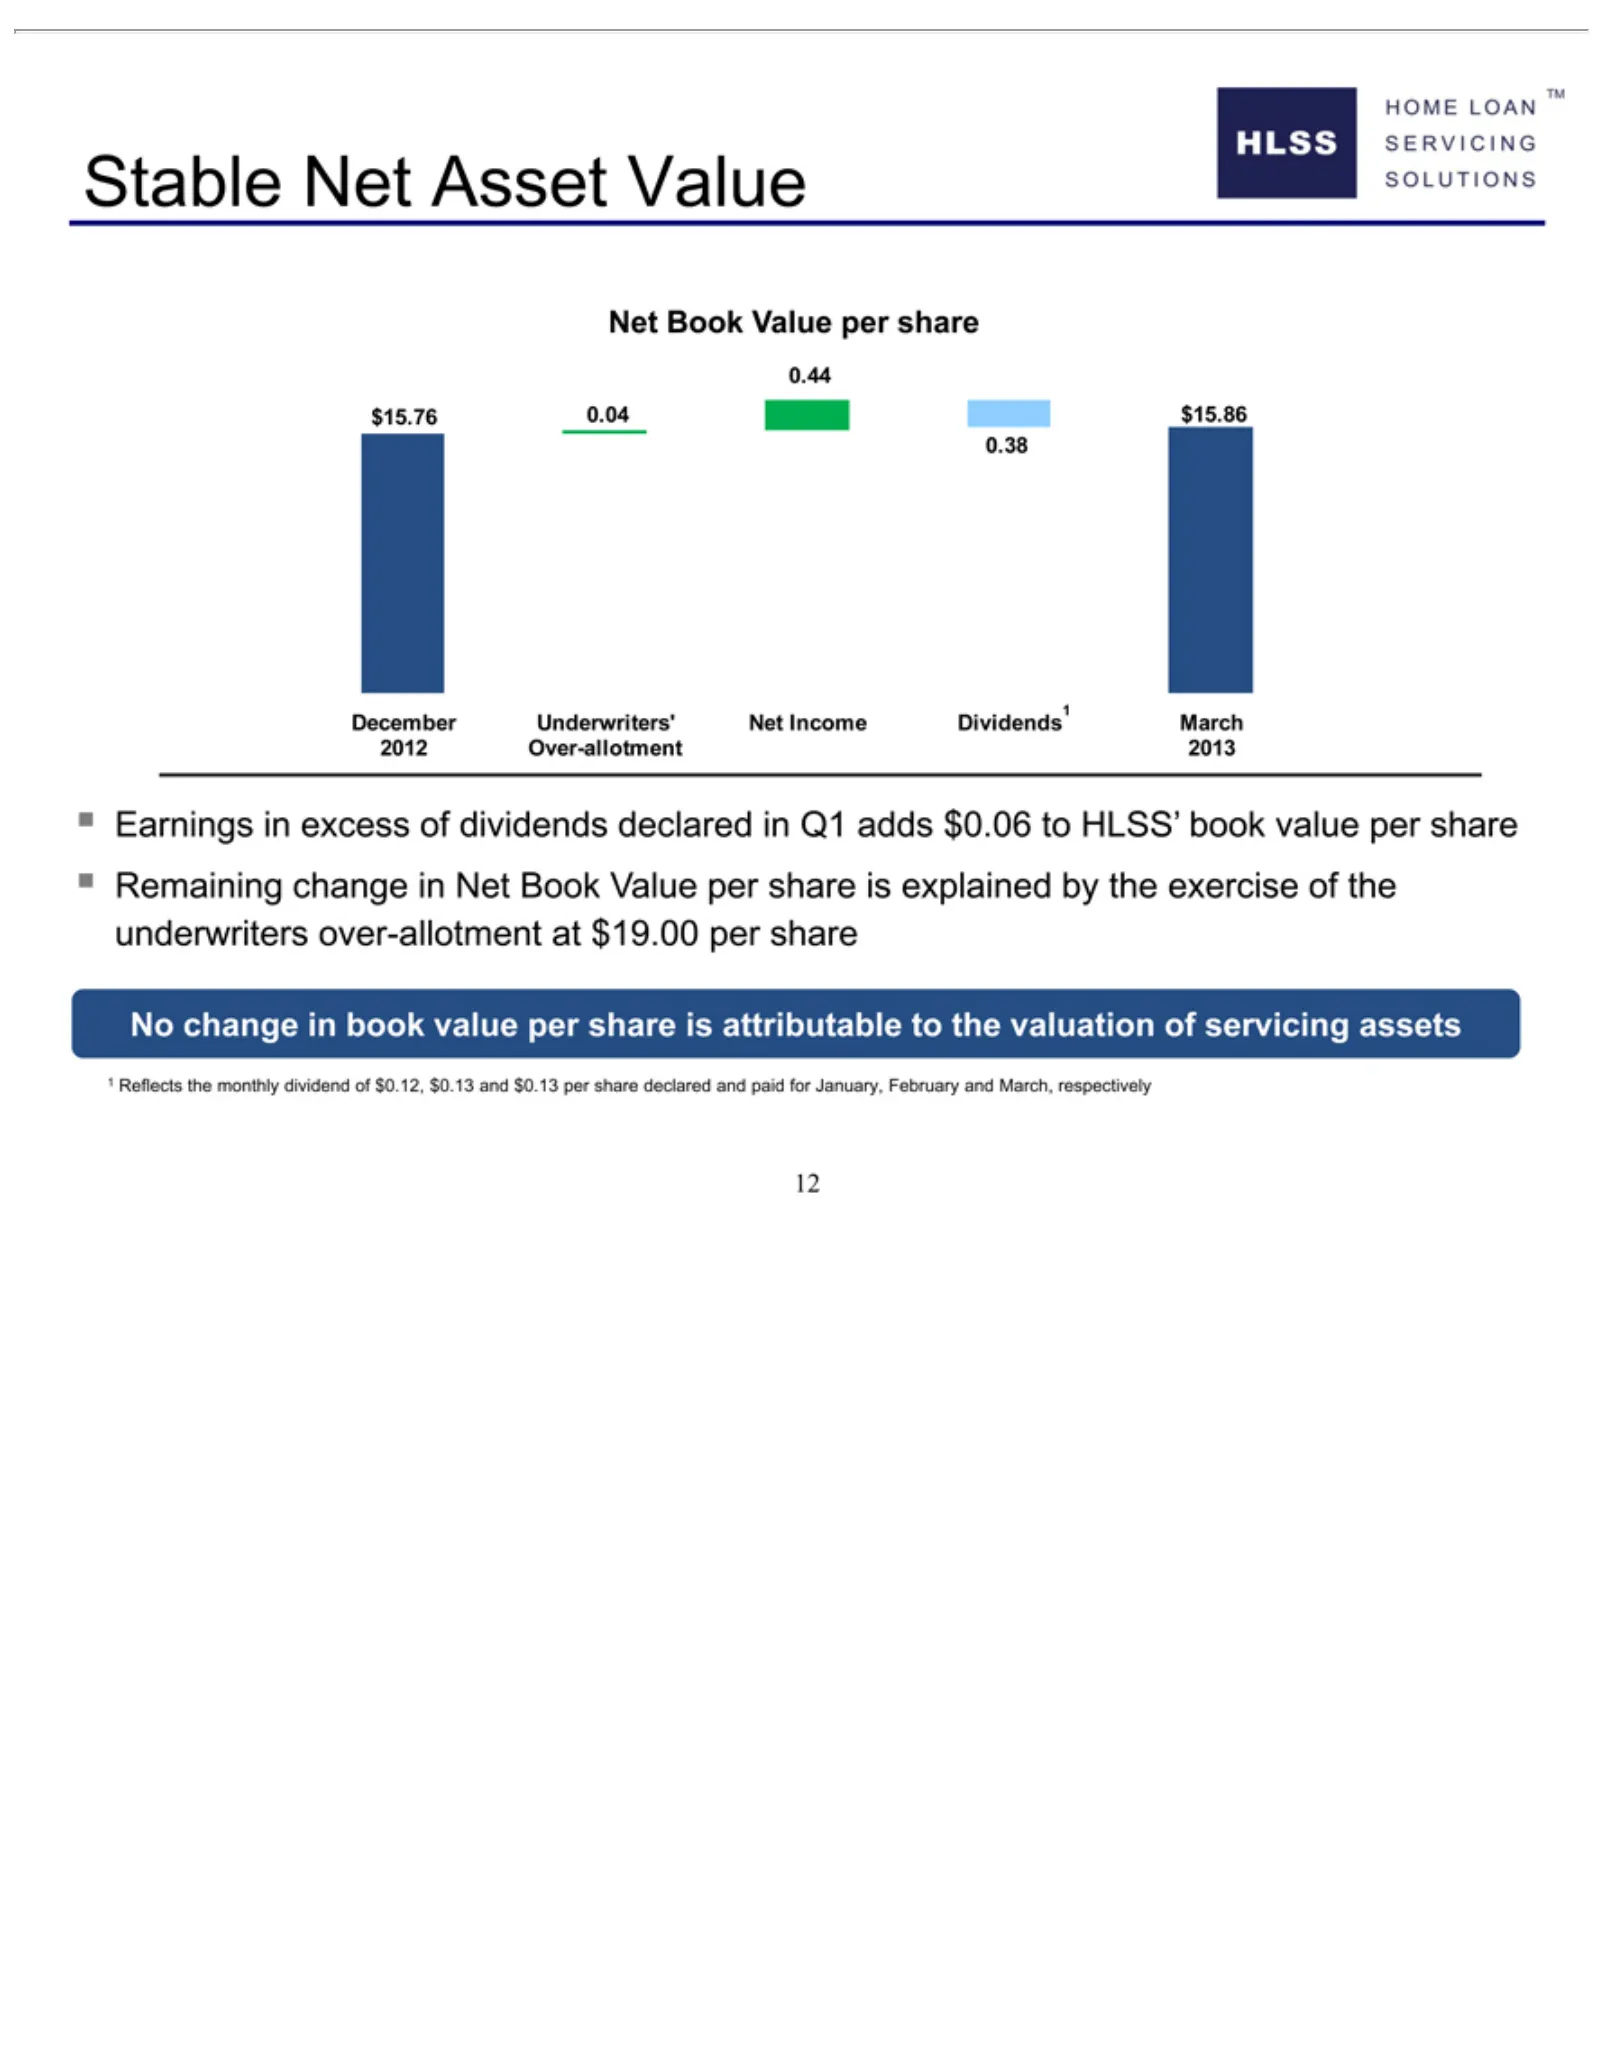
Slide 12: Stable Net Book Value
Stable Net $15.76 0.44 12 Book December Earnings No 1share Net 0.04 inValue Reflects change Asset the$15.86 per Value 0.38 share Underwriters’ inexcess book monthly of value dividends dividend Net per share Income declared of is $0.12, attributable Dividends in$0.13 Q1 adds and March to the $0.13 $0
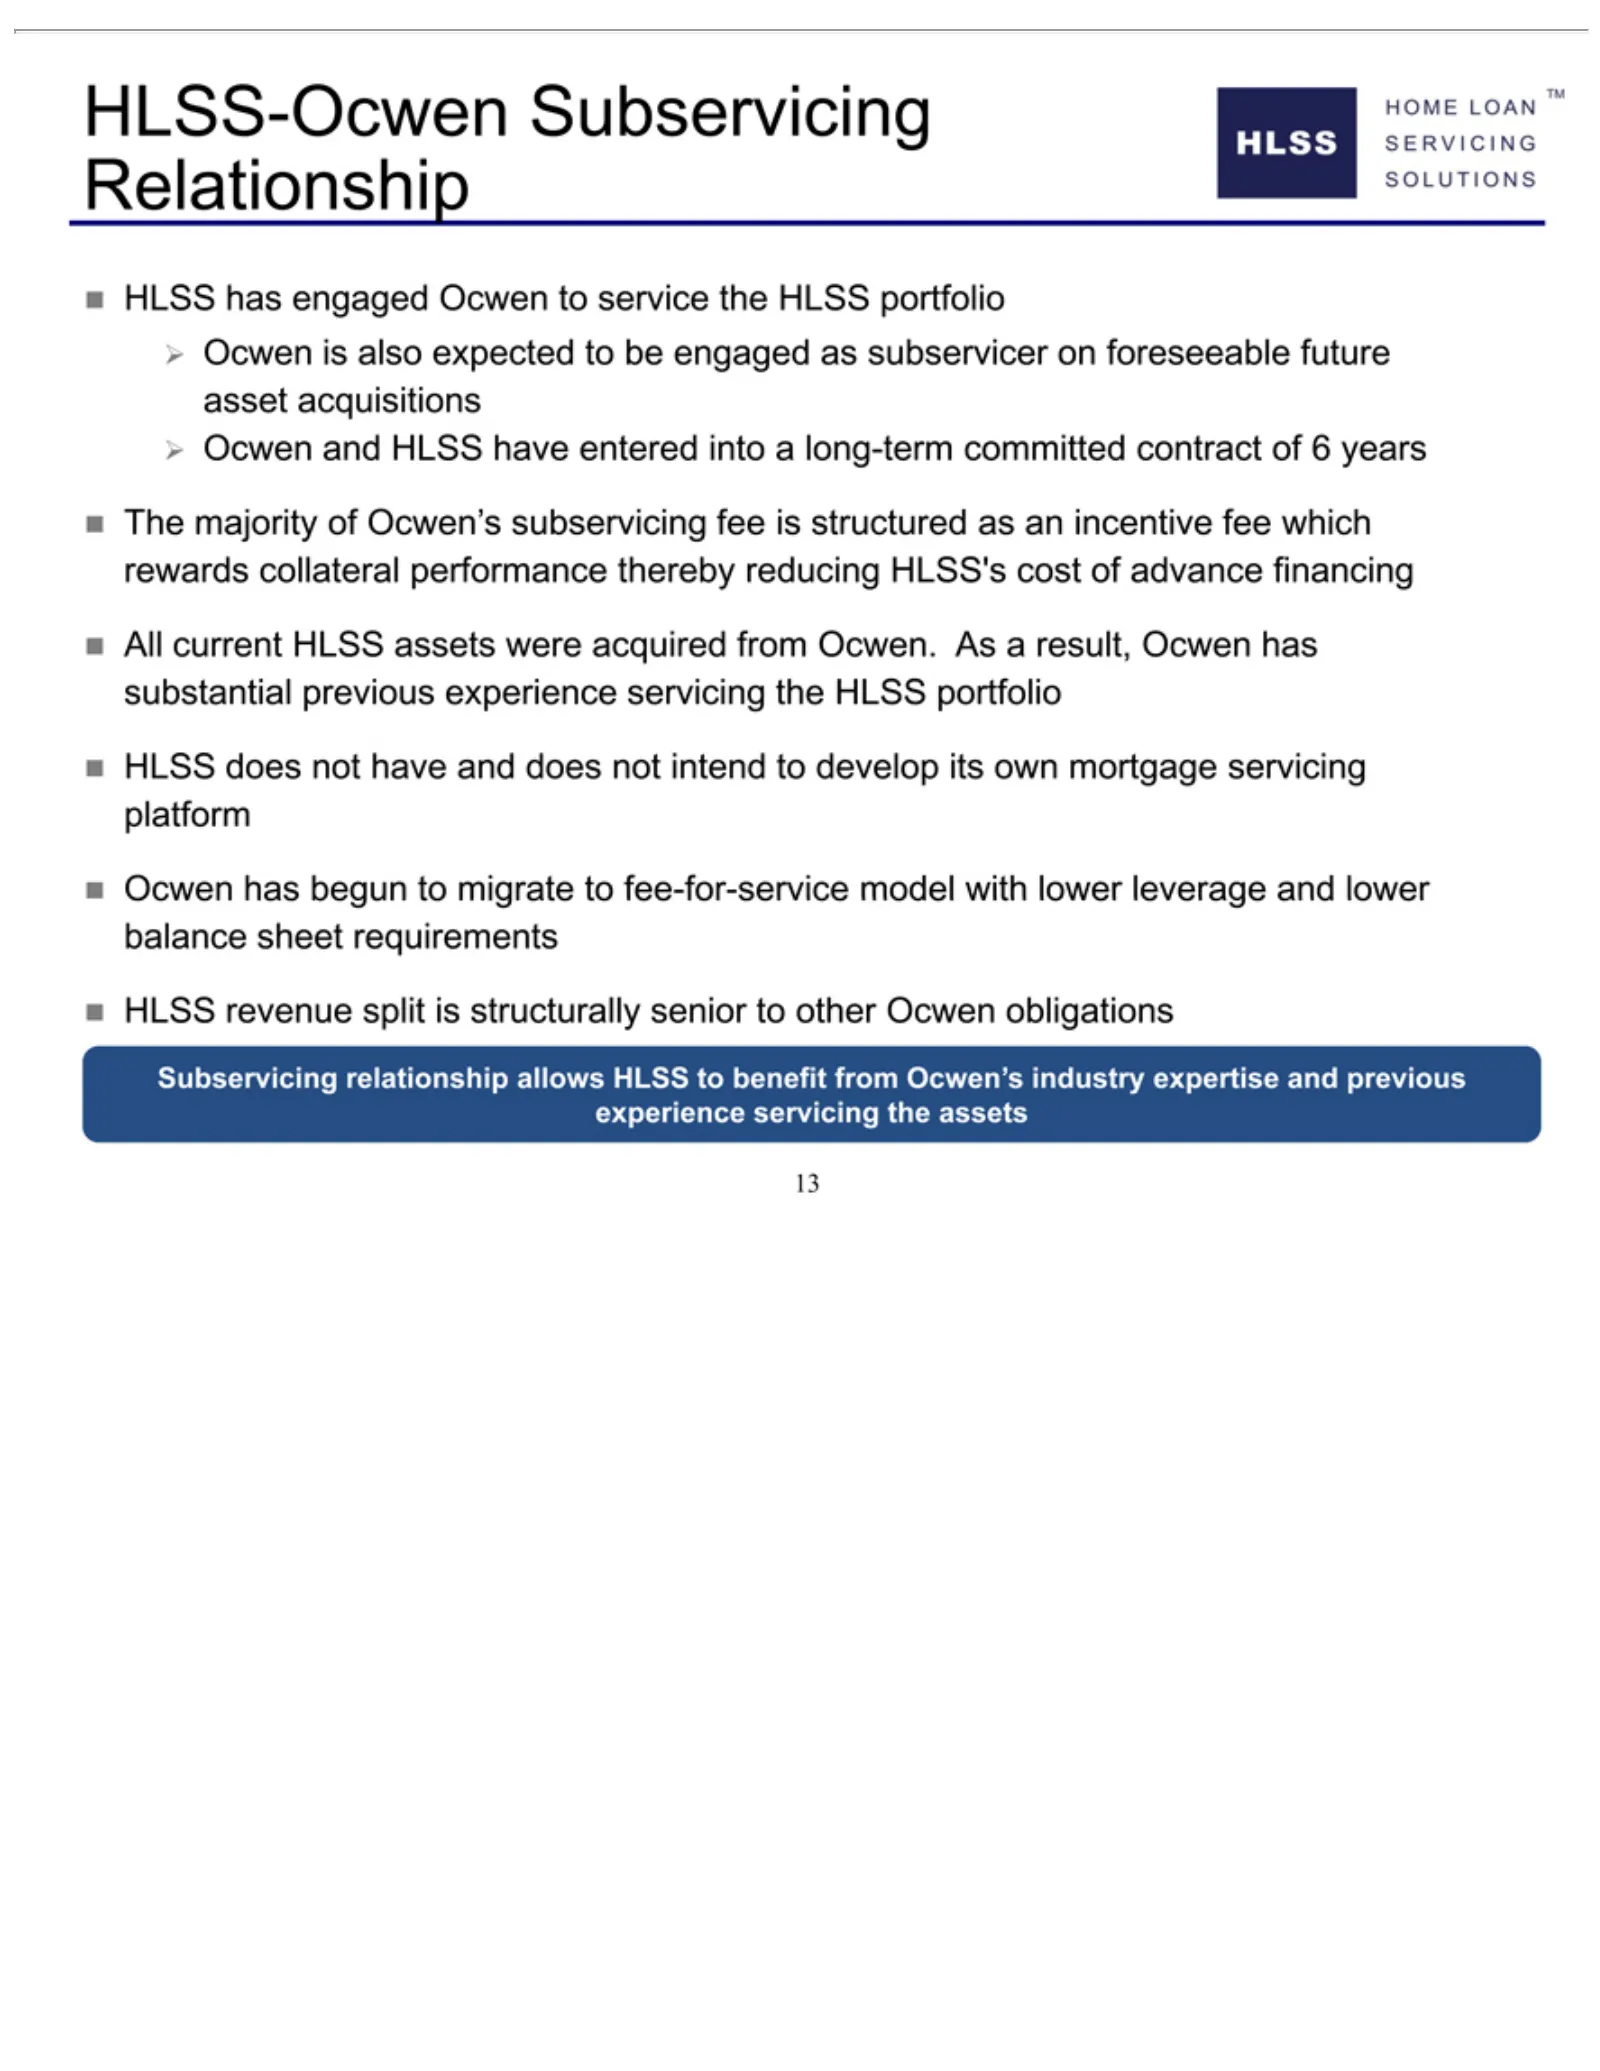
Slide 13: HLSS-Ocwen Relationship
HLSS-Ocwen ??Ocwen The All Ocwen HLSS Subservicing 13 current majority has does revenue hasisengaged HLSS begun not also of relationship Subservicing split have Ocwen’s expected assets toOcwen ismigrate and structurally were does subservicing allows totoRelationship be toservice acquired not fee-for
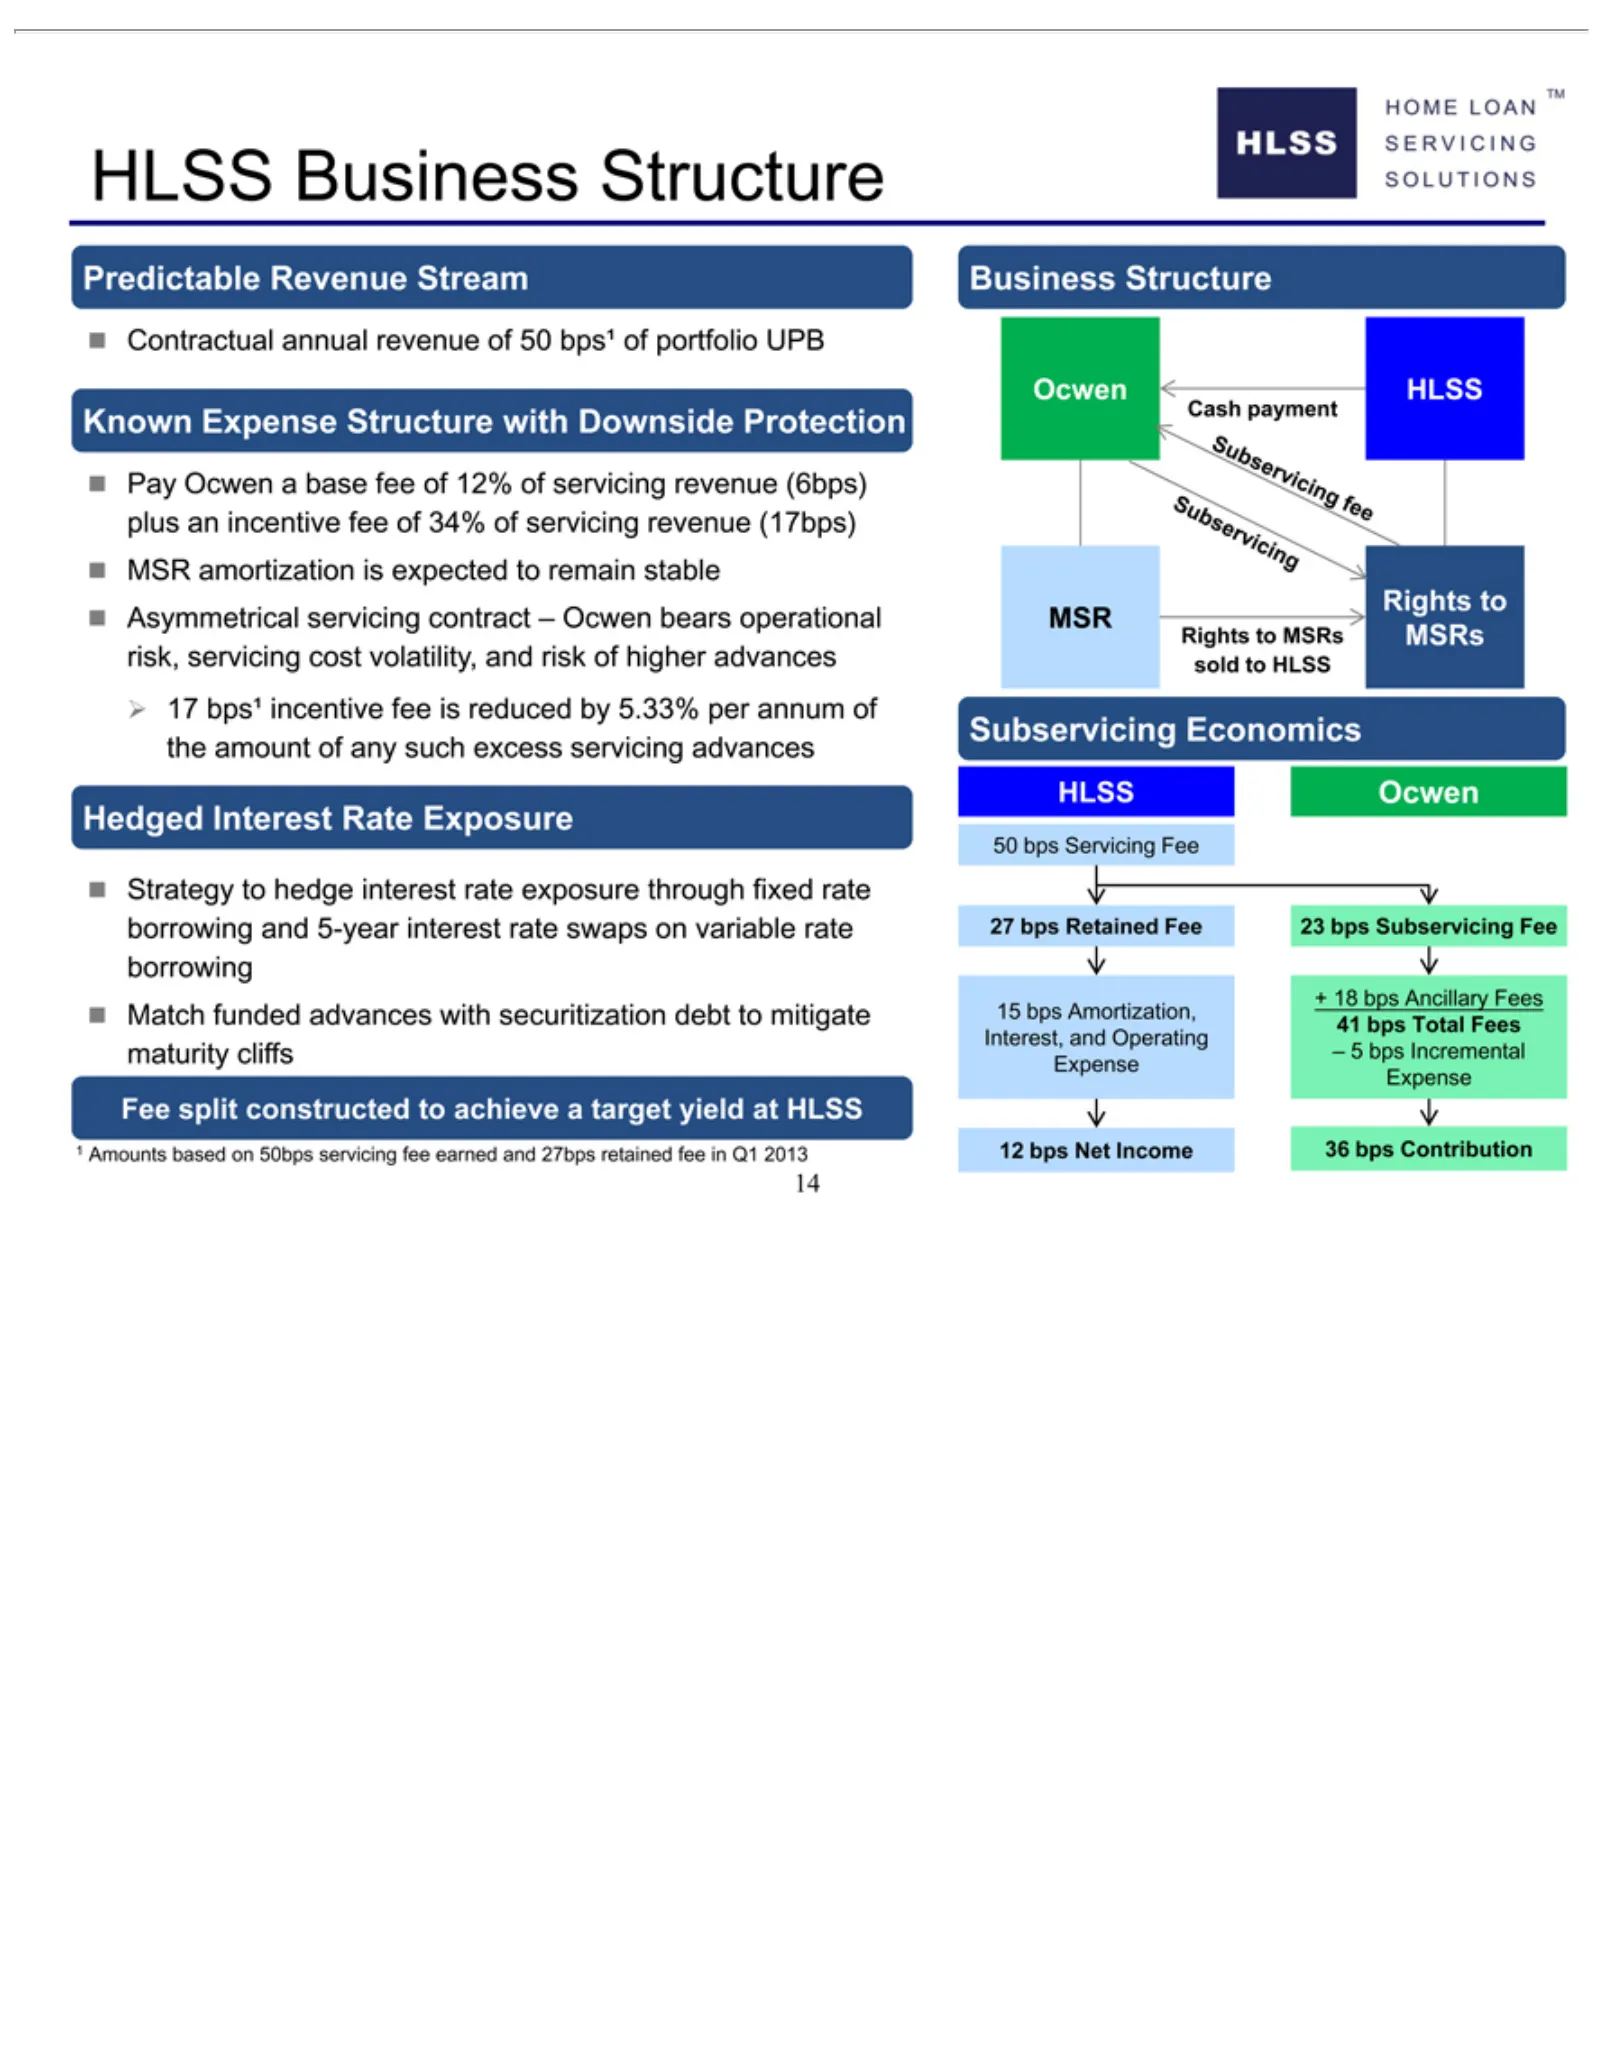
Slide 14: Predictable Contractual Earnings Structure
Predictable Contractual Known Pay operational Hedged Strategy 1Fee 14 split Ocwen Business Ocwen Cash Rights Business Expense Interest Subservicing HLSS 50 27 + 41 –Interest, 12518 bps bps bps Amounts to constructed payment Ocwen to Total hedge Revenue risk, aannual Servicing Retained Net HLSS base
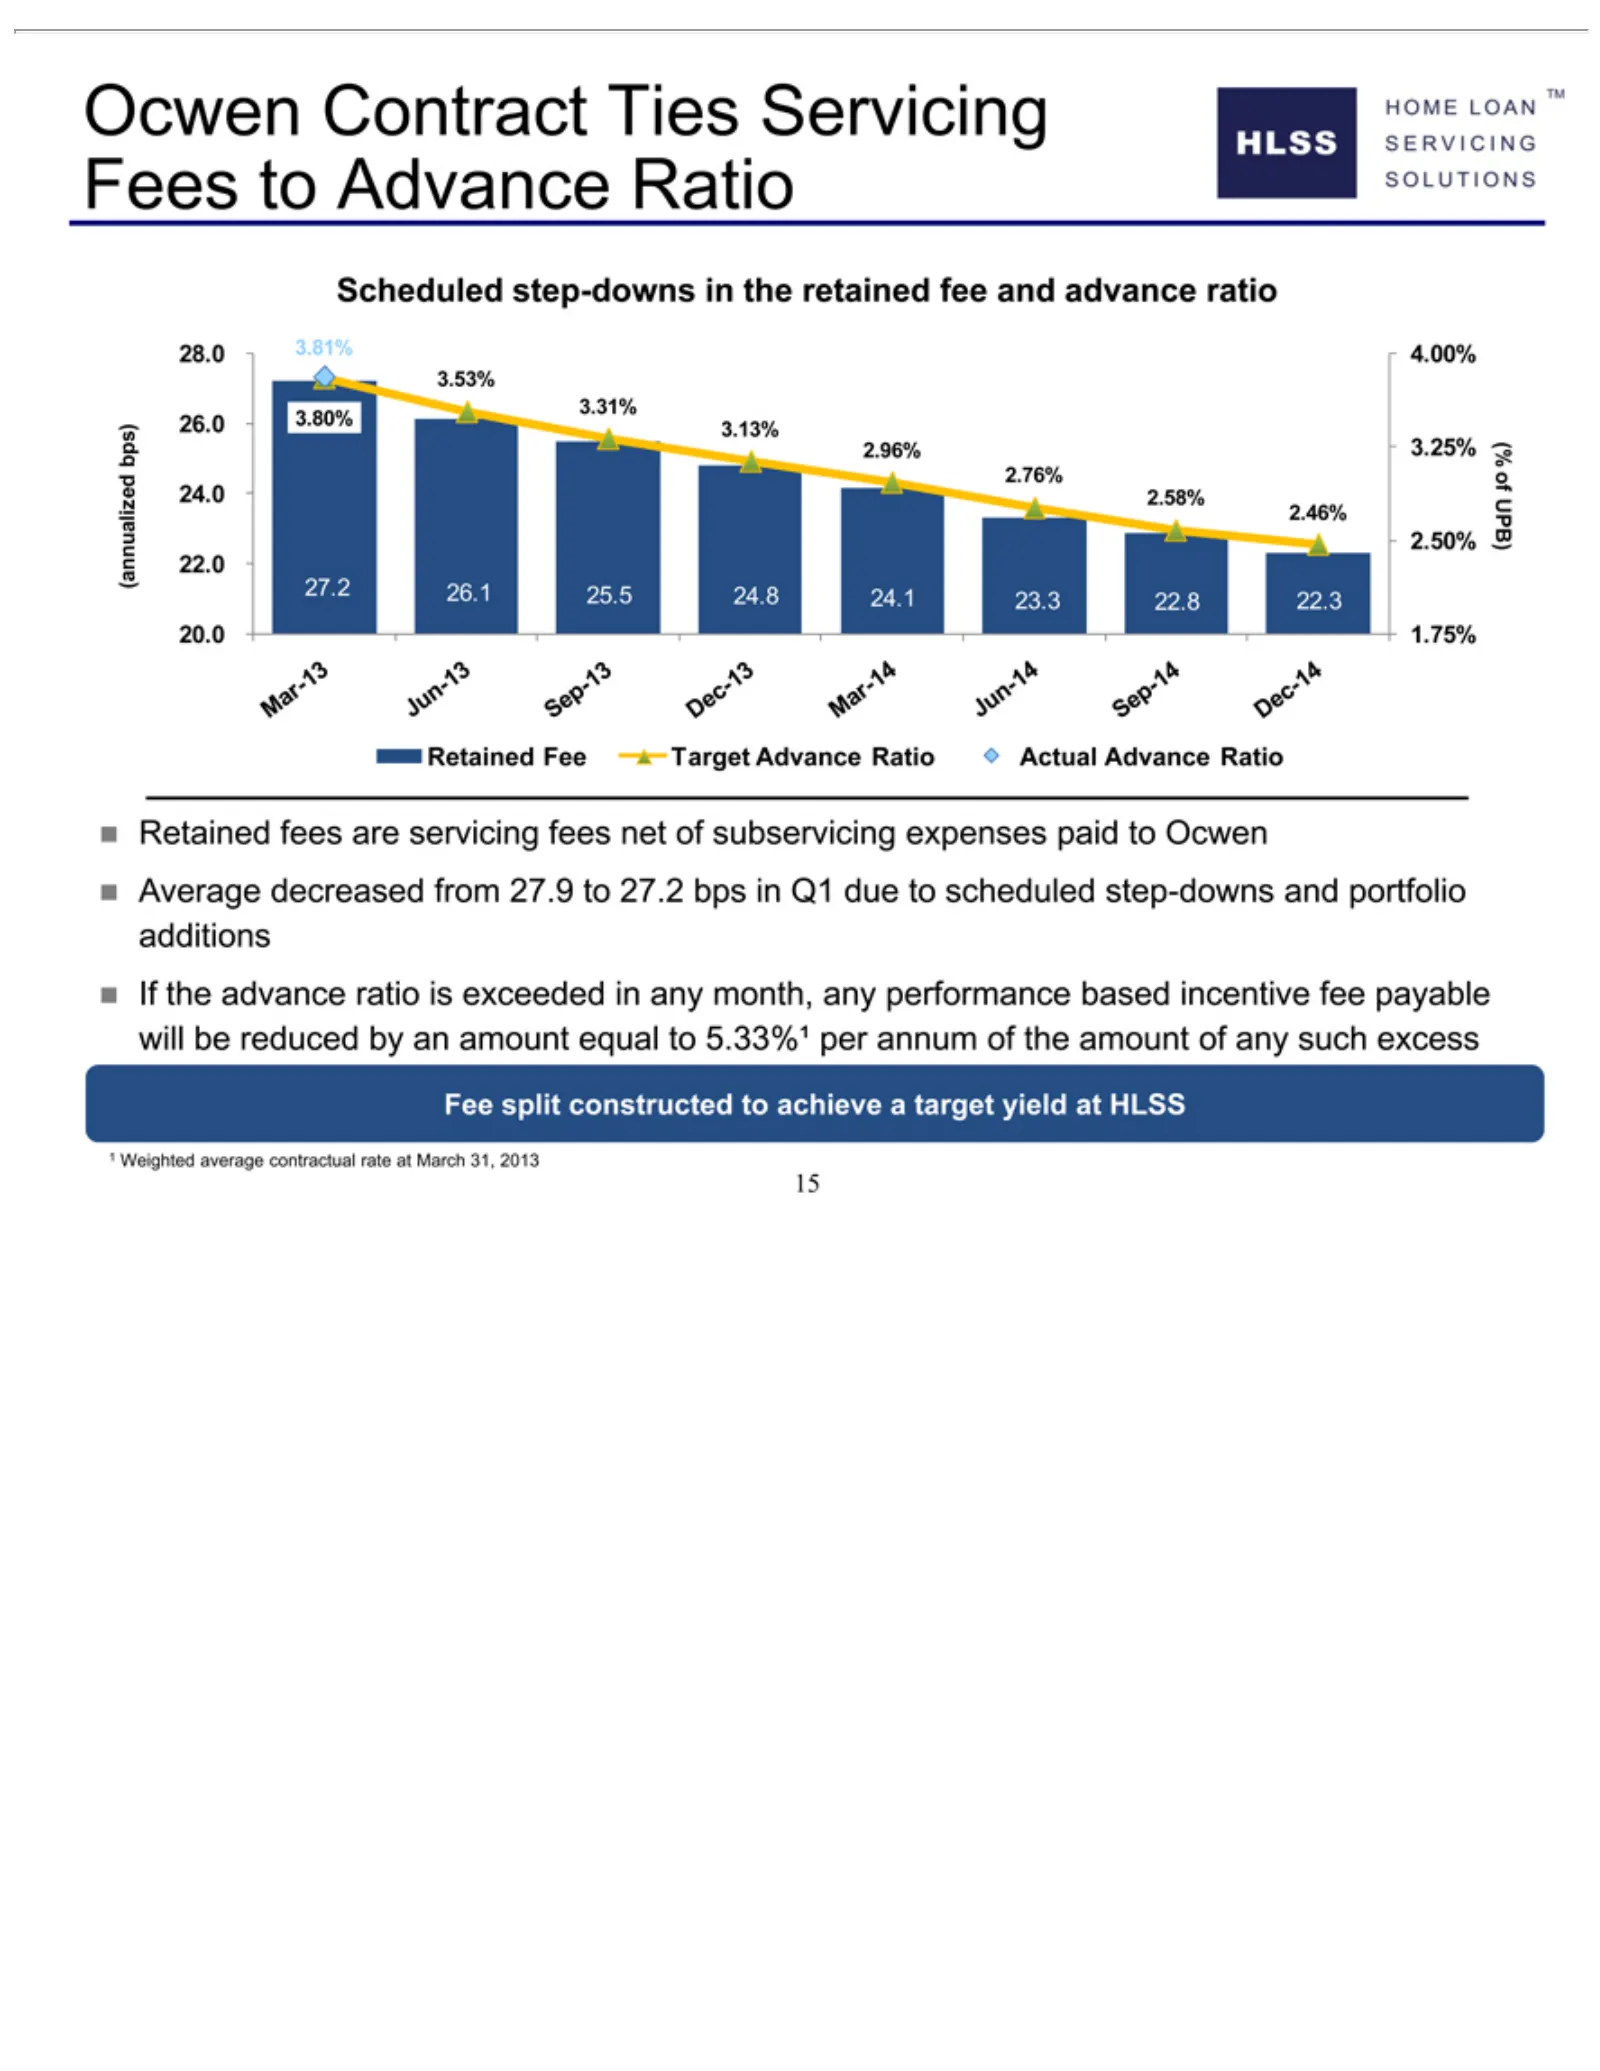
Slide 15: Ocwen Scheduled Fee Step-Downs
Ocwen Scheduled 28.0 26.0 3.31% 3.53% 24.0 2.76% (annualized 2.46% 27.2 22.0 20.0 Retained Average amount 1Fee 15 split 3.81% 3.80% 2.58% 26.1 1.75% Contract equal Weighted decreased constructed Fee fees 25.5 step-downs 4.00% 3.13% of bps) Target are to24.8 5.33%¹ Ties 2.50% servicing average 2.96%
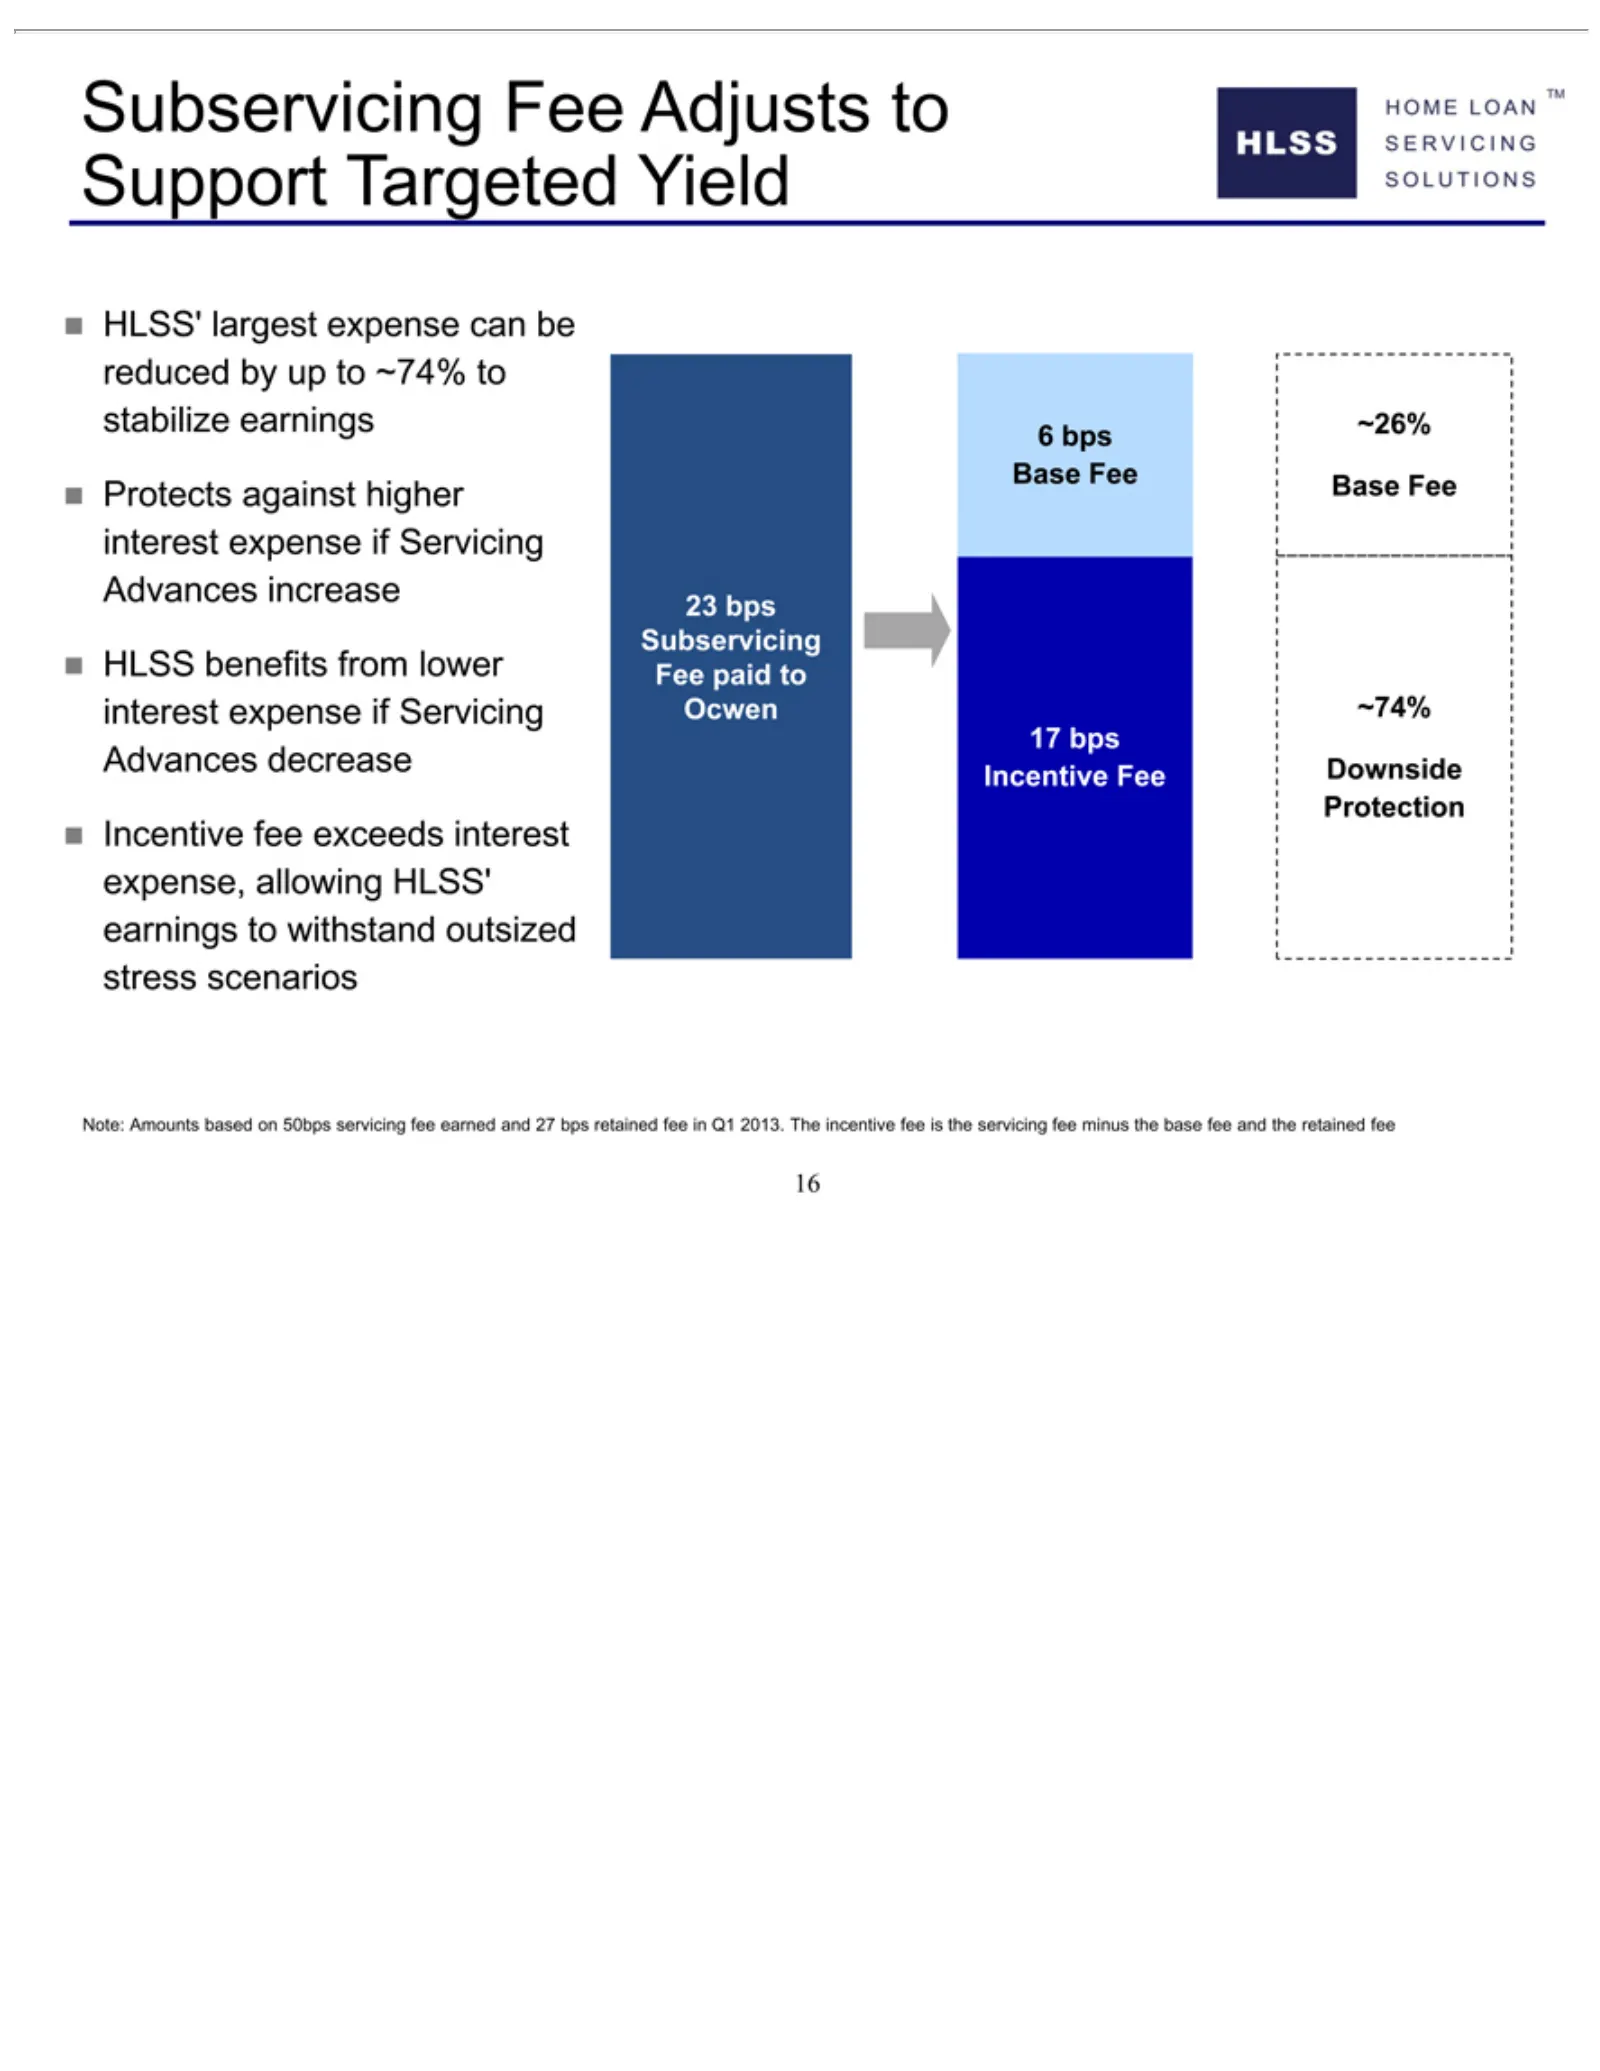
Slide 16: HLSS Subservicing Fee Protects Downside
Subservicing HLSS’ Protects HLSS Incentive 623 16 17 Base ~26% benefits Subservicing Downside ~74% Note: largest bpsFee against bps fee Amounts Base exceeds Fee Incentiveexpense from higher Adjusts Feelower Protection based Fee Fee interest can interest on paid tointerest beSupport 50bps to expense,
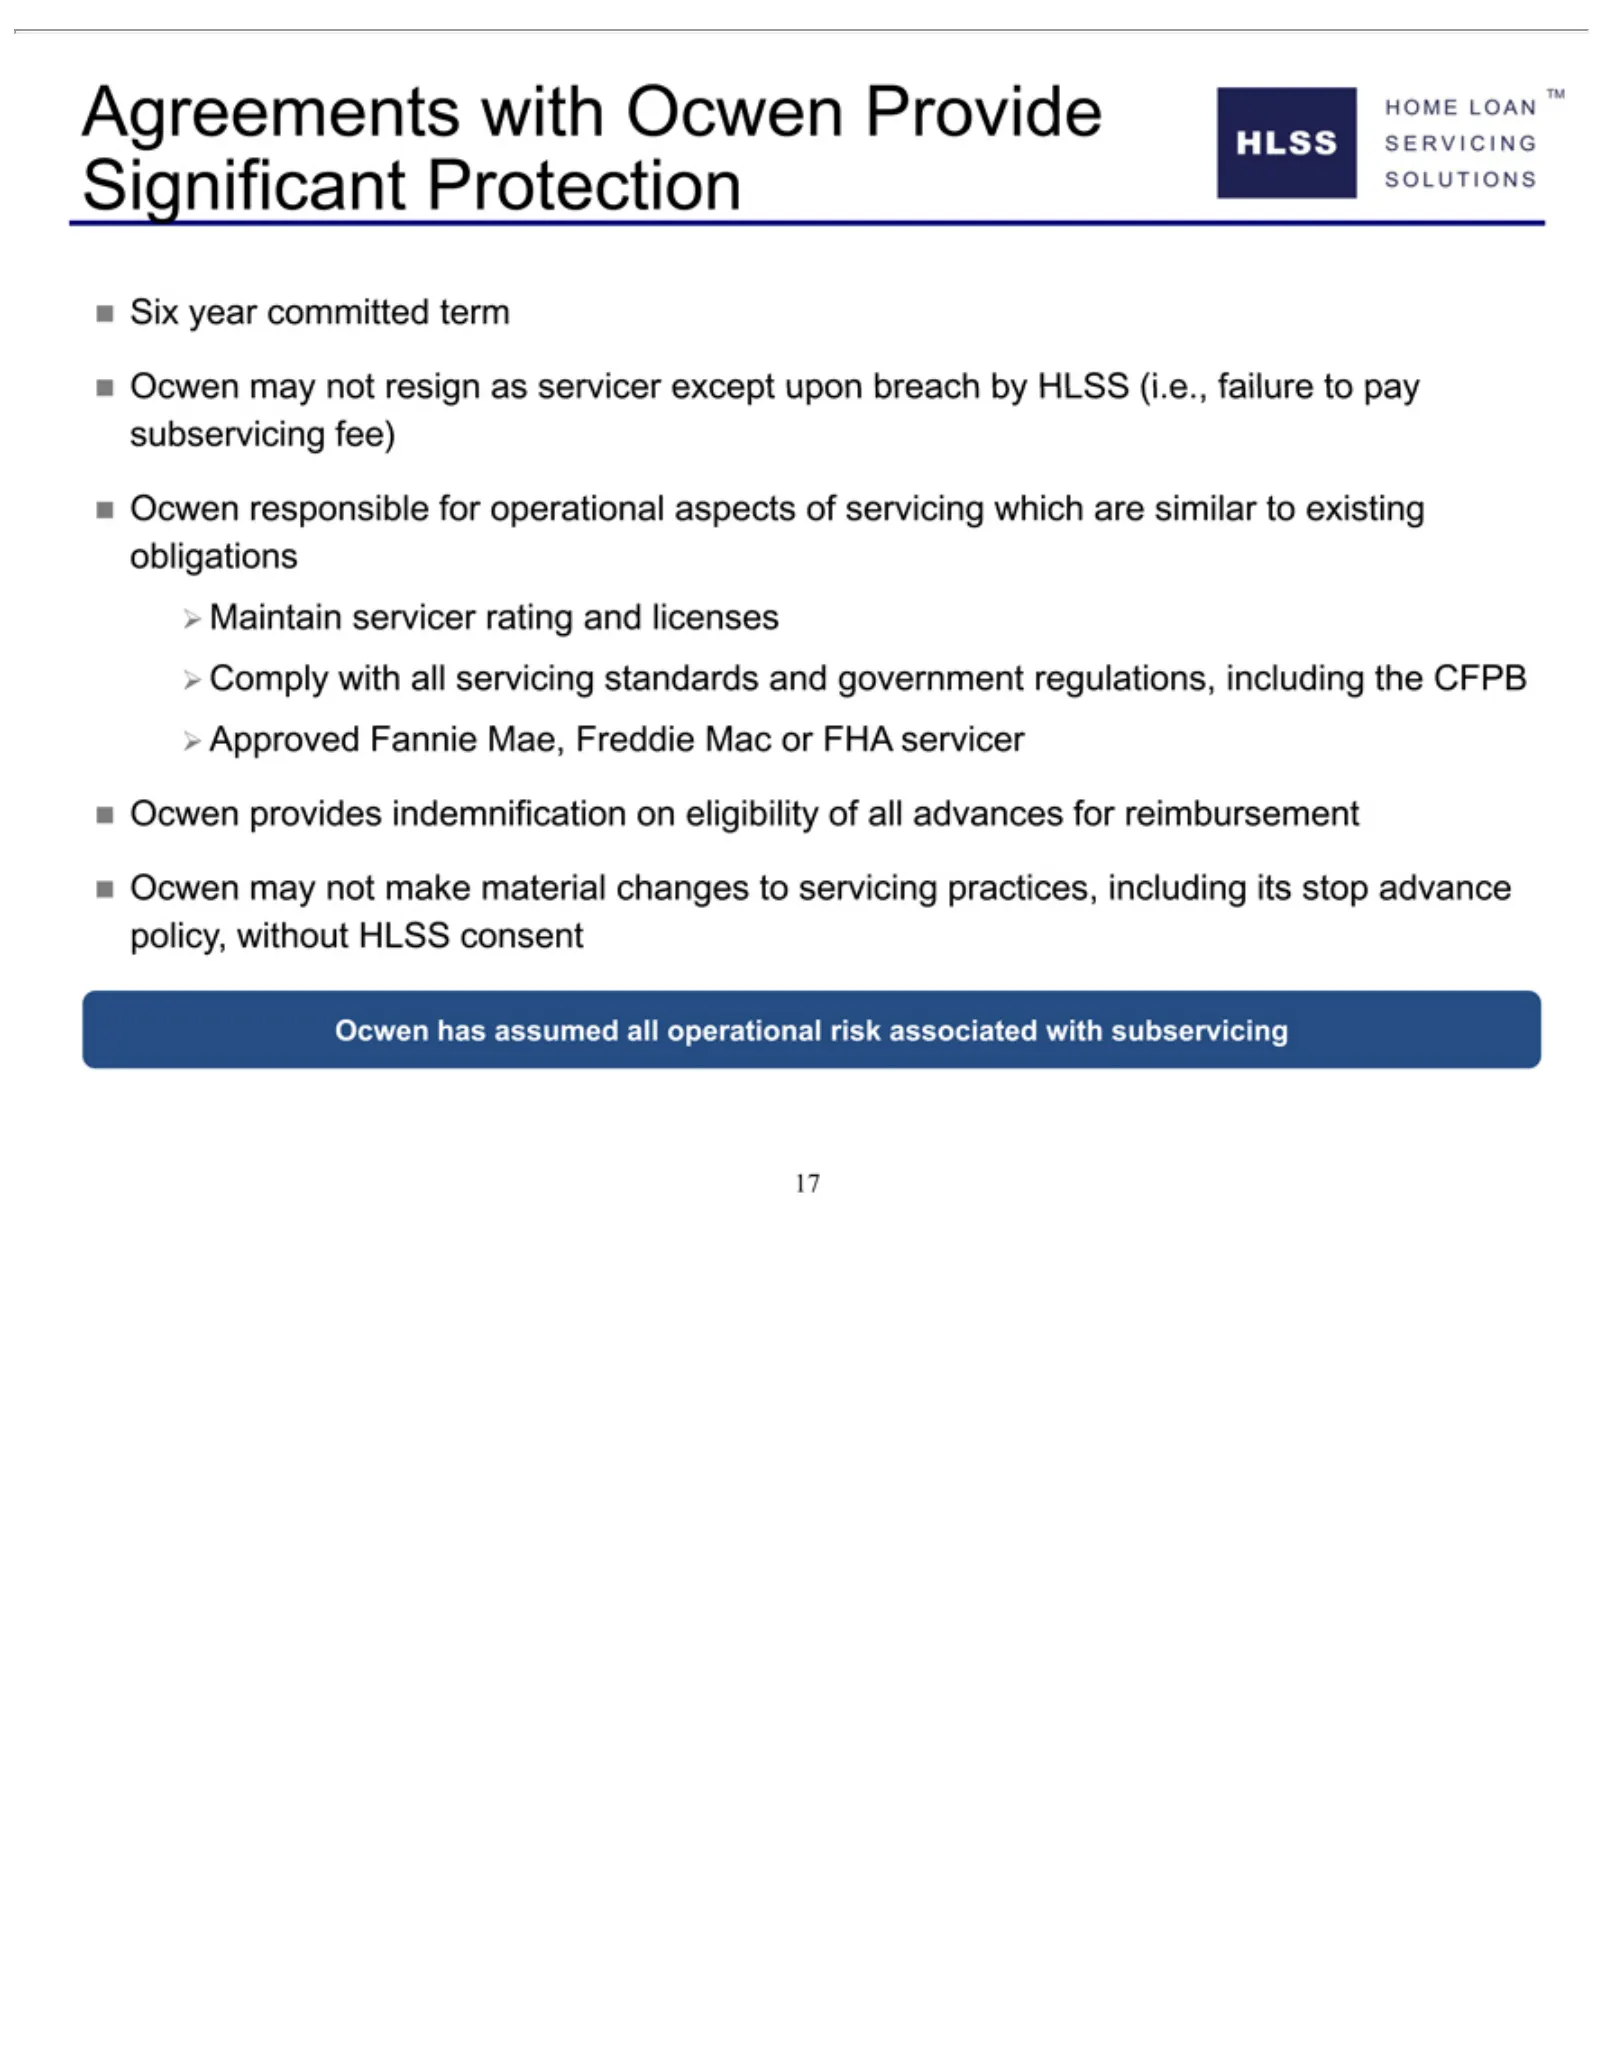
Slide 17: Six Key Agreements with Ocwen
Agreements Six ?Approved CFPB Ocwen 17 yearhas responsible provides may committed assumed Fannie not withmake resign indemnification Ocwen Mae, for term allmaterial as operational operational Freddie Provide servicer changes Mac on Significant except aspects risk eligibility orto associated FHA upon
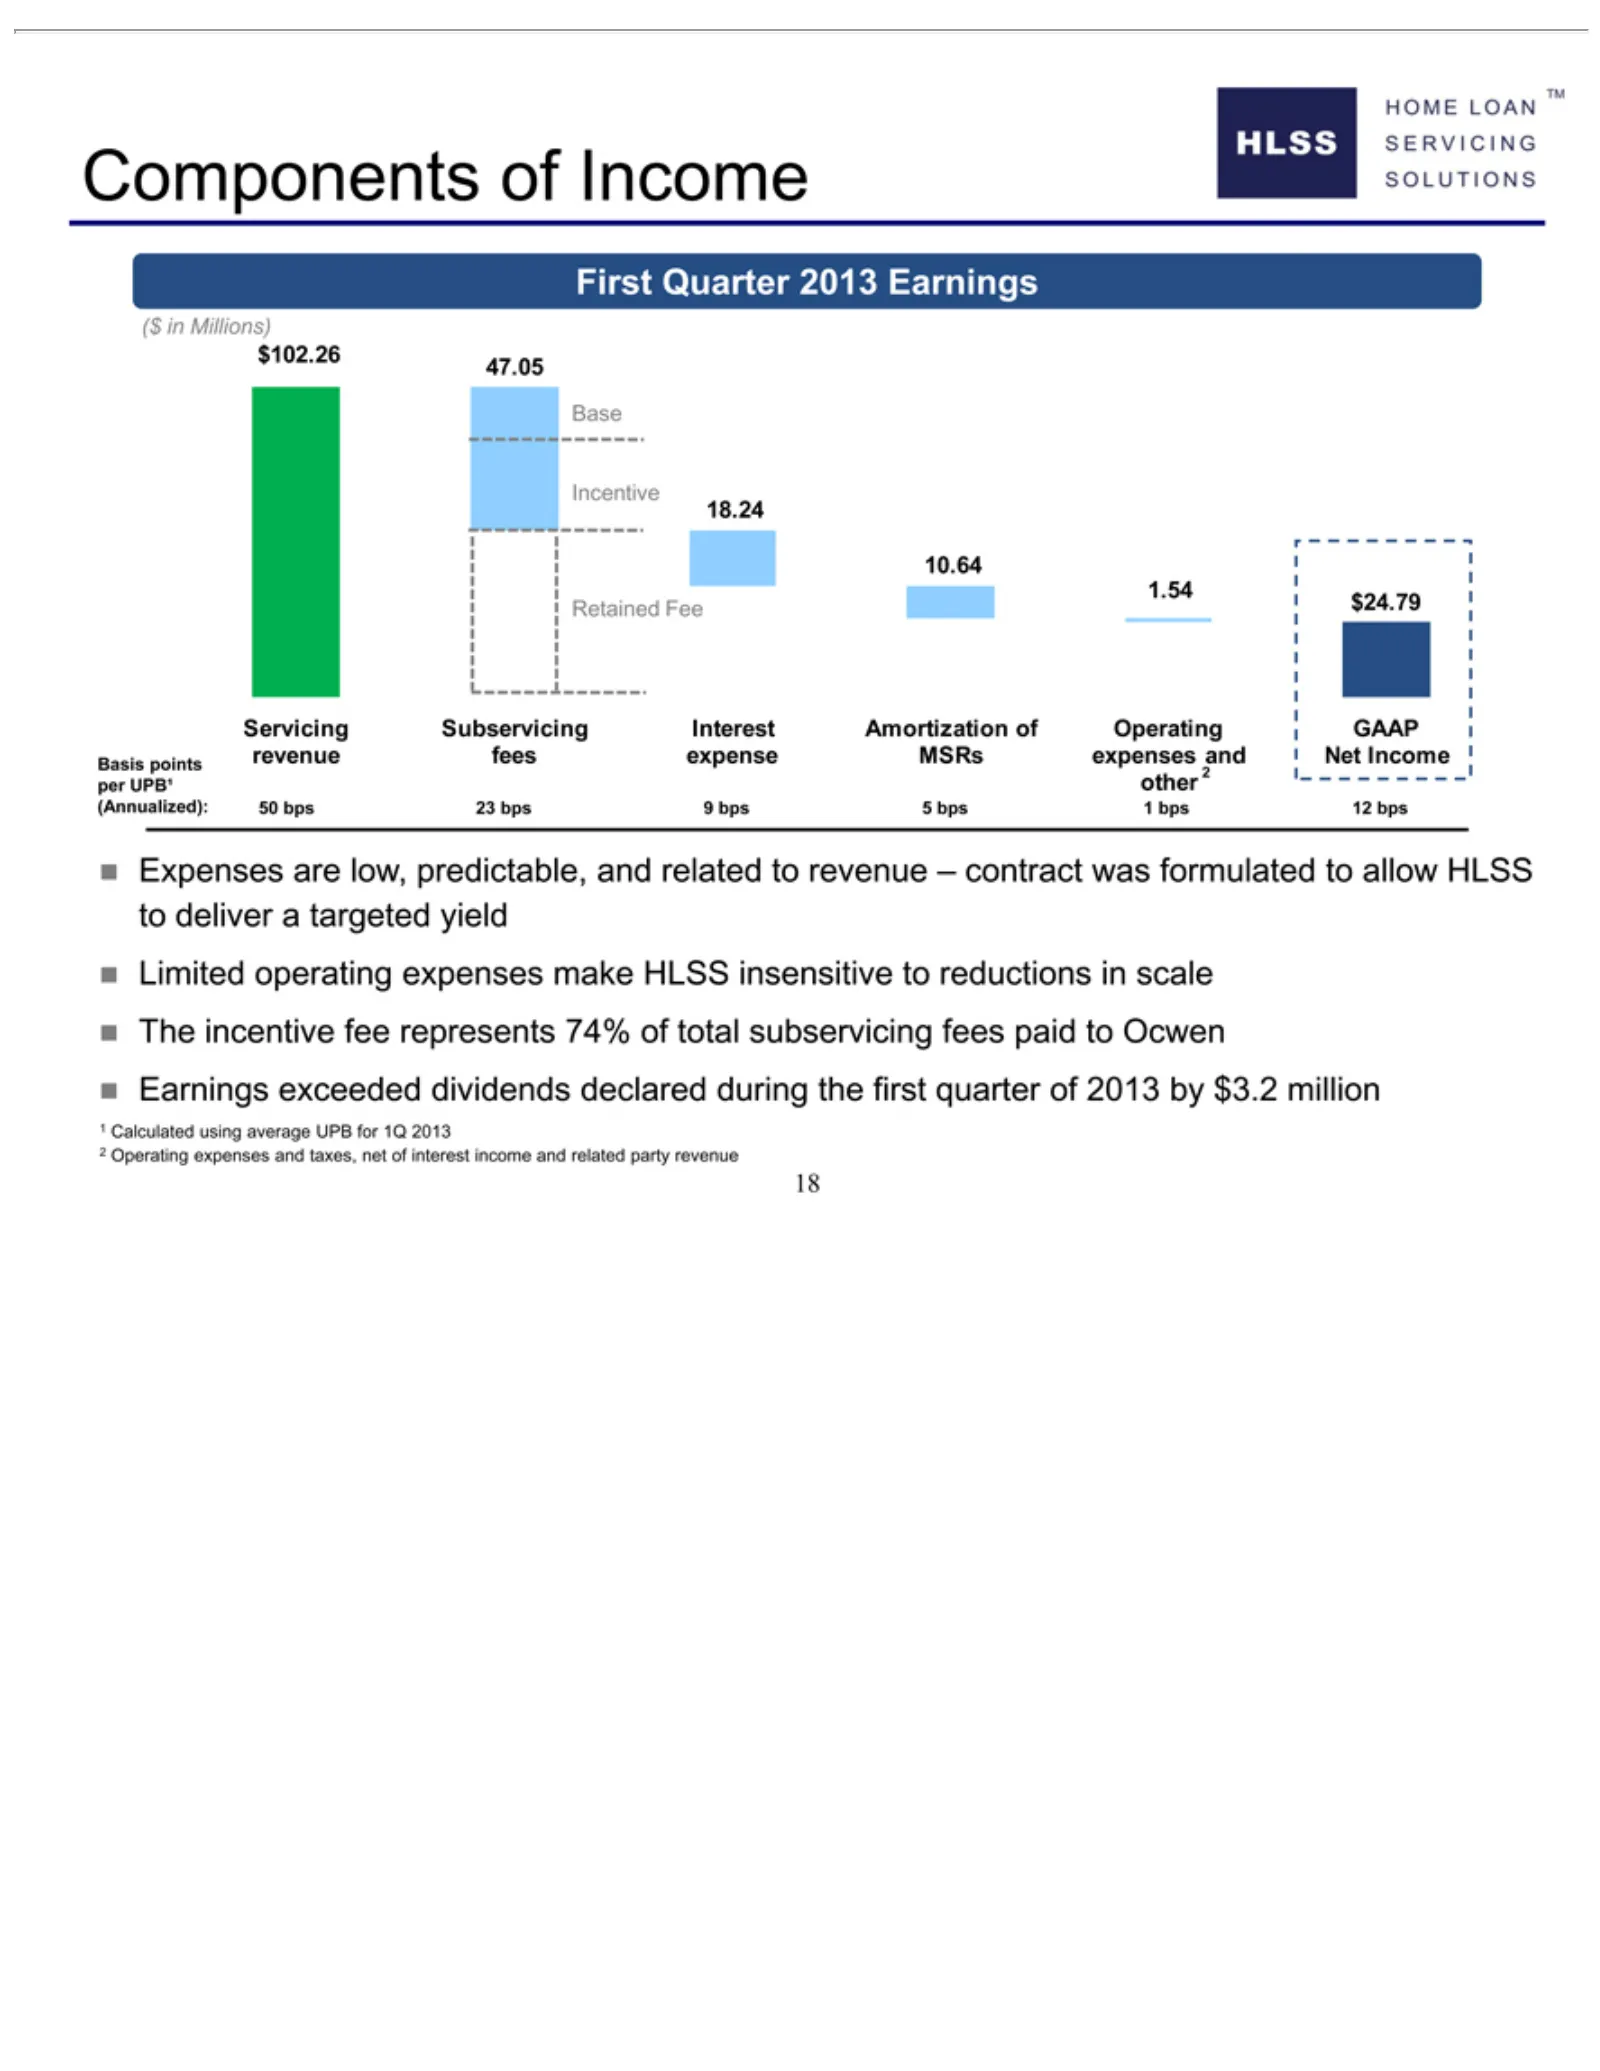
Slide 18: Components of First Quarter 2013 Earnings
Components First ($ $102.26 Retained 1.54 10.64 18.24 Incentive Base Servicing Basis per (Annualized): Expenses 21represents 18 inUPB¹ Quarter Millions) points Calculated 47.05 Fee other are Subservicing 74% revenue of 2013 low, $24.79 50(2) Operatingof Income bps predictable, total Earnings using f

Slide 19: Industry Overview
HOME LOAN ™ SERVICING SOLUTIONS Industry Overview
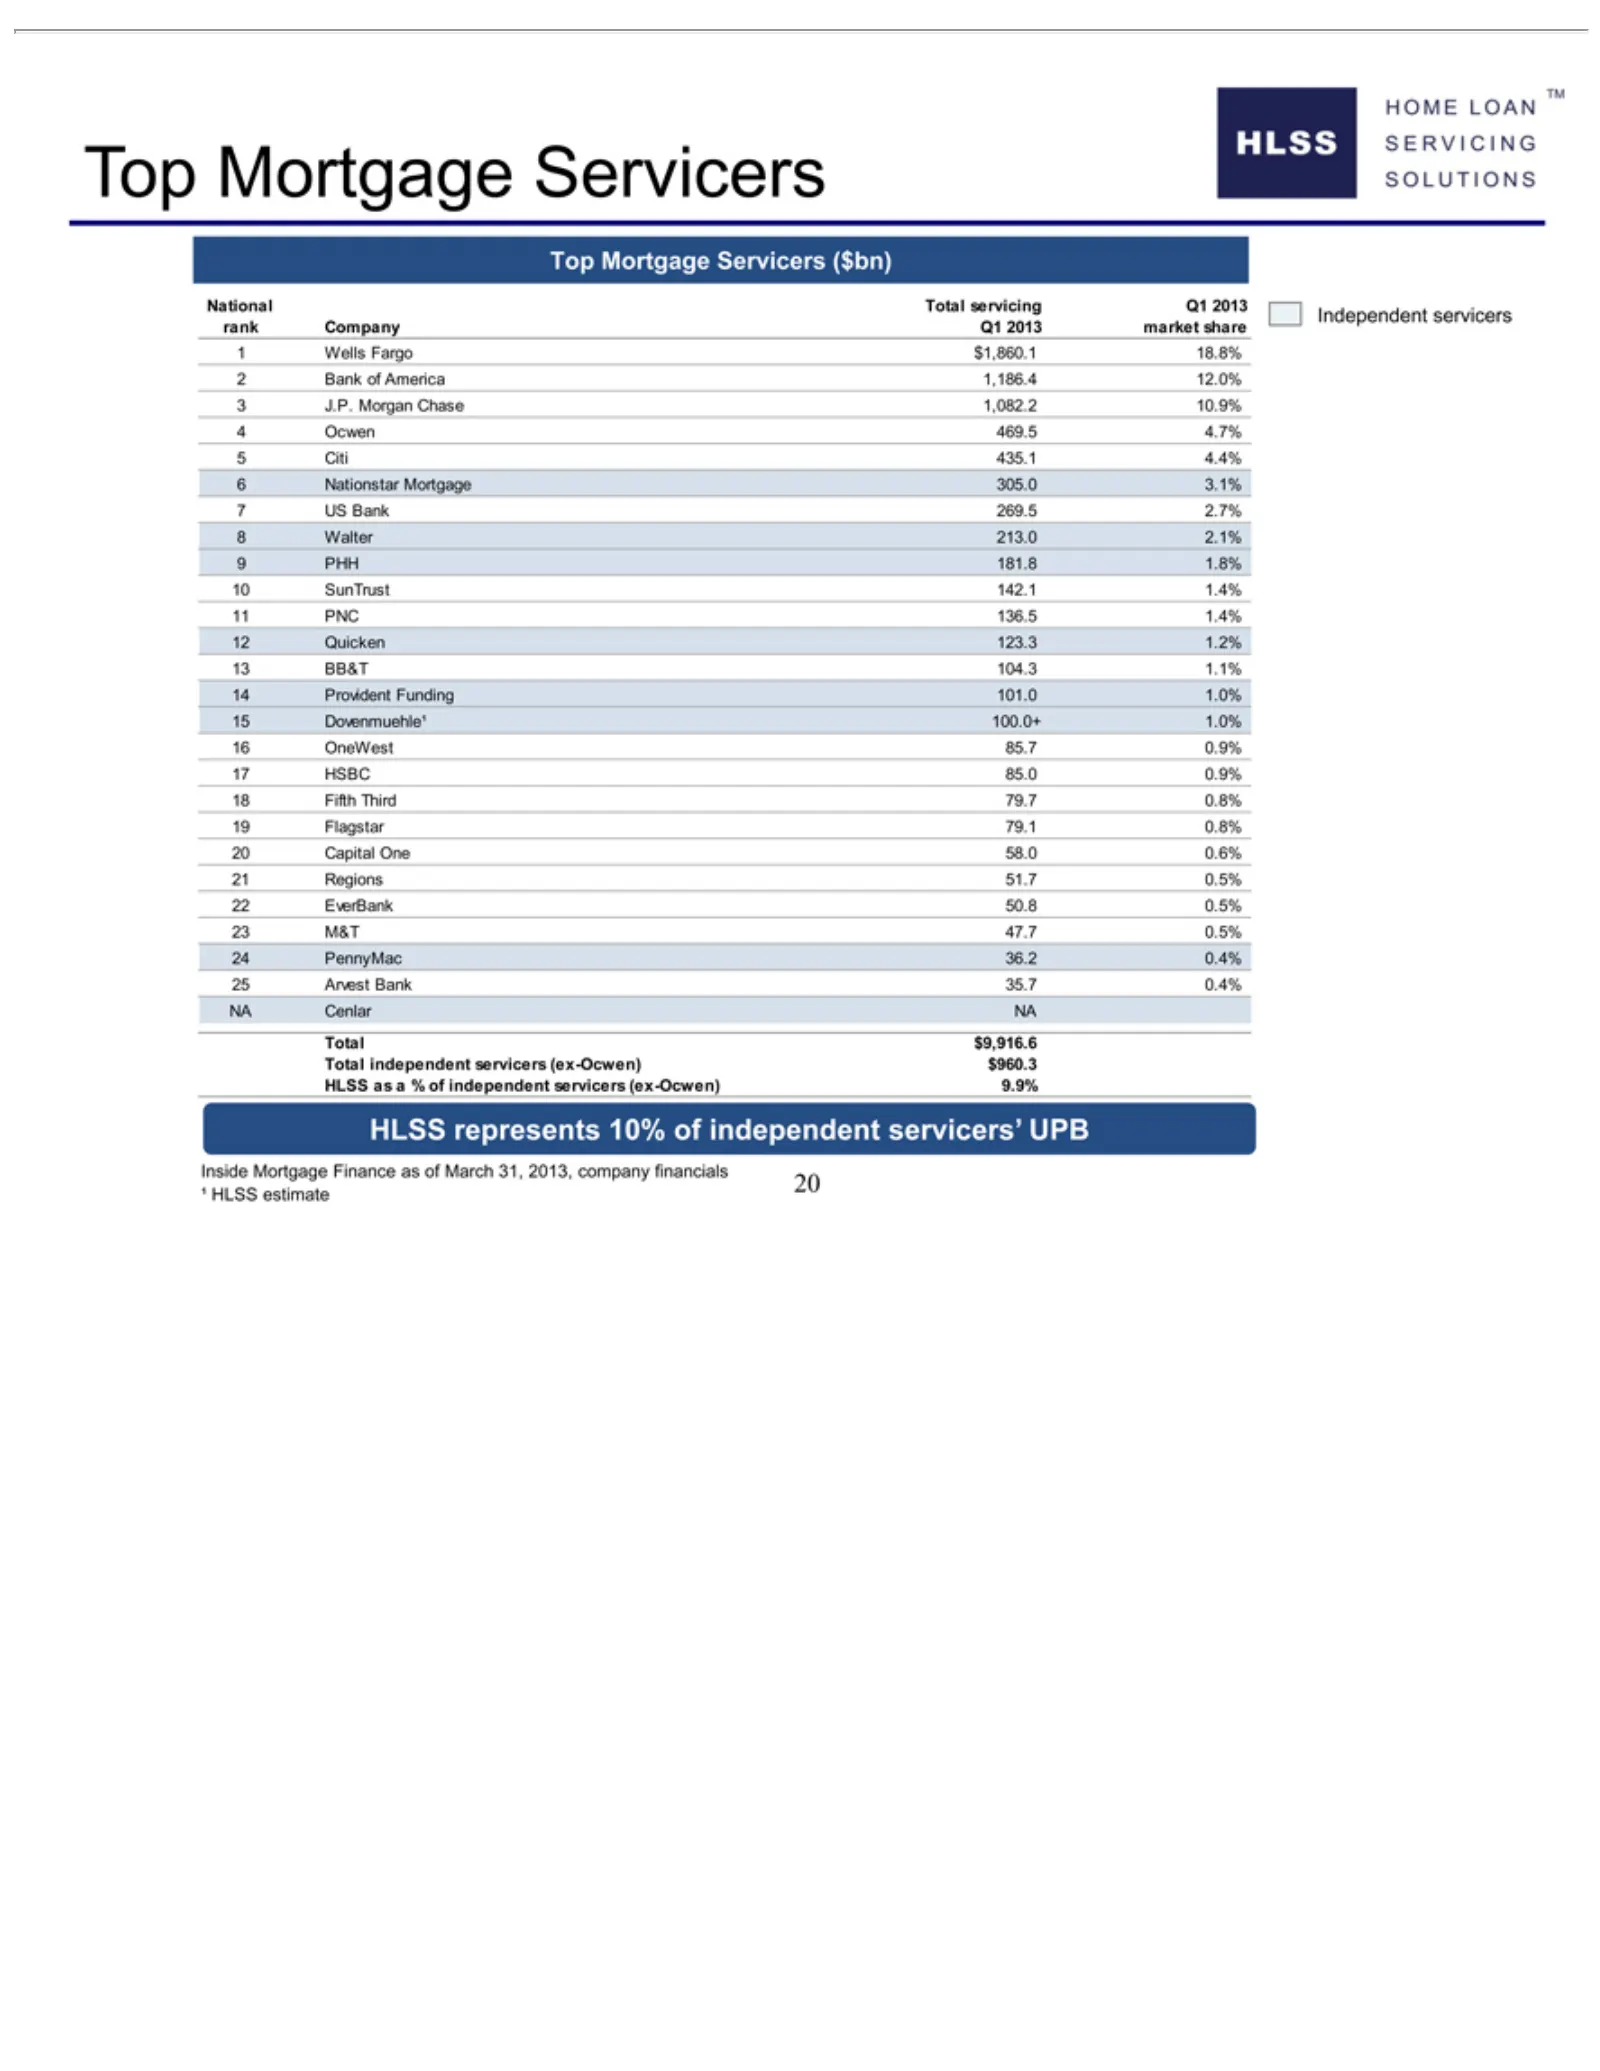
Slide 20: Top National Mortgage Servicers
Top National rank 321Wells Mortgage Company Fargo Bank Total J.P. $1,860.1 of Servicers servicing Q1 Morgan America 2013 18.8% Q1 market ($bn) Chase 1,186.4 2013 share 1,082.212.0% 10.9% 987654 HLSS 10 11 12 13 14 15 16 17 18 19 20 21 22 23 24 25 NA Total Independent HLSS ¹Inside PHH Arvest PNC as O
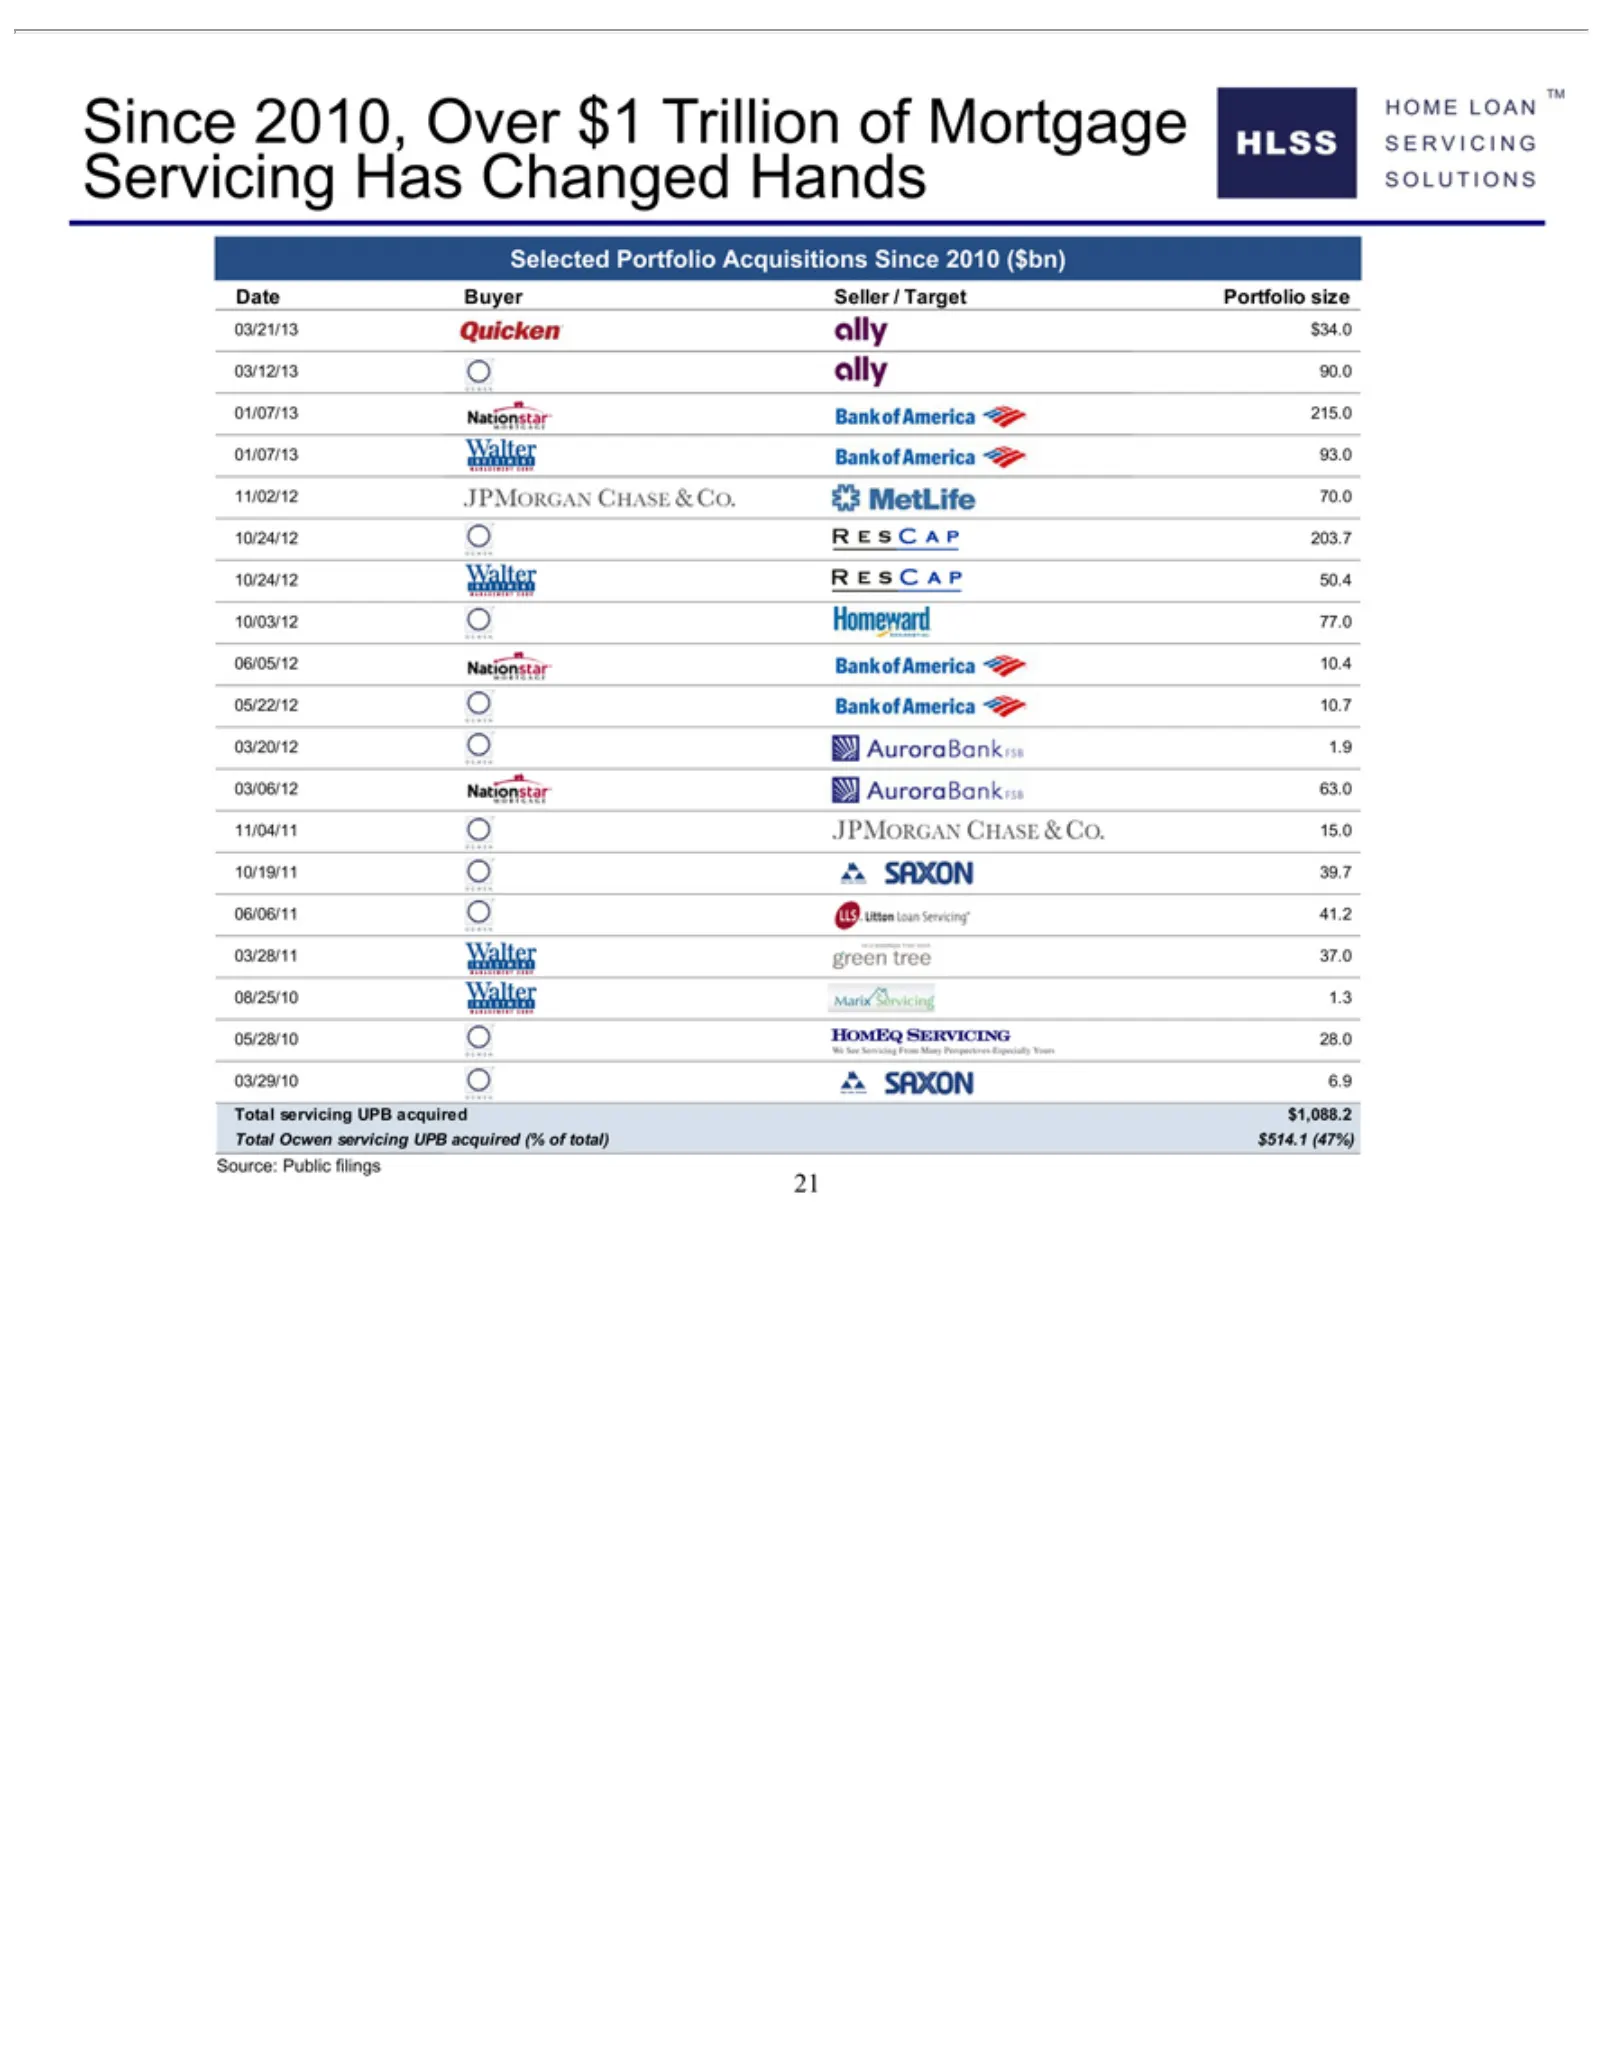
Slide 21: Servicing Portfolio Acquisitions Since 2010
SinceBuyer Servicing Selected Date 03/21/13 03/12/13 01/07/13 11/02/12 10/24/12 10/03/12 06/05/12 05/22/12 03/20/12 03/06/12 11/04/11 10/19/11 06/06/11 03/28/11 08/25/10 05/28/10 03/29/10 Total Source: 21 servicing Ocwen 2010, Public Portfolio 15.0 70.0 39.7 41.2 37.0 $34.0 90.0 215.0 93.0 203.7 50.
Slide 22: Capital Markets Access, Funding & Liquidity
Capital Markets Access Funding & Liquidity 22
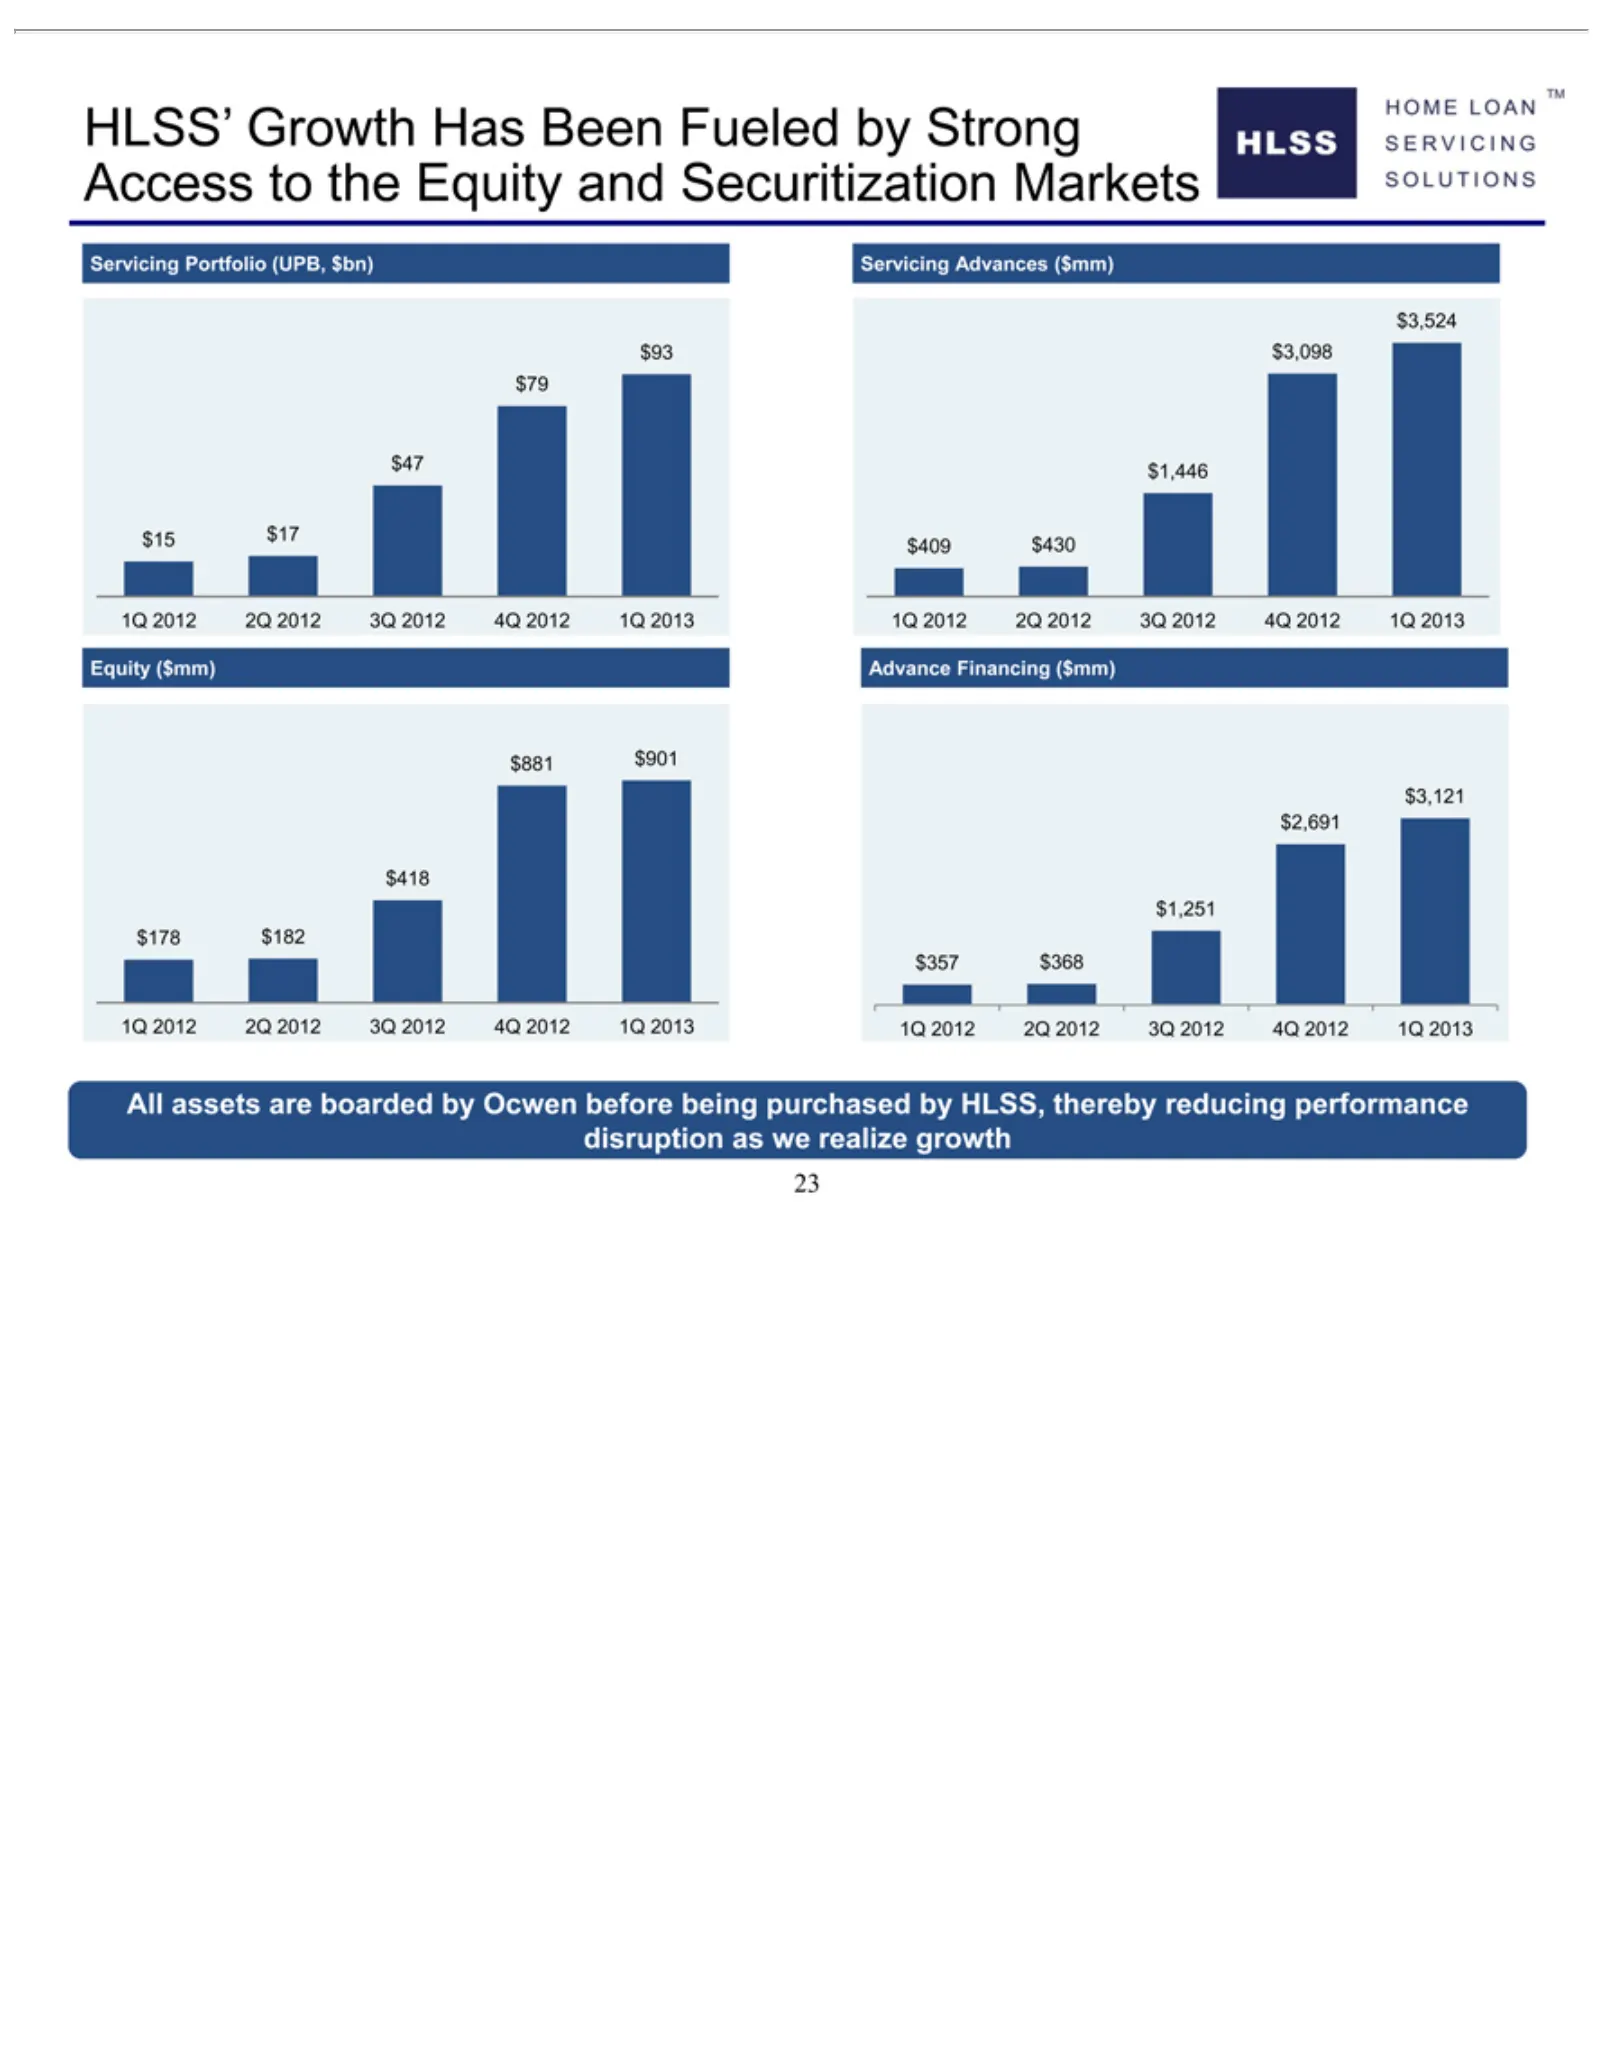
Slide 23: HLSS Growth Fueled by Strong Access to Capital Markets
HLSS’ Servicing $93 $3,524 $47 $15 Equity $881 $418 1Q All 23 2012 assets $3,098 $1,446 $17 $901 $1,251 ($mm) Growth $409 2Q Portfolio are $3,121 $79 2012 $178 boarded $430 Advance Has3Q $2,691 $182 (UPB, Been 2012 byFinancing $357 Ocwen Fueled $bn) 4Q$368 2012 Servicing by before ($mm) Strong 1Q be
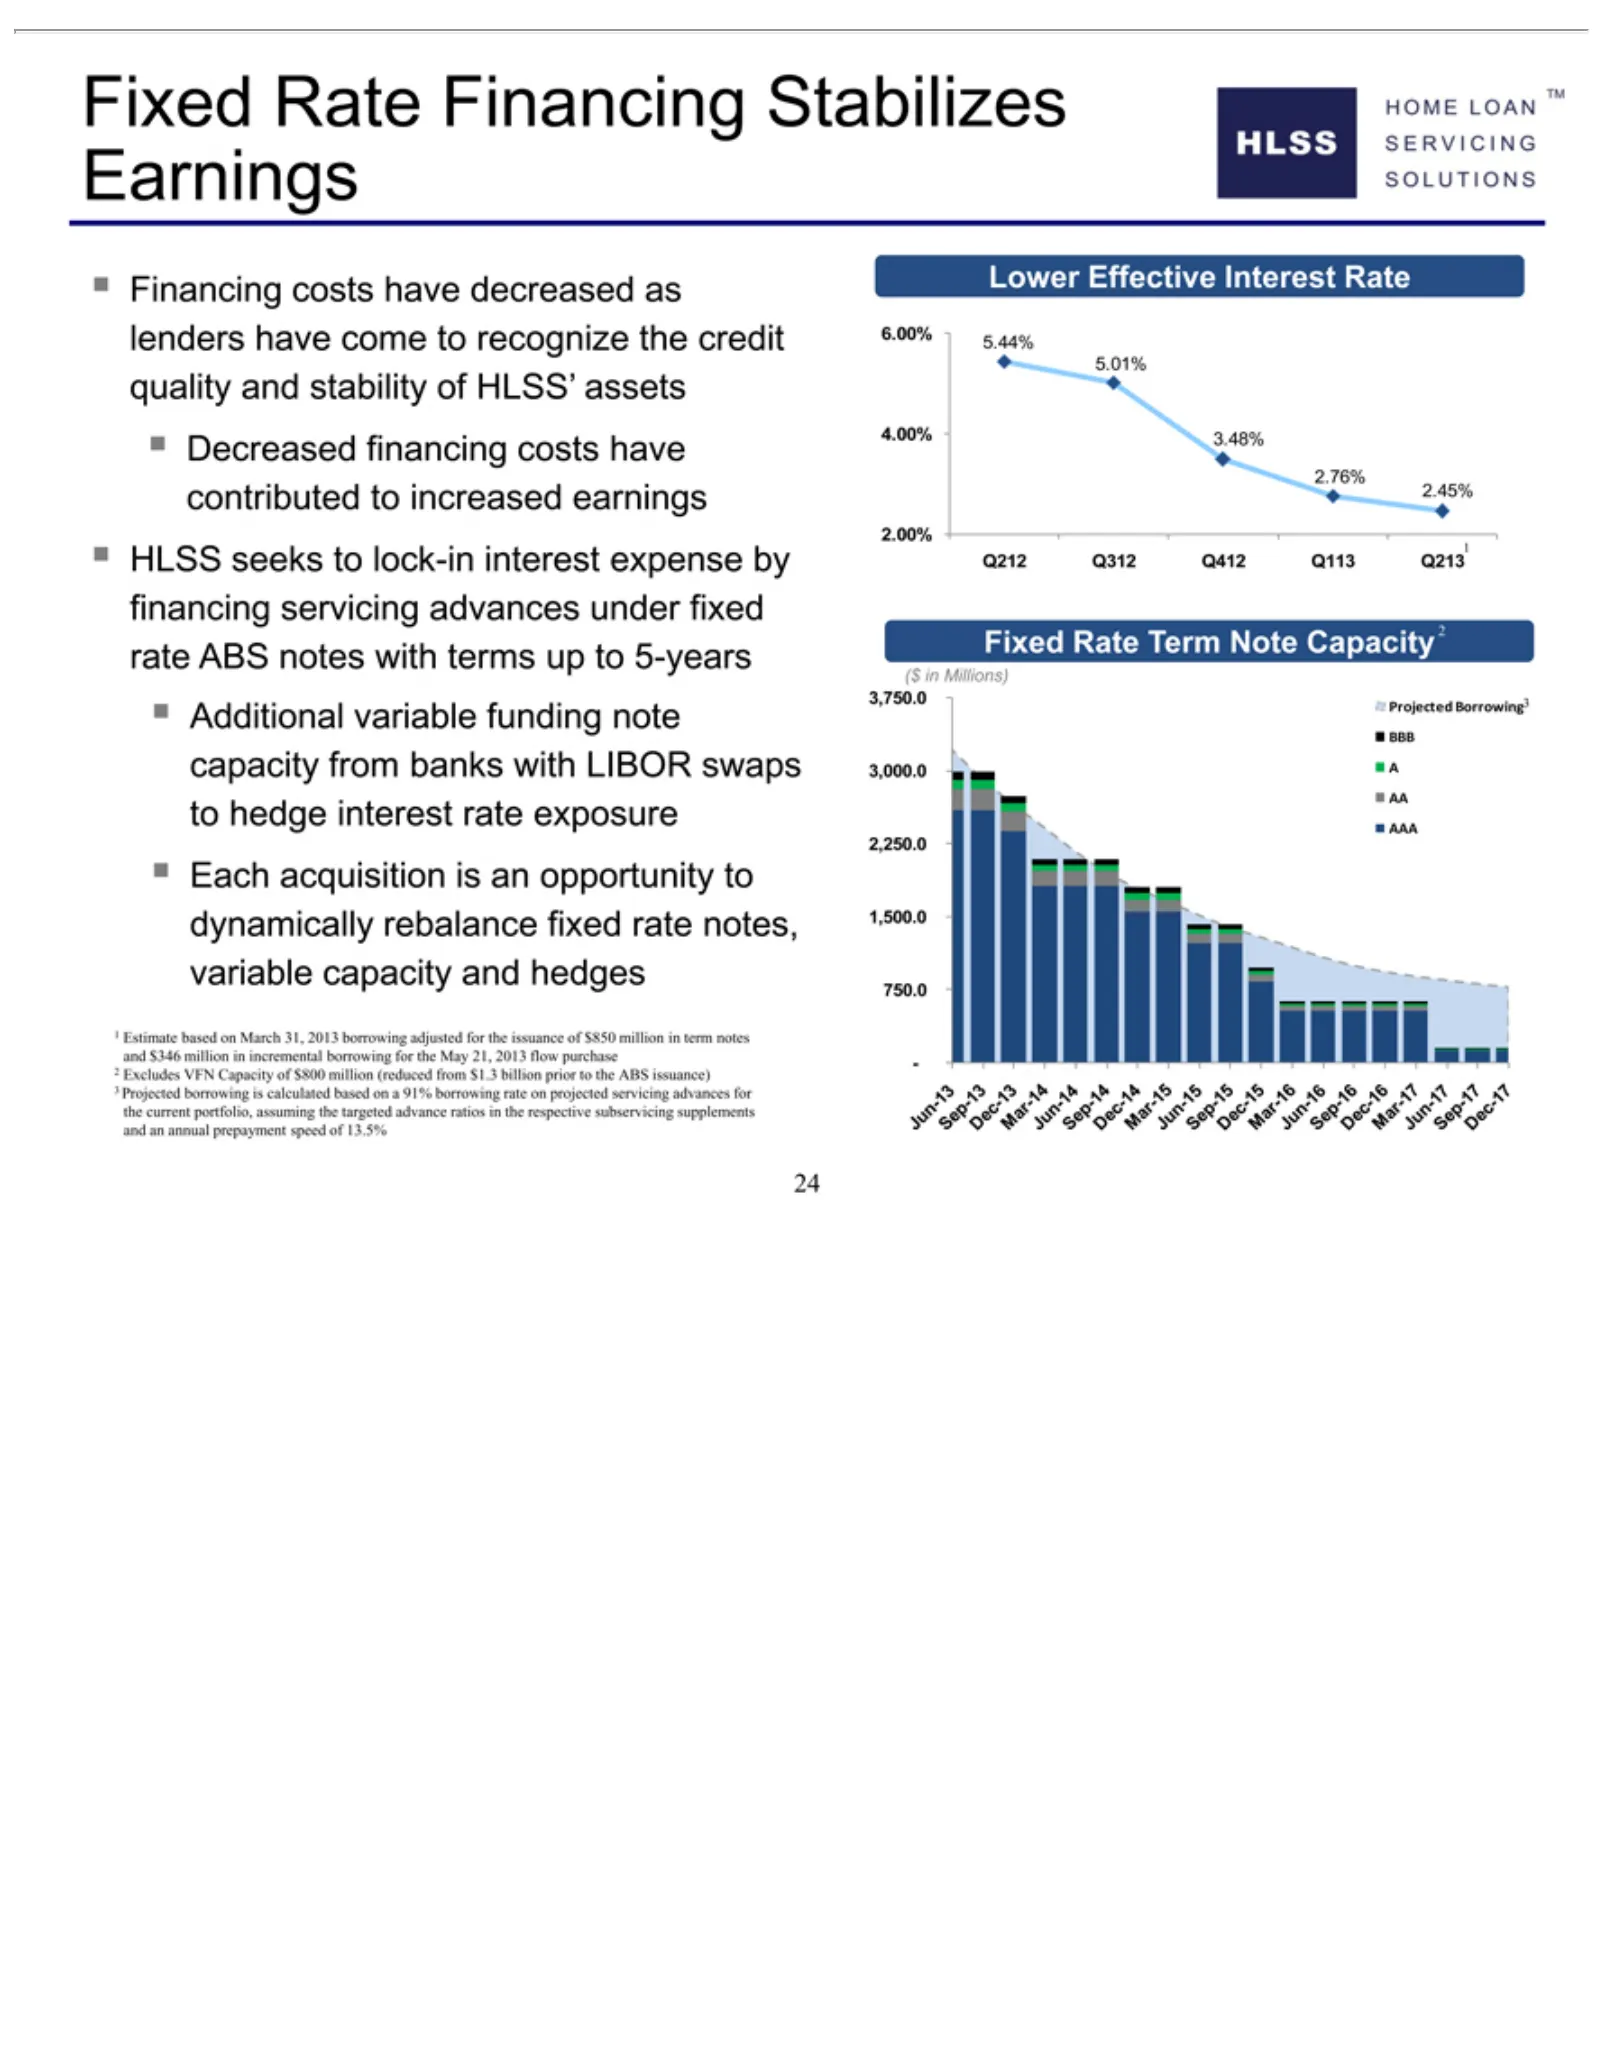
Slide 24: Lower Effective Interest Rate on Financing
Lower 6.00% 5.01% 4.00% 1Q212 2.00% 2.45% 2.76% Fixed ($ 3,750.0 3,000.0 BBB -F 750.0 1,500.0 2,250.0 AAA AA Financing Decreased HLSS Additional 21Each Effective portfolio, 24 ixed Estimate Excludes5.44% A3.48% Q312 Q412 in Millions) acquisition Rate seeks assuming costs Interest financing based var
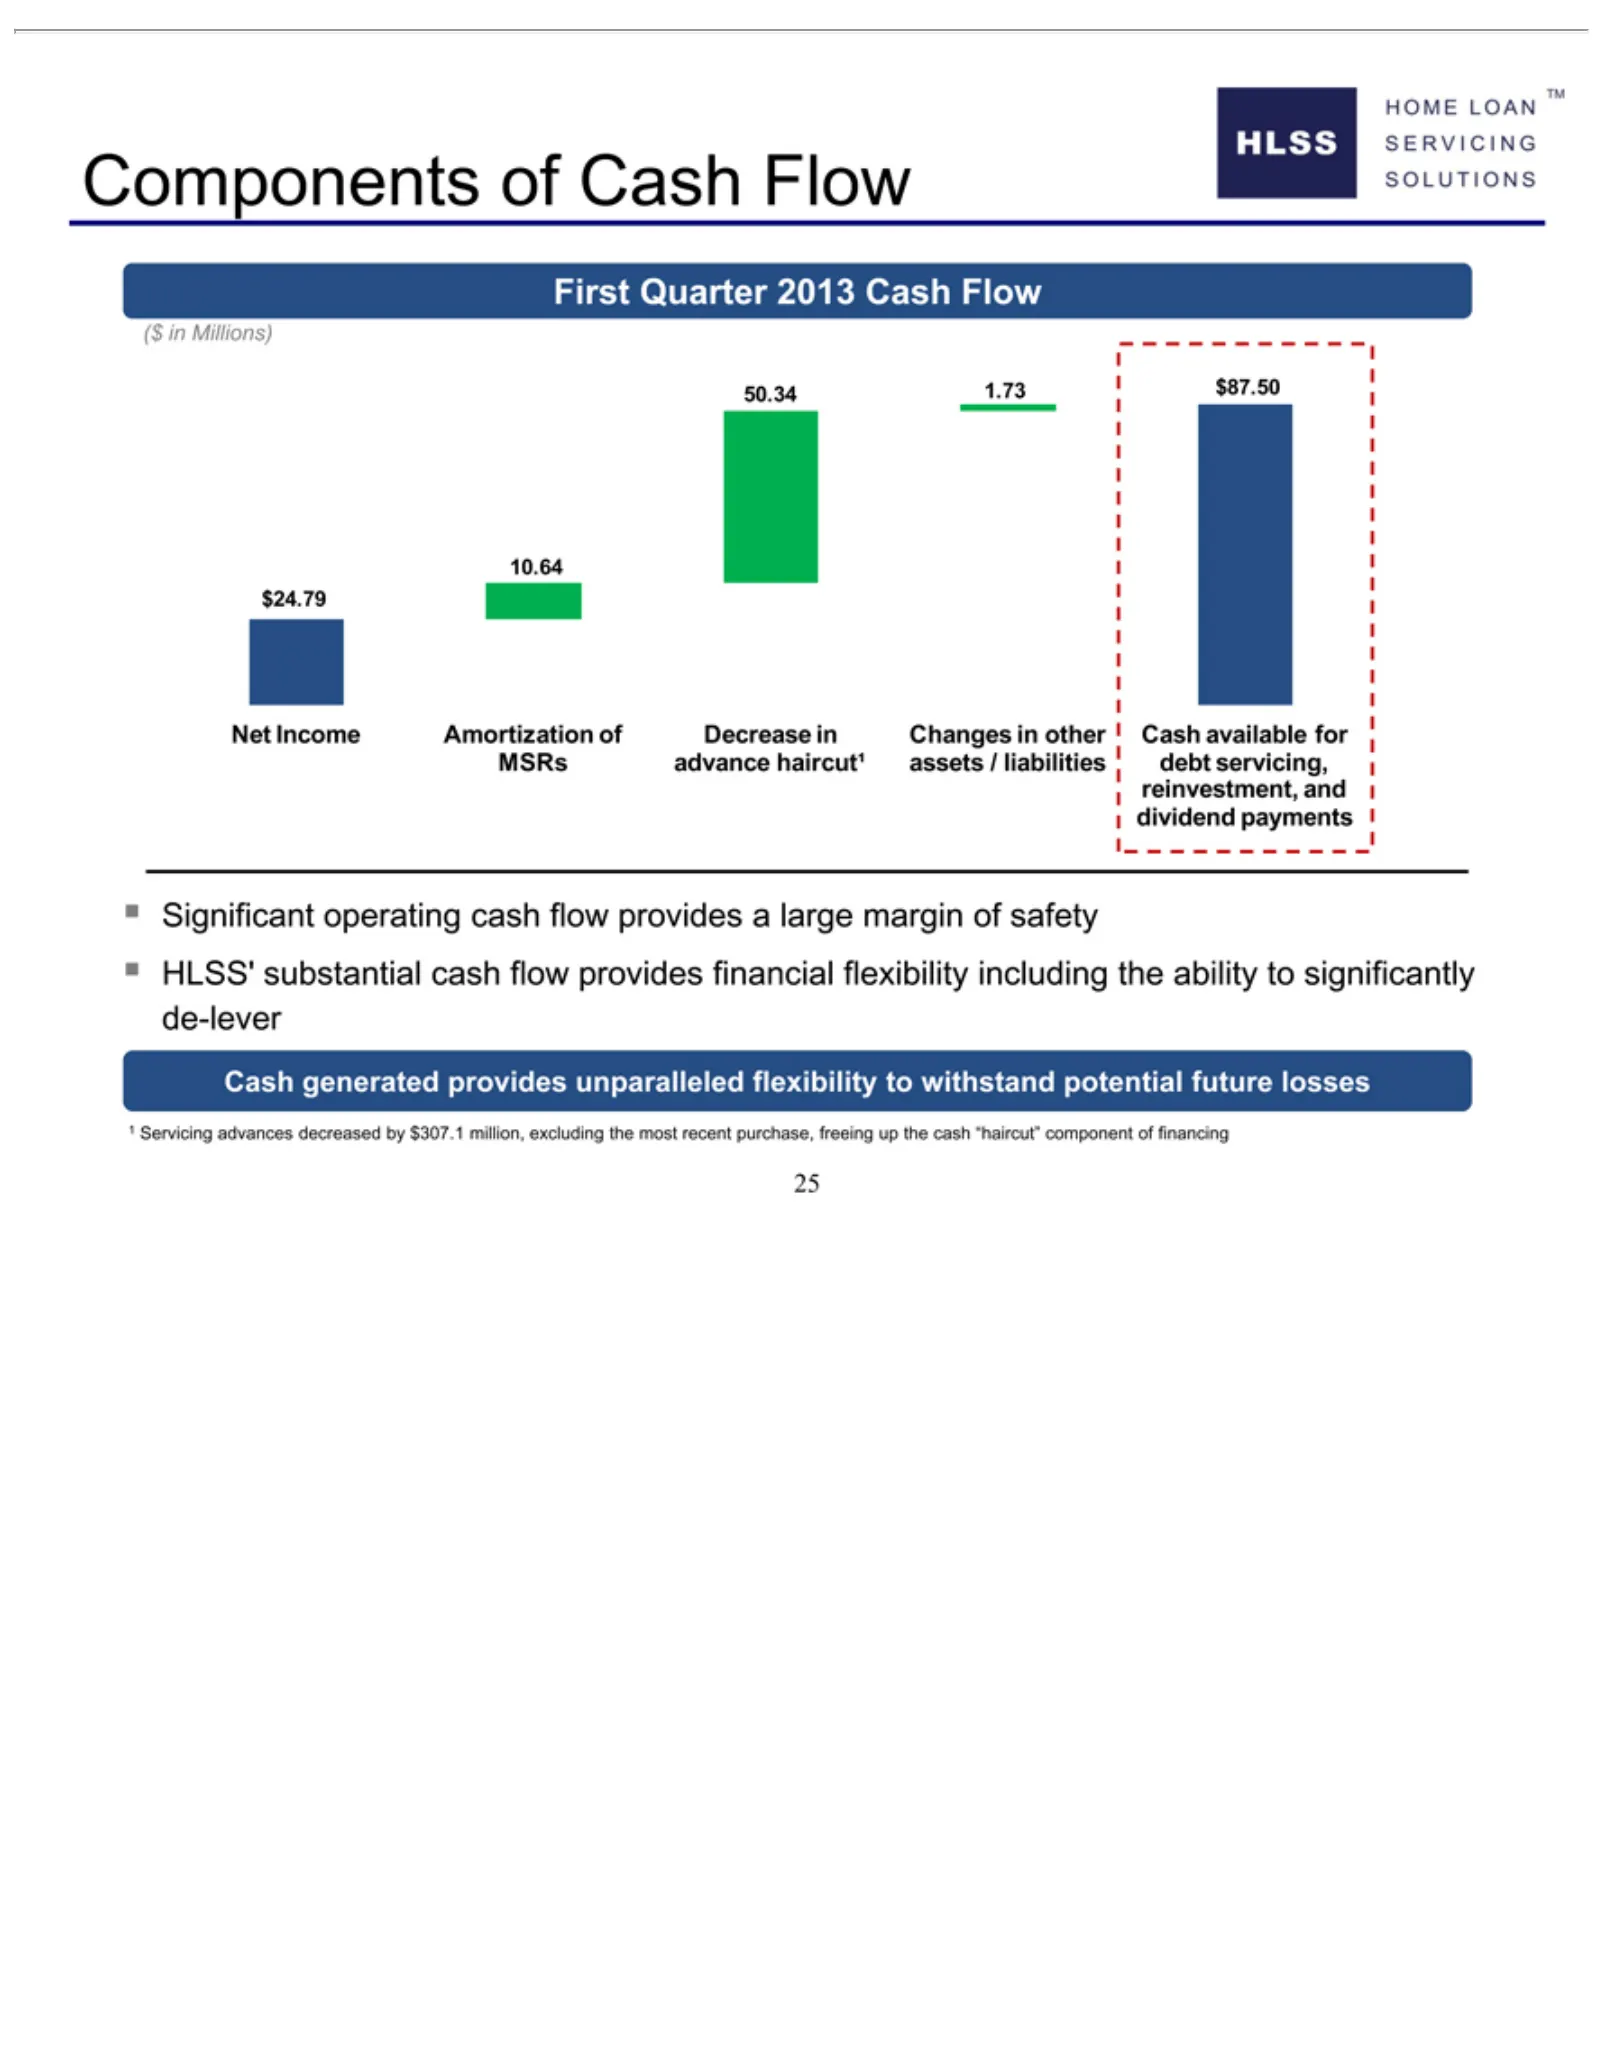
Slide 25: Significant Cash Flow and Liquidity
Significant 1HLSS’ Components First ($ 50.34 25Servicing in Quarter Millions) generated substantial 1.73 inoperating Amortization NetIncome $24.79 10.64 Decrease Changes Cash advances available in of 2013 $87.50 other provides Cash advance offor cash Cash MSRs Flow cash decreased assets debt flow /F

Slide 26: Financial Review
HOME LOAN ™ SERVICING SOLUTIONS Financial Review 26
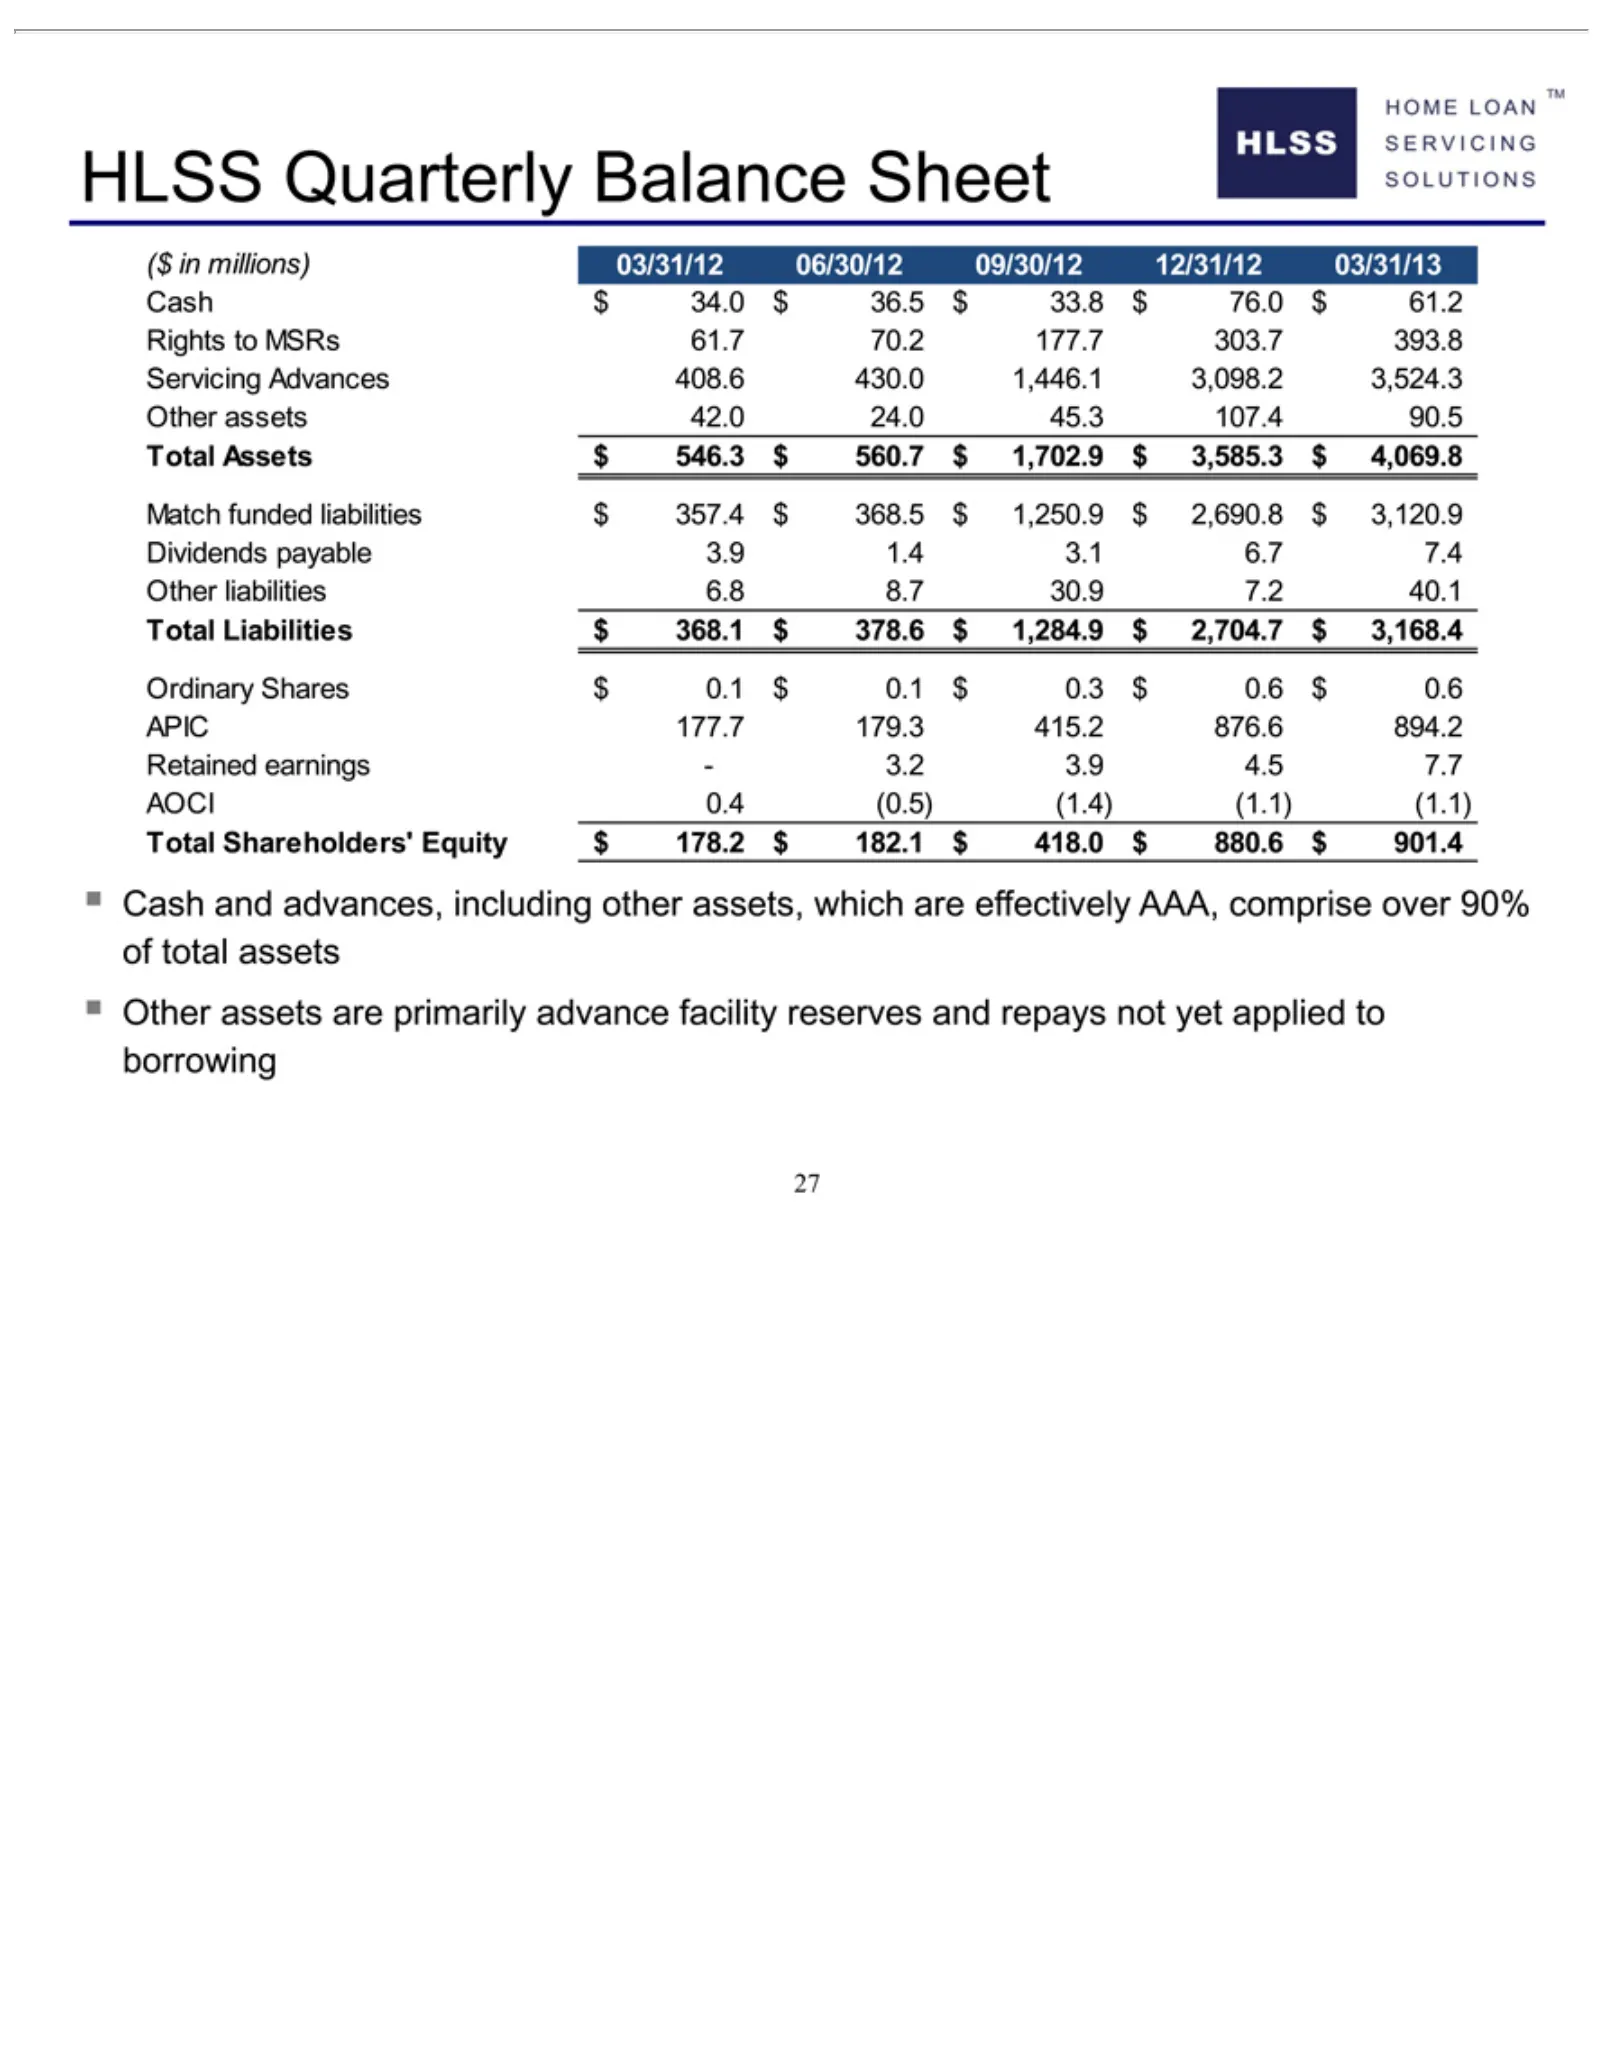
Slide 27: HLSS Balance Sheet
?Cash ?Other HLSS ($ Cash Rights Servicing Match Dividends Other Ordinary APIC Retained AOCI Total 27 in millions) Assets $Shareholders’ Liabilities assets liabilities 177.7 and 0.4 Quarterly funded to assets 34.0 earnings Shares MSRs Advances (0.5) payable advances, $179.3 42.0 are 36.5 liabilities
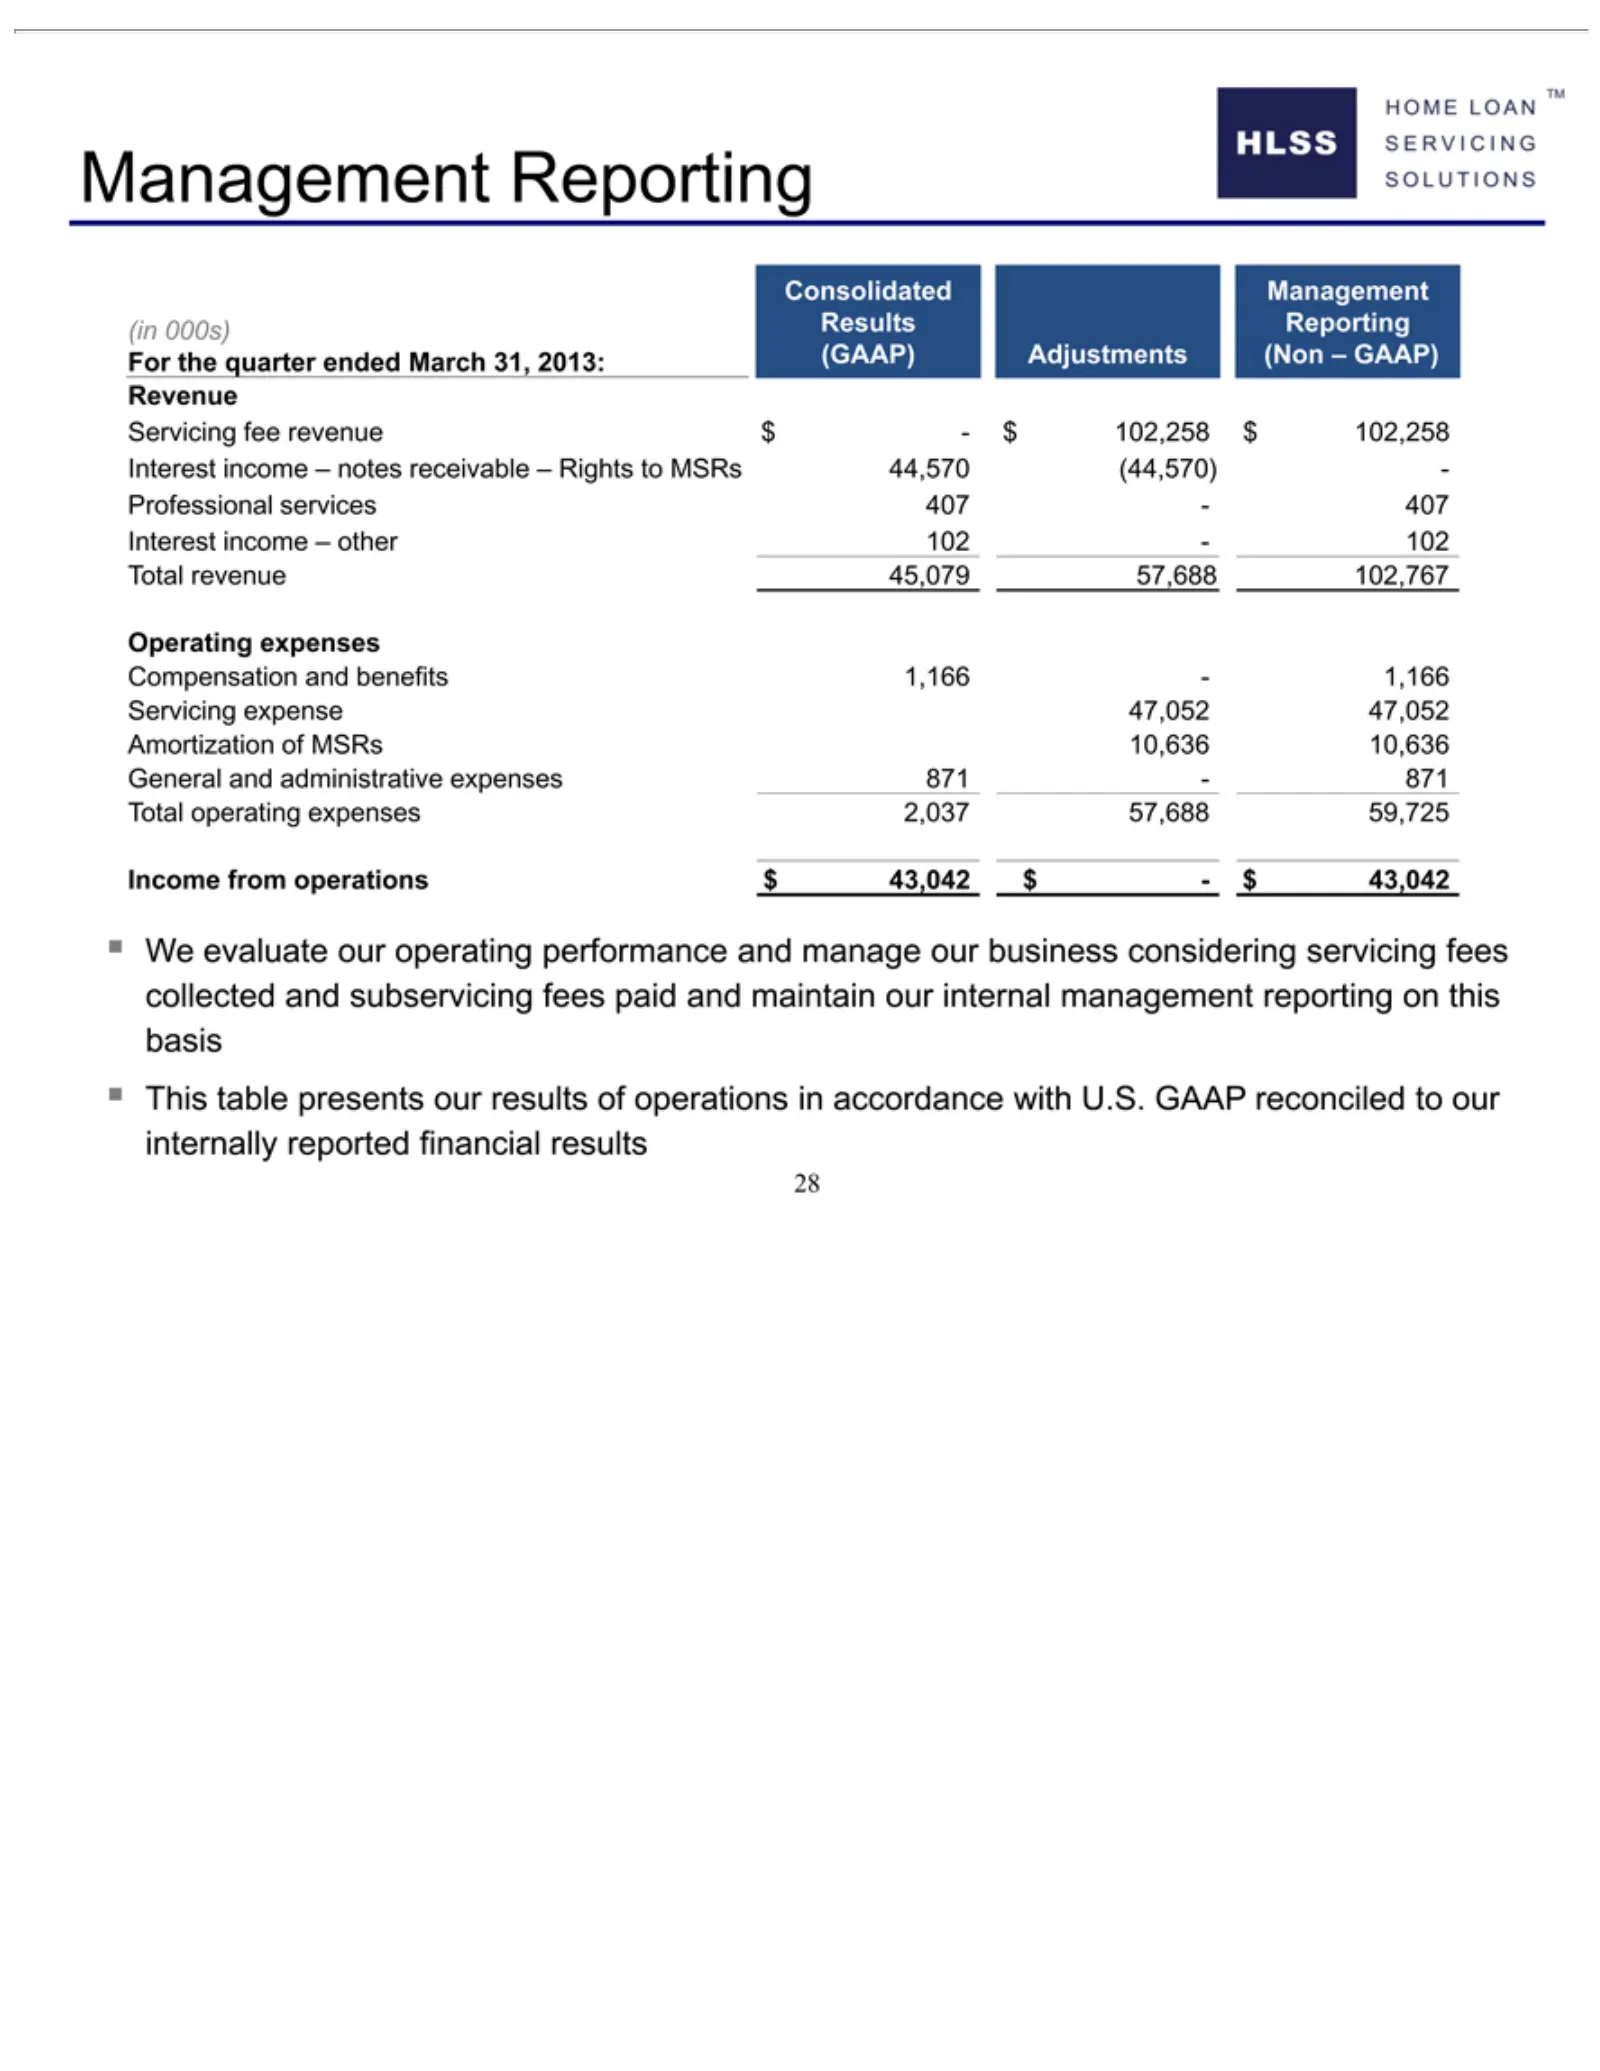
Slide 28: Management Reporting Consolidated Results
Management Consolidated (in For Revenue Professional Interest Operating Compensation Servicing Amortization General Total Income We This 28 000s) evaluate the table revenue operating quarter income from and fee expense presents expenses administrative our services operations Reporting Results revenu
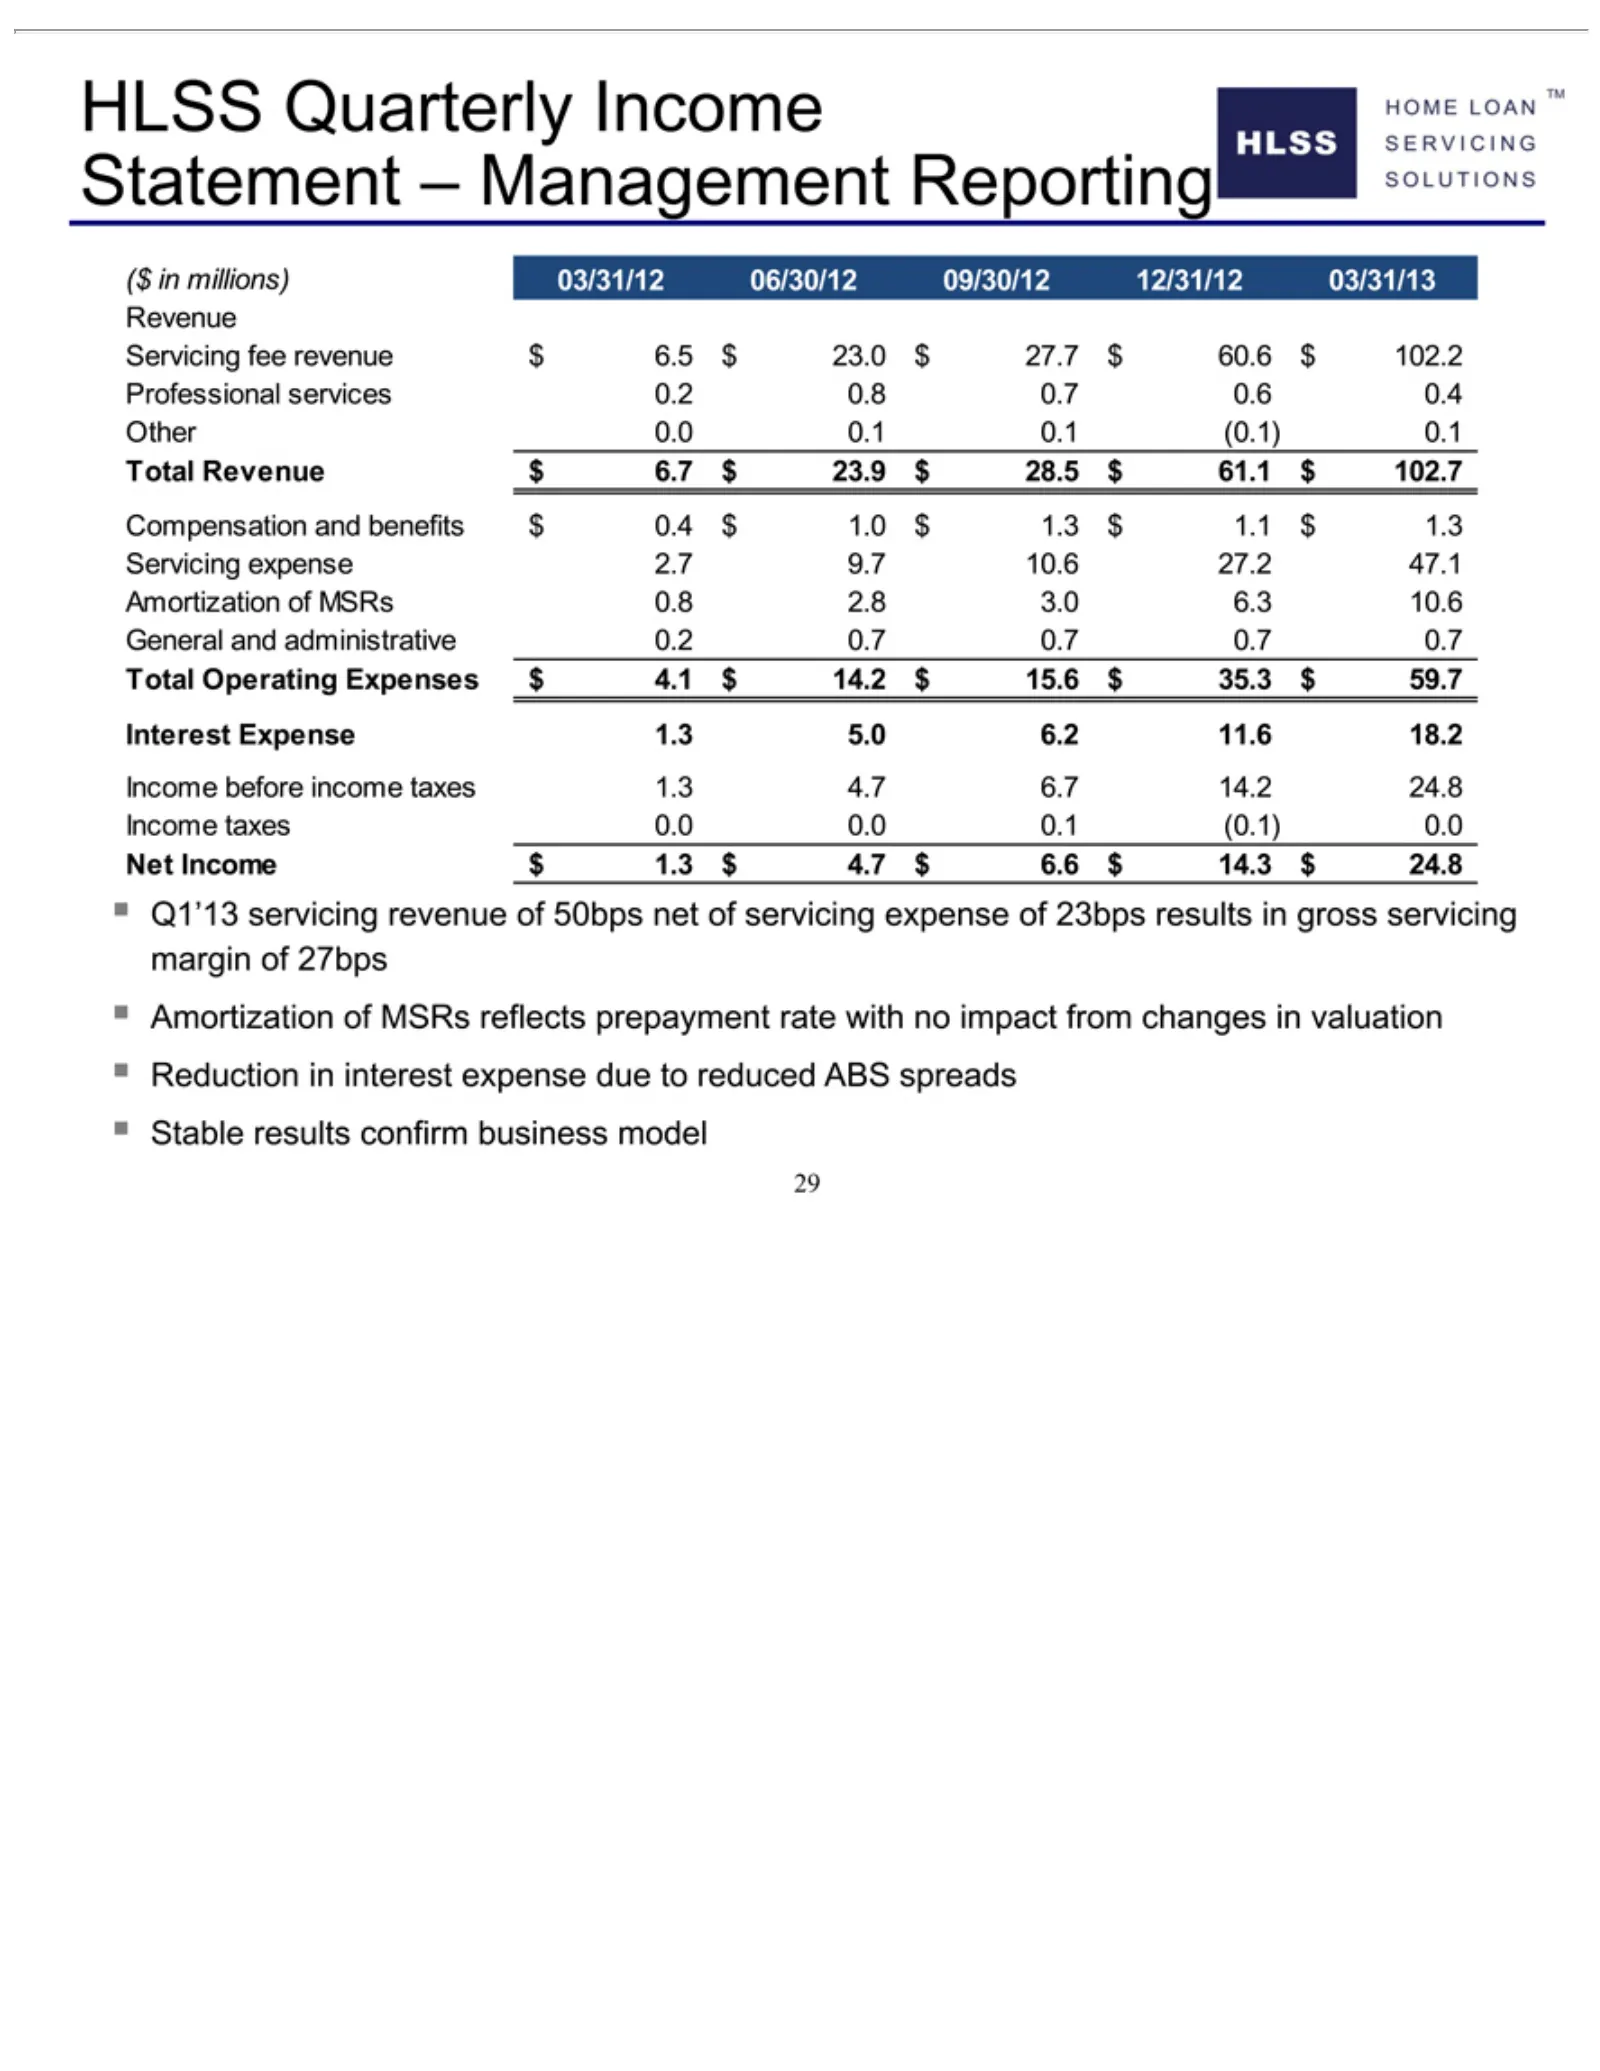
Slide 29: HLSS Statement of Income
HLSS Statement ($ Revenue Professional Other Compensation Servicing General Total Interest Income Net Q1’13 Amortization Reduction Stable 29 inIncome millions) Revenue Operating 0.0 Quarterly results servicing Expense before taxes and 0.1 fee expense –in$Management administrative services interest 0
Slide 30: Transaction Overview
HOME LOAN ™ SERVICING SOLUTIONS Transaction Overview 30
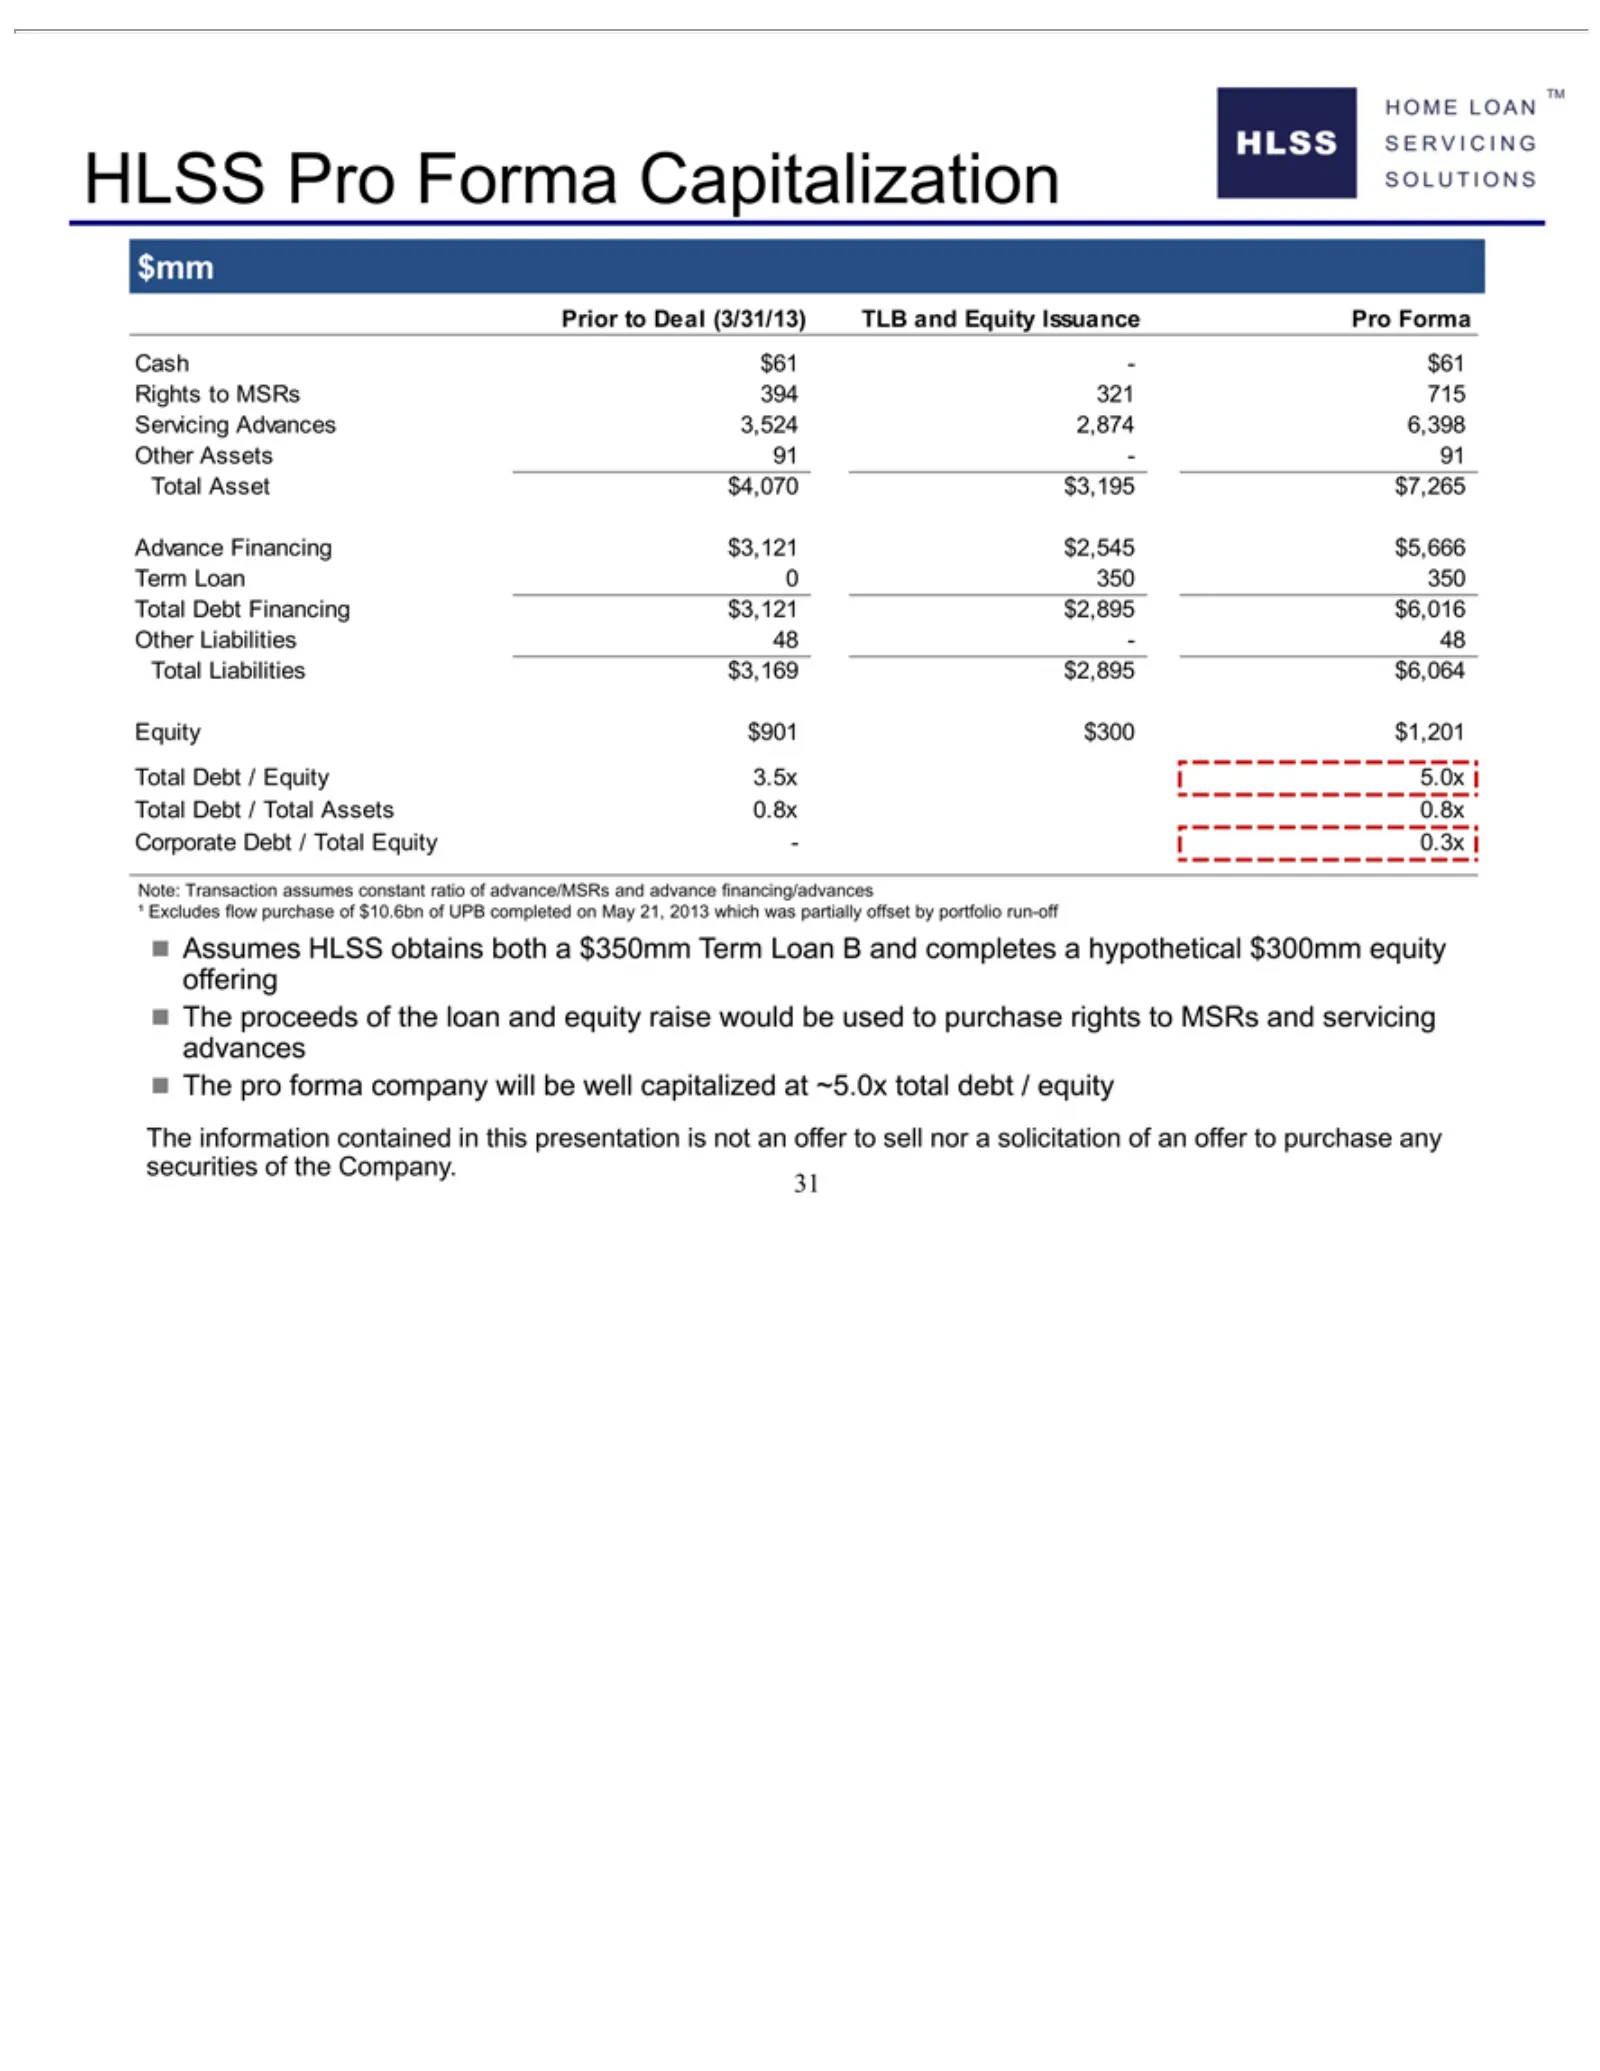
Slide 31: HLSS Pro Forma Capitalization
HLSS Prior $mm Cash Rights Servicing Advance Term Other Equity Total Corporate ąNote: Assumes The 31 Excludes proceeds pro information Asset to $61 Liabilities Debt Loan Transaction Assets Liabilities Pro to $901 Deal forma Financing HLSS MSRs — Advances Debt Forma /Financing flow 0$4,070 Total Equi
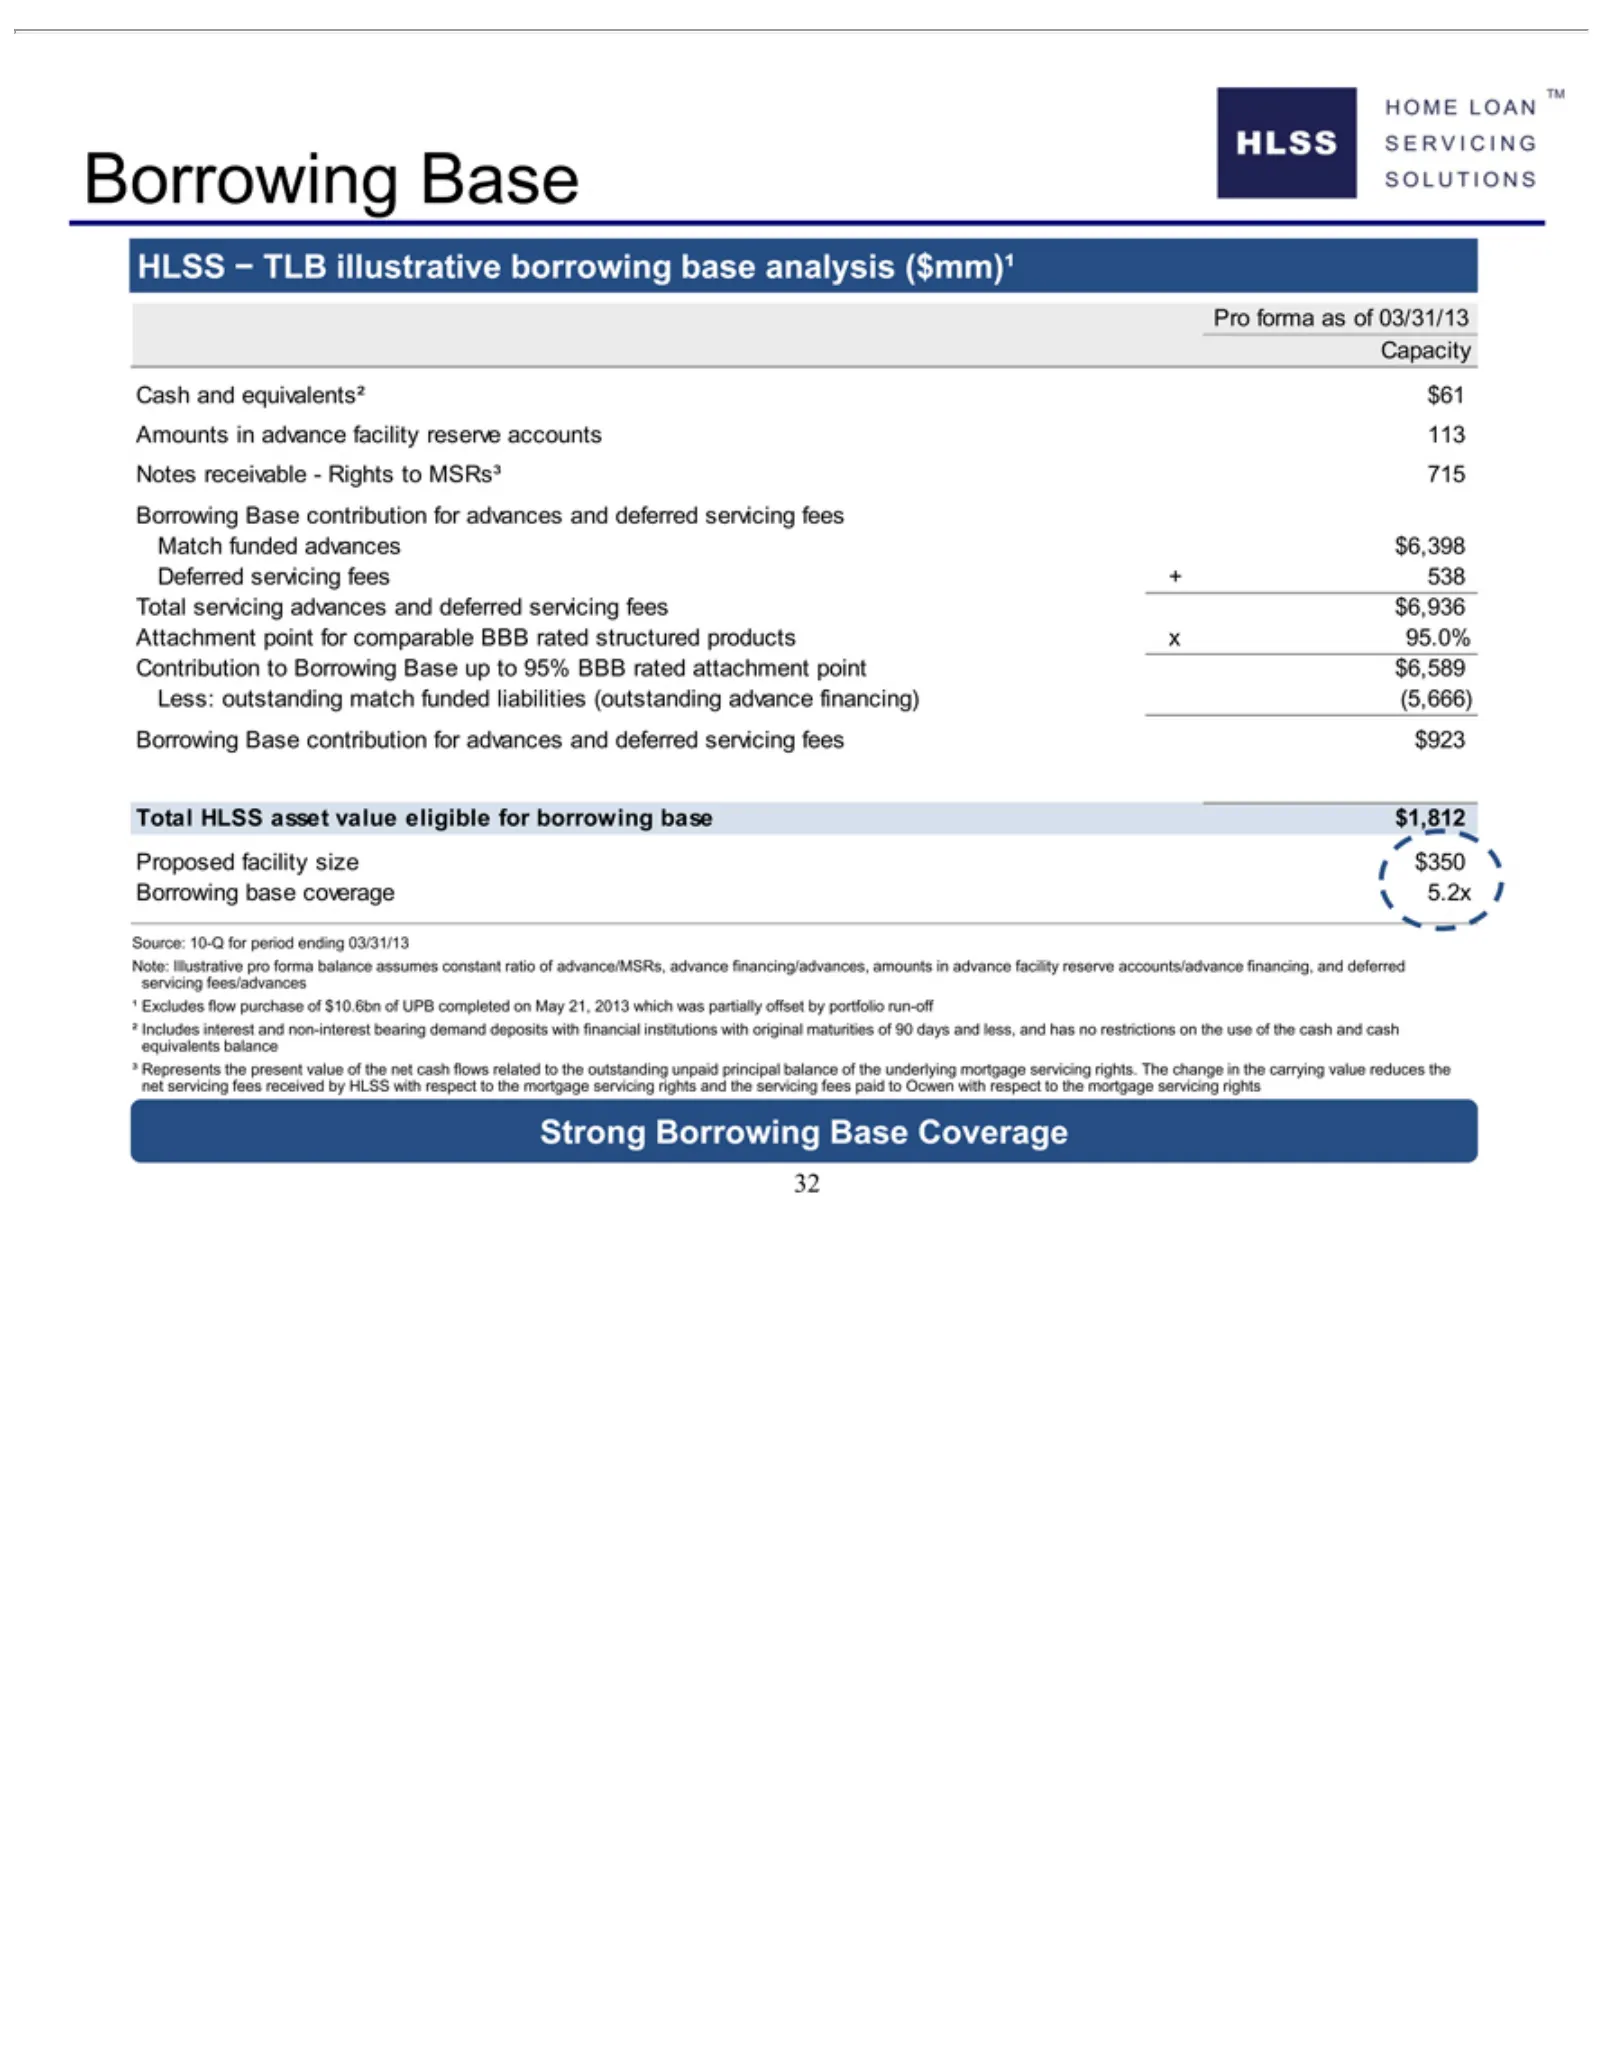
Slide 32: Pro Forma Borrowing Base and Cash Flow Coverage
HLSS Pro Cash Capacity Amounts Notes Match Deferred Attachment Contribution Less: Total Proposed Borrowing Source: ³²¹Note: received Strong 32 Excludes Includes Represents forma and servicing HLSS outstanding Illustrative receivable—Rights ífunded Borrowing TLB 10-Q by servicing in equivalents² faci
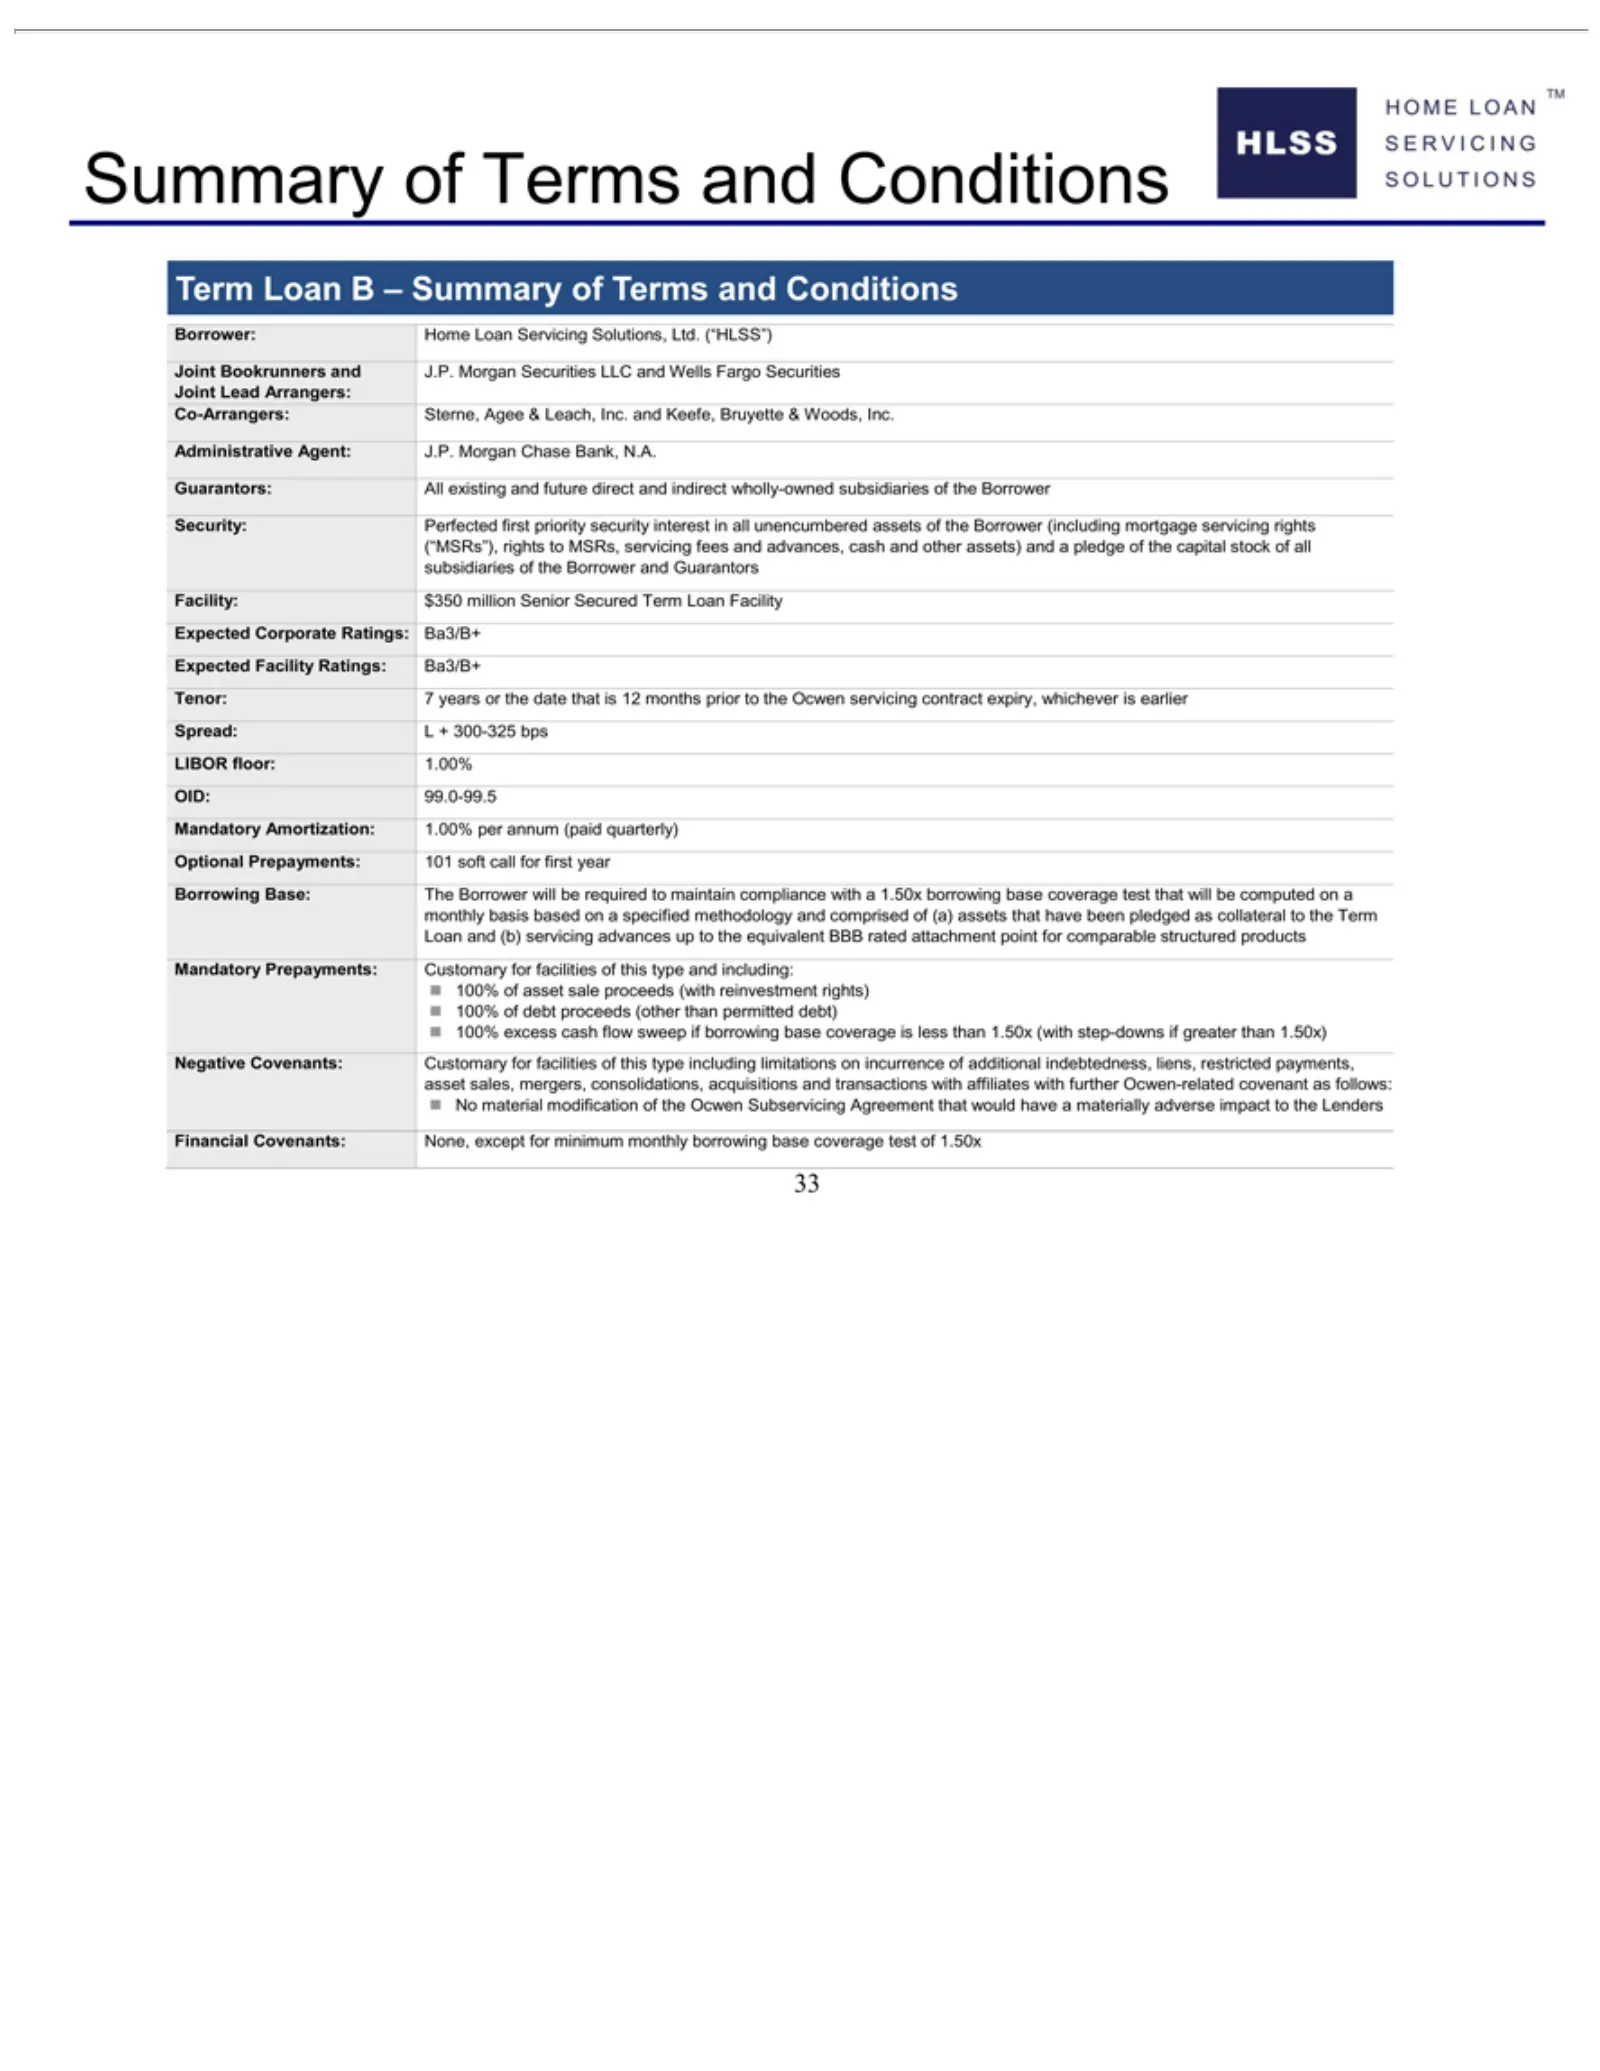
Slide 33: Summary of Term Loan Terms
Summary Term Borrower: Joint Co-Arrangers: Administrative Guarantors: Security: (“MSRs”), subsidiaries Facility: Expected Tenor: Spread: LIBOR OID: Optional Borrowing (a) Loan Mandatory 100% Negative asset No Financial 33 assets material sales, Bookrunners Lead and 99.0-99.5 Loan of excess 7floor: L
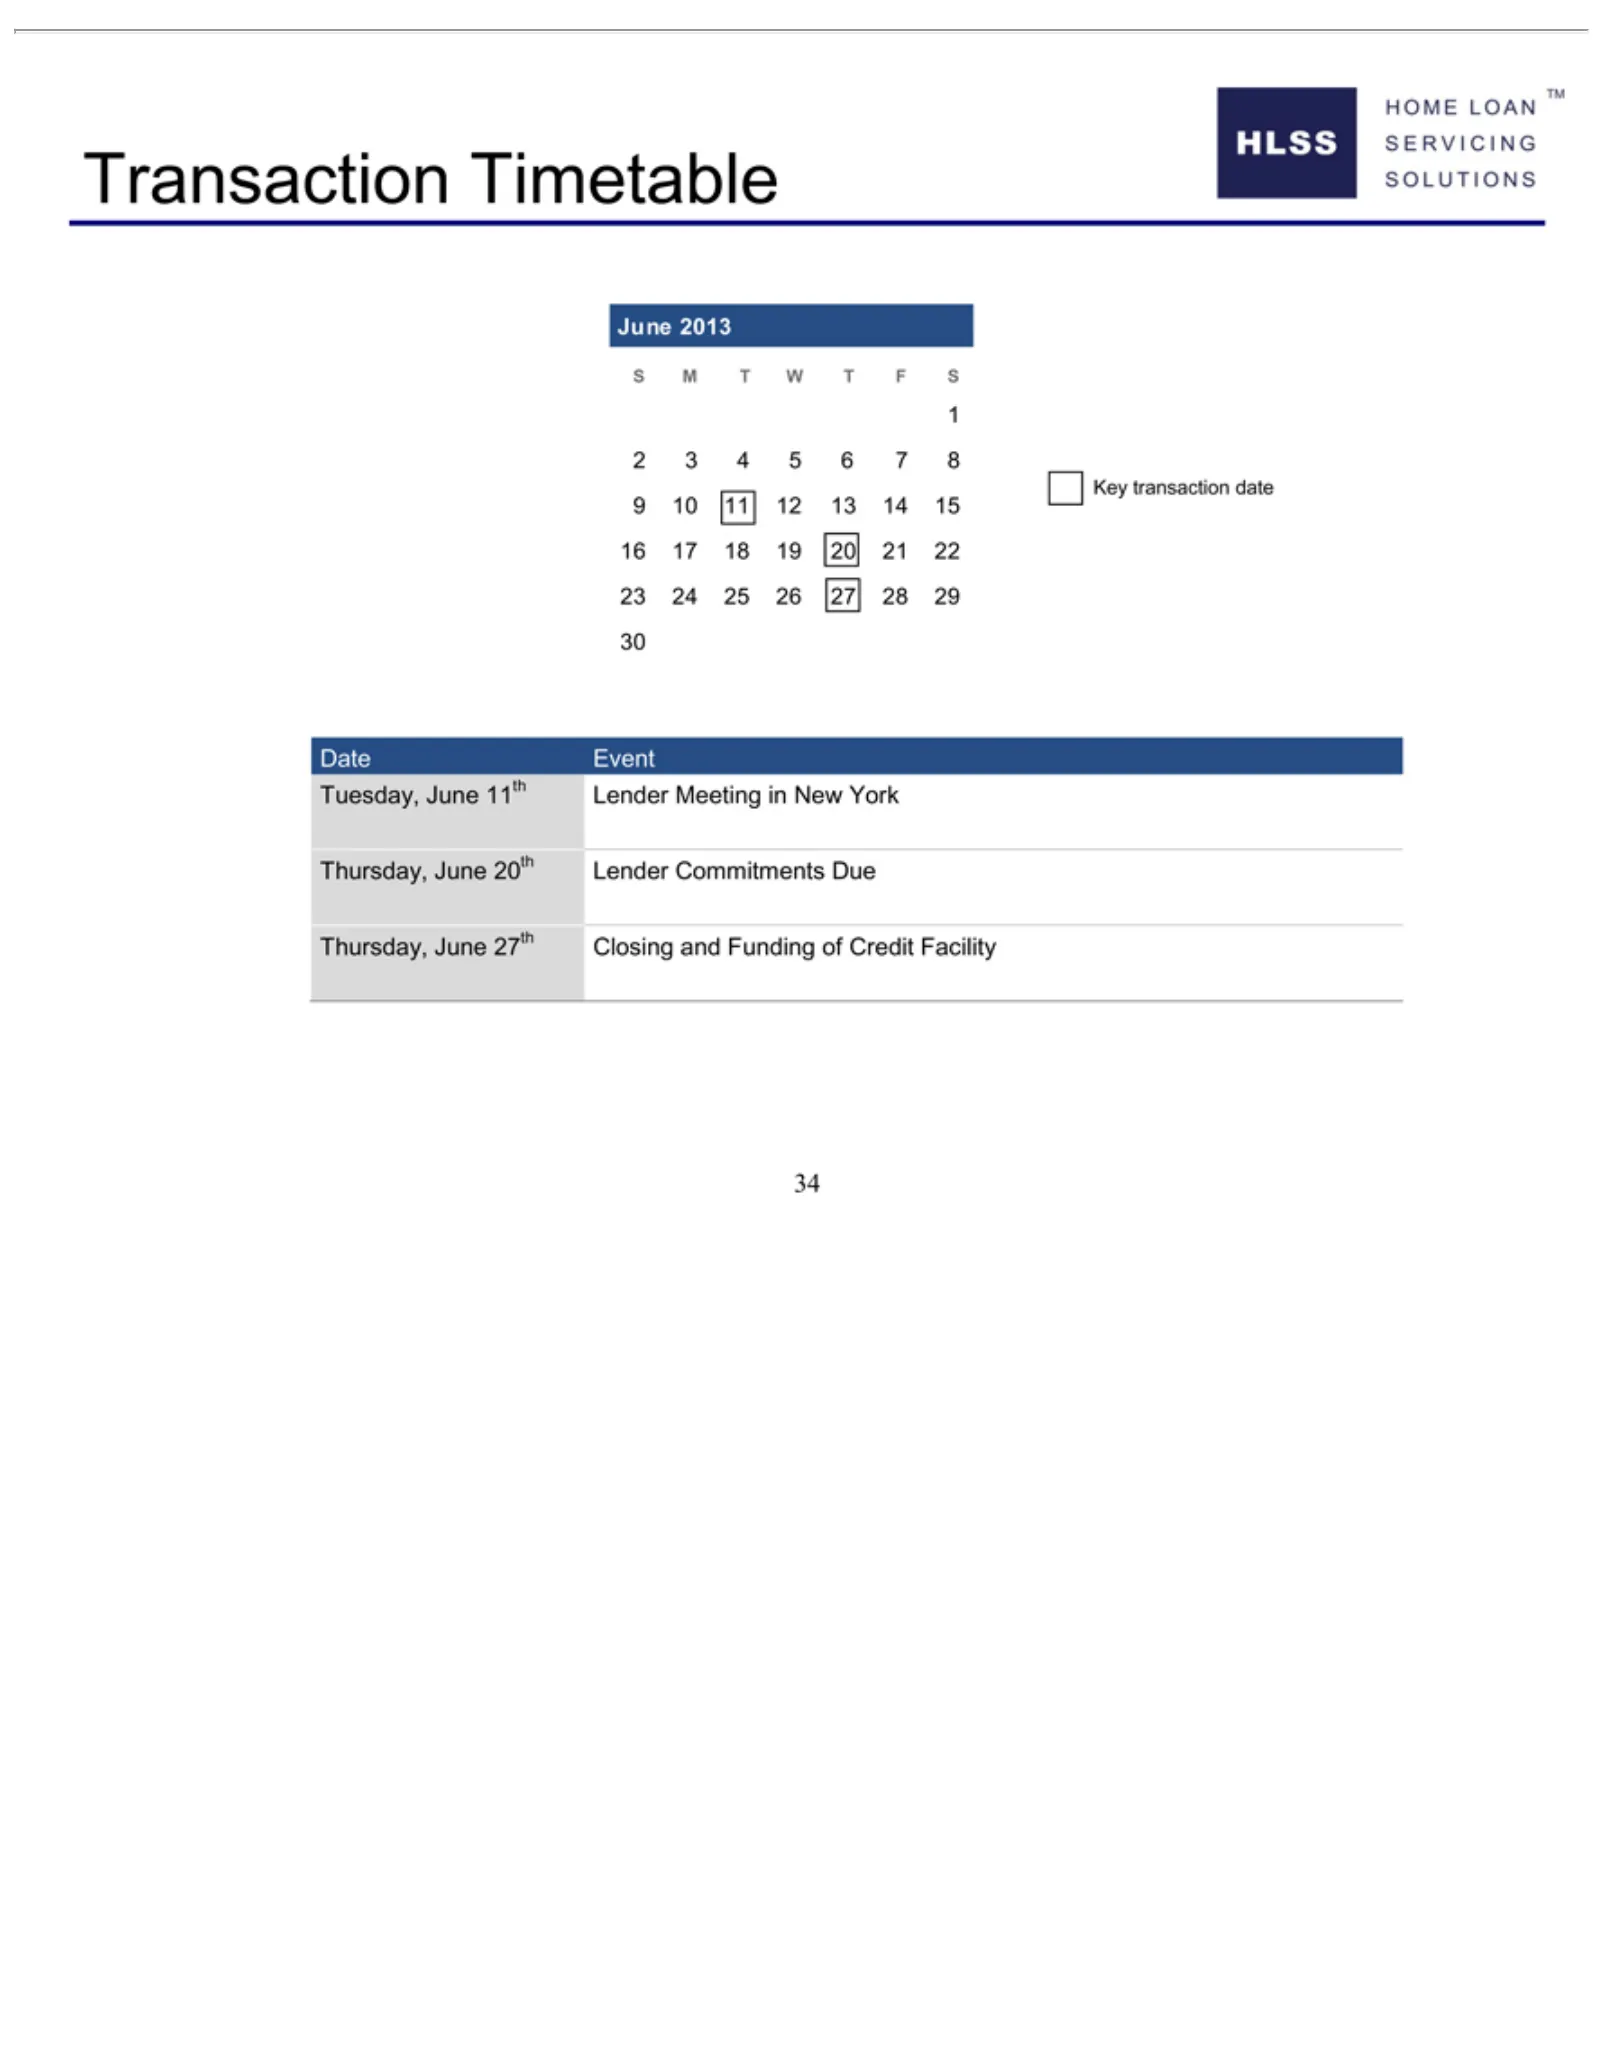
Slide 34: Key Transaction Dates
12Thursday, June S M24 9Key 16 23 Date 3010 T2013 Tuesday,W12TJune 326 F527 413 17transaction 11 Event 18 25 19 June 20S14 611th 7date 21 28 829 20th 27th 1522 Lender LenderMeeting ClosingCommitments and Funding in NewofDue York Credit Facility
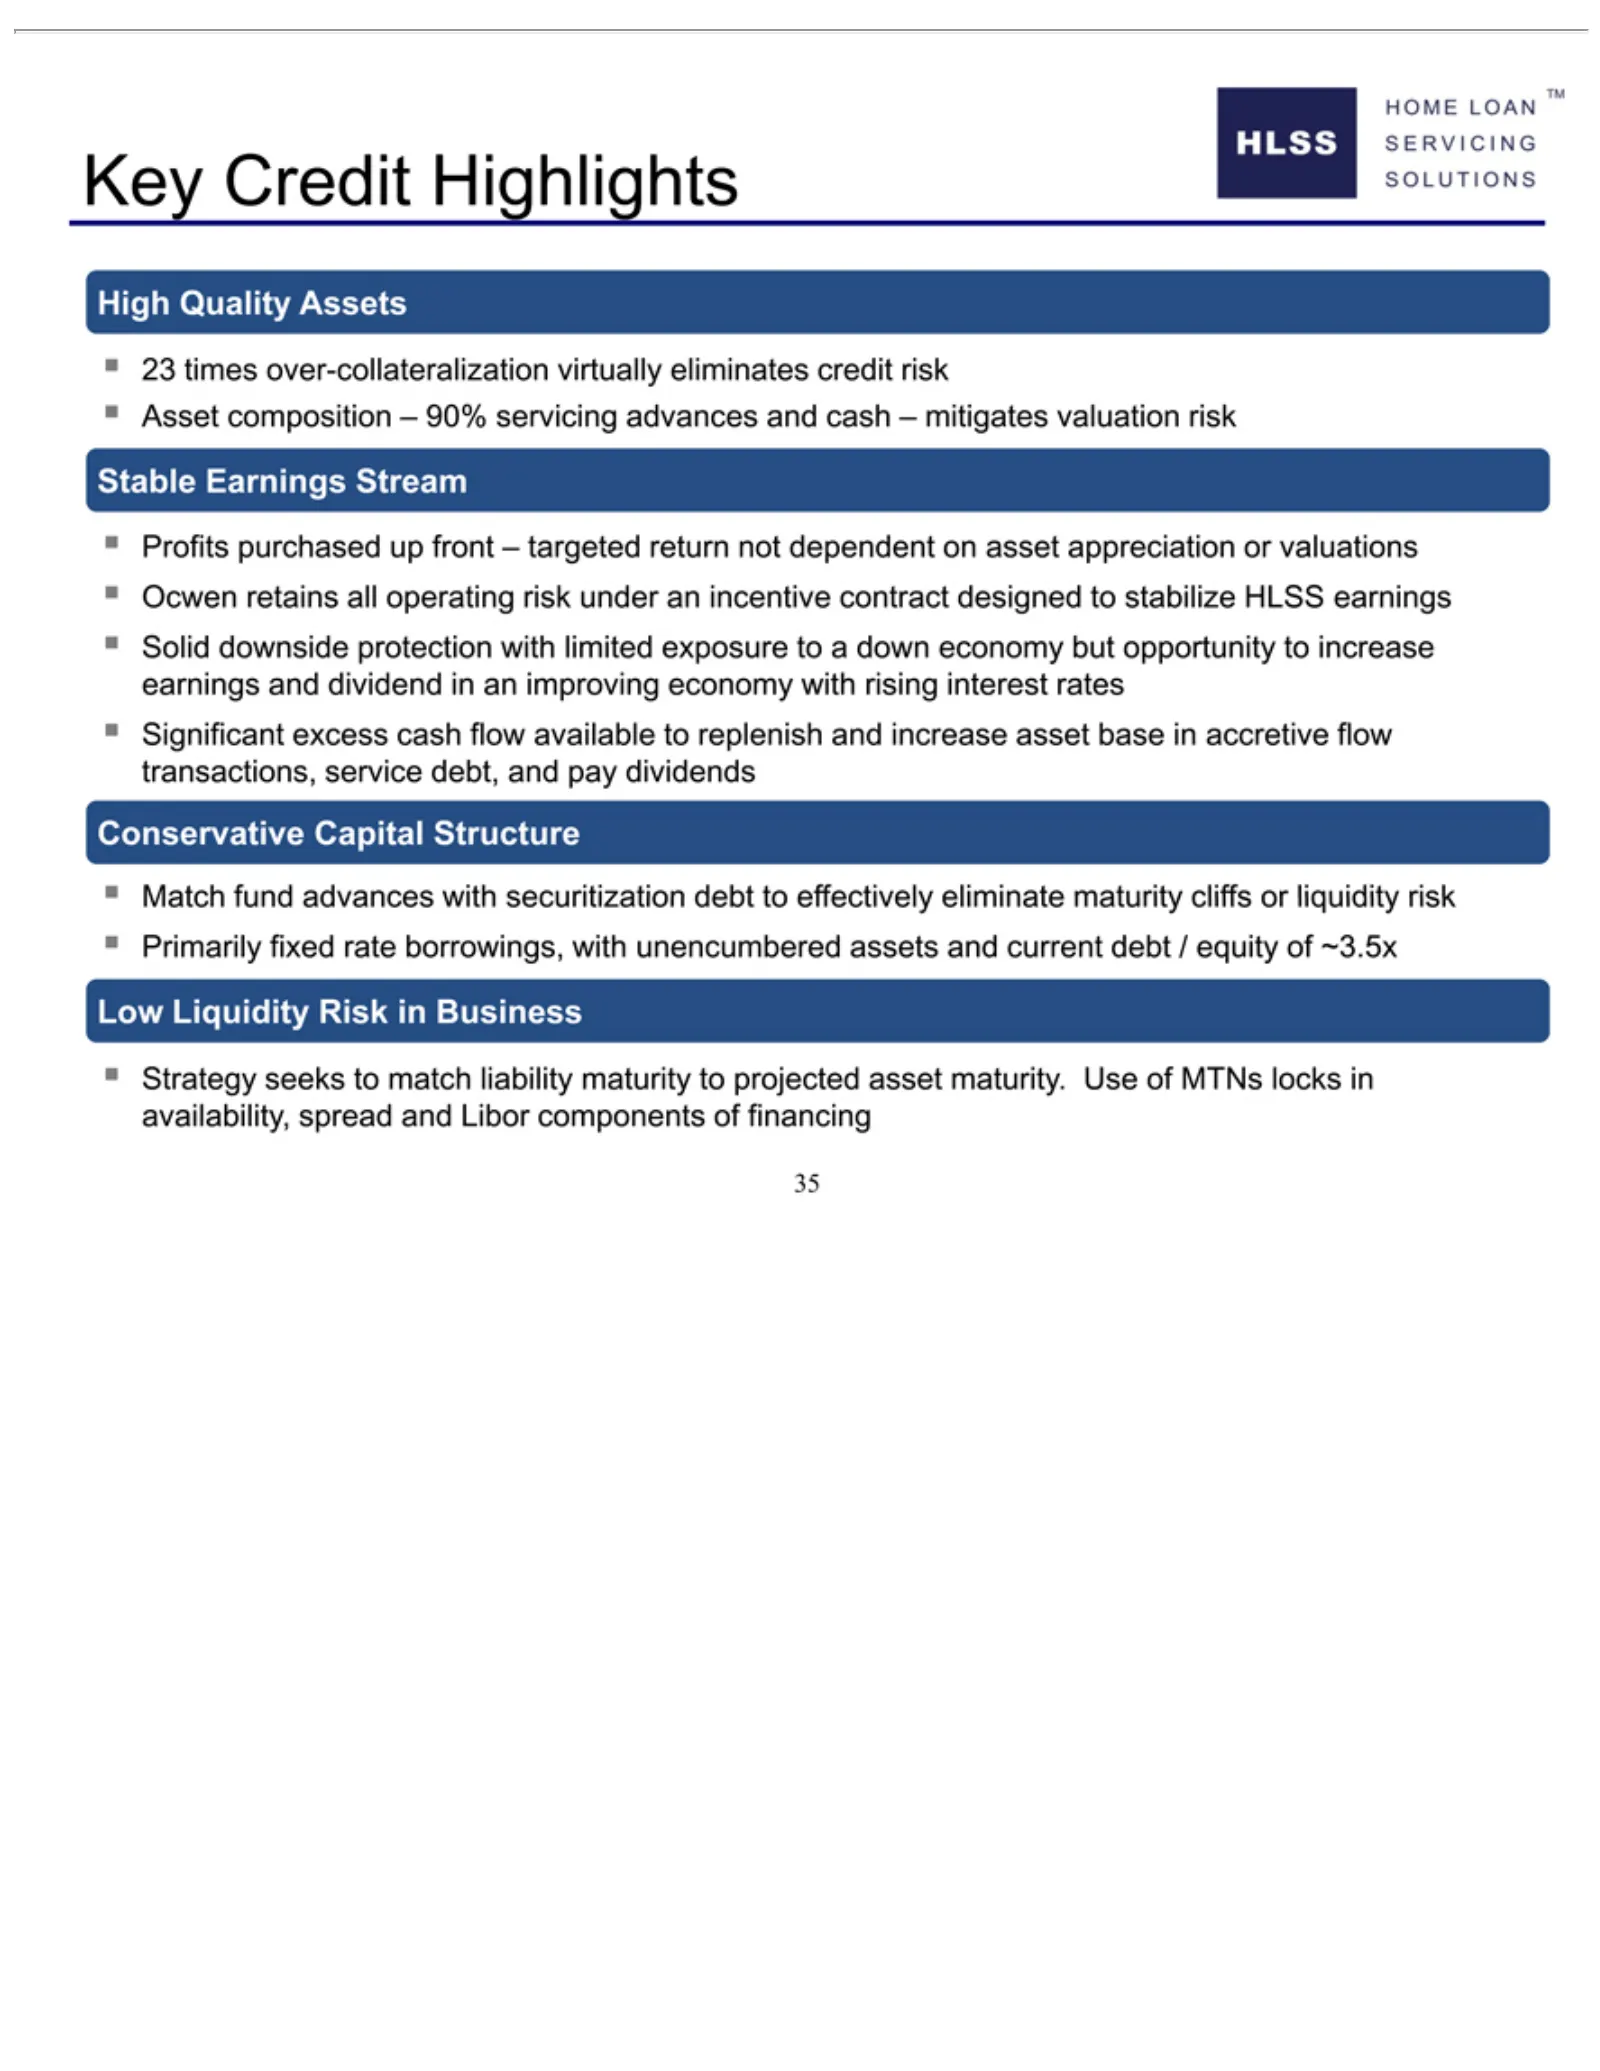
Slide 35: Key Credit Highlights
Keytimes High 23 Asset Stable Profits Ocwen Solid Significant Conservative Match Primarily Low Strategy 35 Credit Liquidity Quality downside composition Earnings fund purchased retains seeks over-collateralization fixed excess Highlights advances Assets Capital all to Risk rate protection Stream mat

Slide 36: Appendix
HOME LOAN ™ SERVICING SOLUTIONS Appendix 36
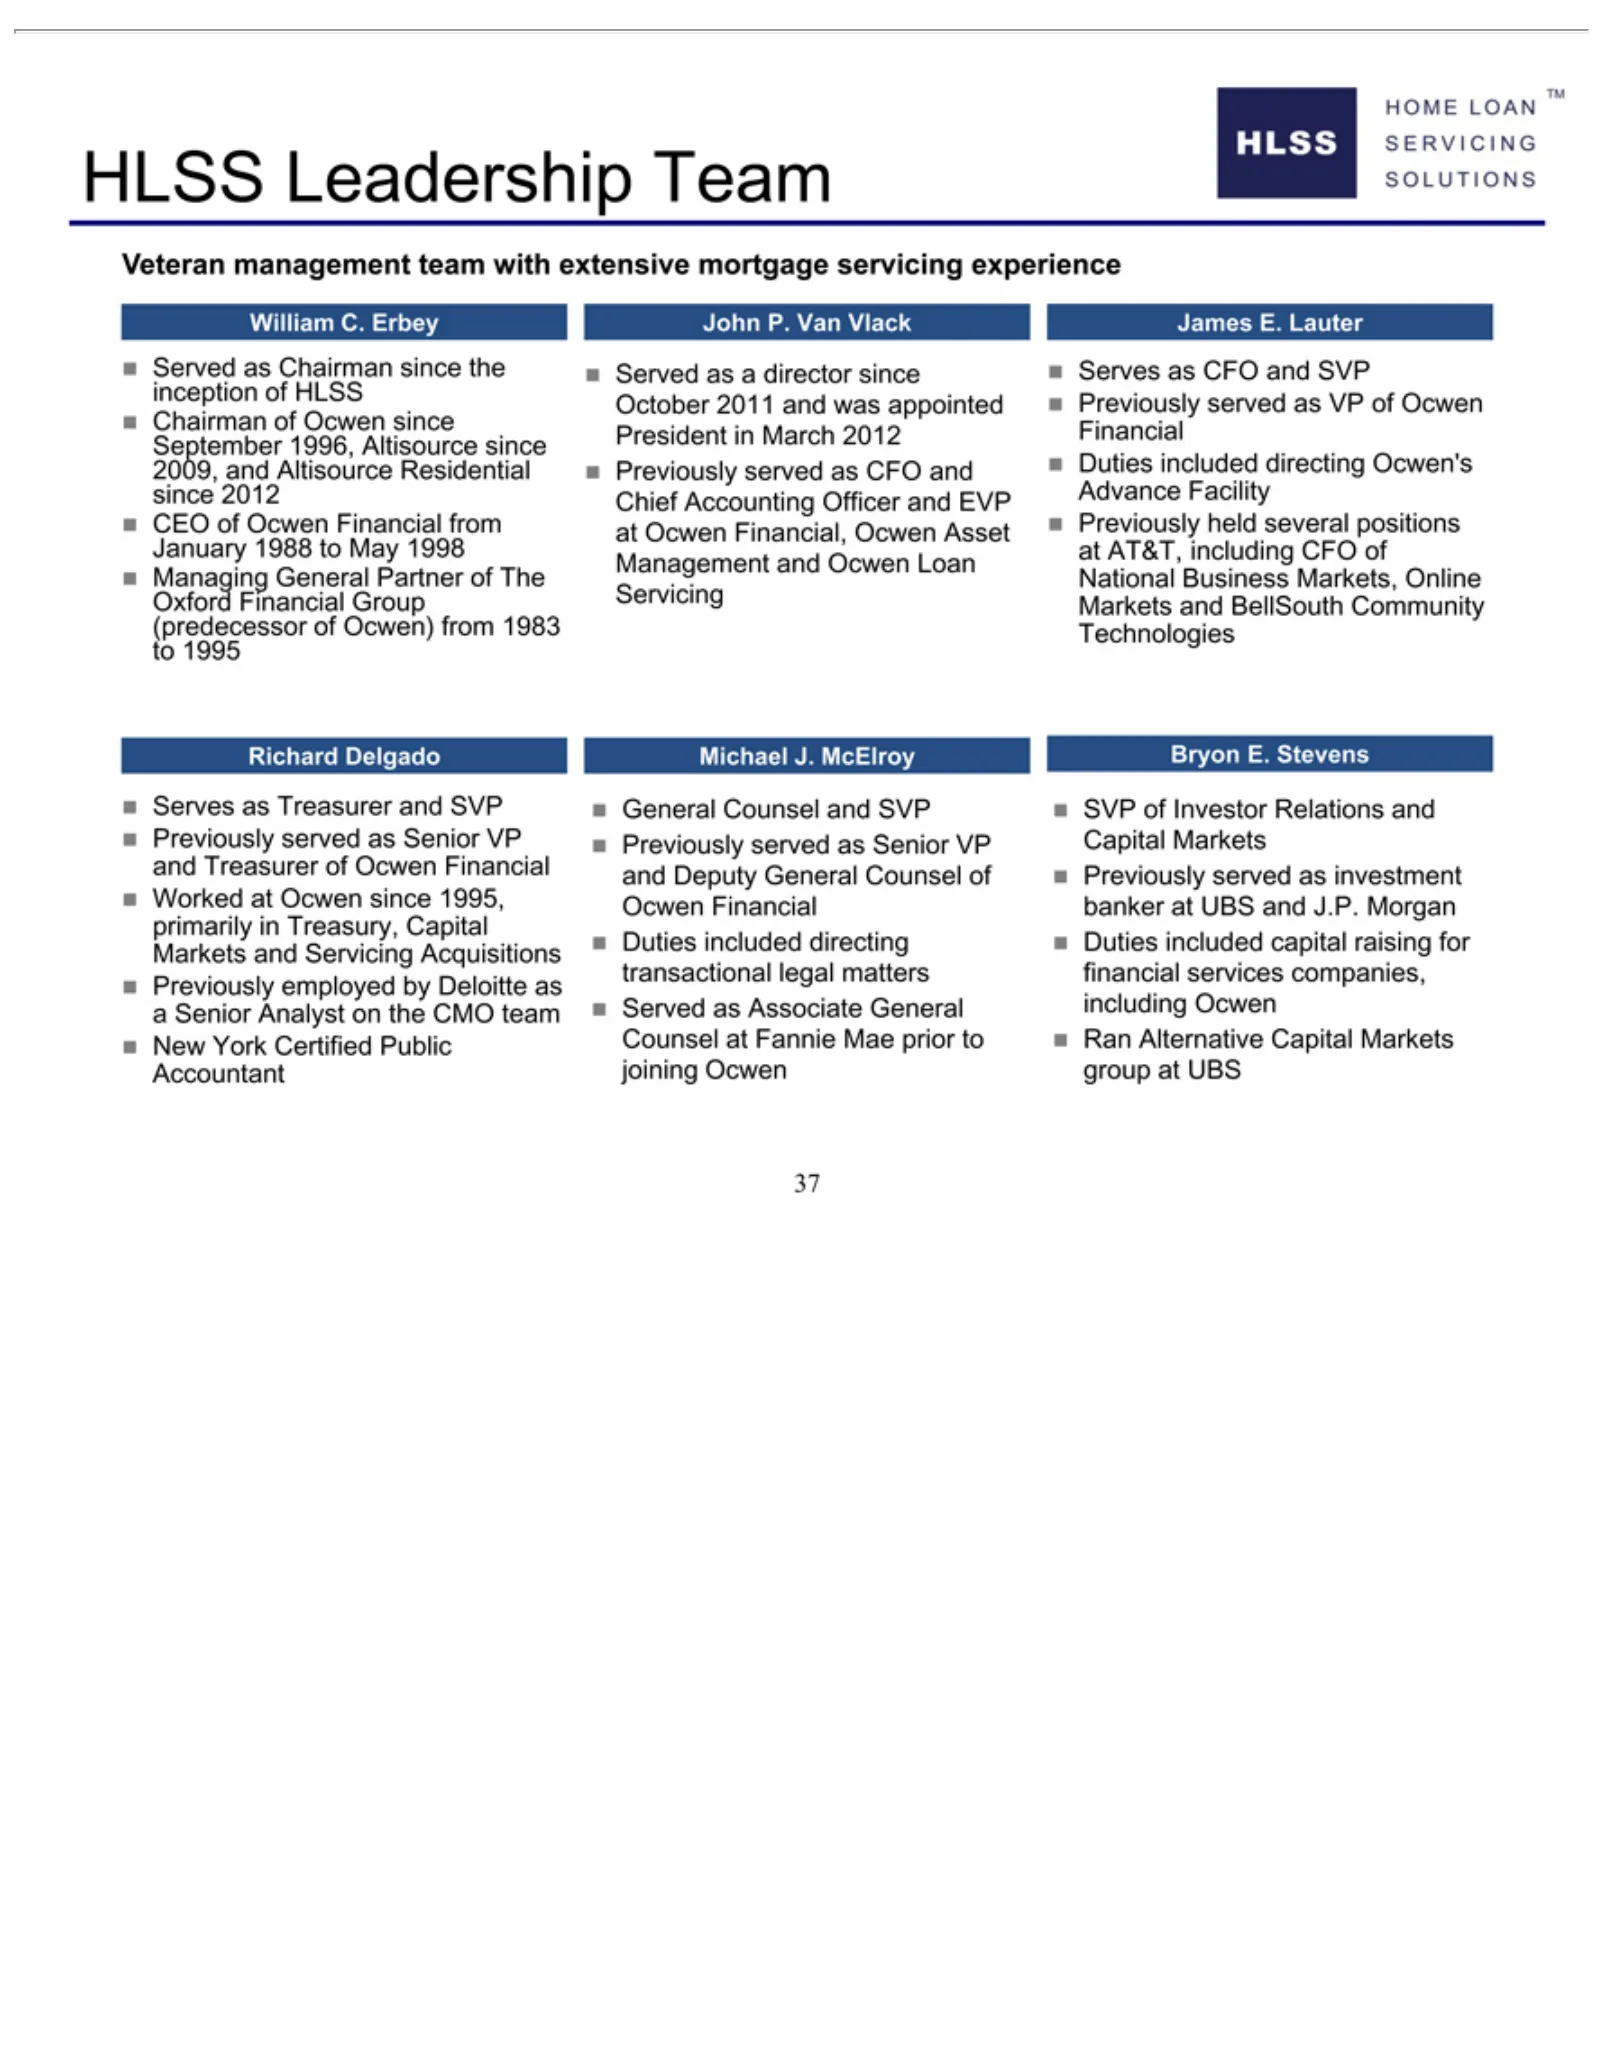
Slide 37: HLSS Veteran Leadership Team
HLSS 37 Veteran William inception September 2009, since „January Oxford (predecessor to John Served James Servicing Previously BellSouth Richard Serves Deloitte Michael General prior Bryon SVP Capital Served Chairman CEO Managing 1995 of P. to 2012 and E. Leadership as of as Van Investor Financial M
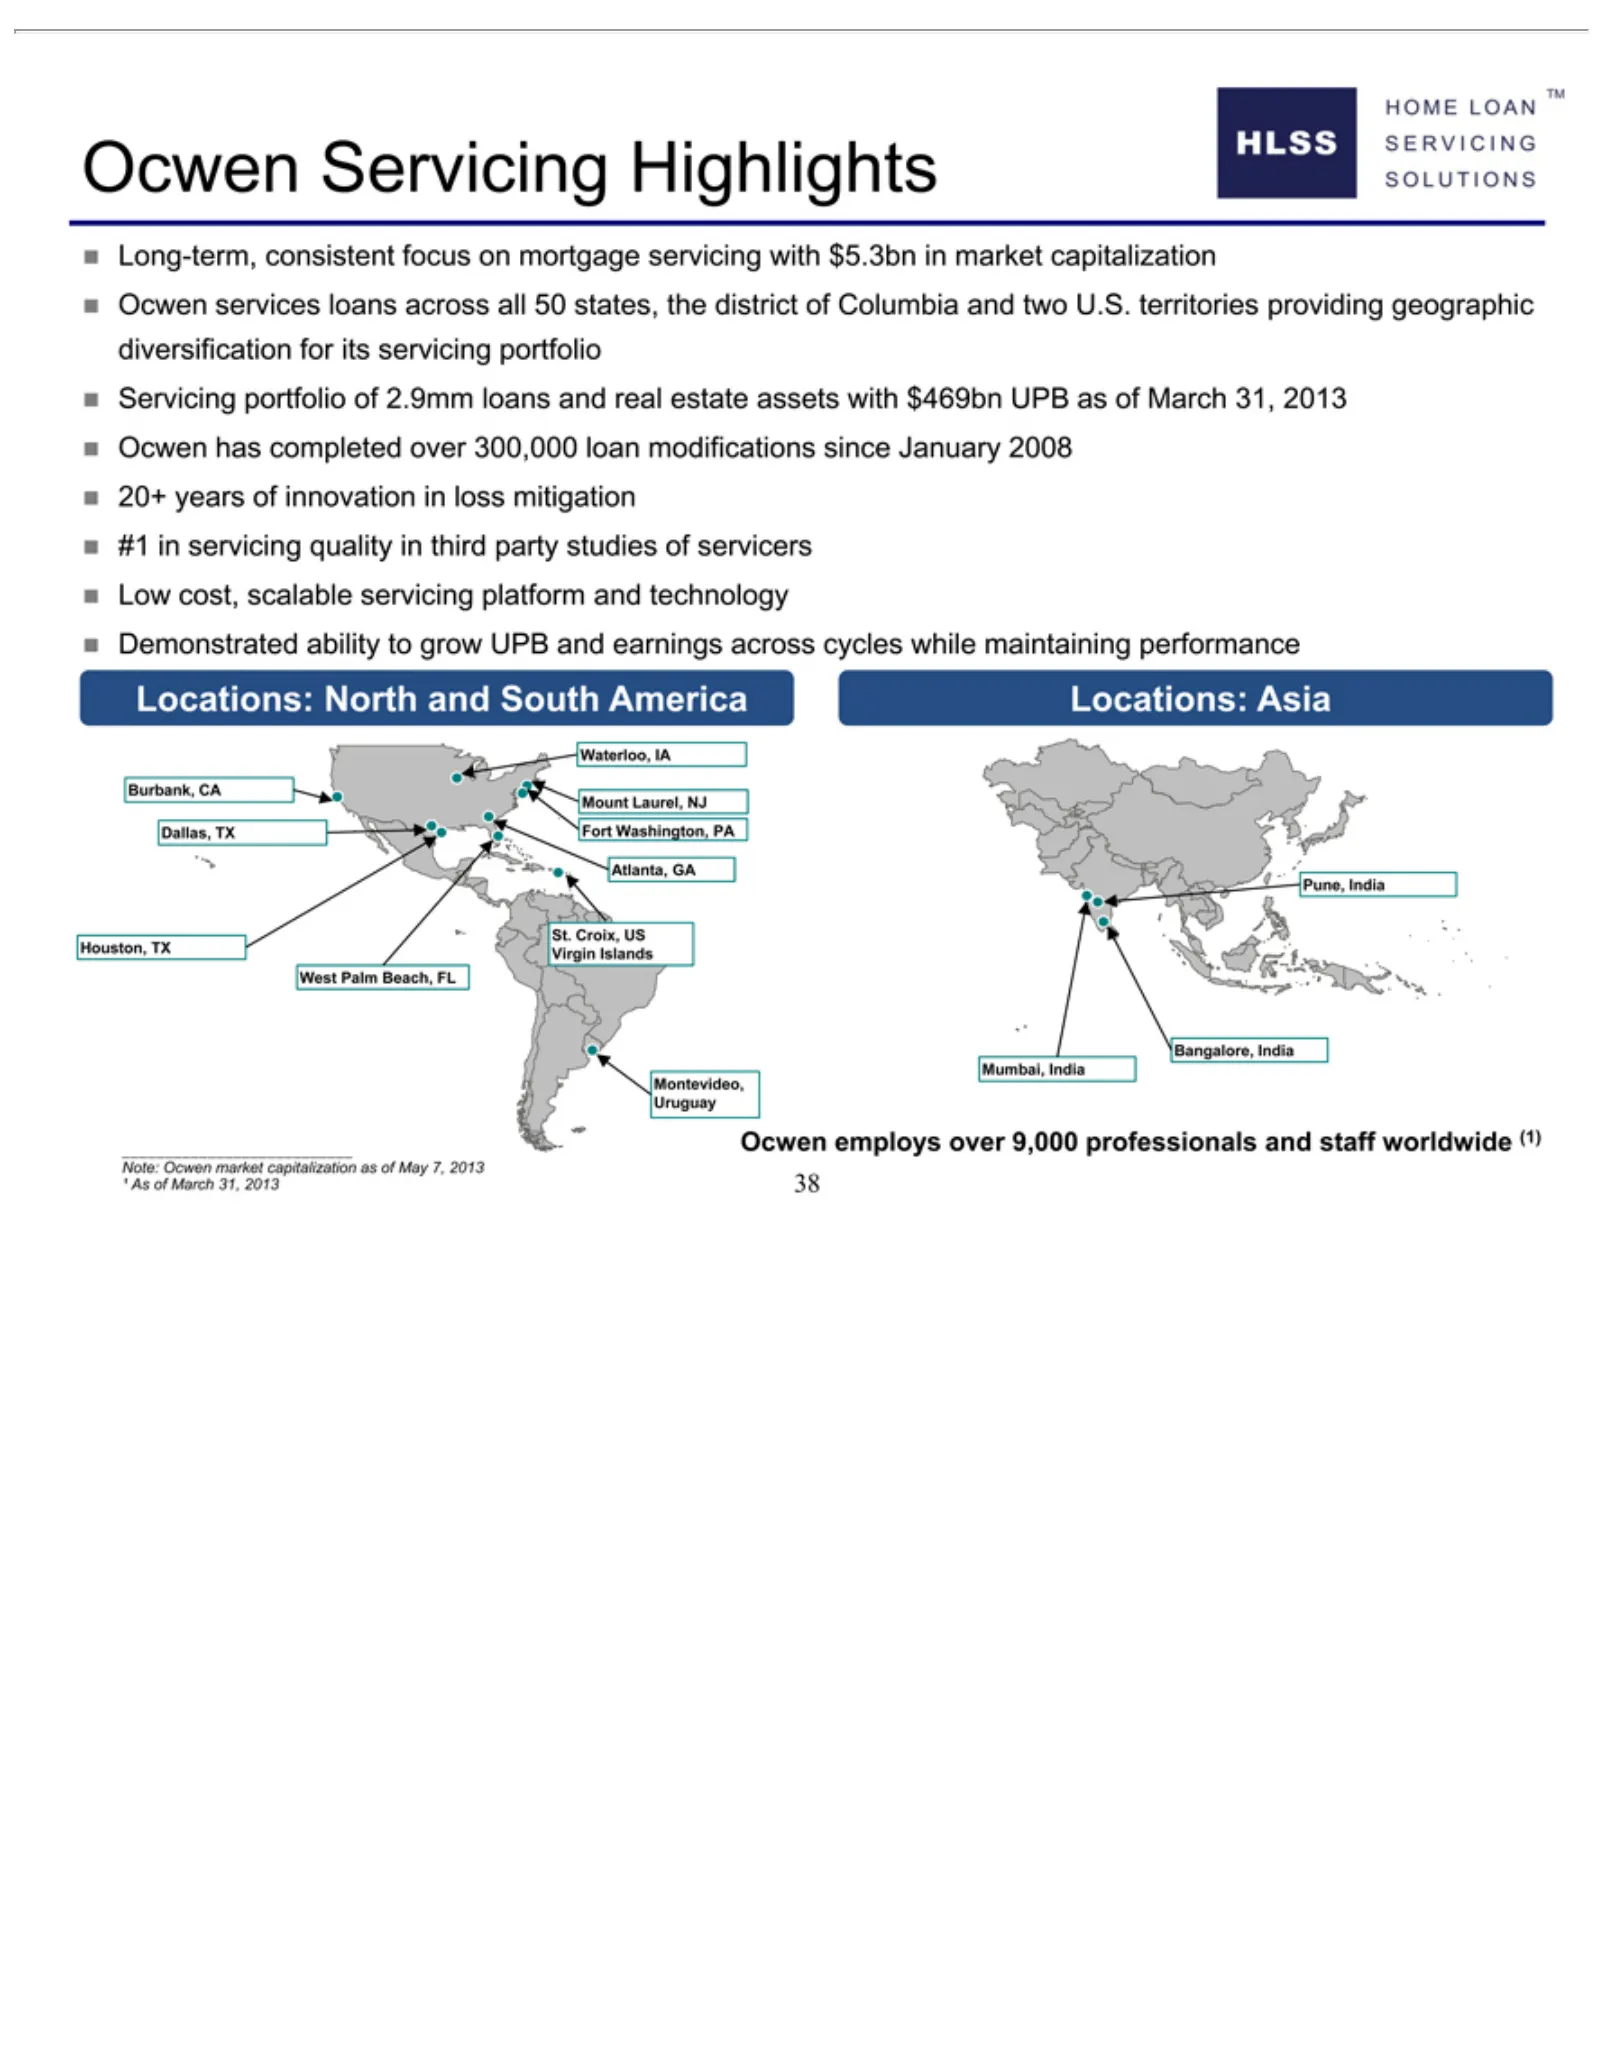
Slide 38: Ocwen Servicing Highlights
„diversification Locations: Waterloo, Burbank, Dallas, Atlanta, Pune, St. Houston, Virgin West Bangalore, Mumbai, Ocwen Uruguay Montevideo, ¹Note: As Long-term, Servicing Ocwen 20+ #1 Low Demonstrated Croix, of inPalm Ocwen India years cost, Islands March servicing TX Servicing employs GA services h
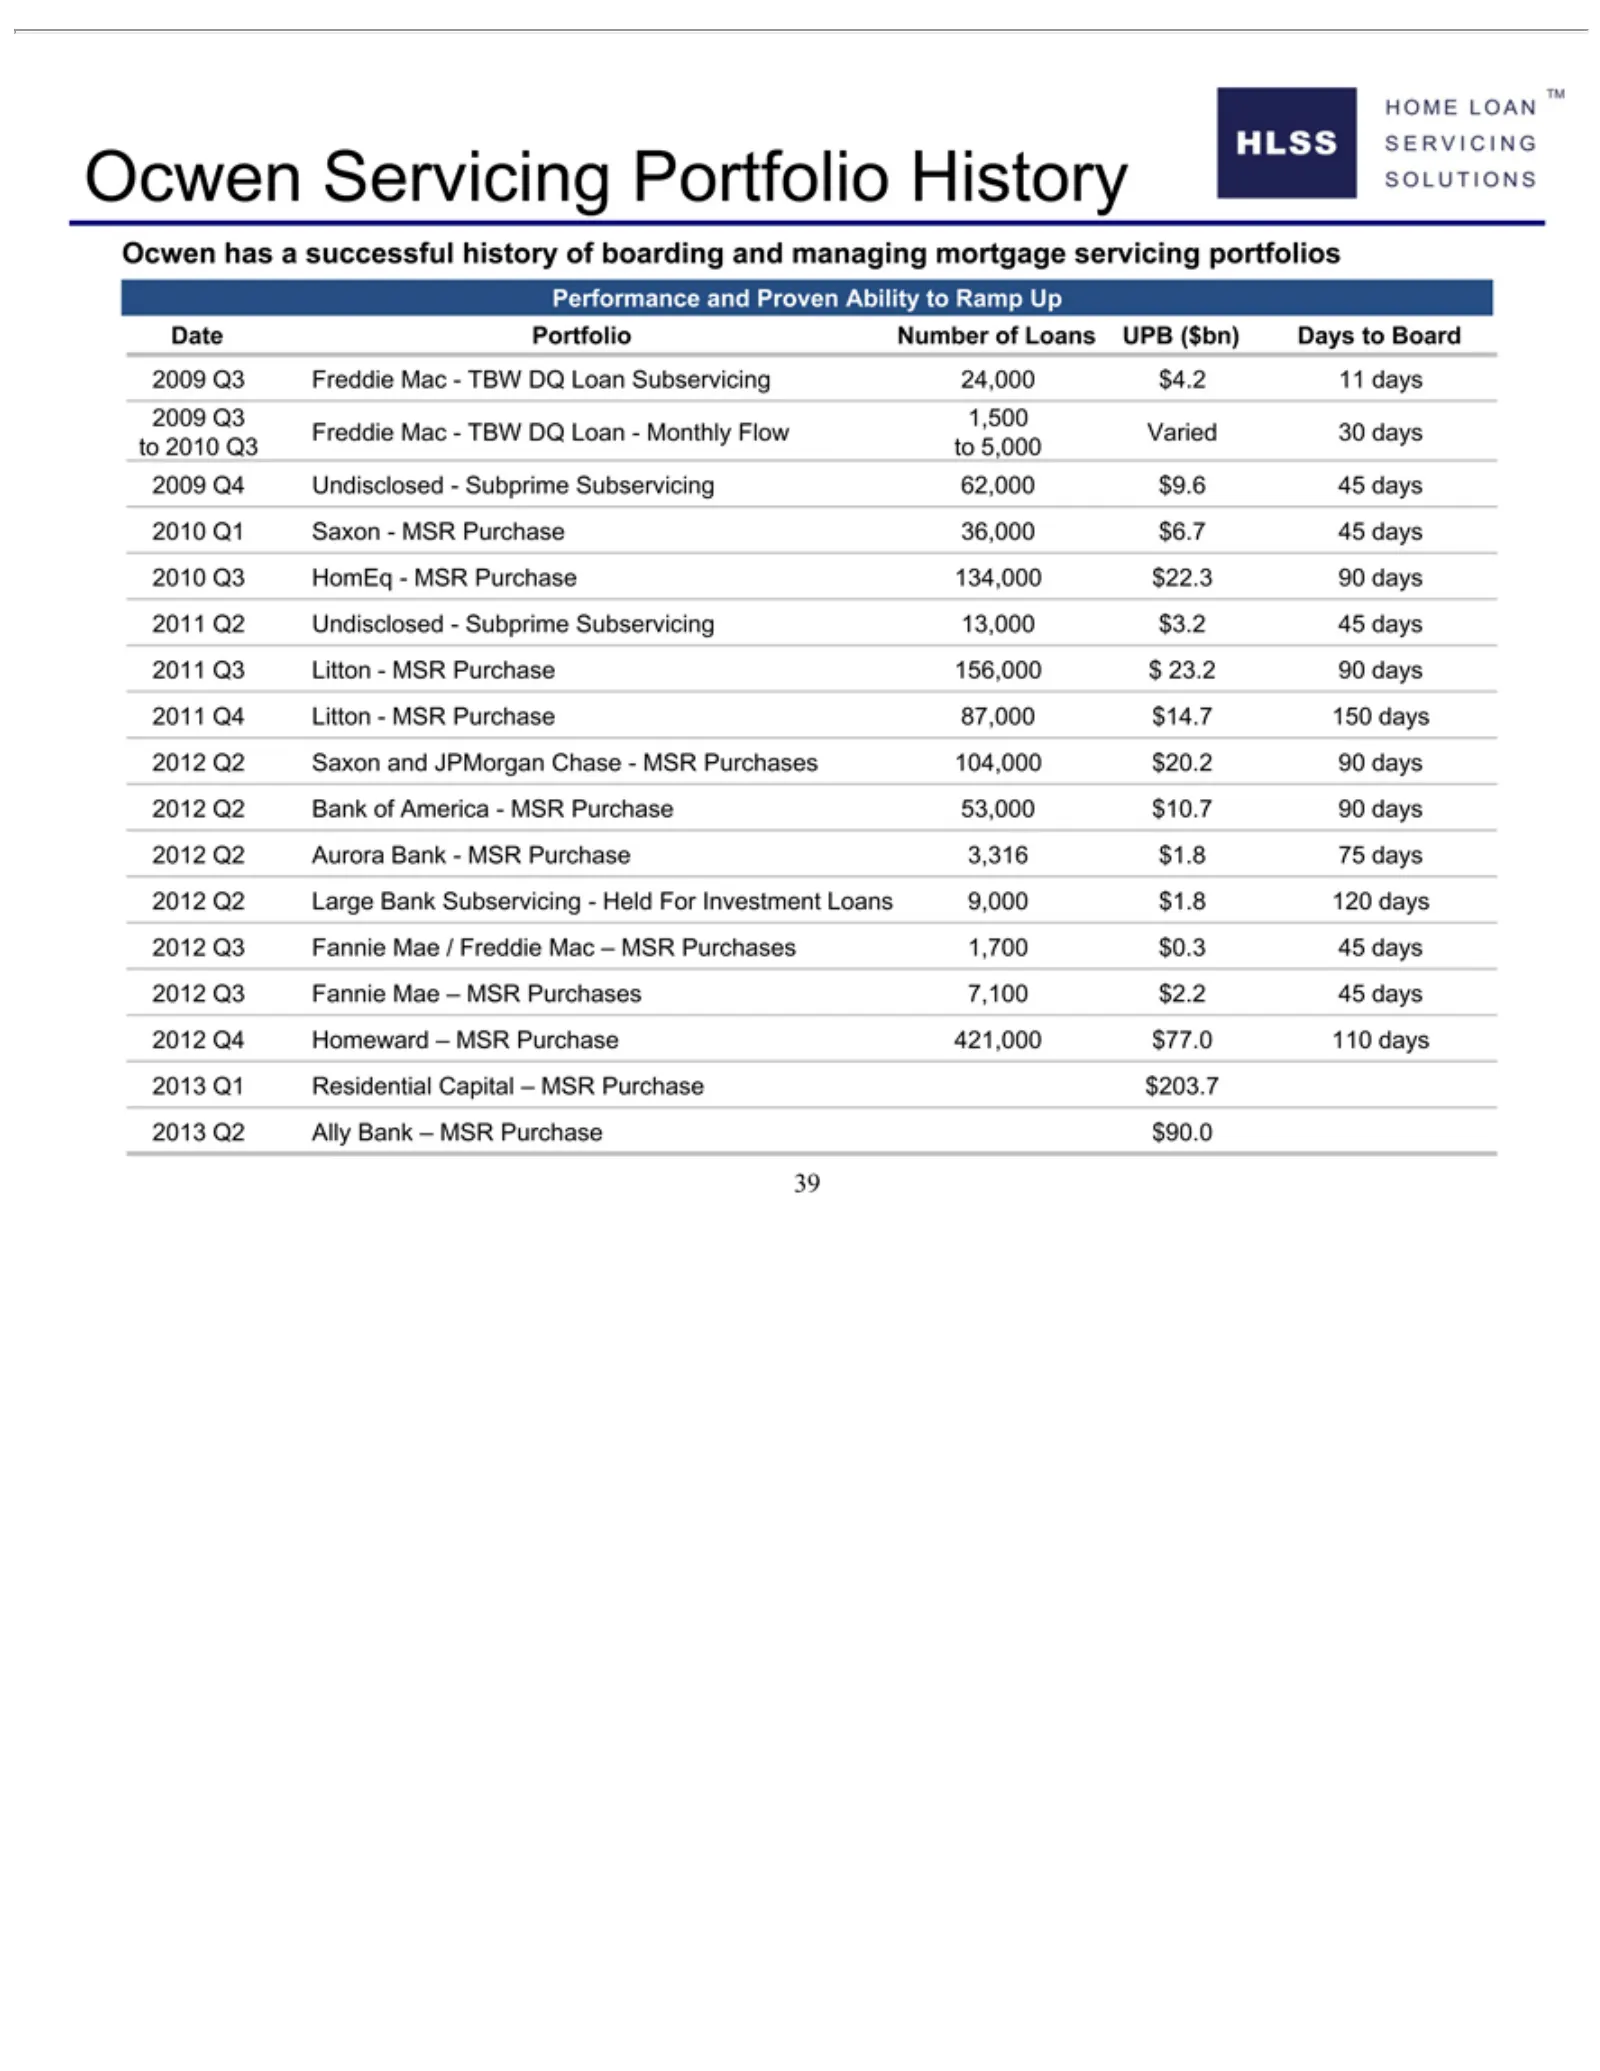
Slide 39: Ocwen Proven Performance and Portfolio History
Ocwen Performance Date Freddie to 2009 2010 2011 2012 2013 39 2010 Portfolio Q2 Q3 Q4 Q1has Servicing Q3 Mac—TBW Aurora Ally Undisclosed—Subprime Litton—MSR Freddie 1,500 Saxon—MSR HomEq—MSR Saxon Bank Large Fannie Homeward Residential atoand successful Bank 5,000 Number of Bank and Mae Bank—MSR Mac
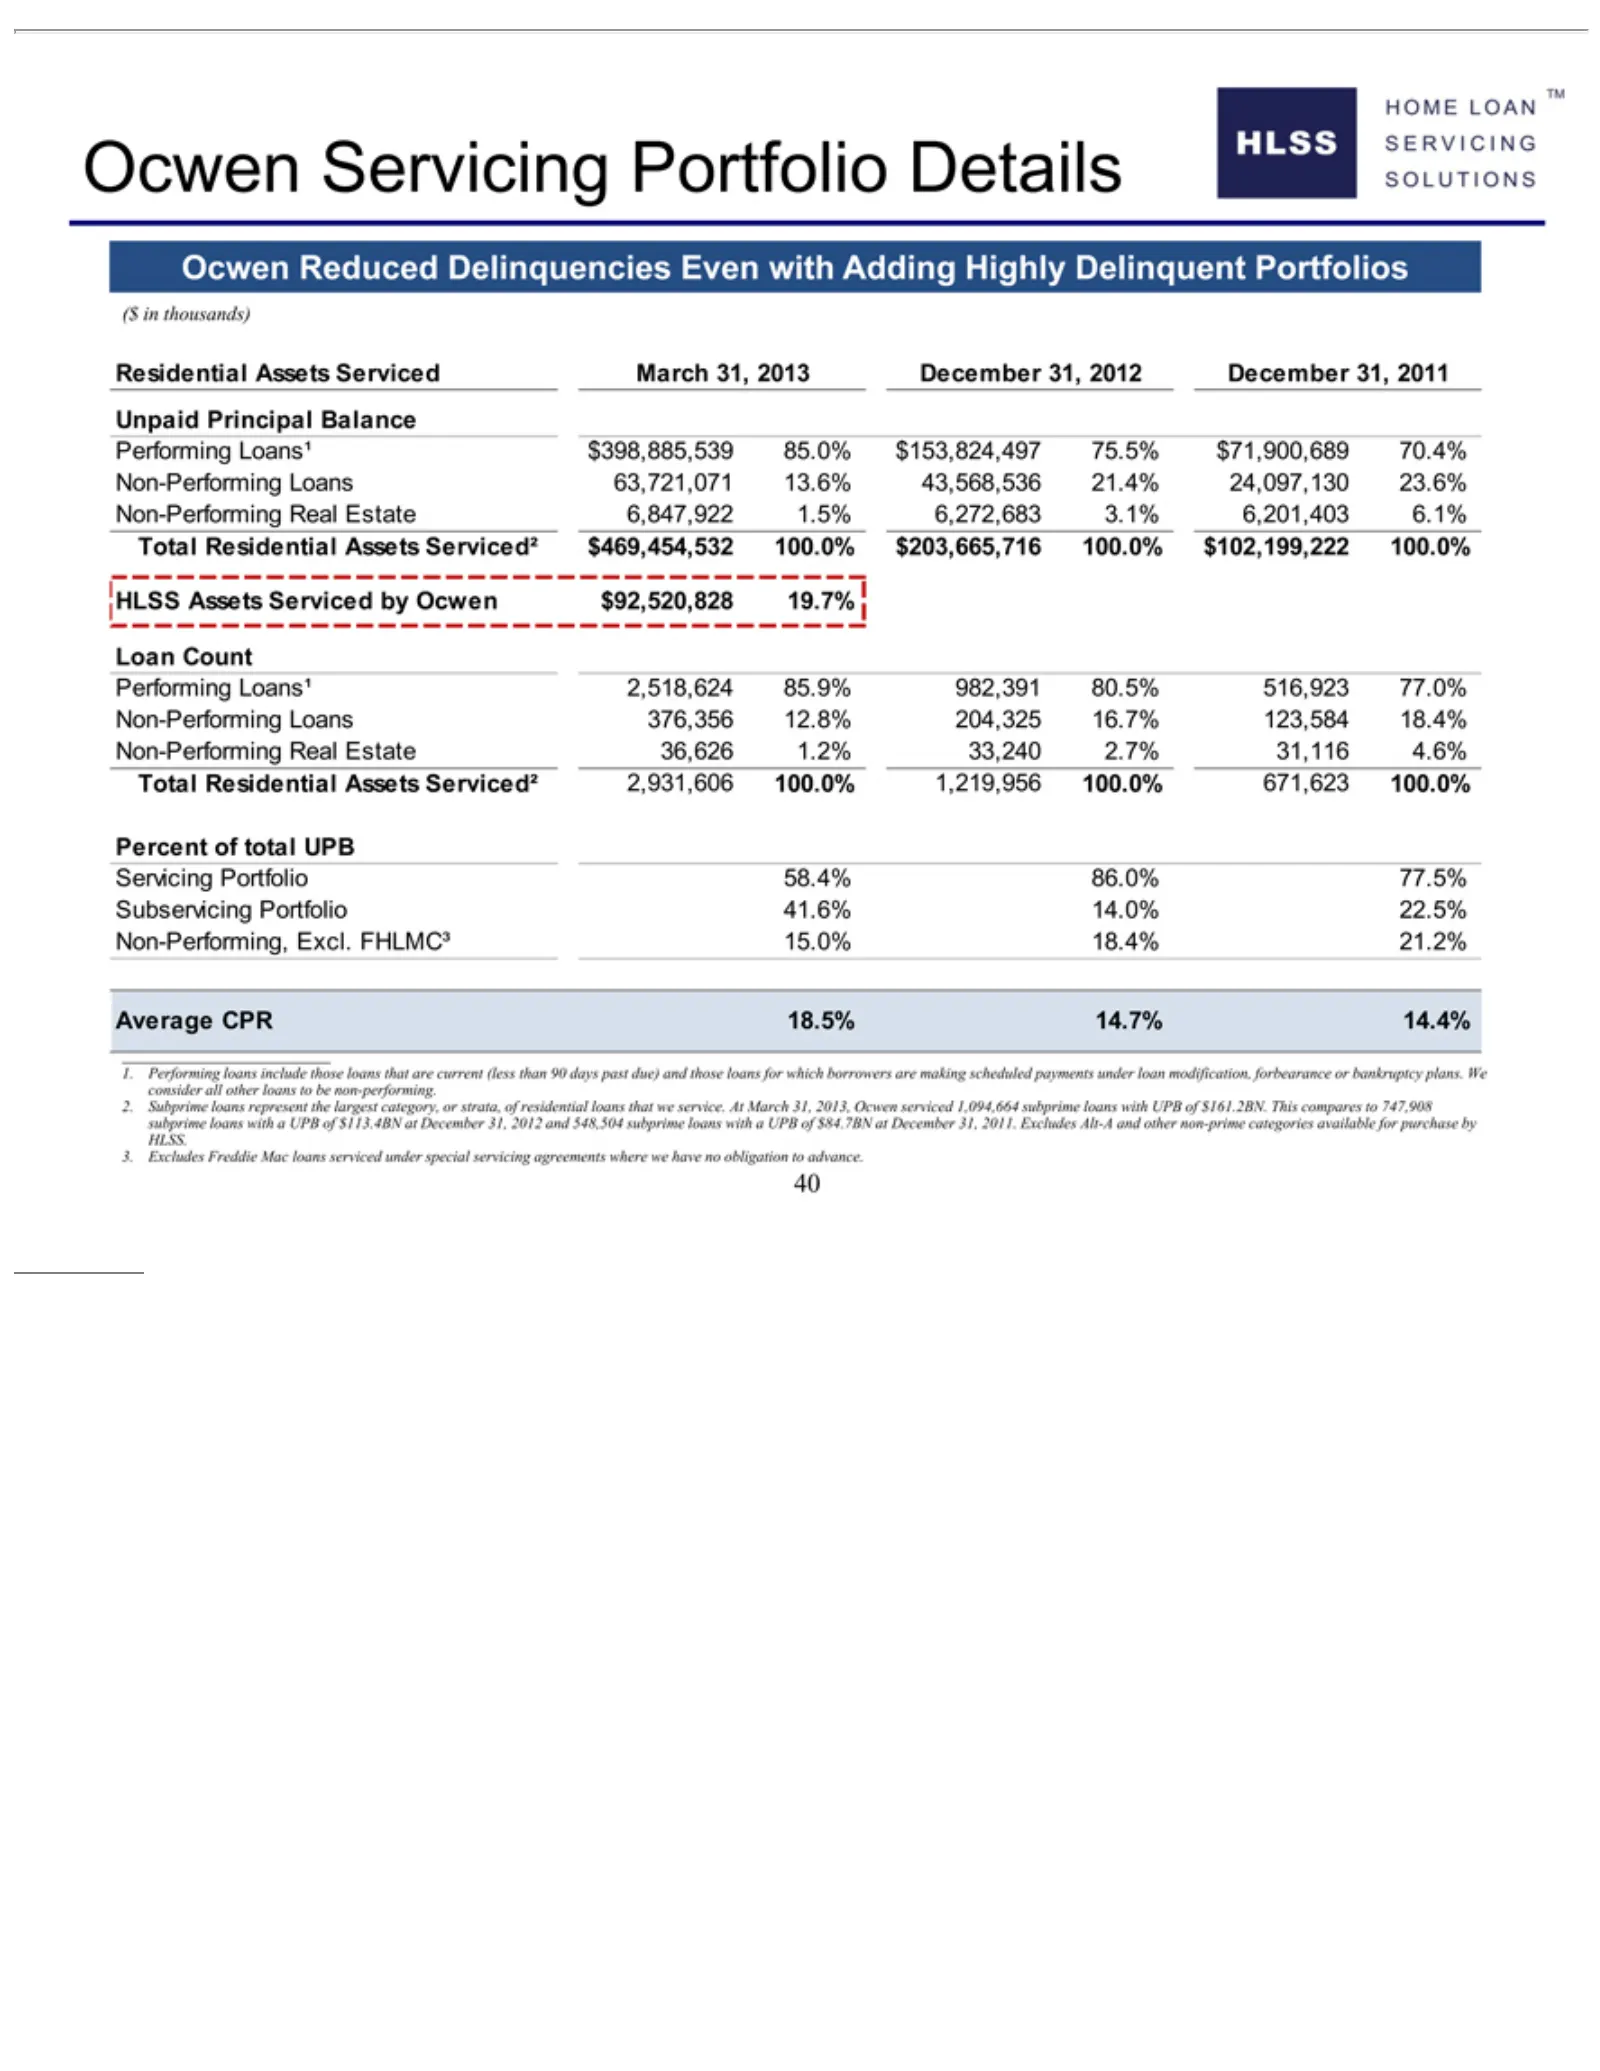
Slide 40: Ocwen Residential Servicing Portfolio Details
Ocwen ($ Residential Unpaid HLSS Loan Performing Non-Performing Total Percent Servicing Subservicing Non-Performing, Average in thousands) Residential Count Assets Servicing Reduced Principal of CPR Portfolio total Assets Loans¹ Portfolio Serviced 18.5% UPB Delinquencies Loans Real Assets Balance Ex
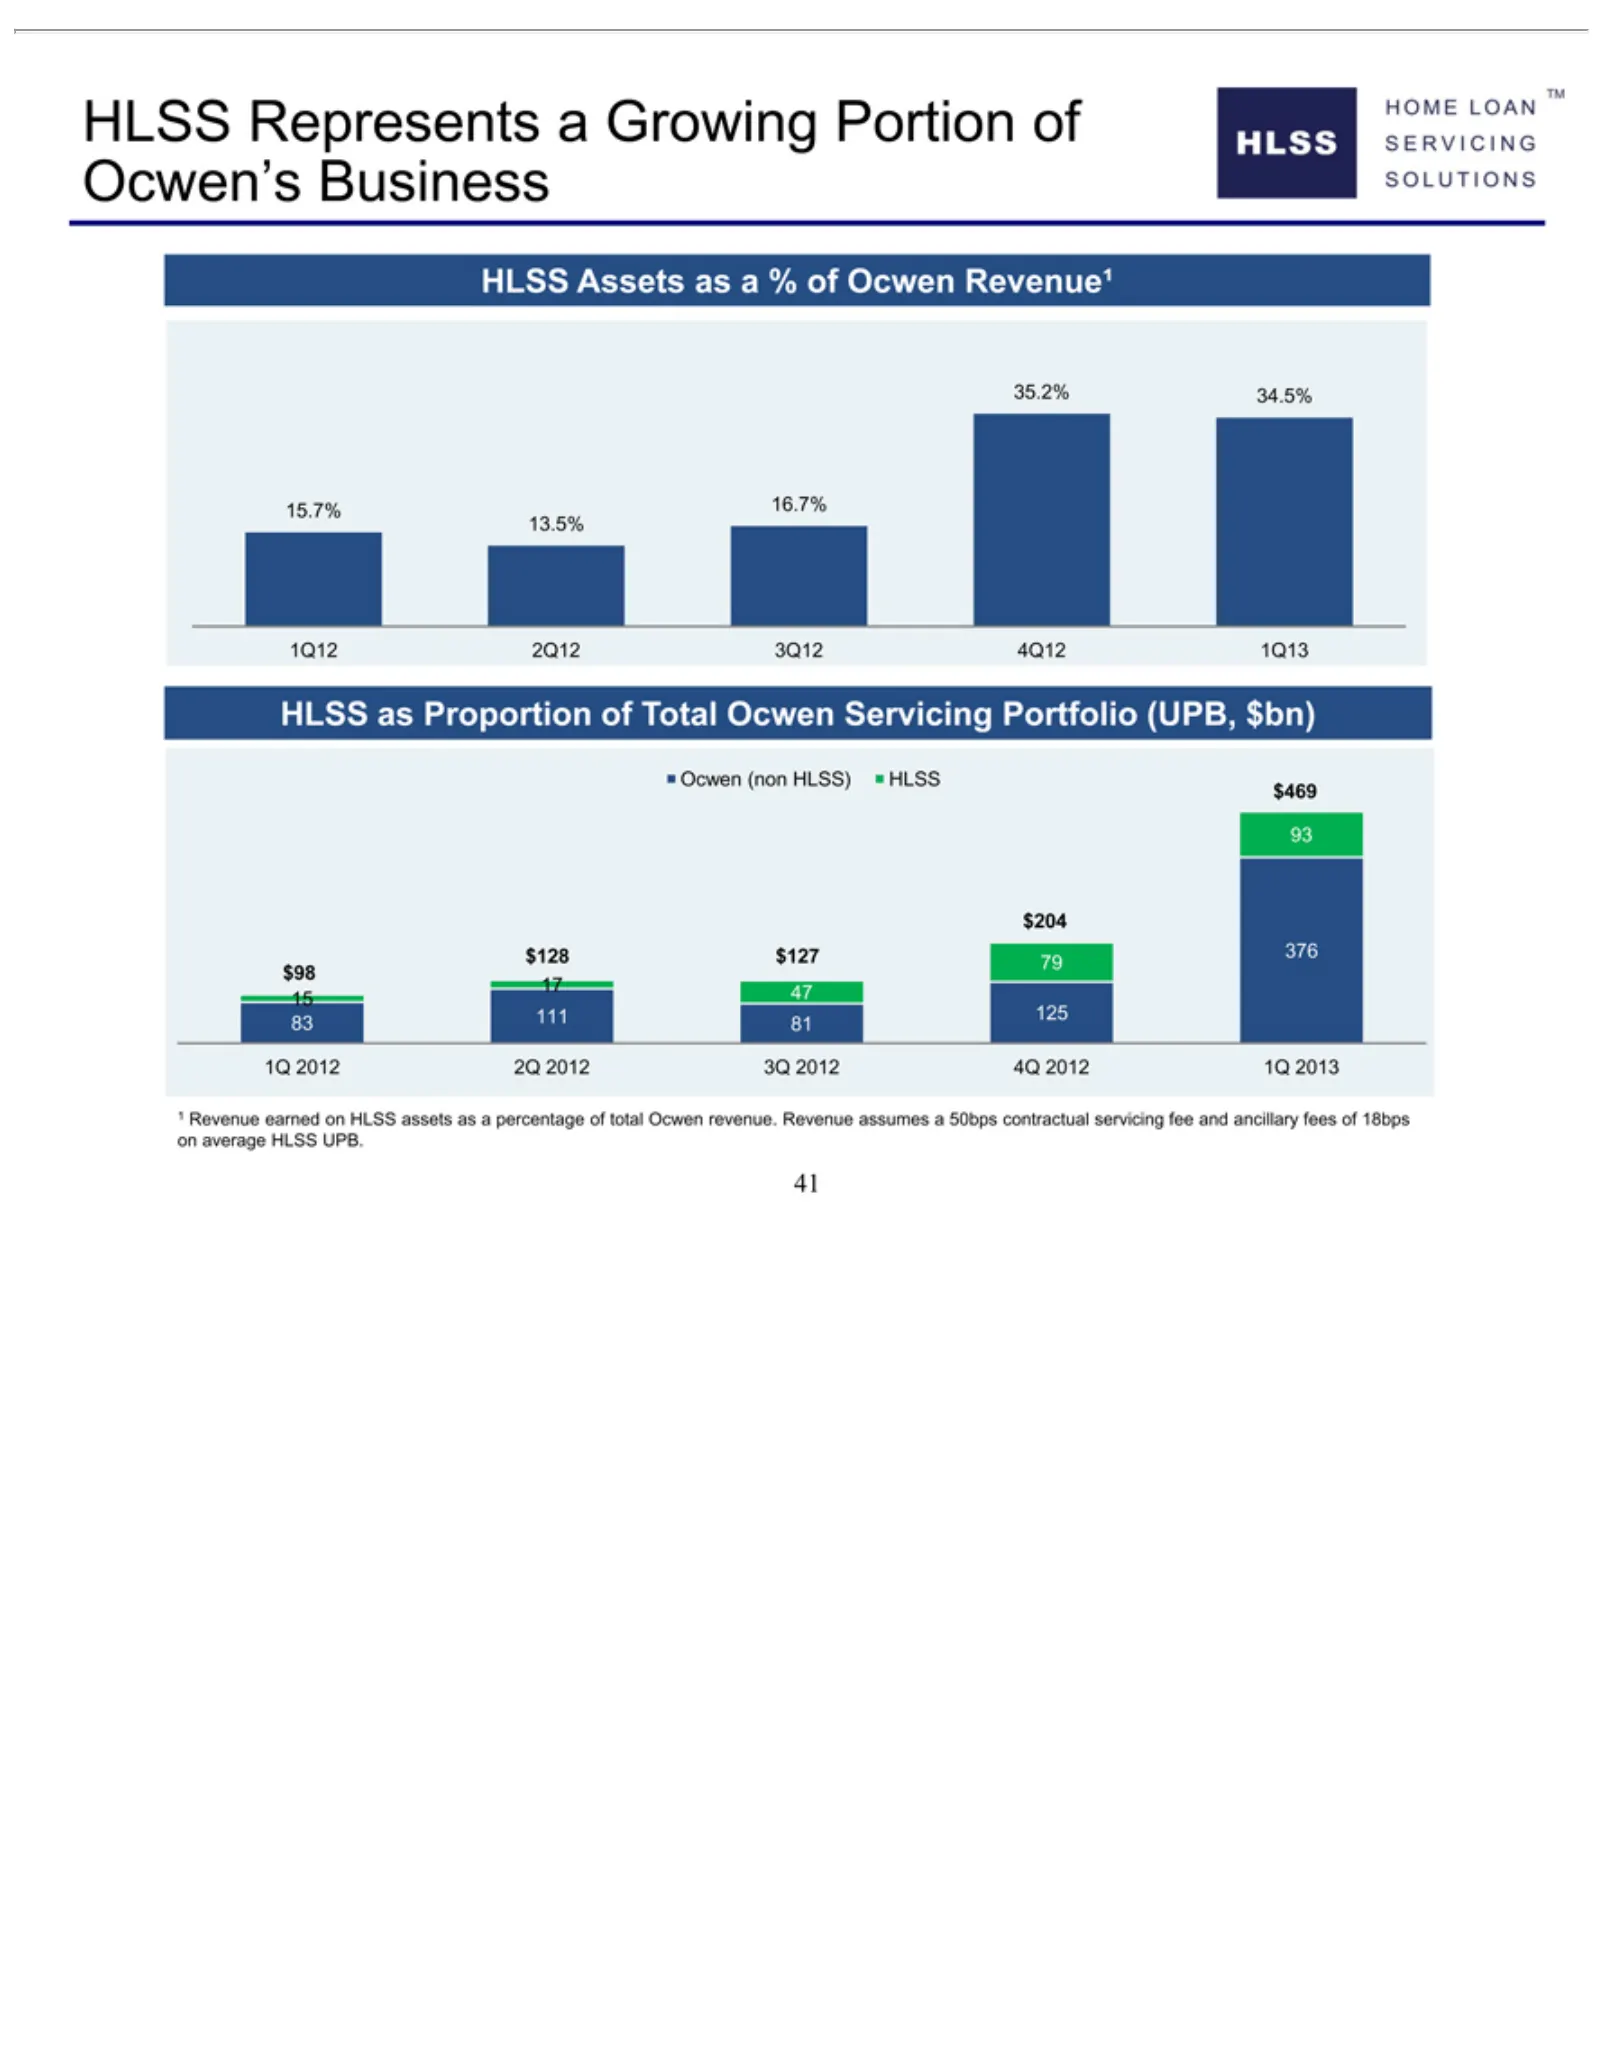
Slide 41: HLSS Assets as Portion of Ocwen Servicing Business
35.2% 15.7% 1Q12 13.5% HLSS Ocwen $204 93 15 17 111 83 11Q 41Revenue 47 81 2012 125 $128 2Q12 Assets Represents as 34.5% 16.7% (non 2Q Proportion earned $127 3Q12 HLSS) 2012 as a376 % aon 4Q12 3Q Growing HLSS of 79 HLSS 2012 Total Ocwen $98 1Q13 $469 4Q assets Ocwen Portion Revenue¹ 2012asServicing
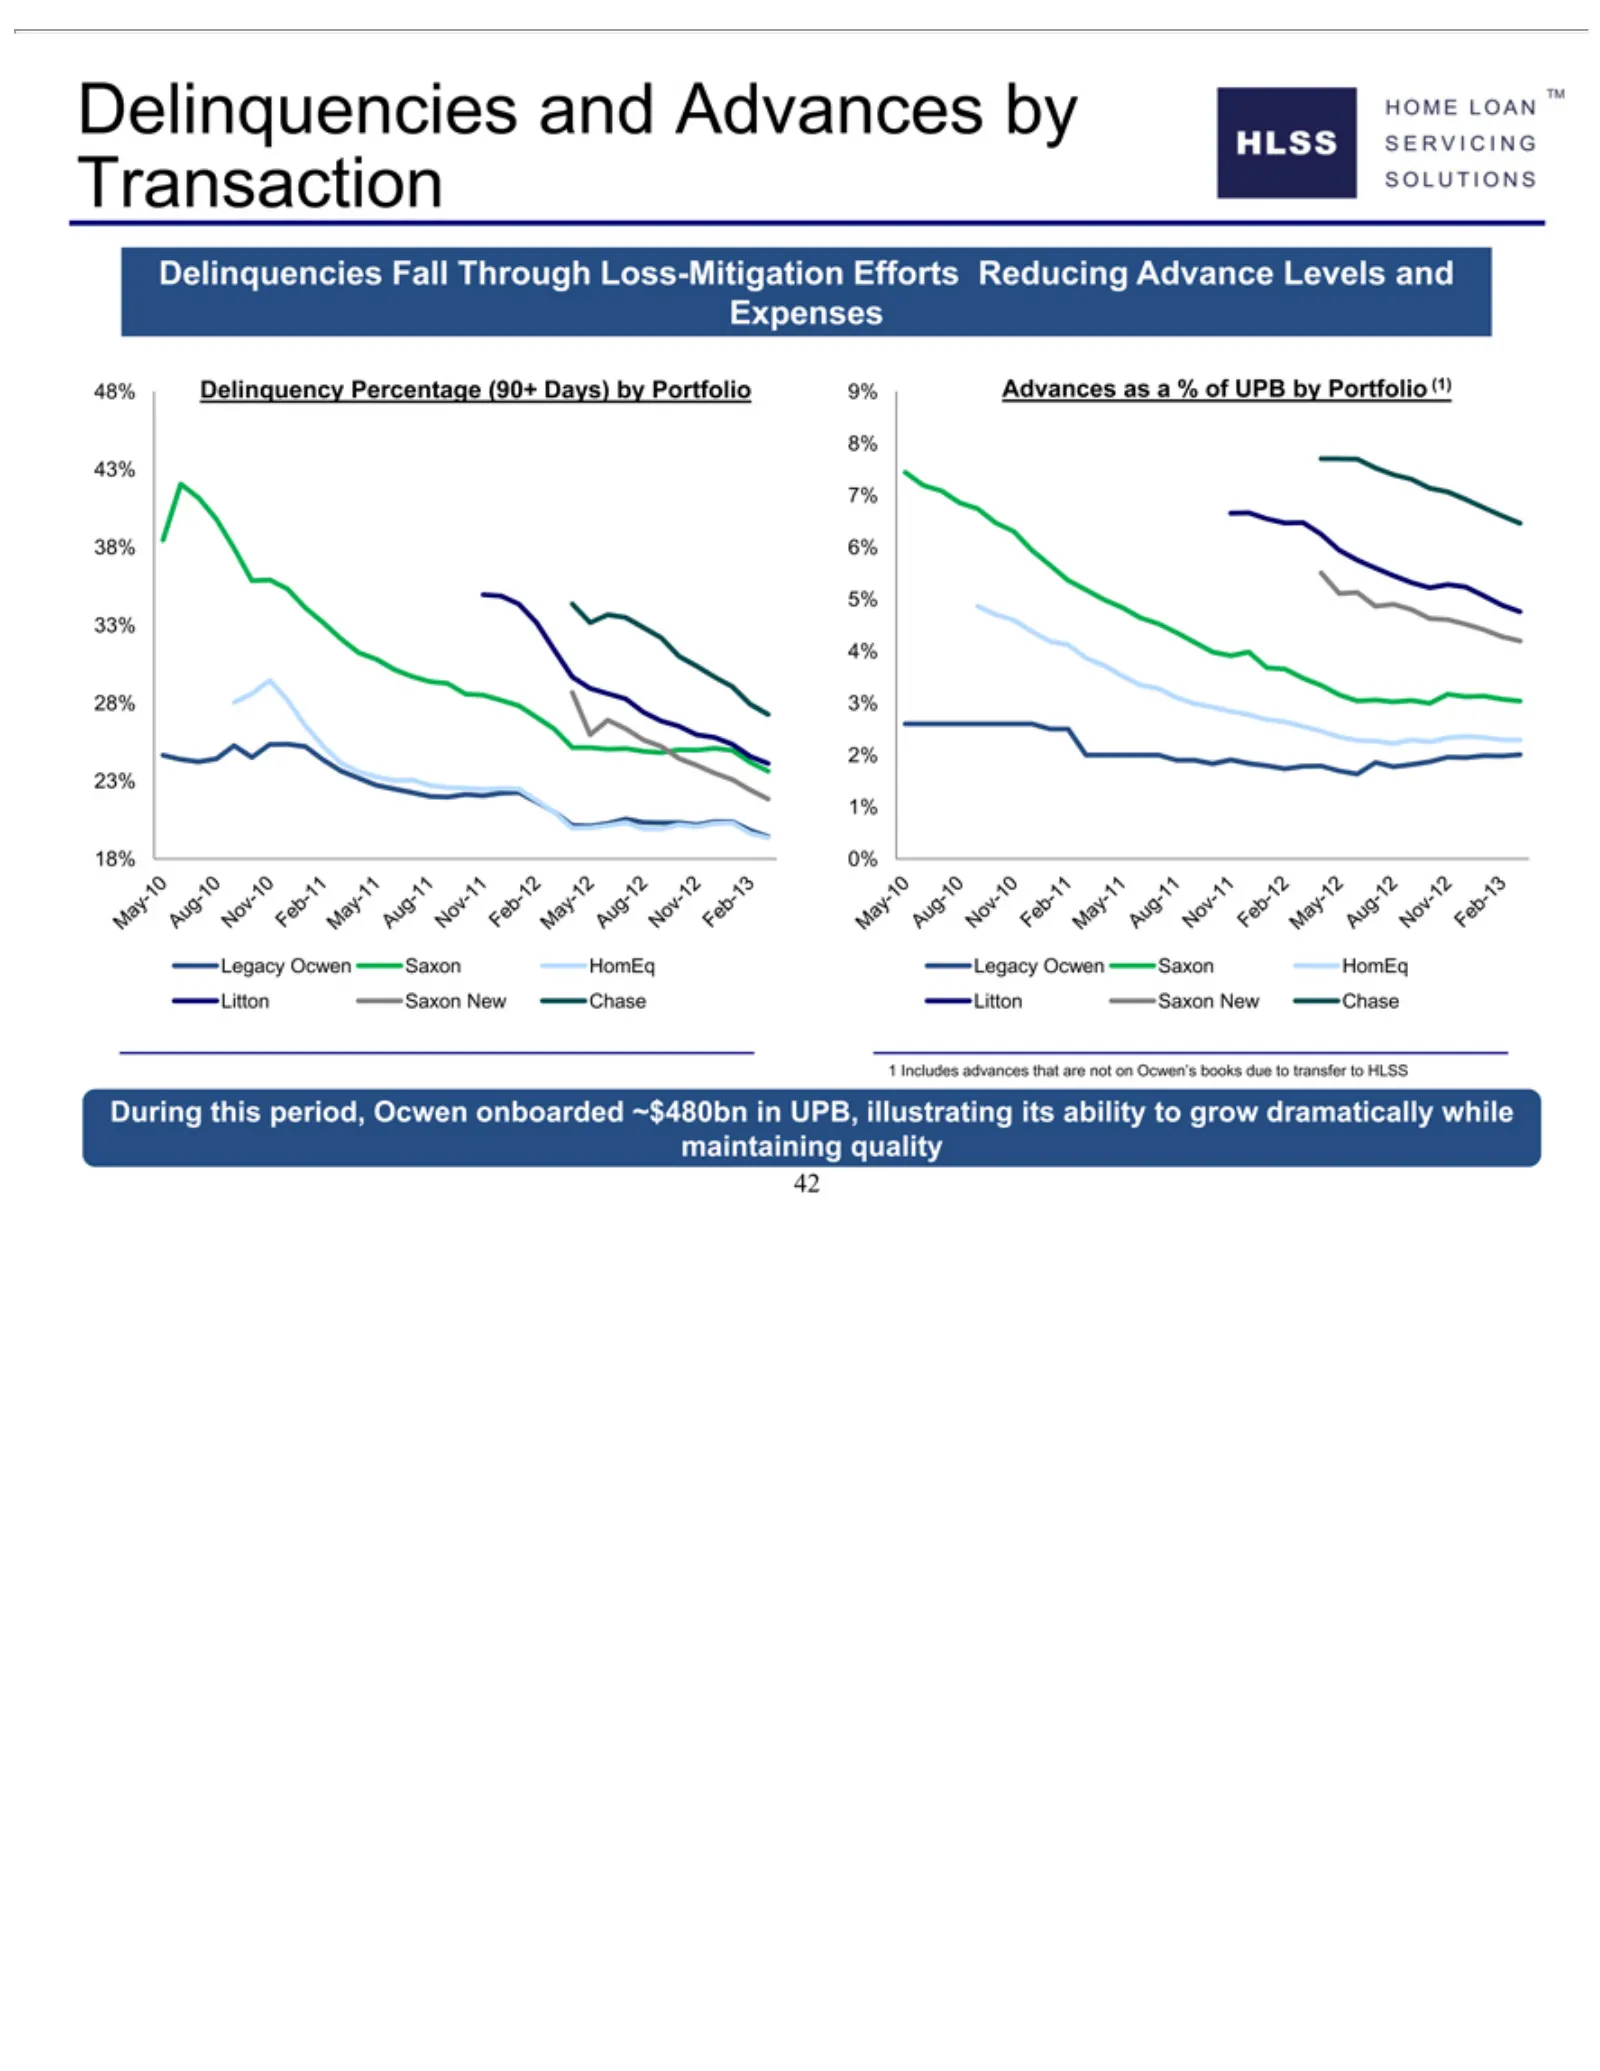
Slide 42: Ocwen Delinquencies Fall Through Loss-Mitigation Efforts
Delinquencies Transaction 48% Expenses 38% 7% 43% 8% 28% 4% 33% 5% 18% 1% 23% 2% Legacy Litton 1Includes During maintaining 42 Delinquency 6% 3% 0%Saxon this Ocwen advances period, quality New and Fall Saxon Percentage Chase Advances Through Ocwen that HomEq are Litton onboarded not Loss-Mitigation
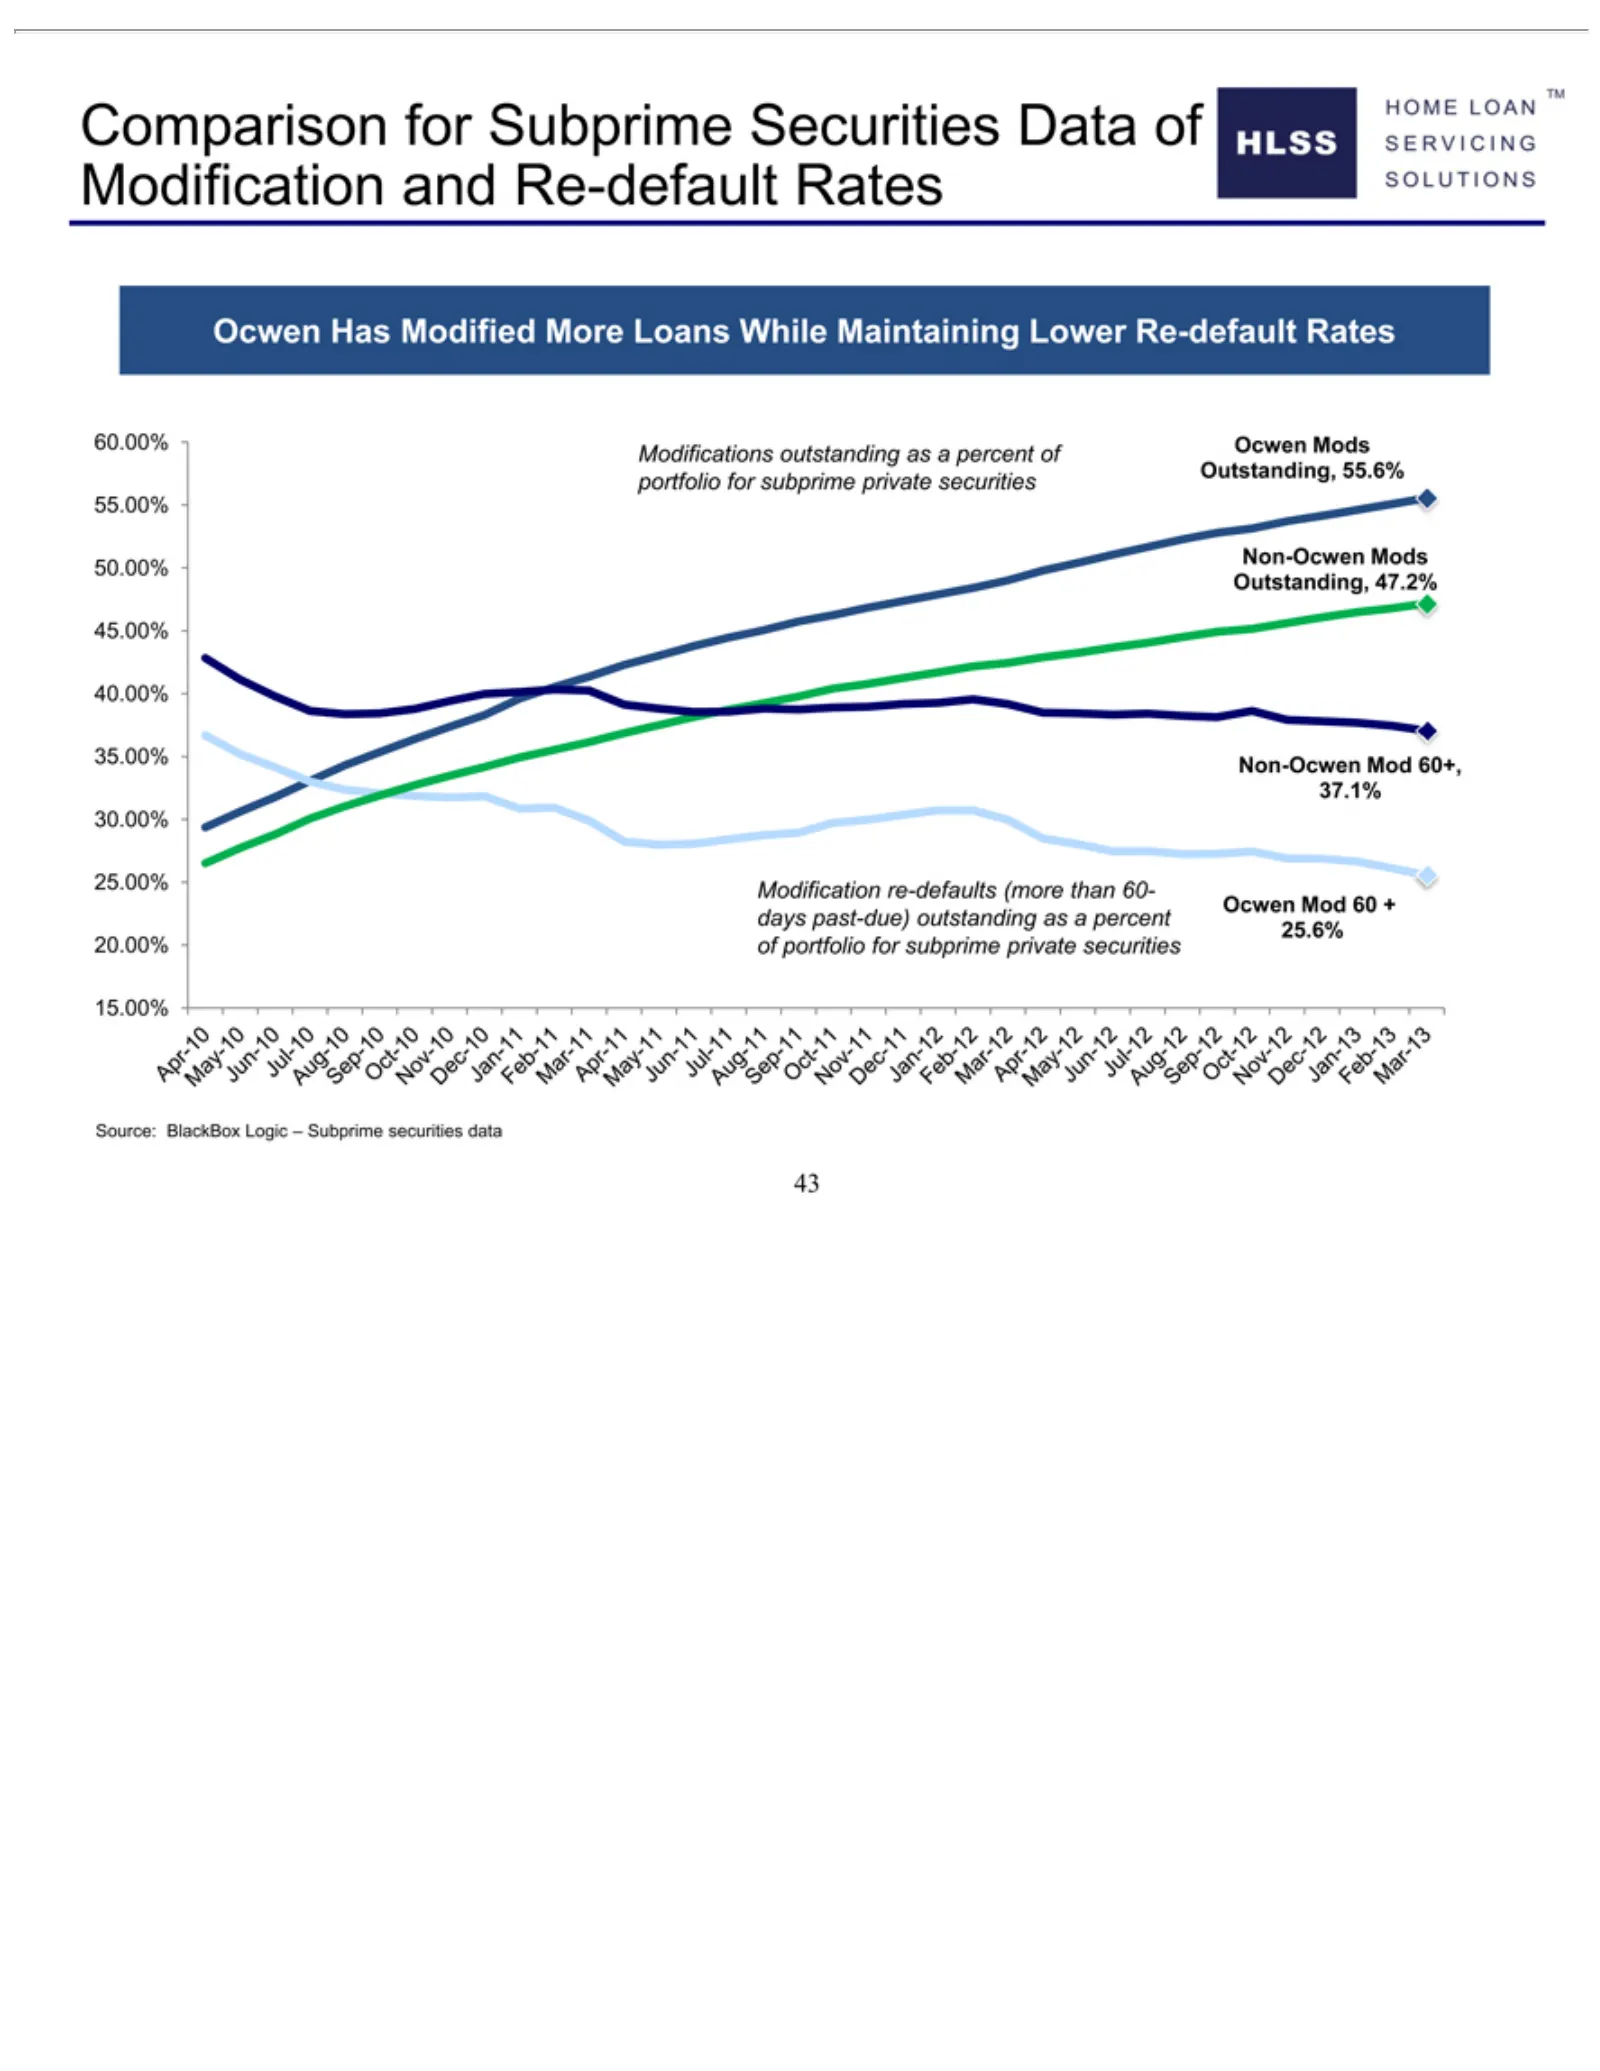
Slide 43: Ocwen Modification Re-default Rate Comparison
Comparison 60.00% Modifications 55.00% Outstanding, 50.00% Non-Ocwen 35.00% 40.00% 45.00% 25.00% 30.00% 37.1% Ocwen 20.00% Source: 15.00% 43 Has Mod BlackBox Ocwen Modification of portfolio Modified Mods Mod for 60 47.2% outstanding Mods +Subprime 60+, days Logic for re-defaults More past-due) subpr
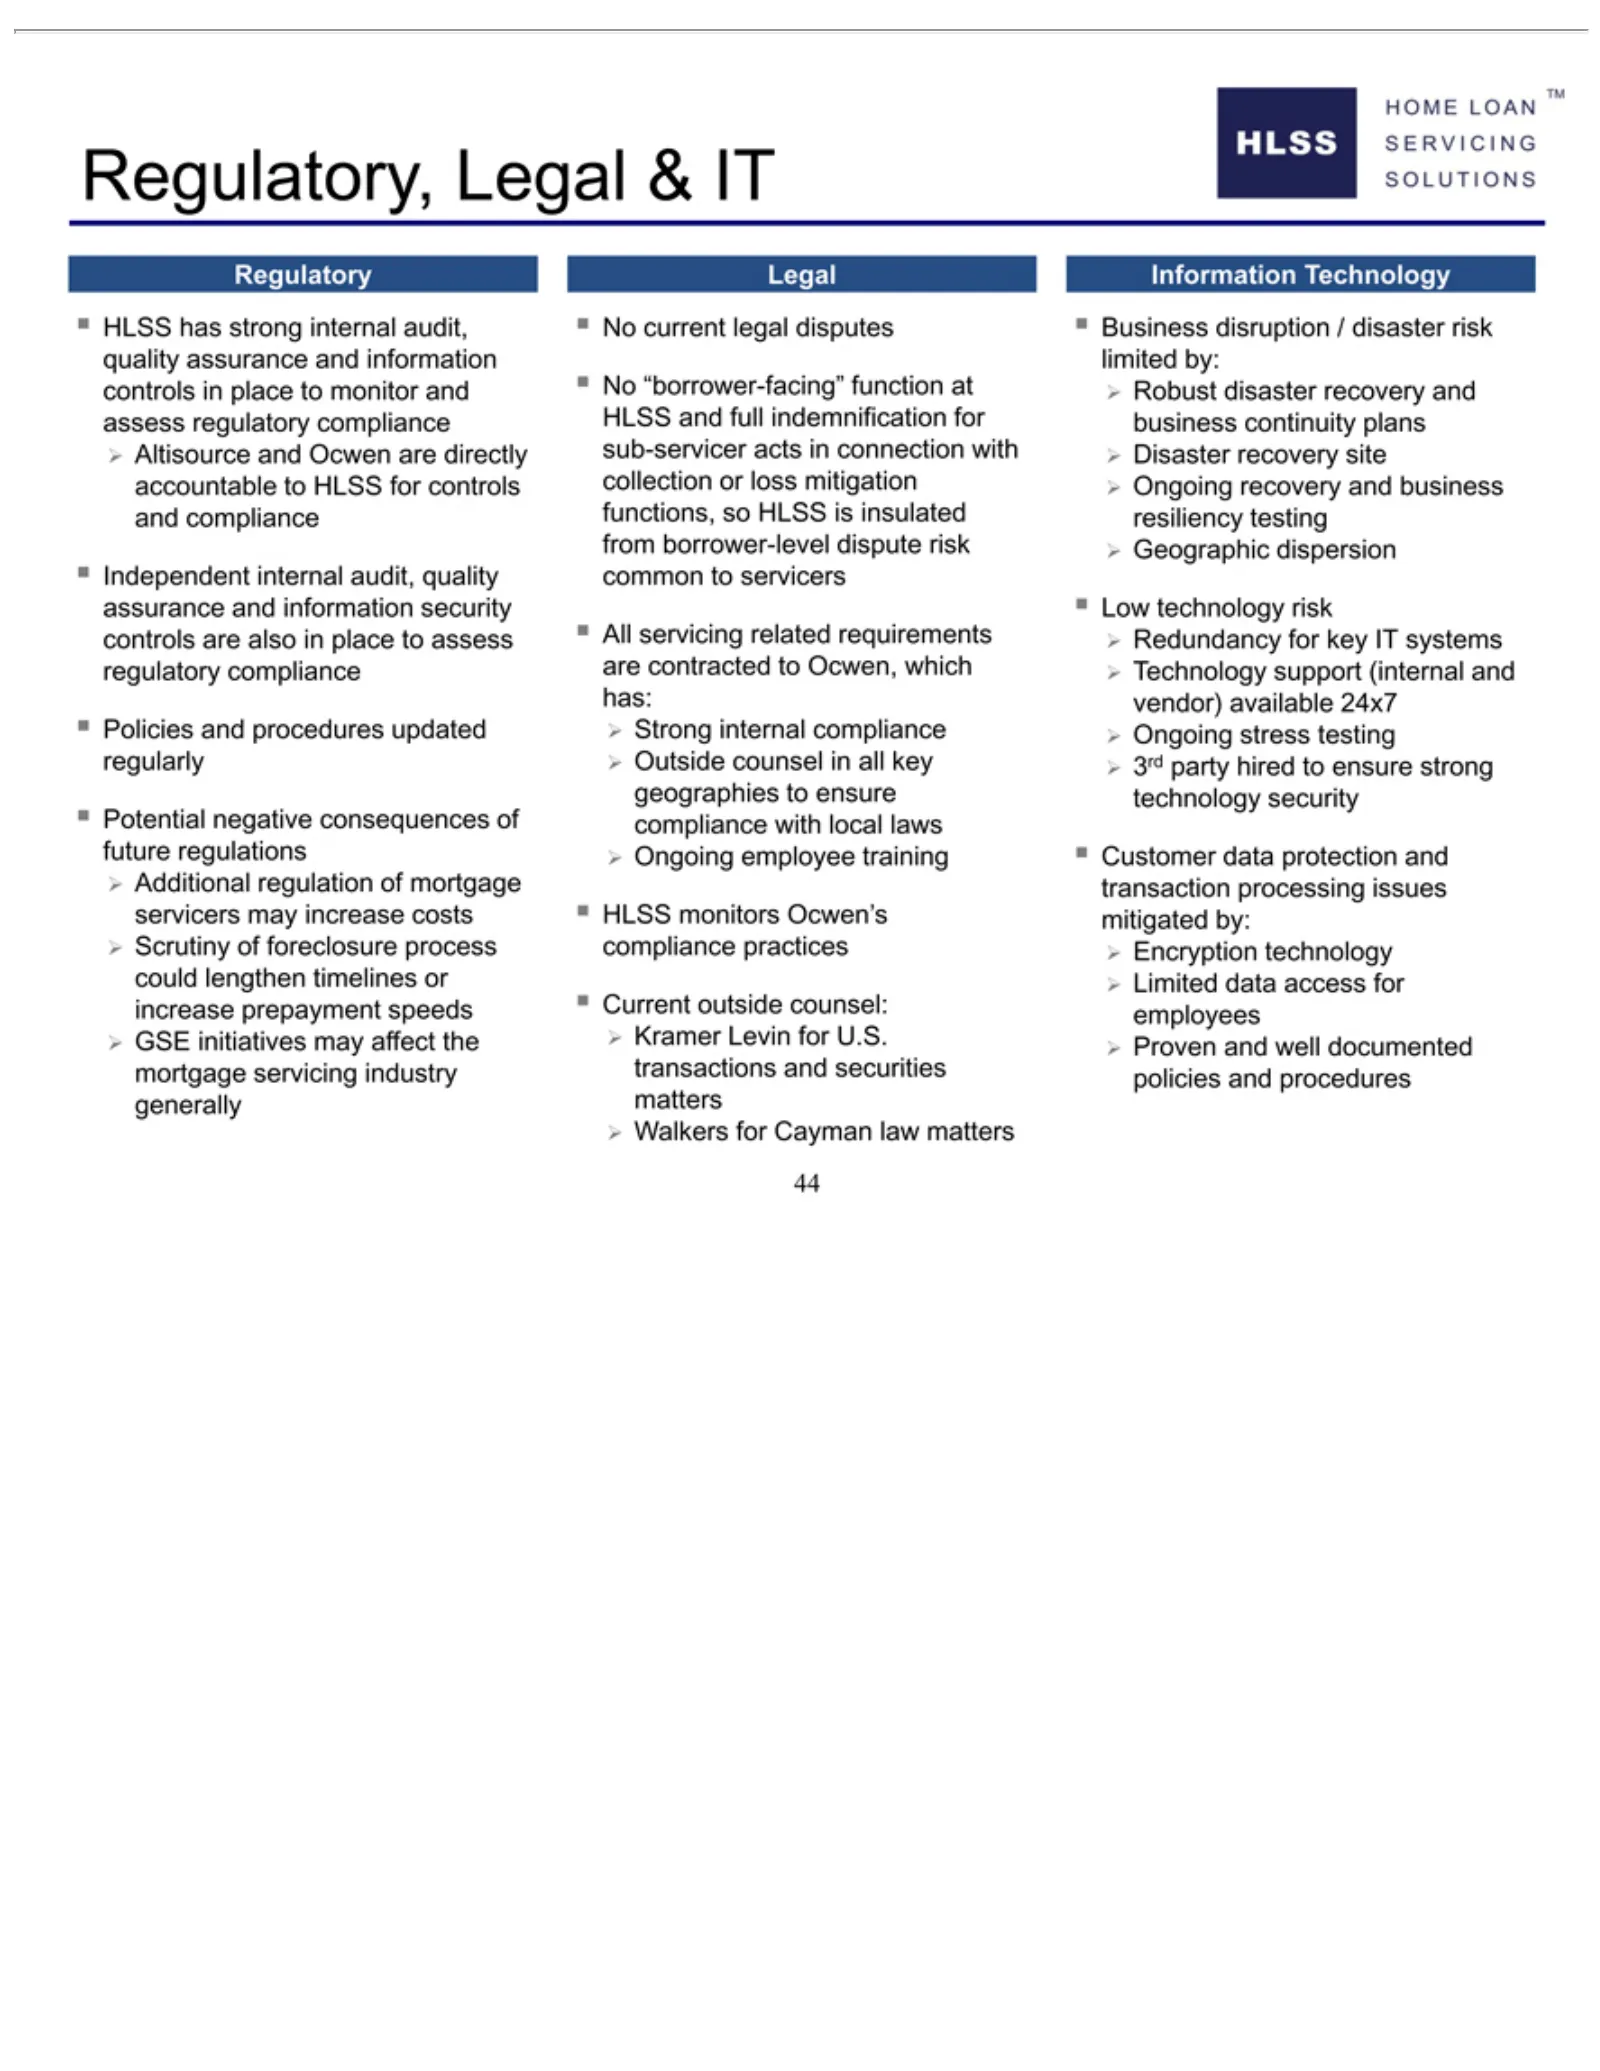
Slide 44: Regulatory, Legal and Compliance Controls
333HLSS Regulatory /44 GSE ƒRegulatory, Altisource has Legal strong Additional &and Ocwen internal ITaudit, regulation audit, are qualitydirectly assurance accountable and information tocontrols HLSS infor controls place and to monitor tocompliance and assess regulatory regulatory compliance complia
Source: SEC EDGAR · 8-K filed Jun 11, 2013
More decks from Home Loan Servicing Solutions Ltd
 Merger or Acquisition (February 2015)6 slides · Feb 23, 2015
 Q3 2014 Earnings Presentation15 slides · Oct 21, 2014
 Debt Investor Presentation (September 2014)40 slides · Sep 22, 2014
 Investor Presentation (September 2014)14 slides · Sep 8, 2014
 Investor Presentation (May 2014)17 slides · May 20, 2014
 Debt Investor Presentation (January 2014)45 slides · Jan 23, 2014