Hamborner REIT AG · XETR:HABA
Hamborner REIT — Q3 2014 Earnings Presentation
19 slides from Hamborner REIT's earnings presentation, Nov 12, 2014
Slide 1: Conference Call 3rd quarter 2014
Conference Call 3rd quarter 2014 Dr. Rüdiger Mrotzek Hans Richard Schmitz 12 November 2014
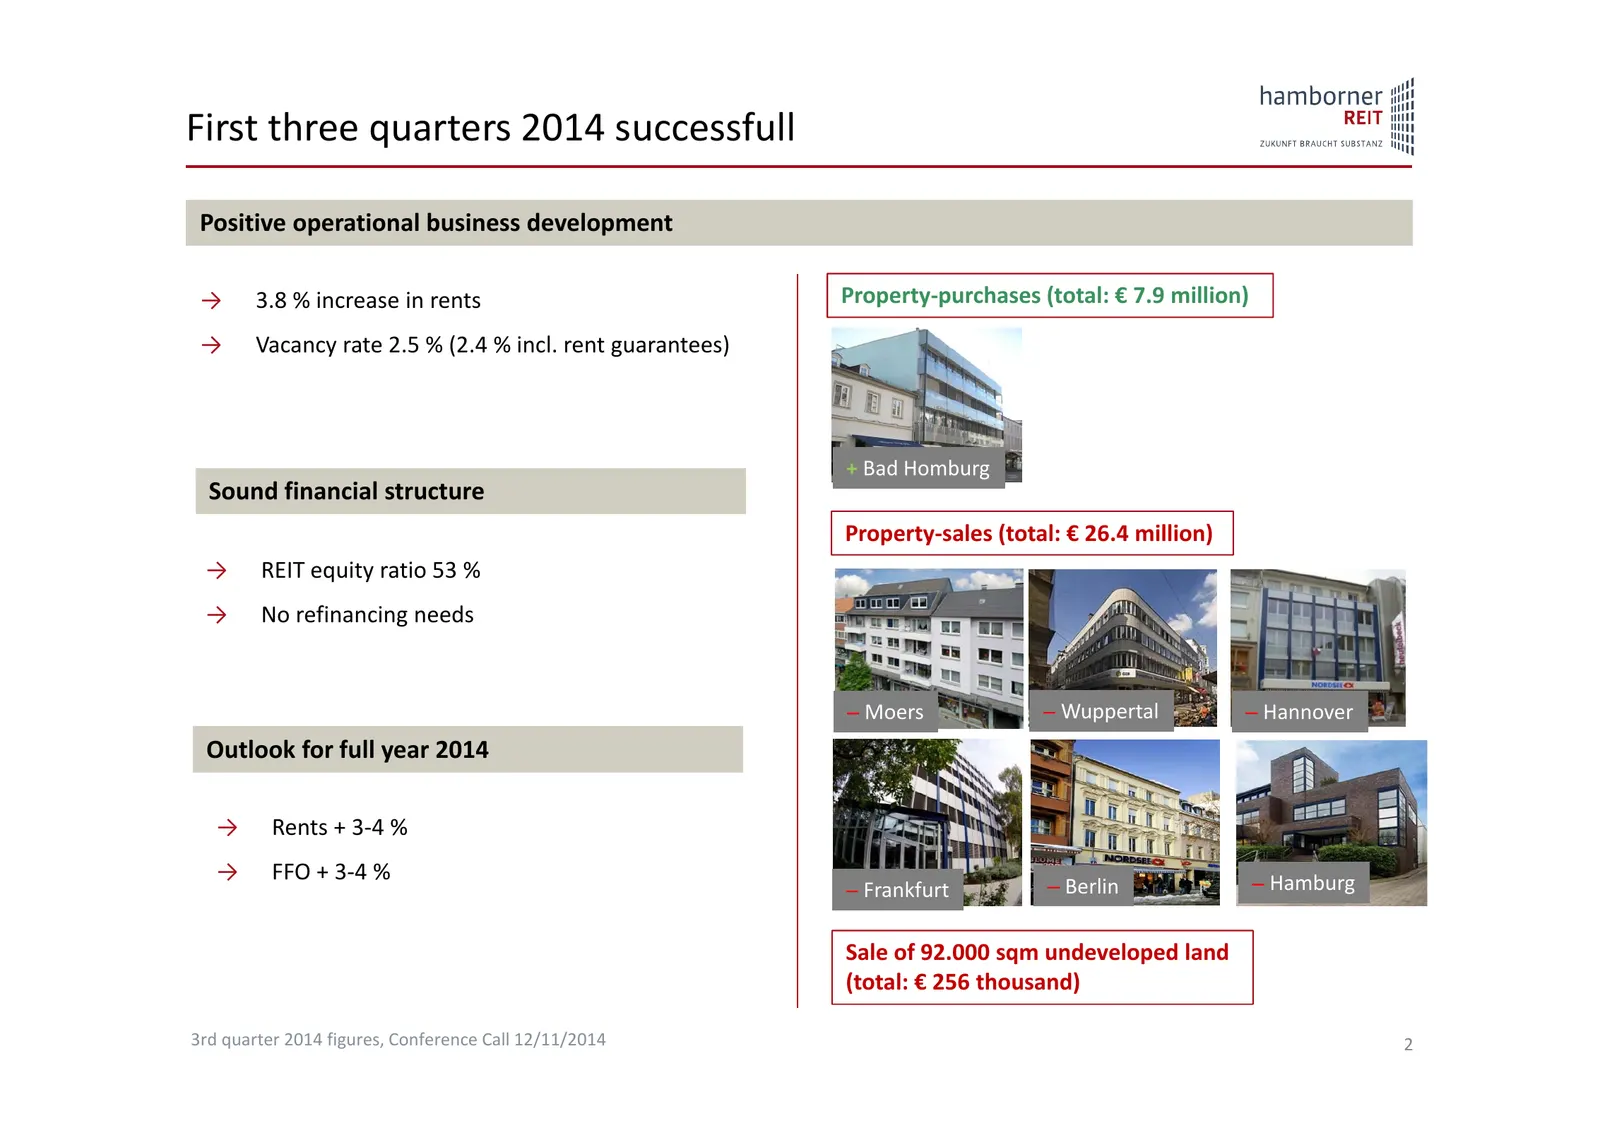
Slide 2: First three quarters 2014 successful
First three quarters 2014 successfull Positive operational business development → 3.8 % increase in rents Property‐purchases (total: € 7.9 million) → Vacancy rate 2.5 % (2.4 % incl. rent guarantees) + Bad Homburg Sound financial structure Property‐sales (total: € 26.4 million) → REIT equity ratio 53
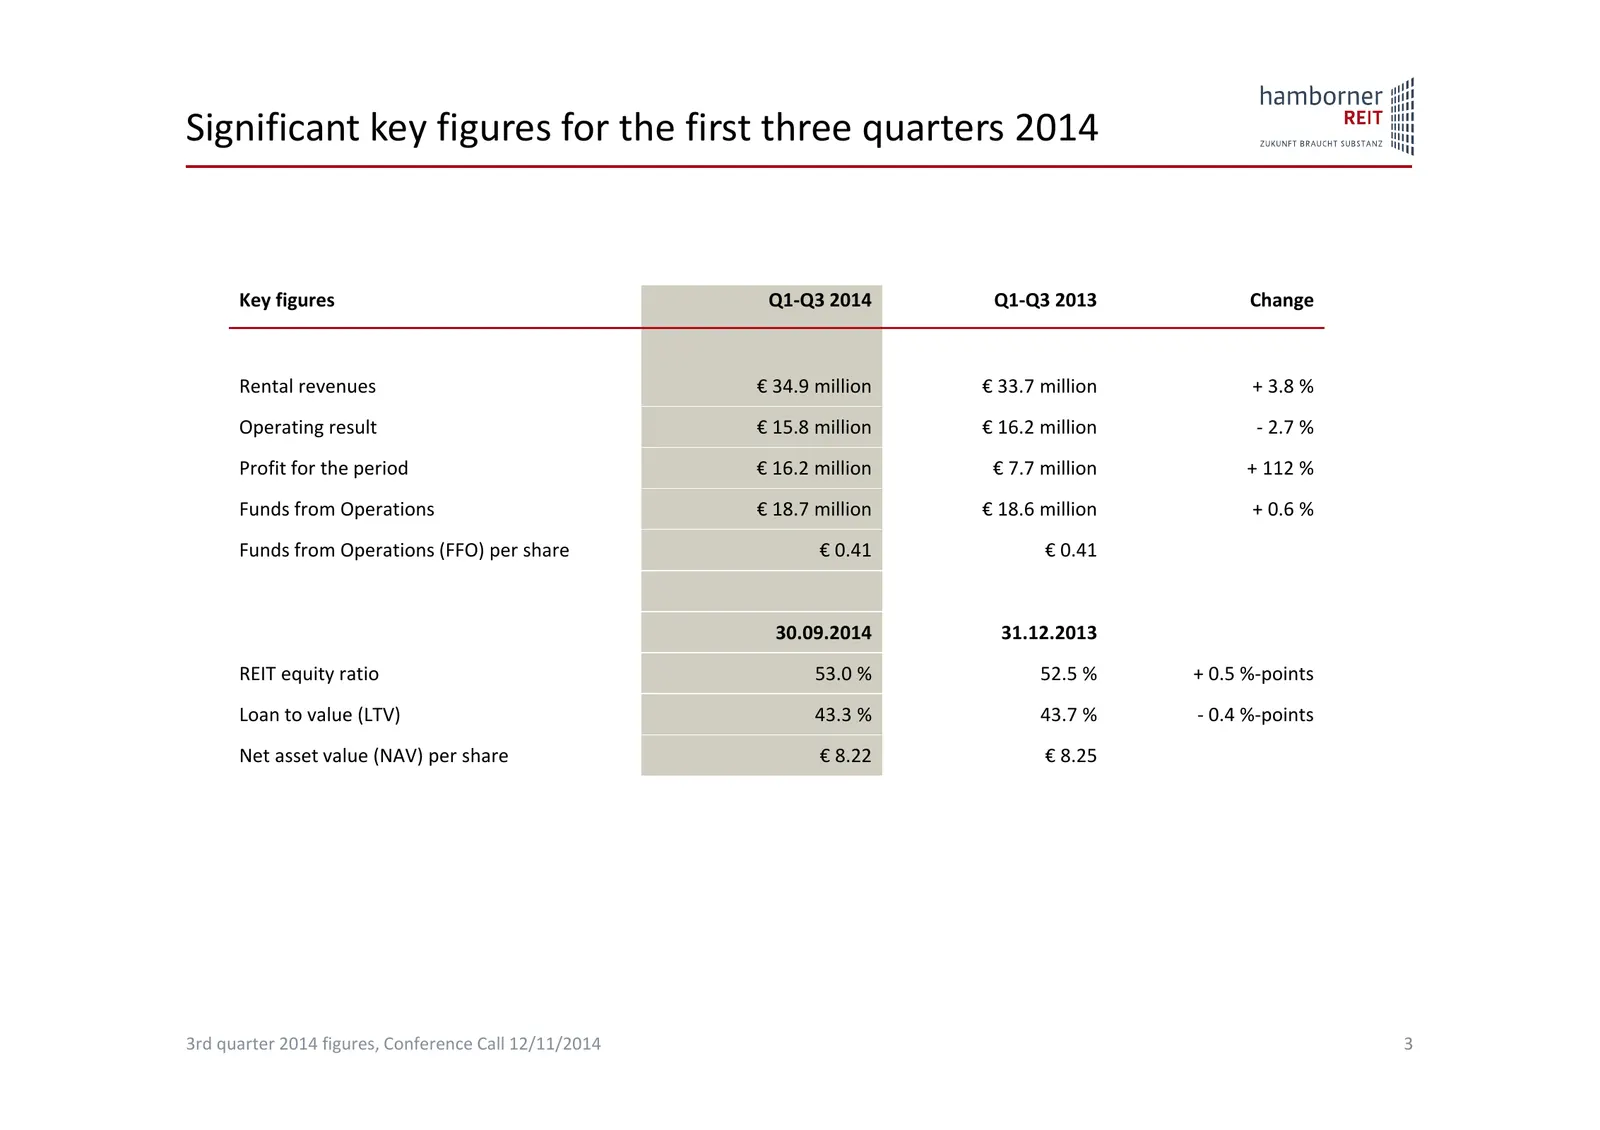
Slide 3: Significant key figures for the first three quarters 2014
Significant key figures for the first three quarters 2014 Key figures Q1‐Q3 2014 Q1‐Q3 2013 Change Rental revenues € 34.9 million € 33.7 million + 3.8 % Operating result € 15.8 million € 16.2 million ‐ 2.7 % Profit for the period € 16.2 million € 7.7 million + 112 % Funds from Operations € 18.7 mill
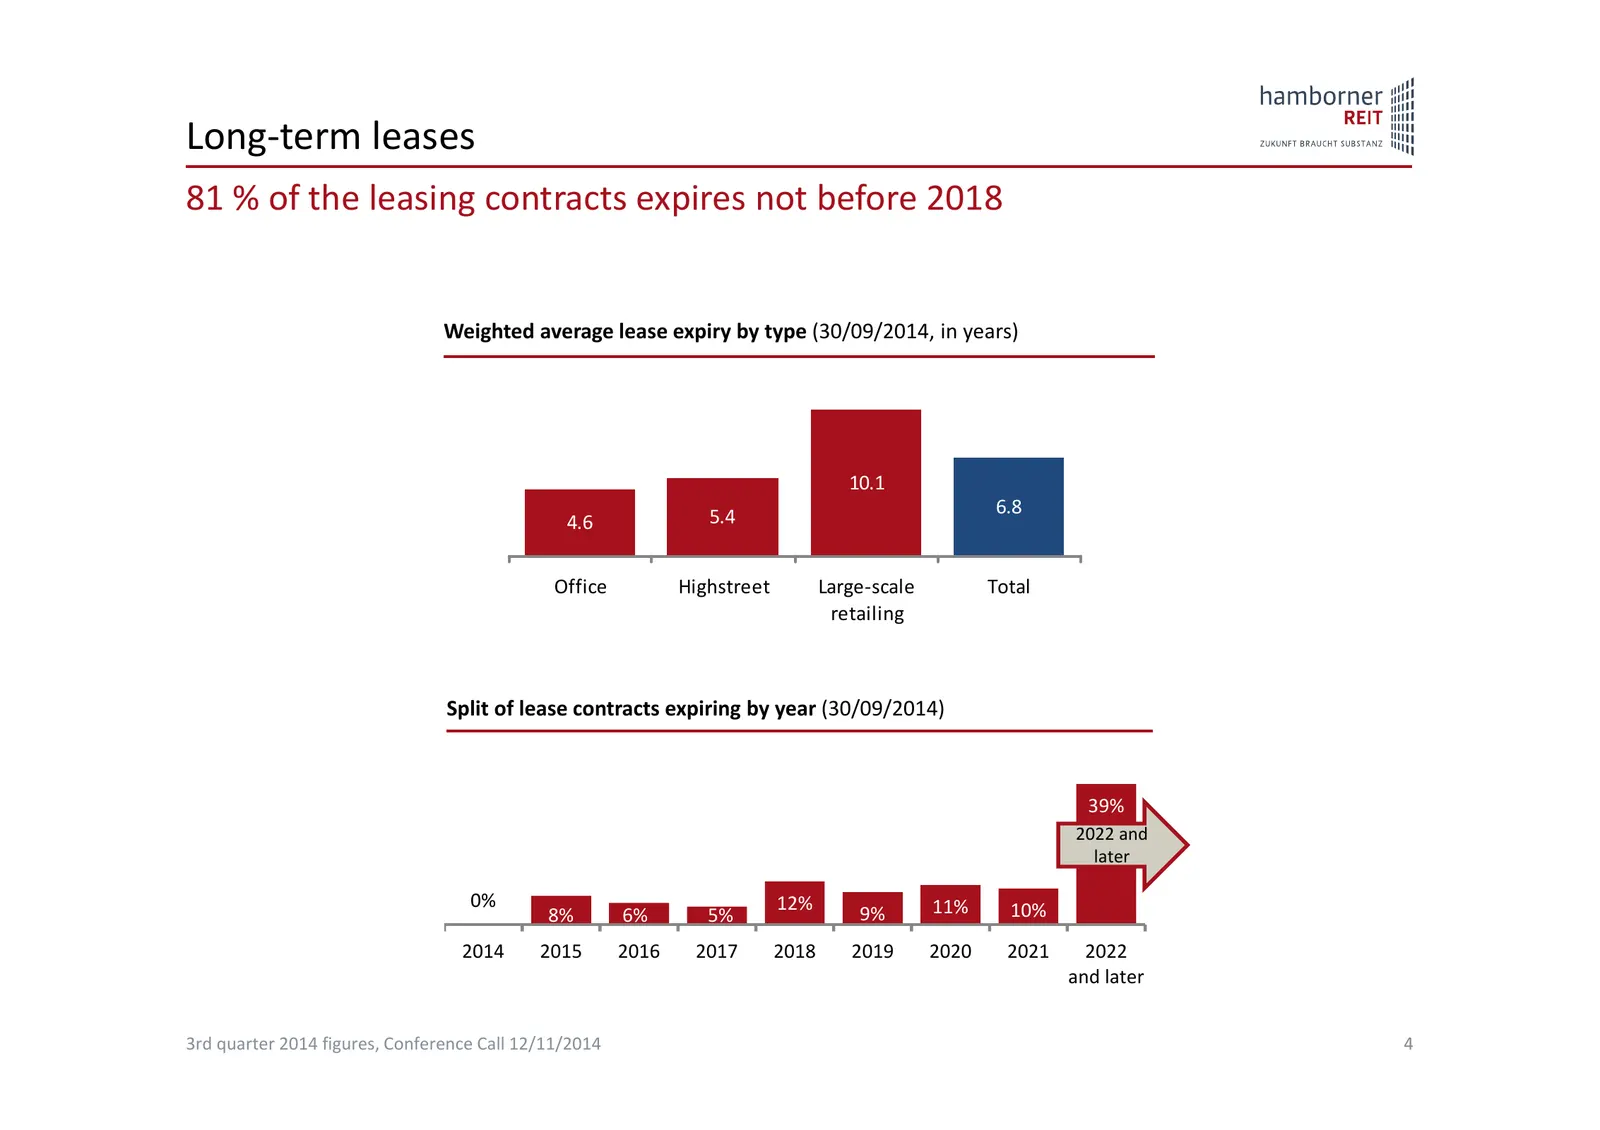
Slide 4: Long-term leases
Long‐term leases 81 % of the leasing contracts expires not before 2018 Weighted average lease expiry by type (30/09/2014, in years) 10.1 5.4 6.8 4.6 Office Highstreet Large‐scale Total retailing Split of lease contracts expiring by year (30/09/2014) 39% 2022 and later 0% 12% 11% 10% 8% 6% 5% 9% 2014
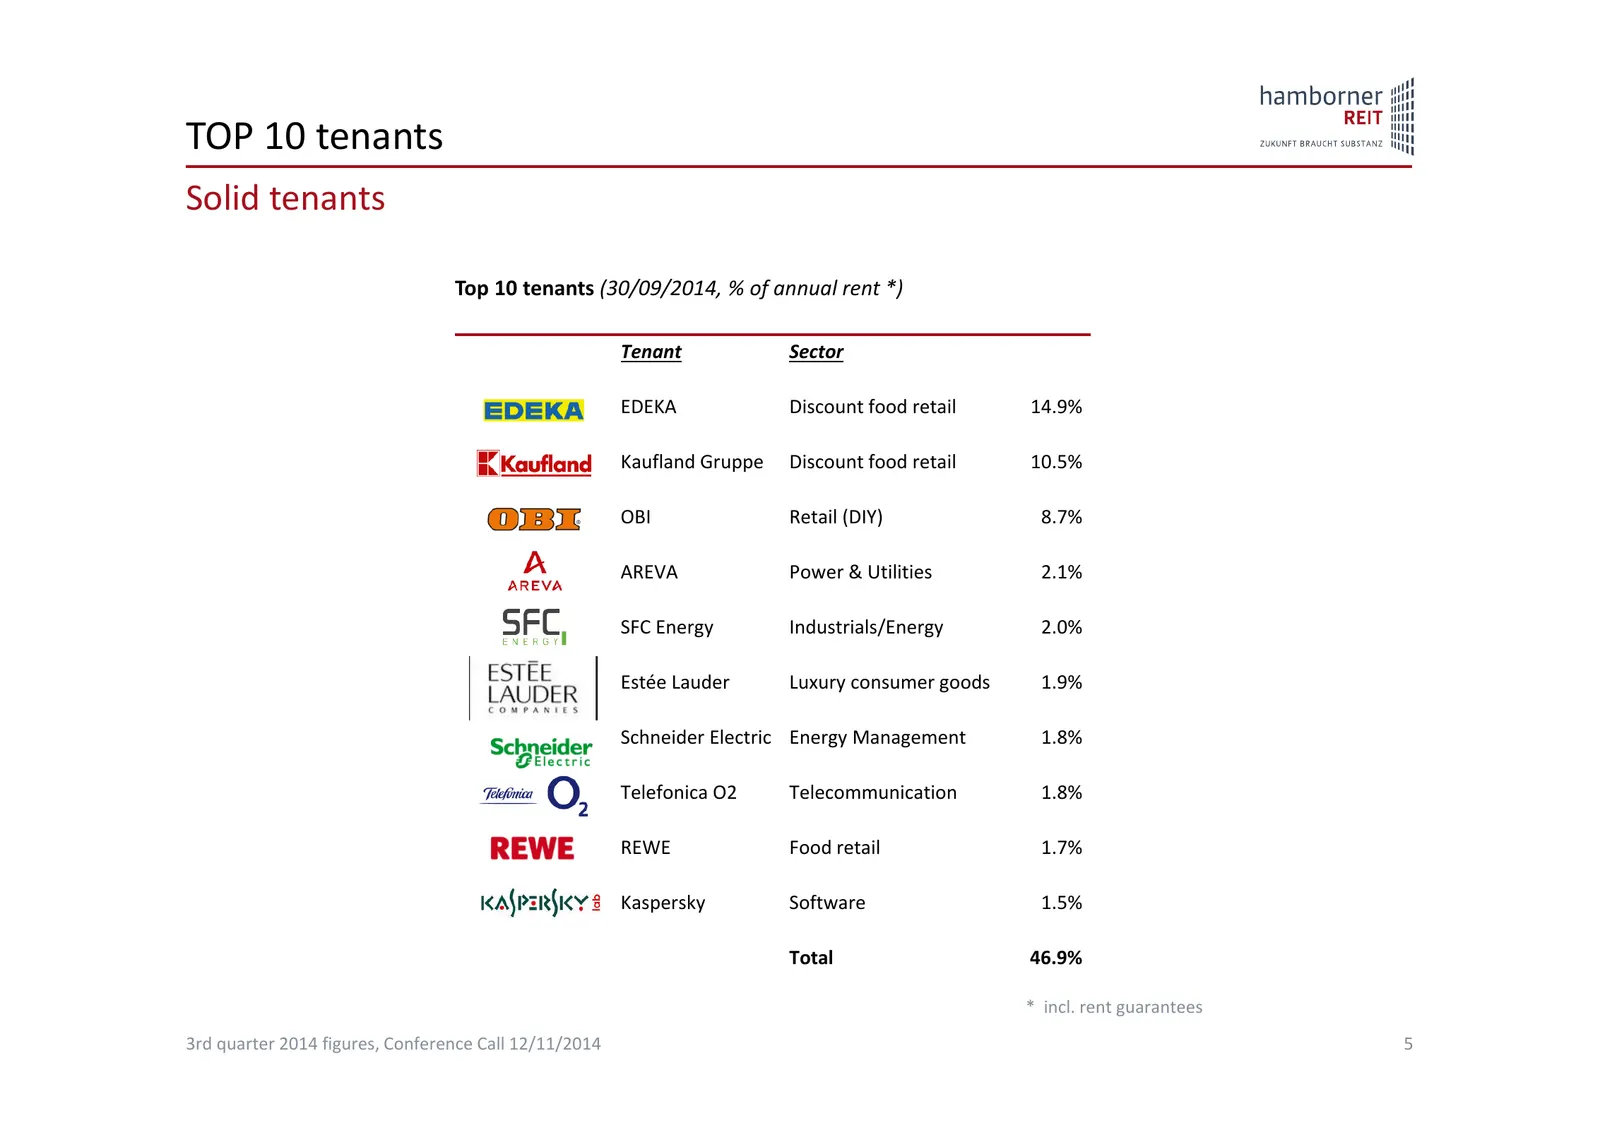
Slide 5: TOP 10 tenants
TOP 10 tenants Solid tenants Top 10 tenants (30/09/2014, % of annual rent *) Tenant Sector EDEKA Discount food retail 14.9% Kaufland Gruppe Discount food retail 10.5% OBI Retail (DIY) 8.7% AREVA Power & Utilities 2.1% SFC Energy Industrials/Energy 2.0% Estée Lauder Luxury consumer goods 1.9% Schneid
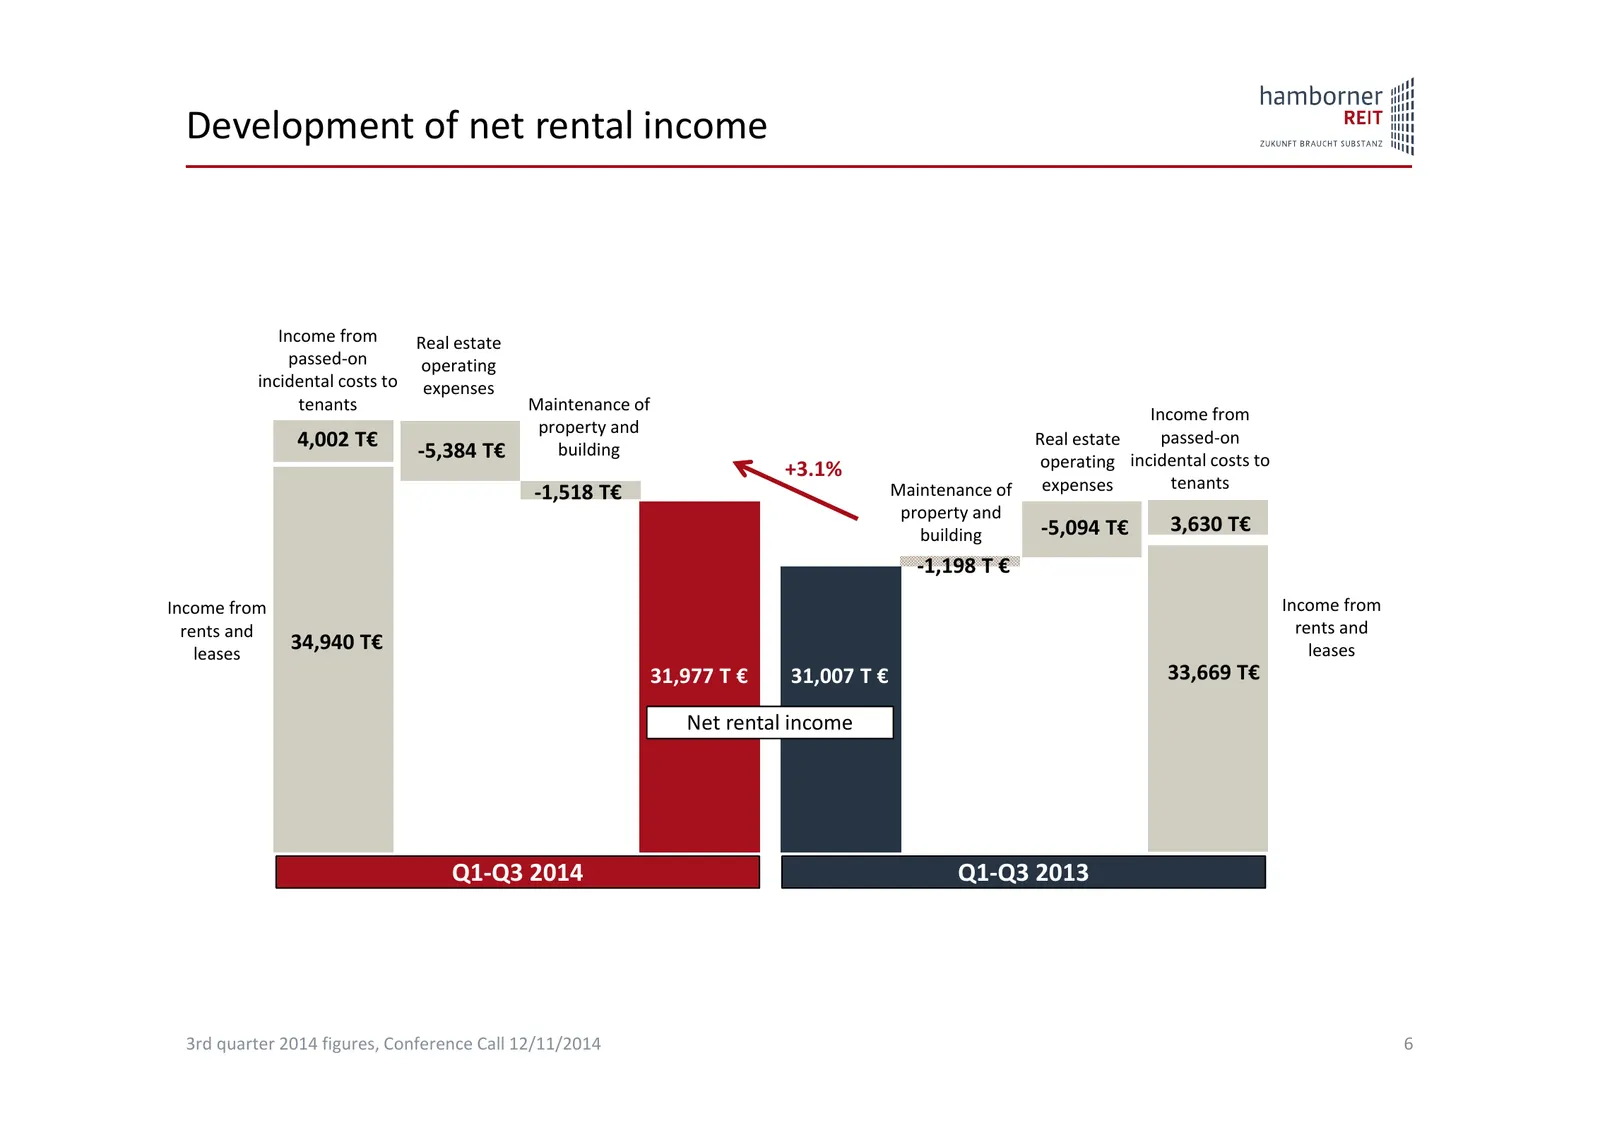
Slide 6: Development of net rental income
Development of net rental income Income from Real estate passed‐on operating incidental costs to expenses tenants Maintenance of Income from property and 4,002 T€ Real estate passed‐on ‐5,384 T€ building operating incidental costs to +3.1% Maintenance of expenses tenants ‐1,518 T€ property and build
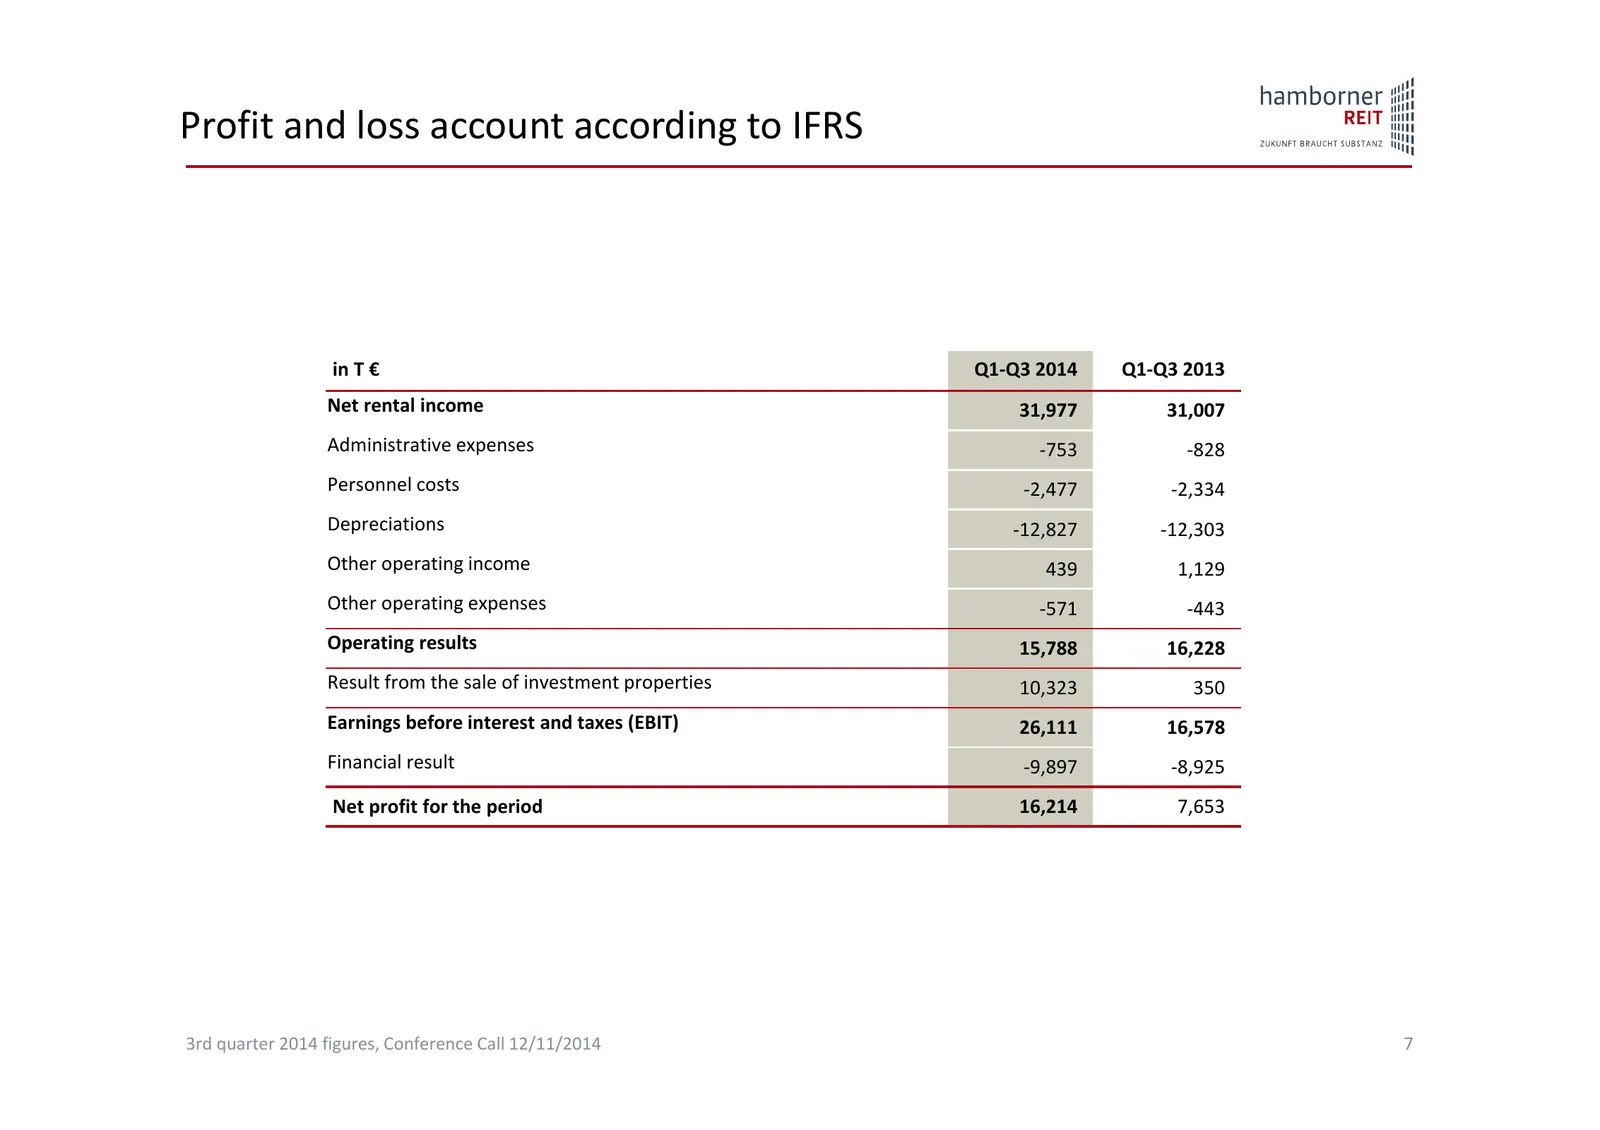
Slide 7: Profit and loss account according to IFRS
Profit and loss account according to IFRS in T € Q1‐Q3 2014 Q1‐Q3 2013 Net rental income 31,977 31,007 Administrative expenses ‐753 ‐828 Personnel costs ‐2,477 ‐2,334 Depreciations ‐12,827 ‐12,303 Other operating income 439 1,129 Other operating expenses ‐571 ‐443 Operating results 15,788 16,228 Res
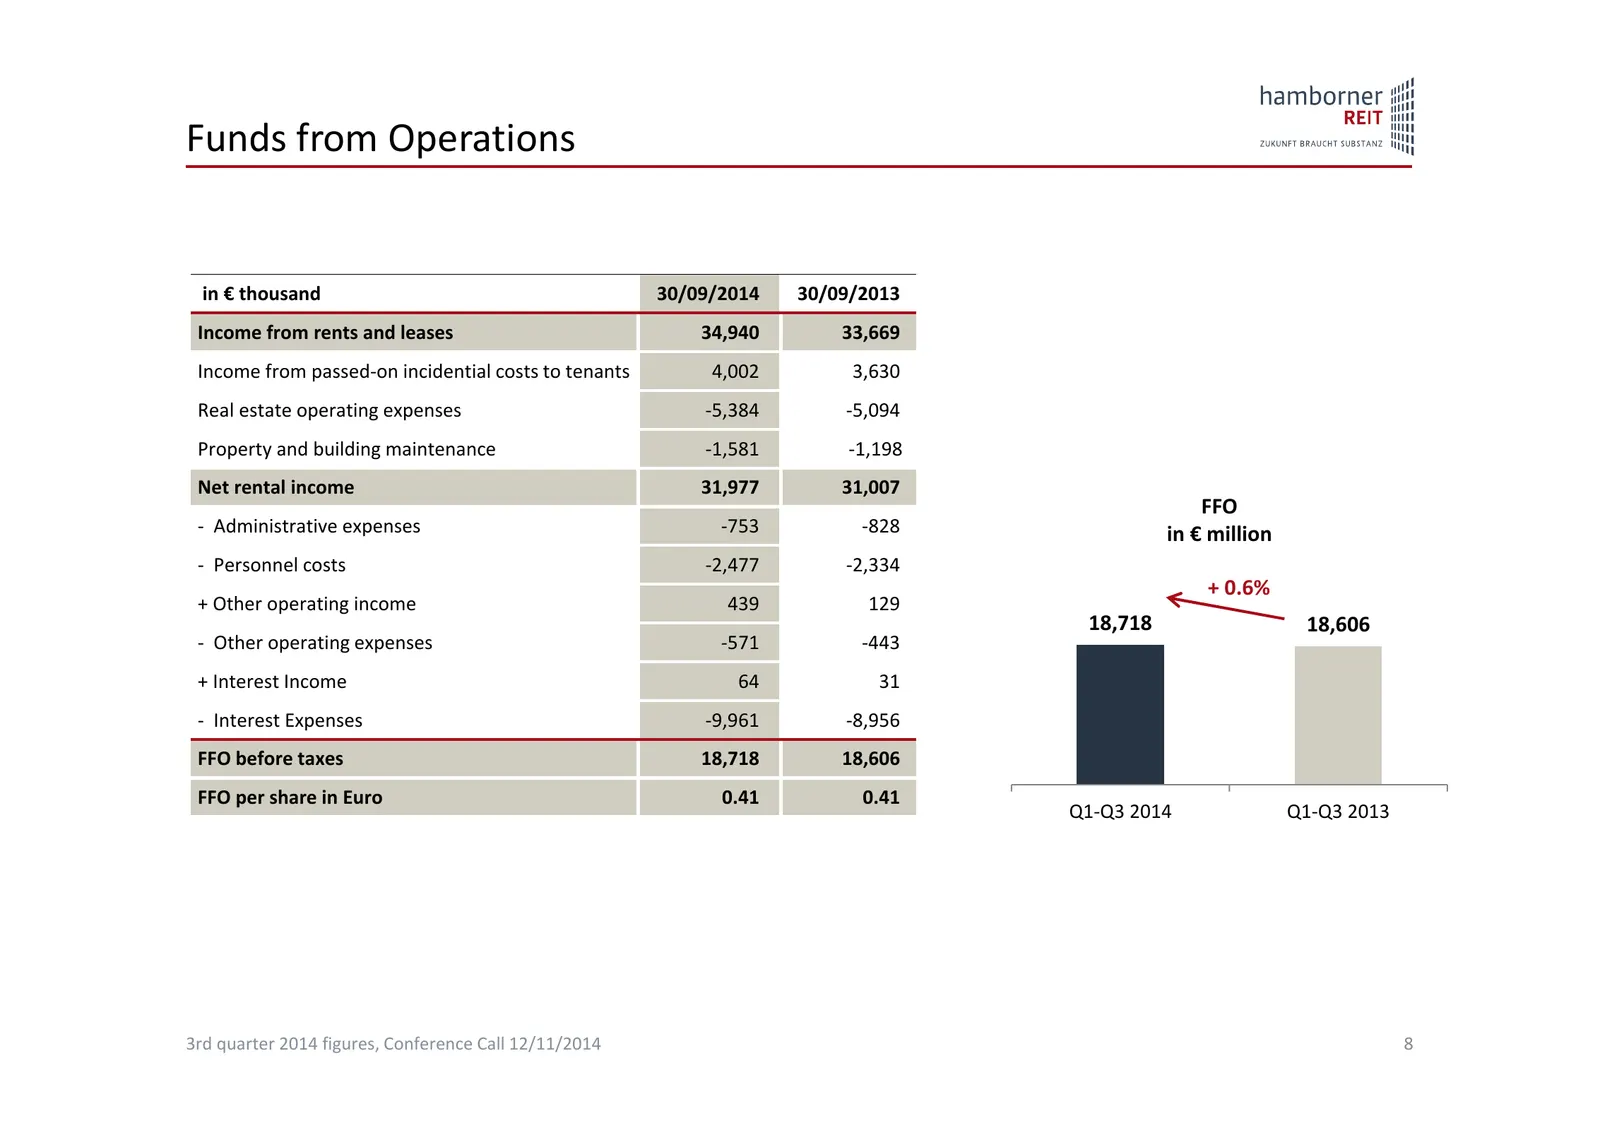
Slide 8: Funds from Operations
Funds from Operations in € thousand 30/09/2014 30/09/2013 Income from rents and leases 34,940 33,669 Income from passed‐on incidential costs to tenants 4,002 3,630 Real estate operating expenses ‐5,384 ‐5,094 Property and building maintenance ‐1,581 ‐1,198 Net rental income 31,977 31,007 FFO ‐ Admin
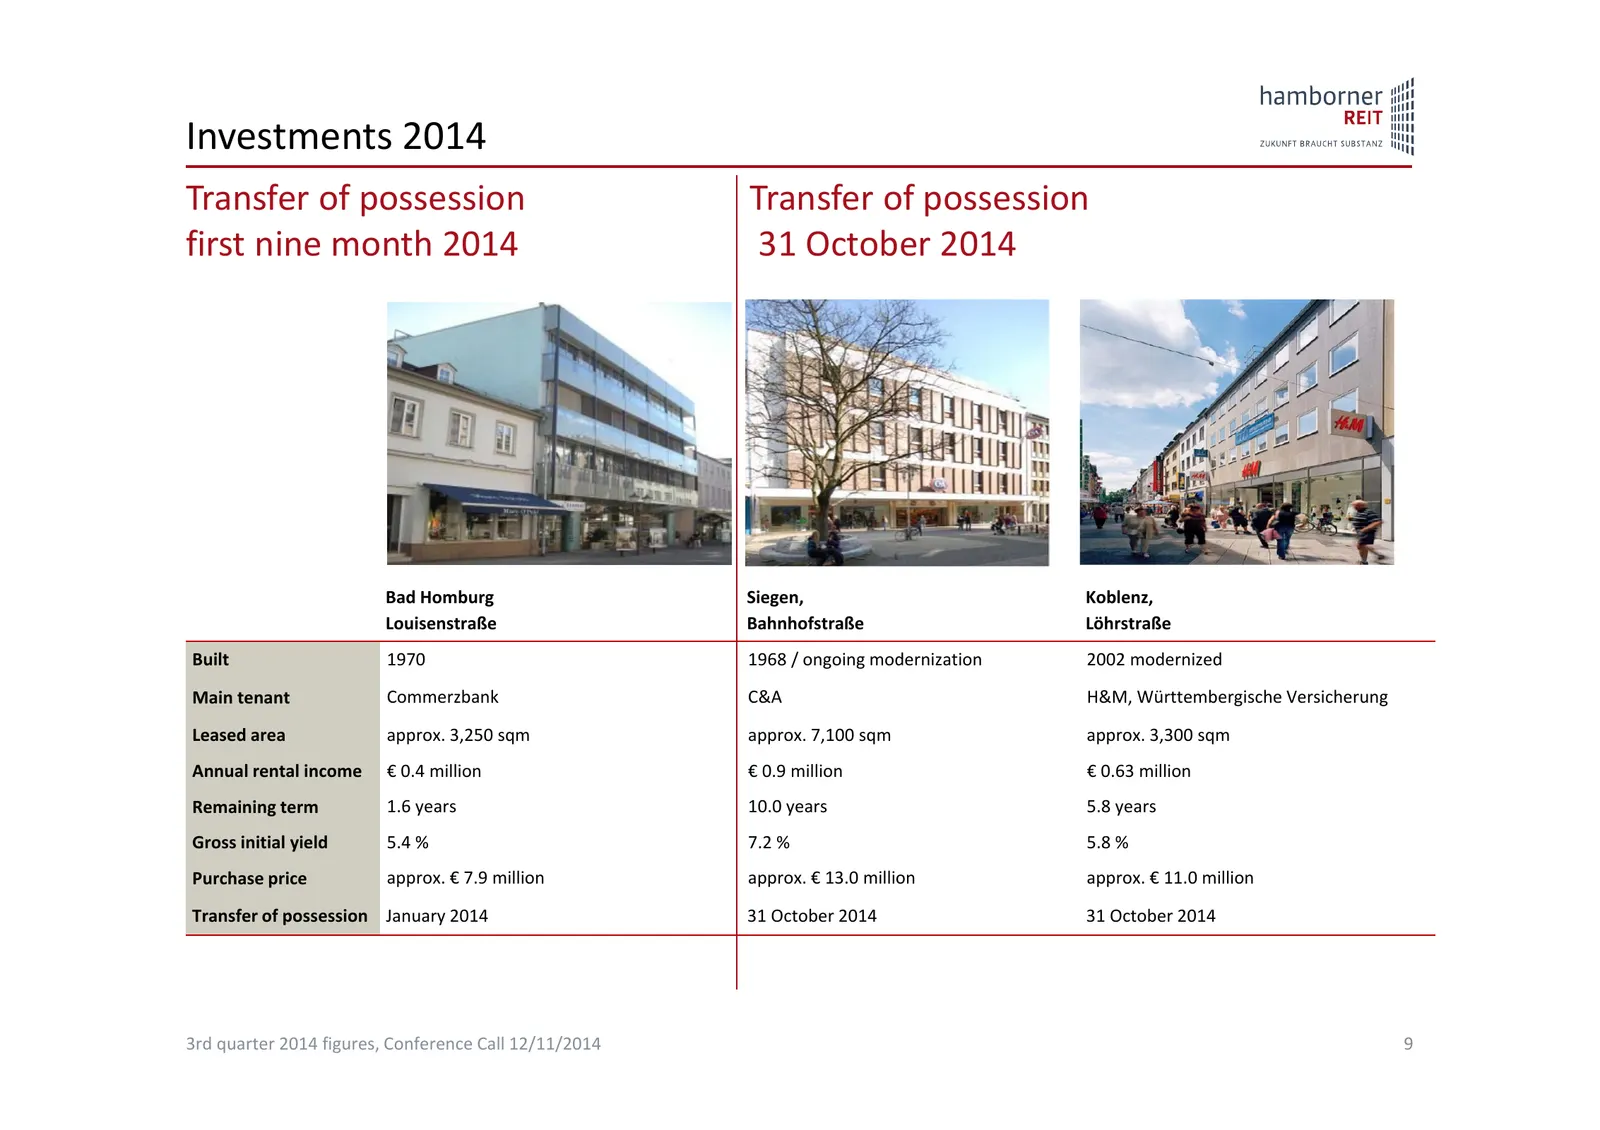
Slide 9: Investments 2014: Transfer of possession first nine month 2014
Investments 2014 Transfer of possession Transfer of possession first nine month 2014 31 October 2014 Bad Homburg Siegen, Koblenz, Louisenstraße Bahnhofstraße Löhrstraße Built 1970 1968 / ongoing modernization 2002 modernized Main tenant Commerzbank C&A H&M, Württembergische Versicherung Leased area
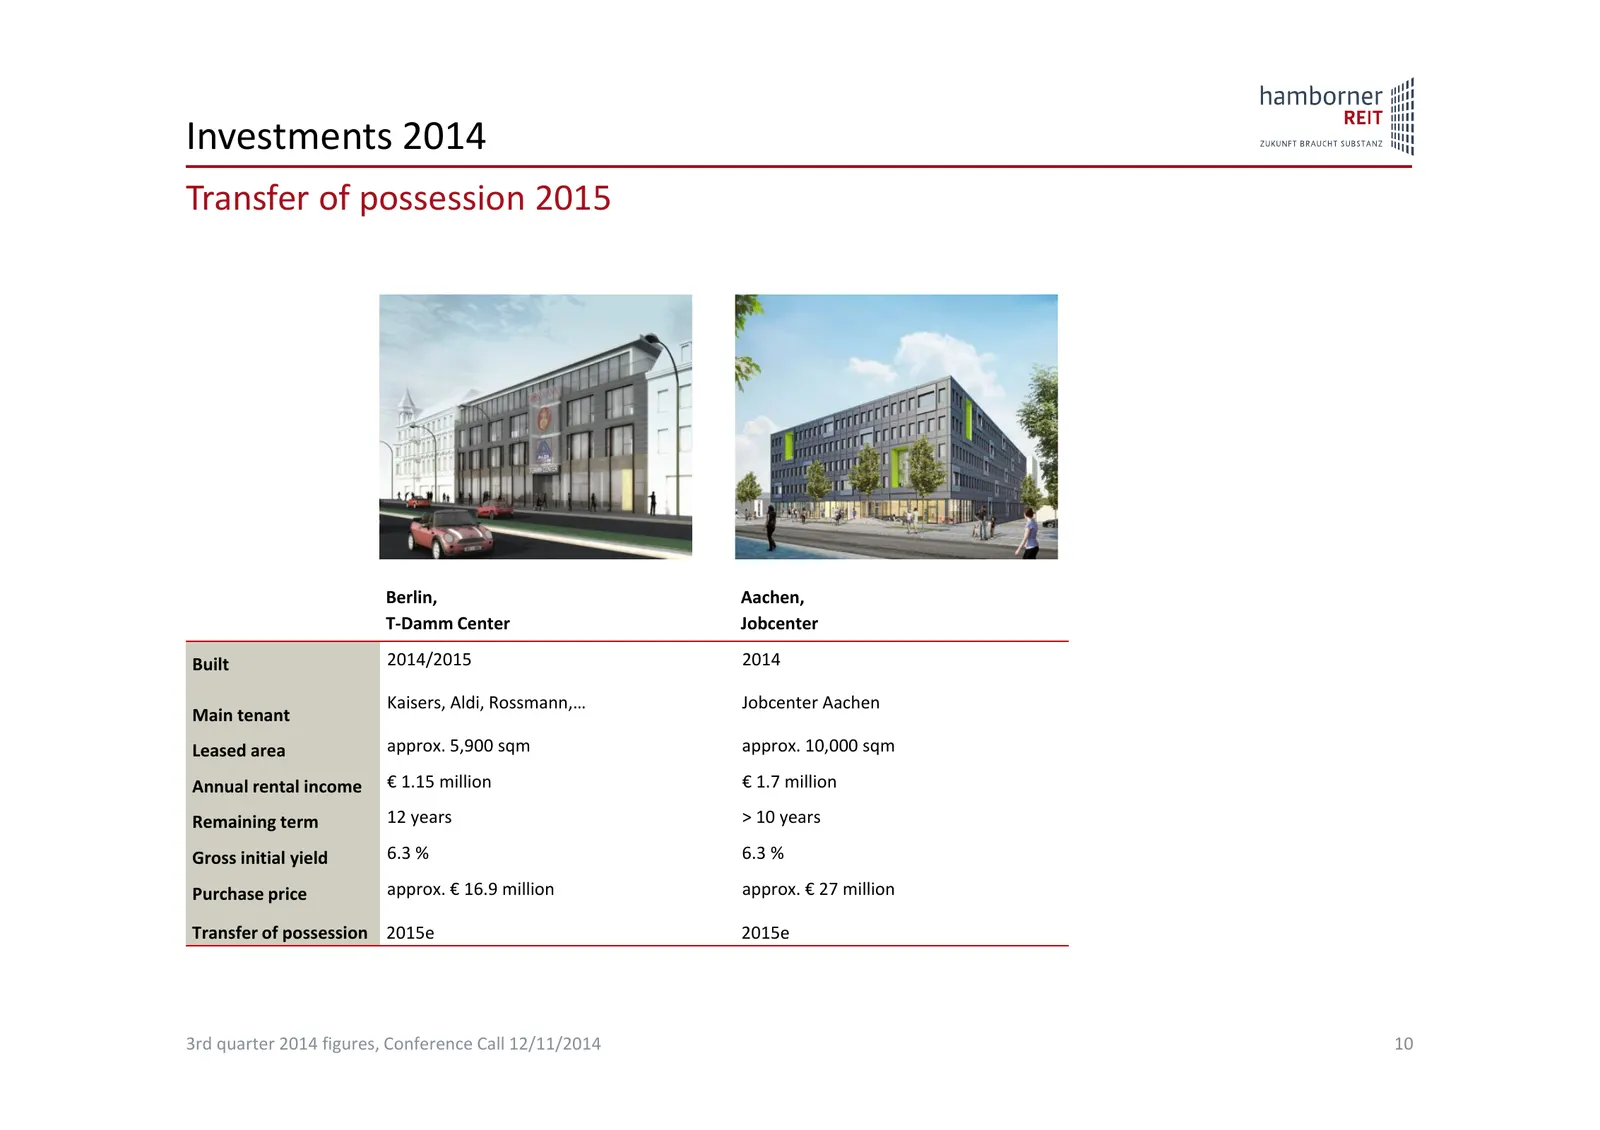
Slide 10: Investments 2014: Transfer of possession 2015
Investments 2014 Transfer of possession 2015 Berlin, Aachen, T‐Damm Center Jobcenter Built 2014/2015 2014 Kaisers, Aldi, Rossmann,… Jobcenter Aachen Main tenant Leased area approx. 5,900 sqm approx. 10,000 sqm Annual rental income € 1.15 million € 1.7 million Remaining term 12 years > 10 years Gross
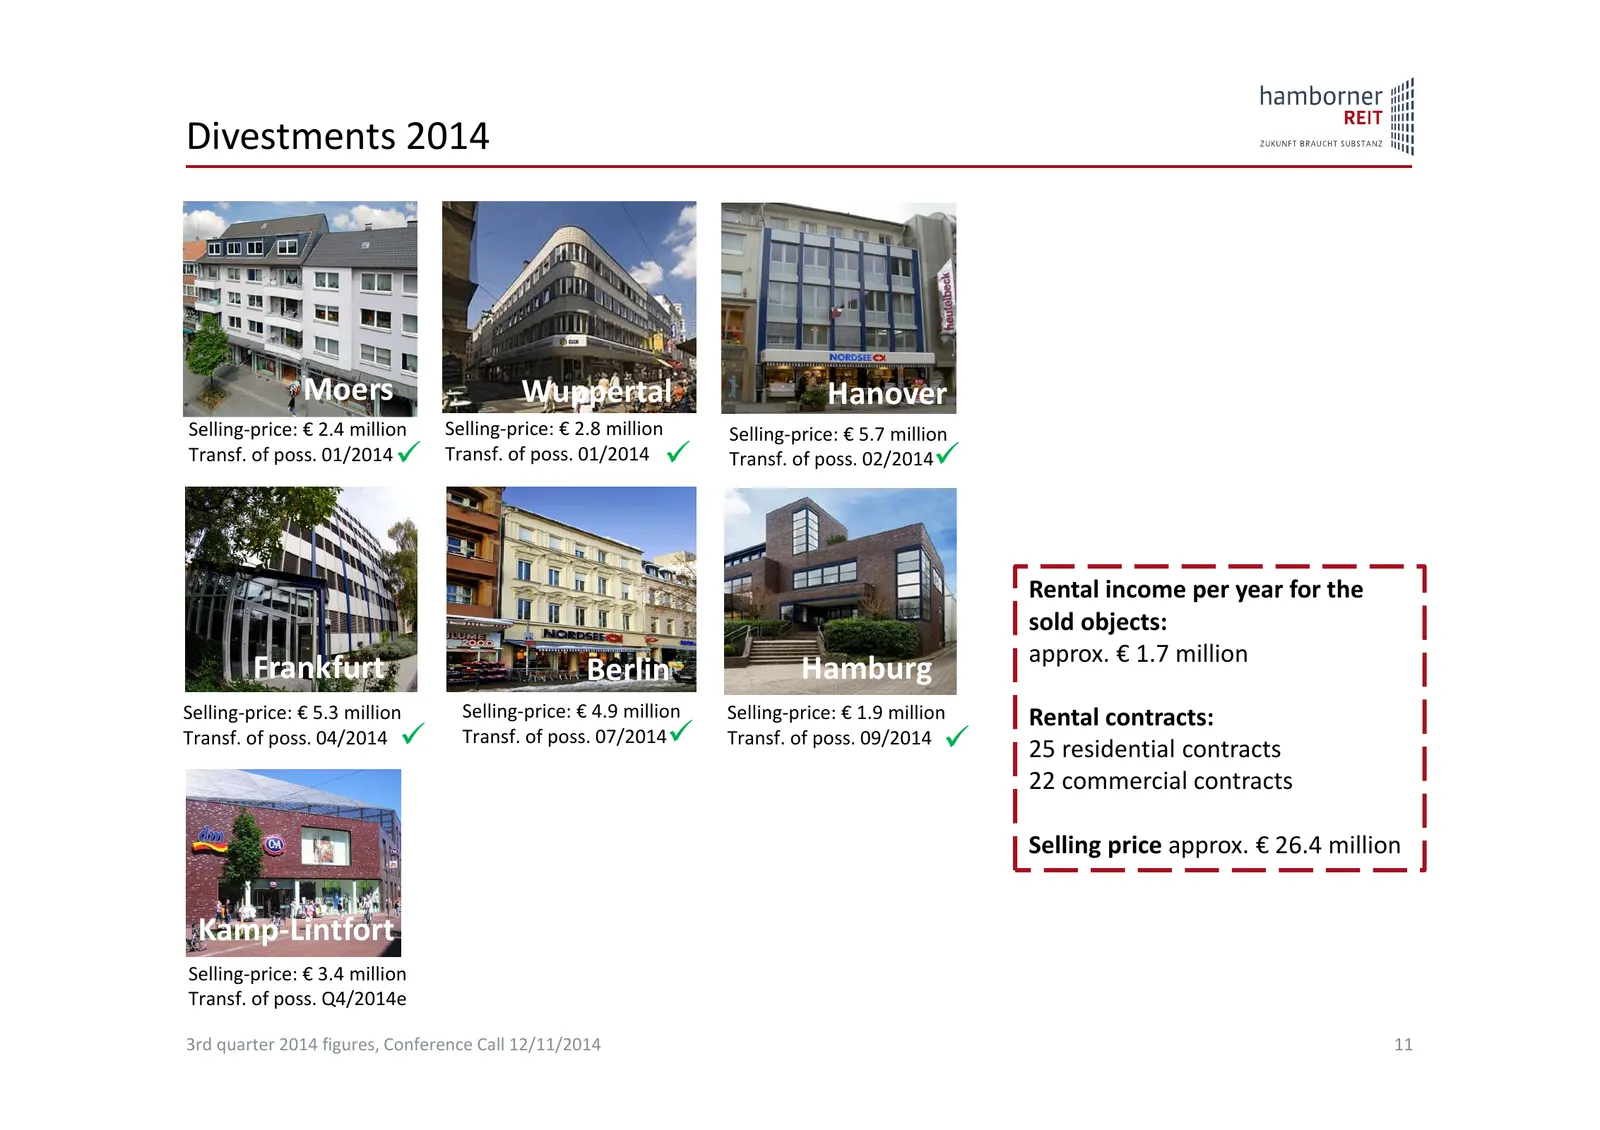
Slide 11: Divestments 2014
Divestments 2014 Moers Wuppertal Hanover Selling‐price: € 2.4 million Selling‐price: € 2.8 million Selling‐price: € 5.7 million Transf. of poss. 01/2014 Transf. of poss. 01/2014 Transf. of poss. 02/2014 Rental income per year for the sold objects: approx. € 1.7 million Frankfurt Berlin Hamburg
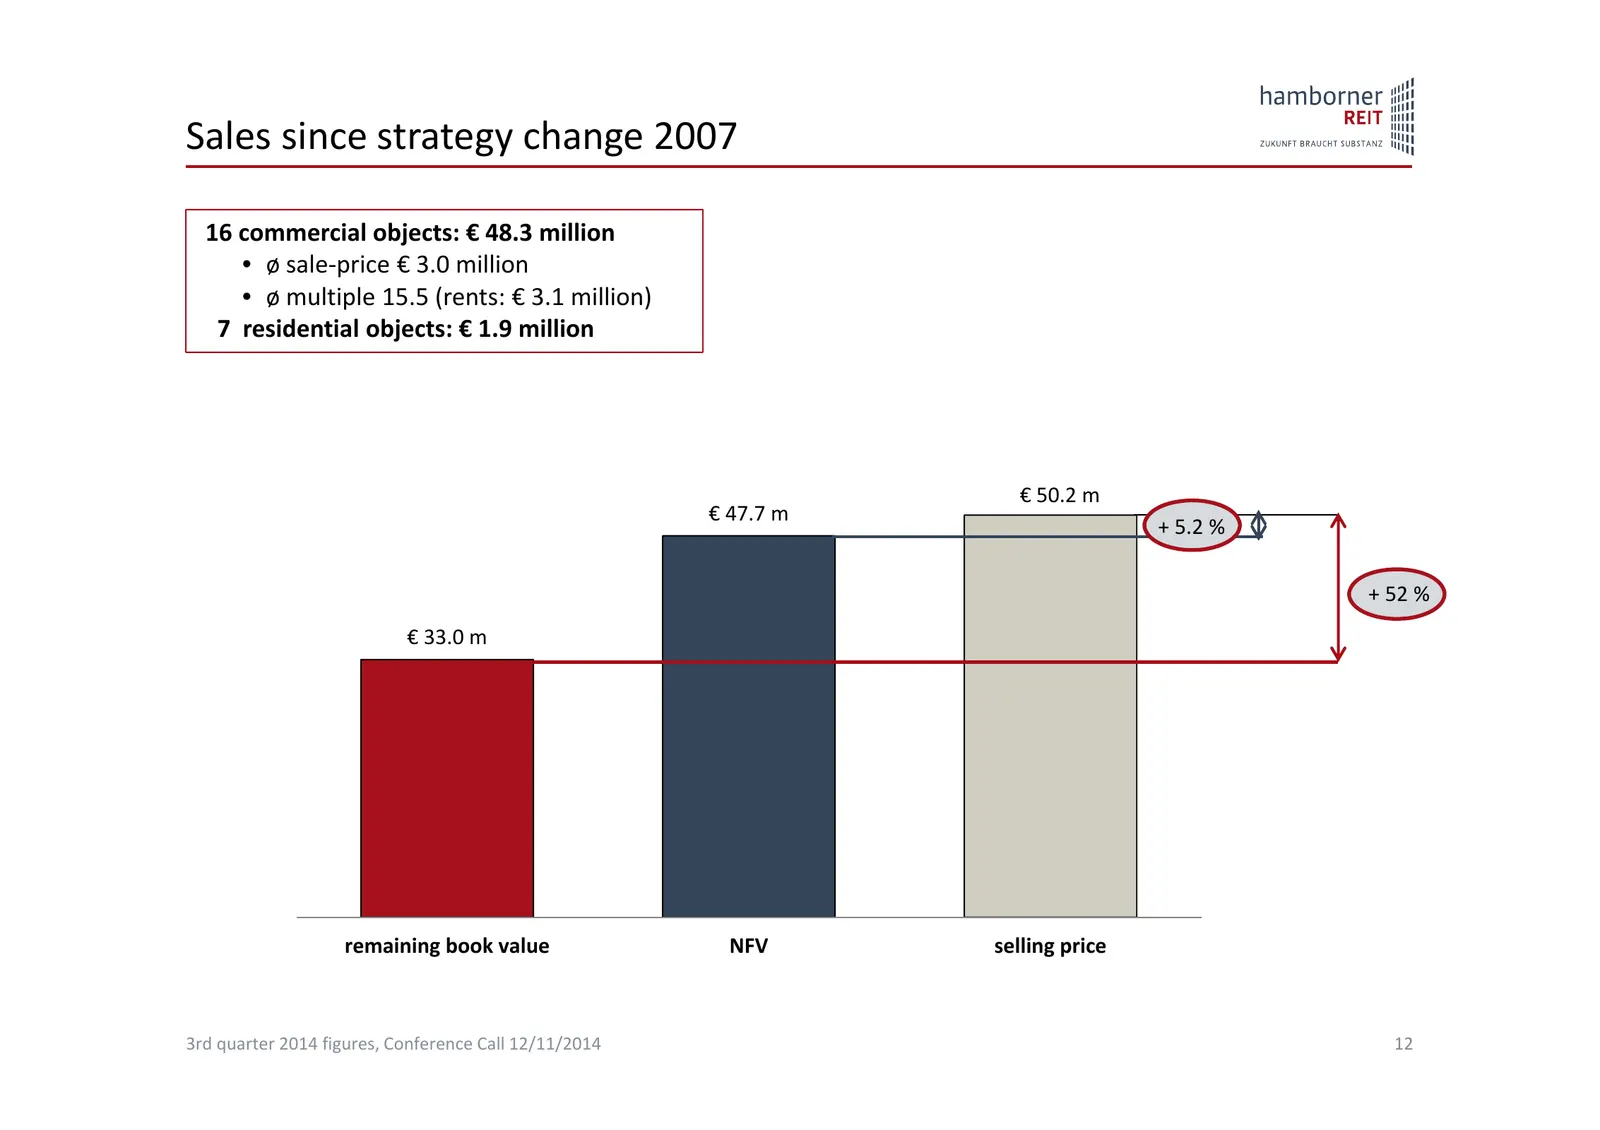
Slide 12: Sales since strategy change 2007
Sales since strategy change 2007 16 commercial objects: € 48.3 million • ø sale‐price € 3.0 million • ø multiple 15.5 (rents: € 3.1 million) 7 residential objects: € 1.9 million € 50.2 m € 47.7 m + 5.2 % + 52 % € 33.0 m remaining book value NFV selling price 3rd quarter 2014 figures, Conference Call
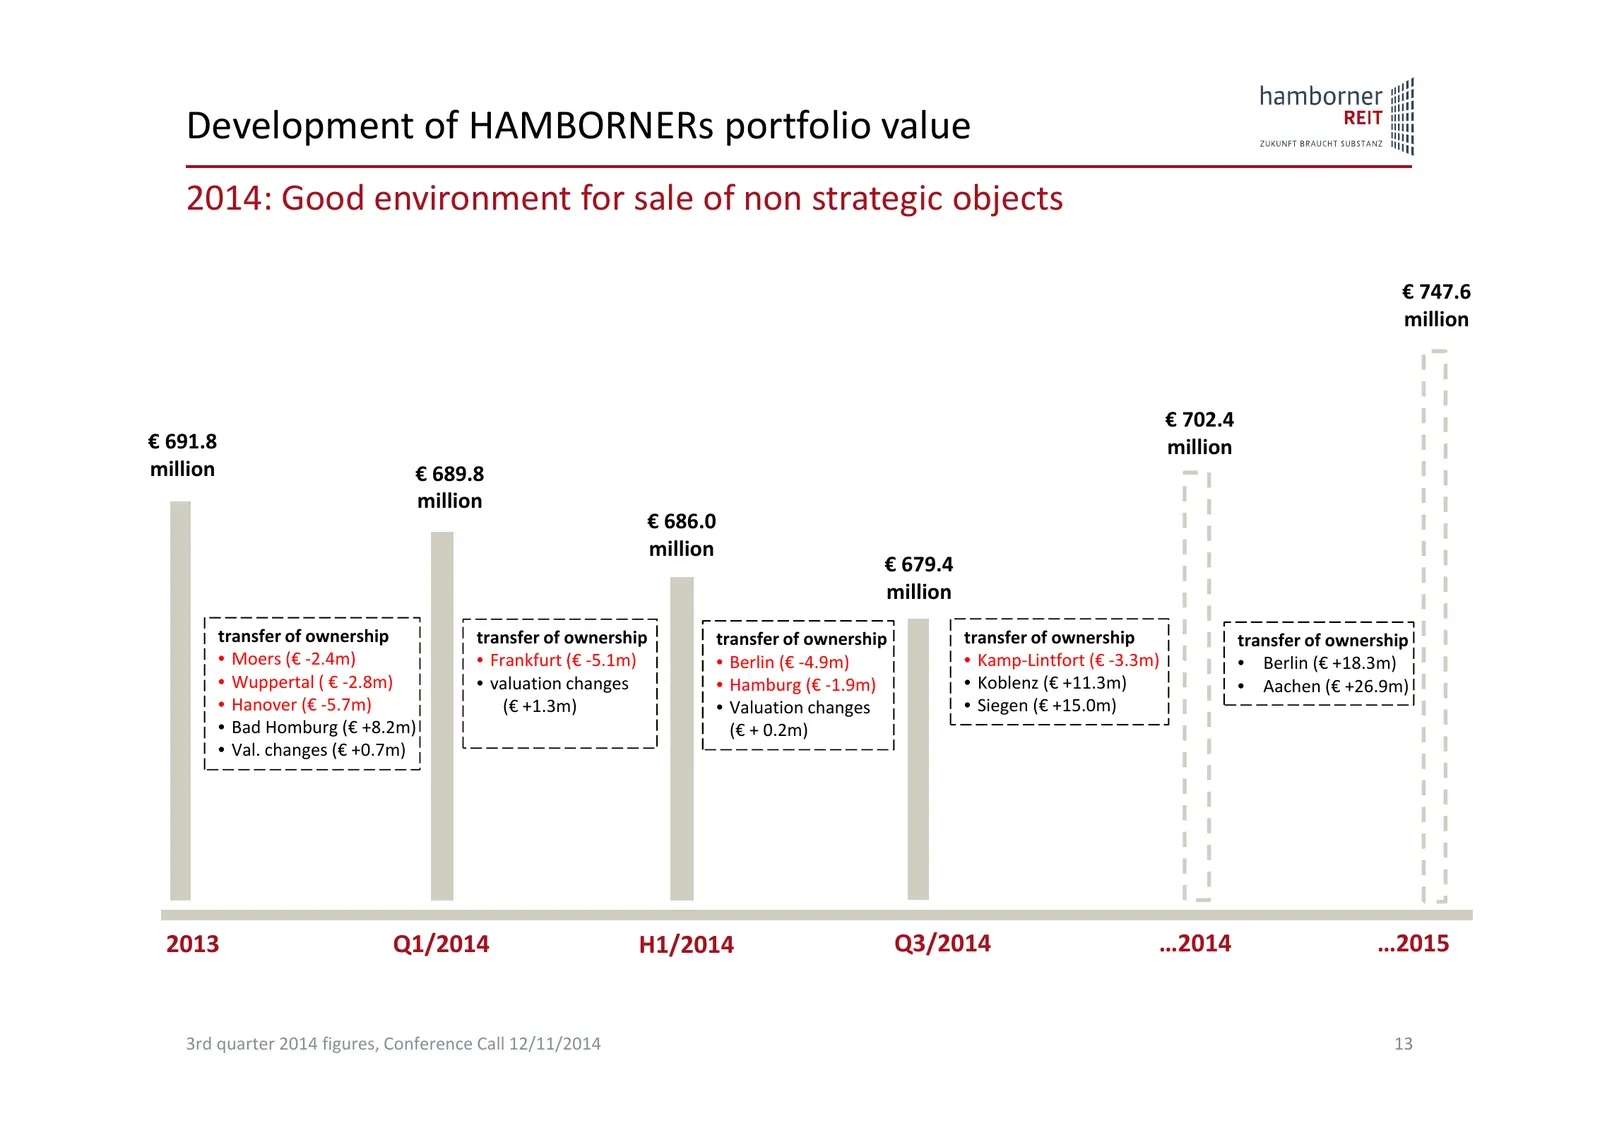
Slide 13: Development of HAMBORNERs portfolio value
Development of HAMBORNERs portfolio value 2014: Good environment for sale of non strategic objects € 747.6 million € 702.4 € 691.8 million million € 689.8 million € 686.0 million € 679.4 million transfer of ownership transfer of ownership transfer of ownership transfer of ownership transfer of owner
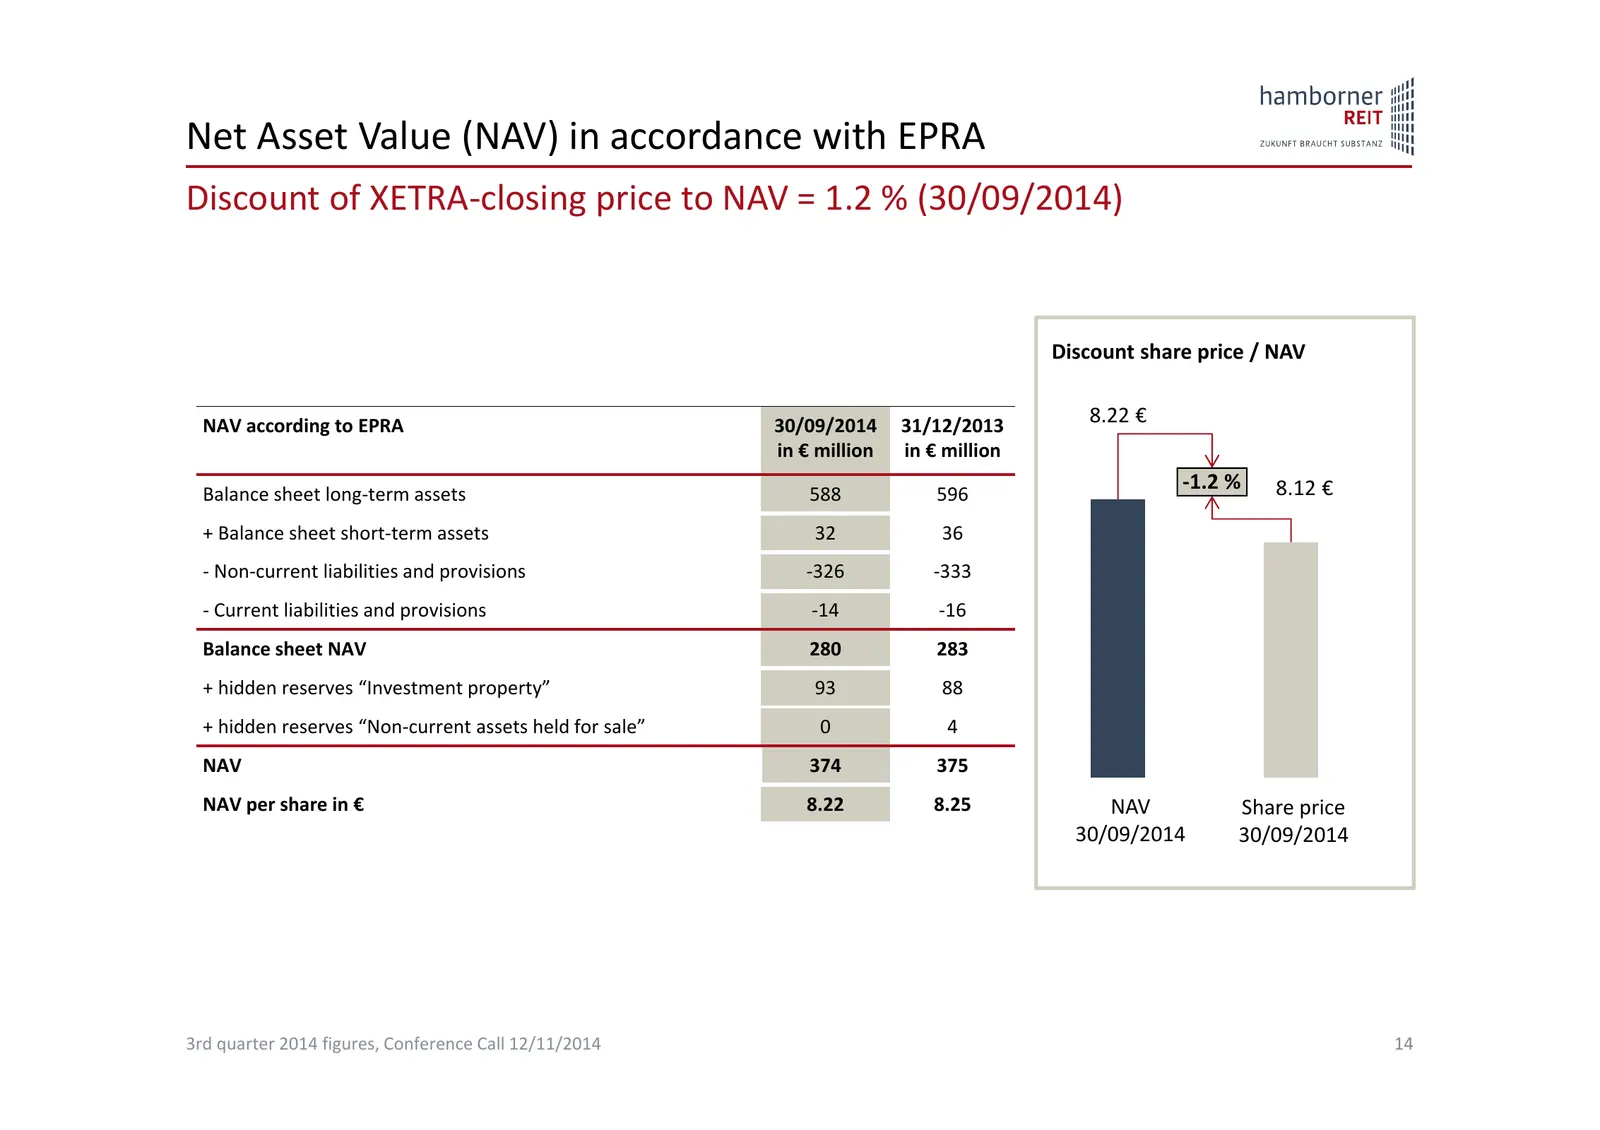
Slide 14: Net Asset Value (NAV) in accordance with EPRA
Net Asset Value (NAV) in accordance with EPRA Discount of XETRA‐closing price to NAV = 1.2 % (30/09/2014) Discount share price / NAV NAV according to EPRA 30/09/2014 31/12/2013 8.22 € in € million in € million ‐1.2 % 8.12 € Balance sheet long‐term assets 588 596 + Balance sheet short‐term assets 32
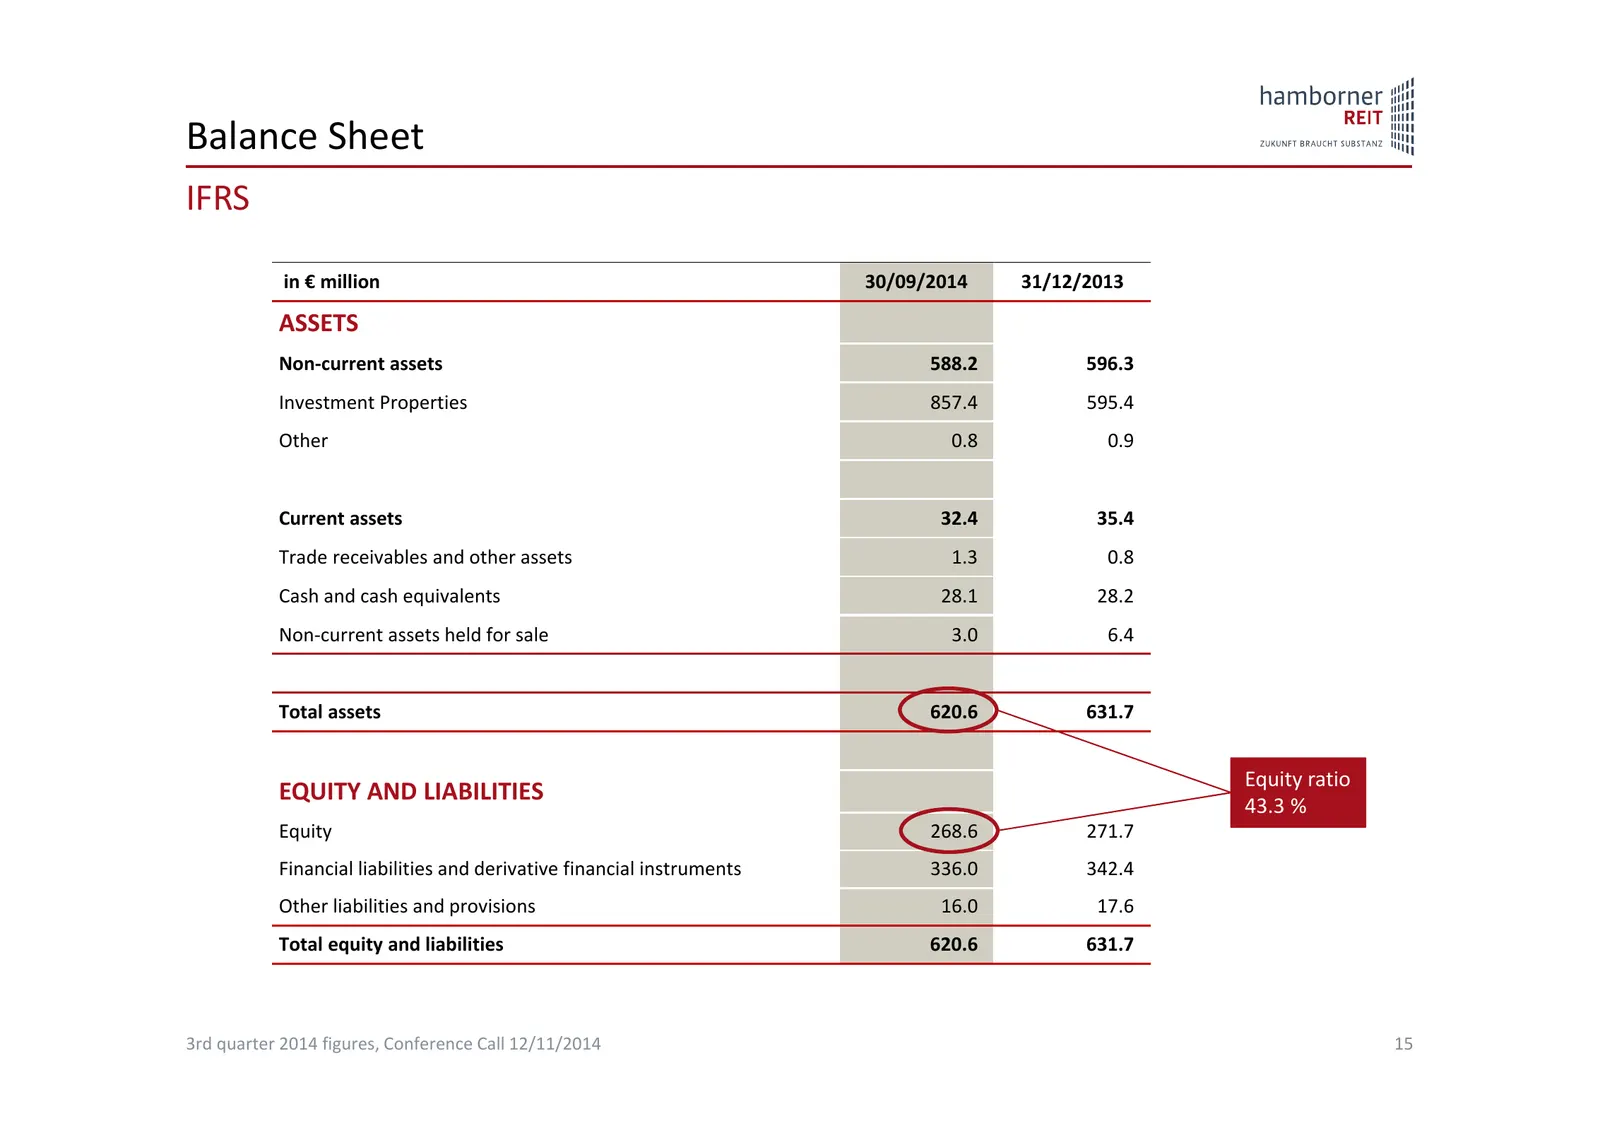
Slide 15: Balance Sheet IFRS
Balance Sheet IFRS in € million 30/09/2014 31/12/2013 ASSETS Non‐current assets 588.2 596.3 Investment Properties 857.4 595.4 Other 0.8 0.9 Current assets 32.4 35.4 Trade receivables and other assets 1.3 0.8 Cash and cash equivalents 28.1 28.2 Non‐current assets held for sale 3.0 6.4 Total assets 62
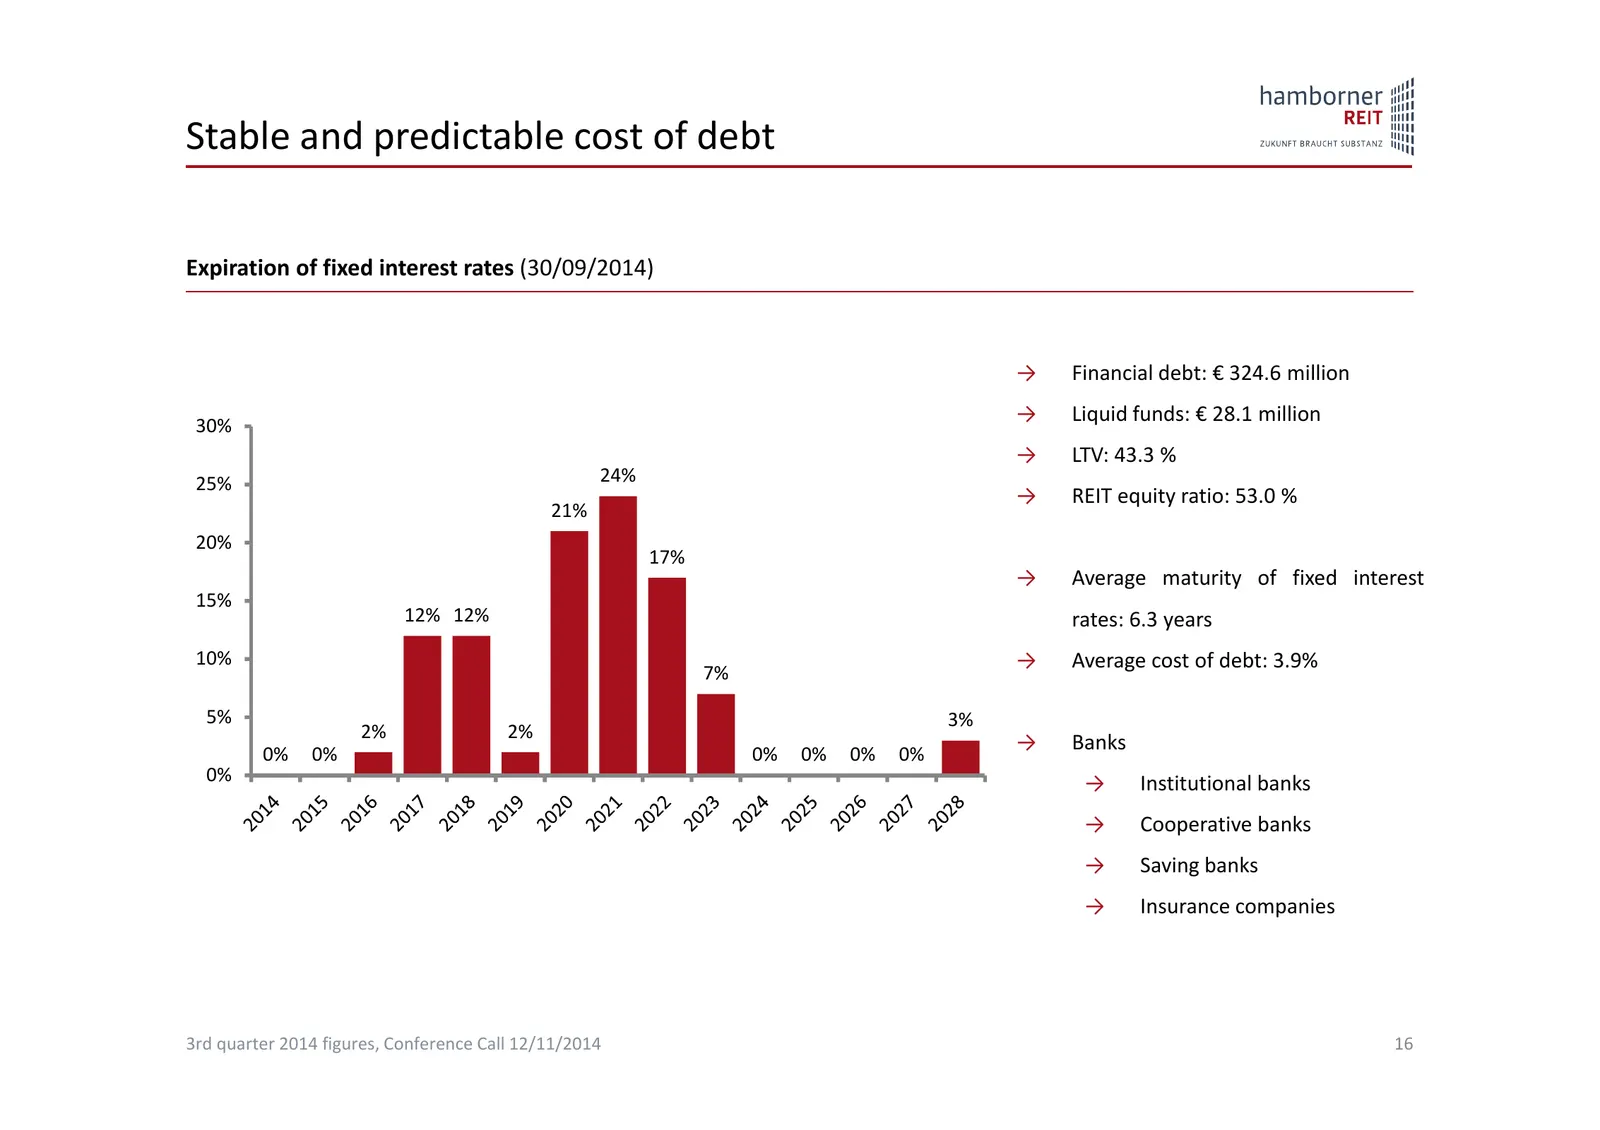
Slide 16: Stable and predictable cost of debt
Stable and predictable cost of debt Expiration of fixed interest rates (30/09/2014) → Financial debt: € 324.6 million 30% → Liquid funds: € 28.1 million → LTV: 43.3 % 25% 24% → REIT equity ratio: 53.0 % 21% 20% 17% → Average maturity of fixed interest 15% 12% 12% rates: 6.3 years 10% → Average cost
Slide 17: Conclusion and outlook
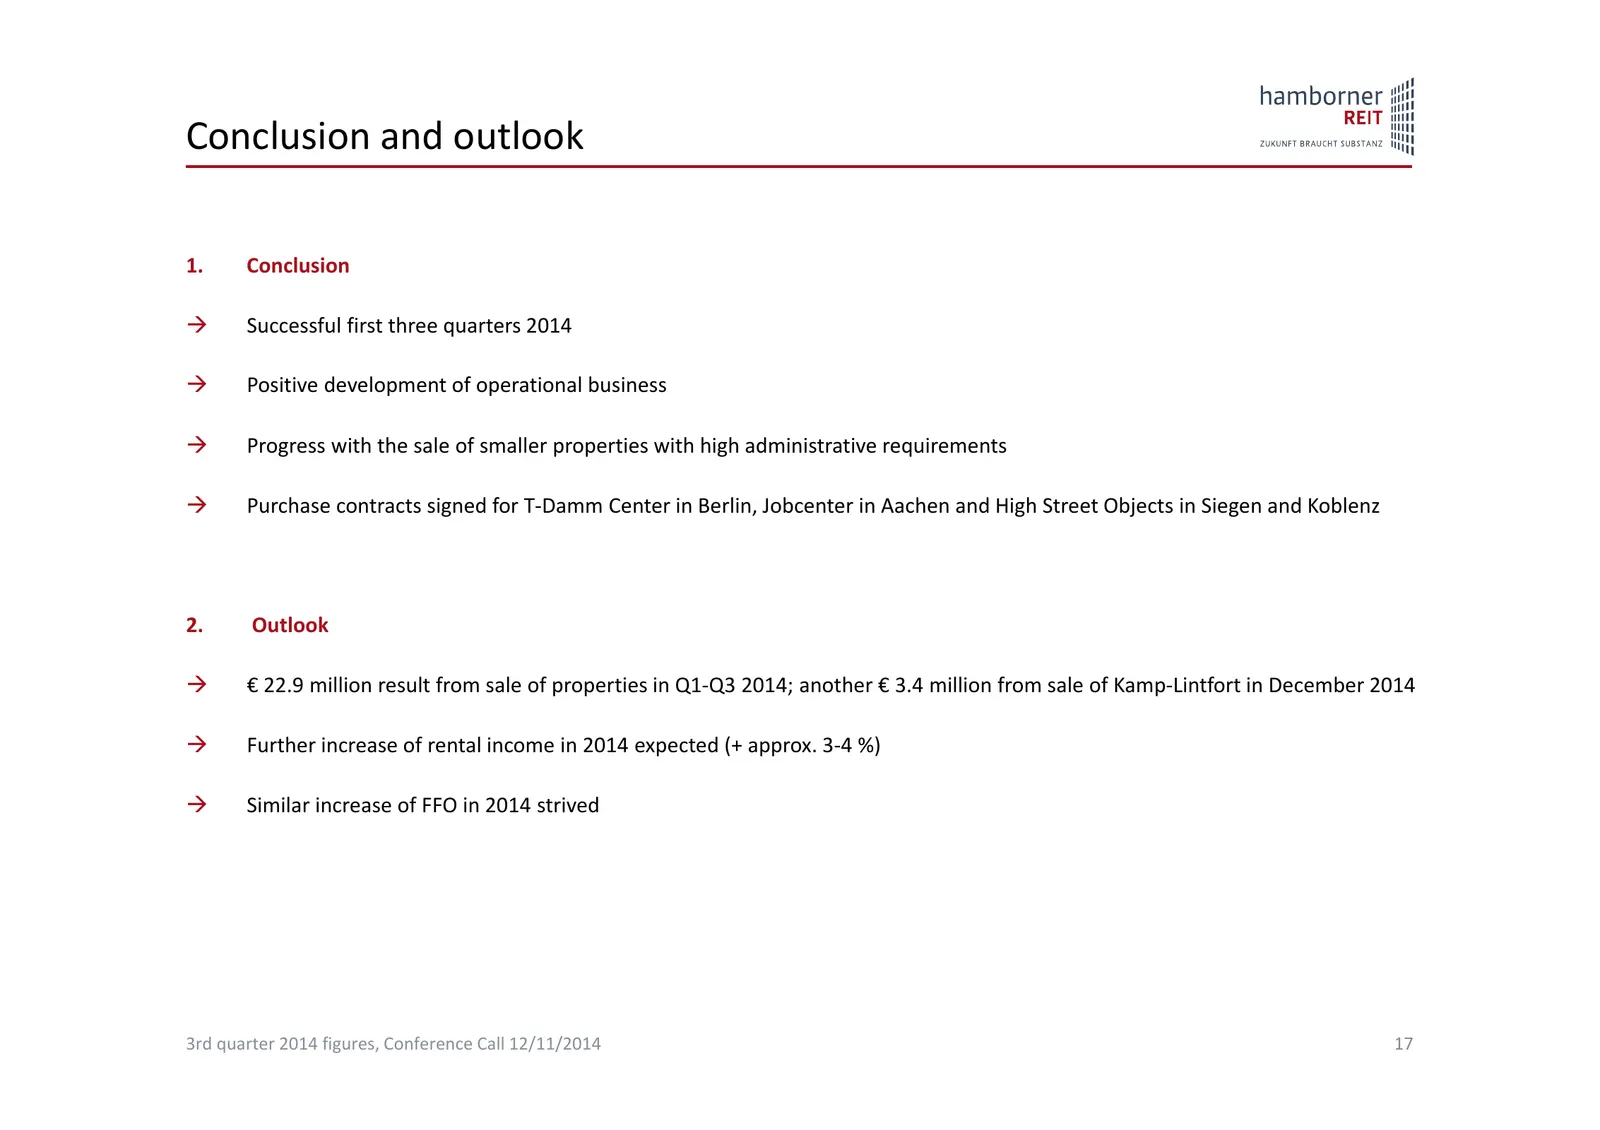
Conclusion and outlook 1. Conclusion Successful first three quarters 2014 Positive development of operational business Progress with the sale of smaller properties with high administrative requirements Purchase contracts signed for T‐Damm Center in Berlin, Jobcenter in Aachen and High Street
Slide 18: Financial Calendar
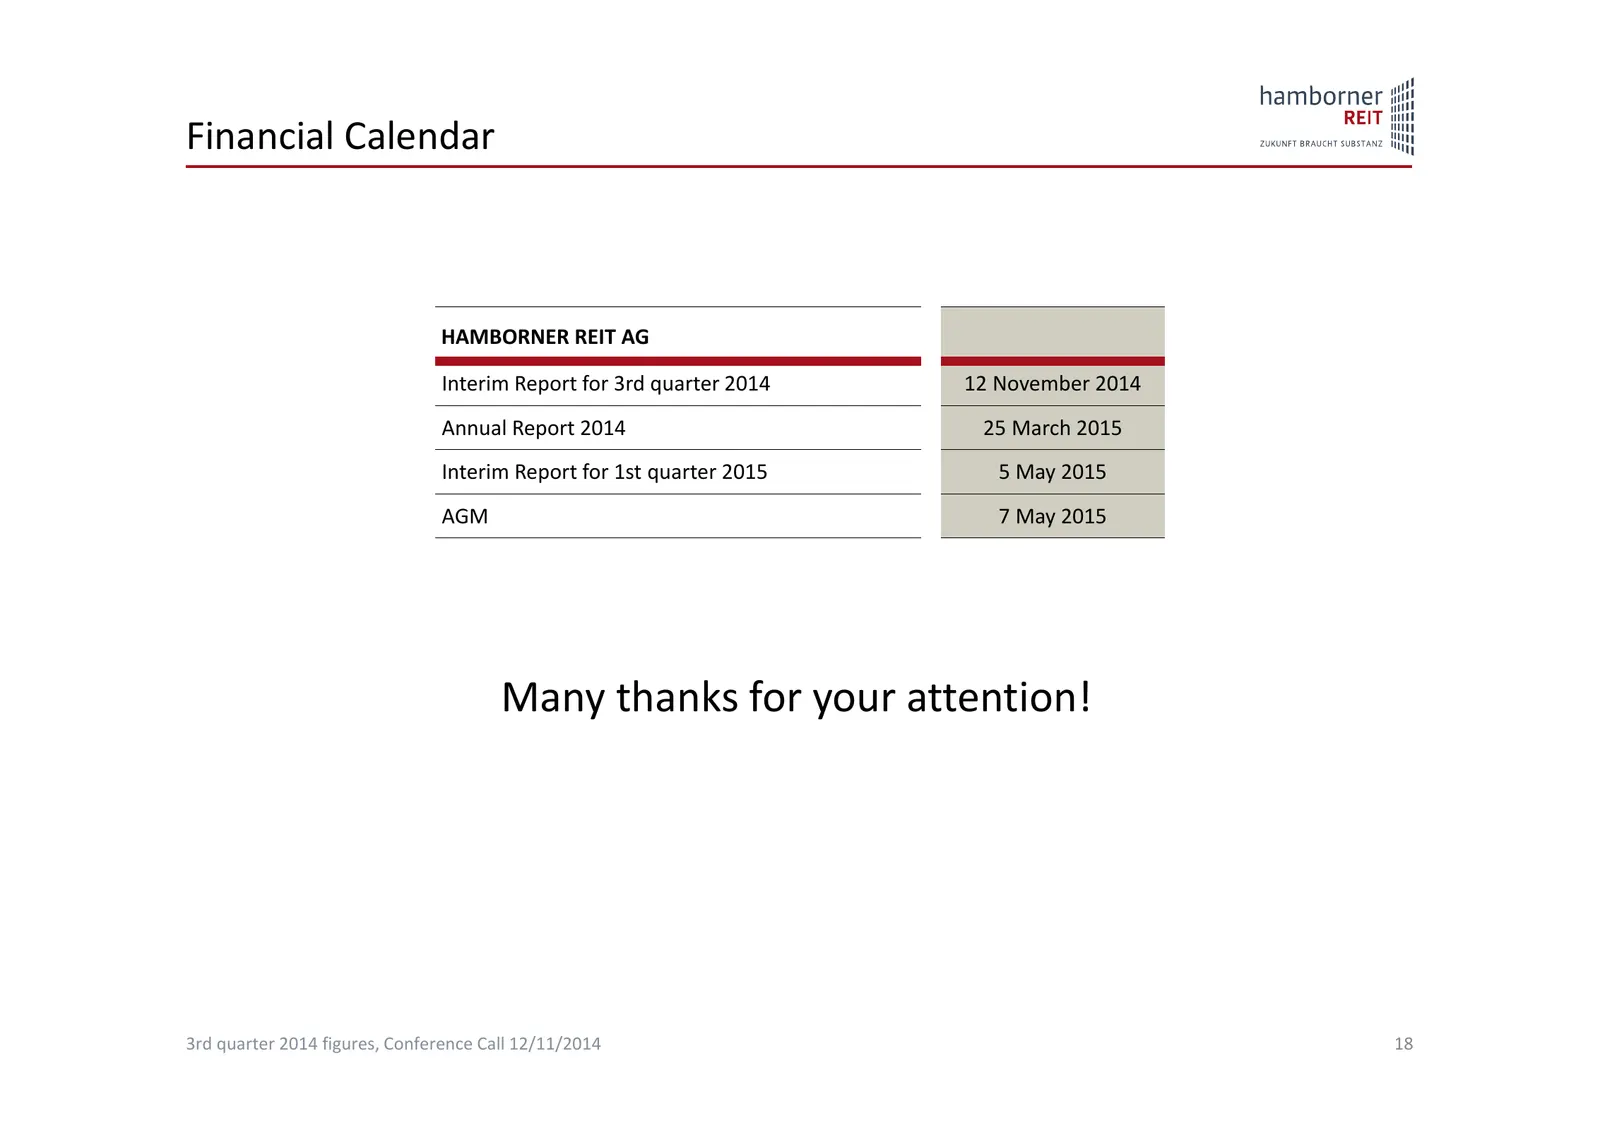
Financial Calendar HAMBORNER REIT AG Interim Report for 3rd quarter 2014 12 November 2014 Annual Report 2014 25 March 2015 Interim Report for 1st quarter 2015 5 May 2015 AGM 7 May 2015 Many thanks for your attention! 3rd quarter 2014 figures, Conference Call 12/11/2014 18
Slide 19: Disclaimer
Disclaimer This presentation was exclusively prepared for the addresses specified on the title page and/or the participants at the mentioned event. The information in this presentation is based on both public information and documents as well as information which was made available to HAMBORNER REIT
Source: Internet Archive copy of hamborner.de
More decks from Hamborner REIT AG
 9M 2026 Earnings Presentation10 slides · Nov 10, 2026
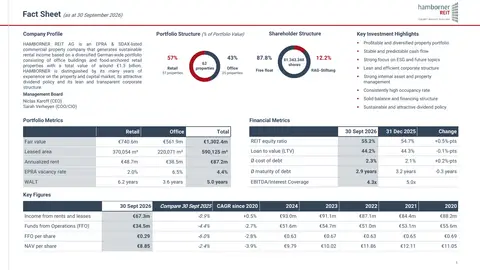 Fact Sheet (November 2026)2 slides · November 2026
 Investor Presentation (November 2026)35 slides · November 2026
 Investor Presentation (November 2026)35 slides · November 2026
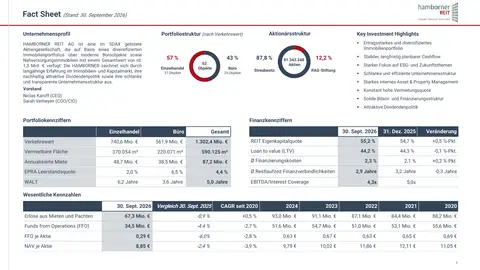 Fact Sheet (September 2026)2 slides · Sep 30, 2026
 Investor Presentation (September 2026)36 slides · September 2026