Chugai Pharmaceutical Co., Ltd. · TSE:4519
Chugai Pharmaceutical — Q3 2015 Earnings Presentation
22 slides from Chugai Pharmaceutical's earnings presentation, Oct 22, 2015
Slide 1: FY2015 3Q Consolidated Financial Overview (IFRS based)
FY2015 3Q Consolidated Financial Overview (IFRS based) CHUGAI PHARMACEUTICAL CO., LTD. Vice President General Manager of Finance & Accounting Dept. Toshiaki Itagaki October 22, 2015
Slide 2: Forward-Looking Statements
FY2015 3Q Consolidated Financial Overview Forward-Looking Statements This presentation may include forward-looking statements pertaining to the business and prospects of Chugai Pharmaceutical Co., Ltd. (the “Company”). These statements reflect the Company’s current analysis of existing information a
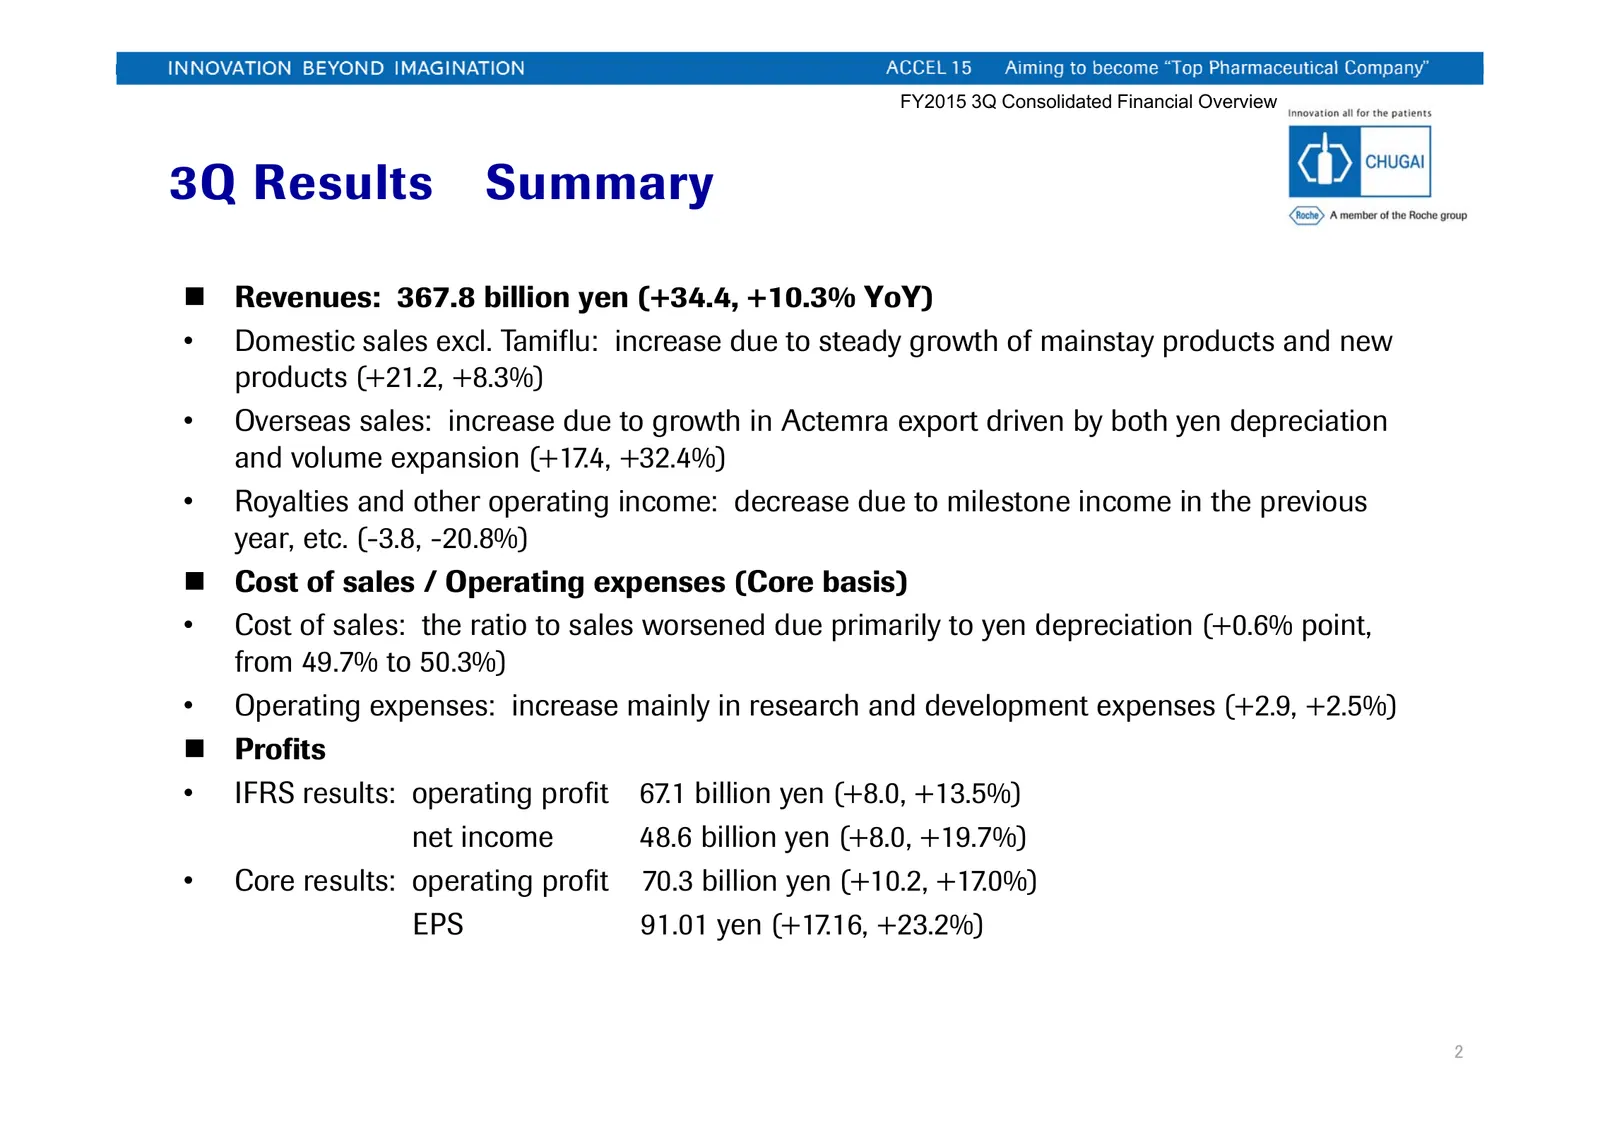
Slide 3: 3Q Results Summary
FY2015 3Q Consolidated Financial Overview 3Q Results Summary Revenues: 367.8 billion yen (+34.4, +10.3% YoY) • Domestic sales excl. Tamiflu: increase due to steady growth of mainstay products and new products (+21.2, +8.3%) • Overseas sales: increase due to growth in Actemra export driven by both
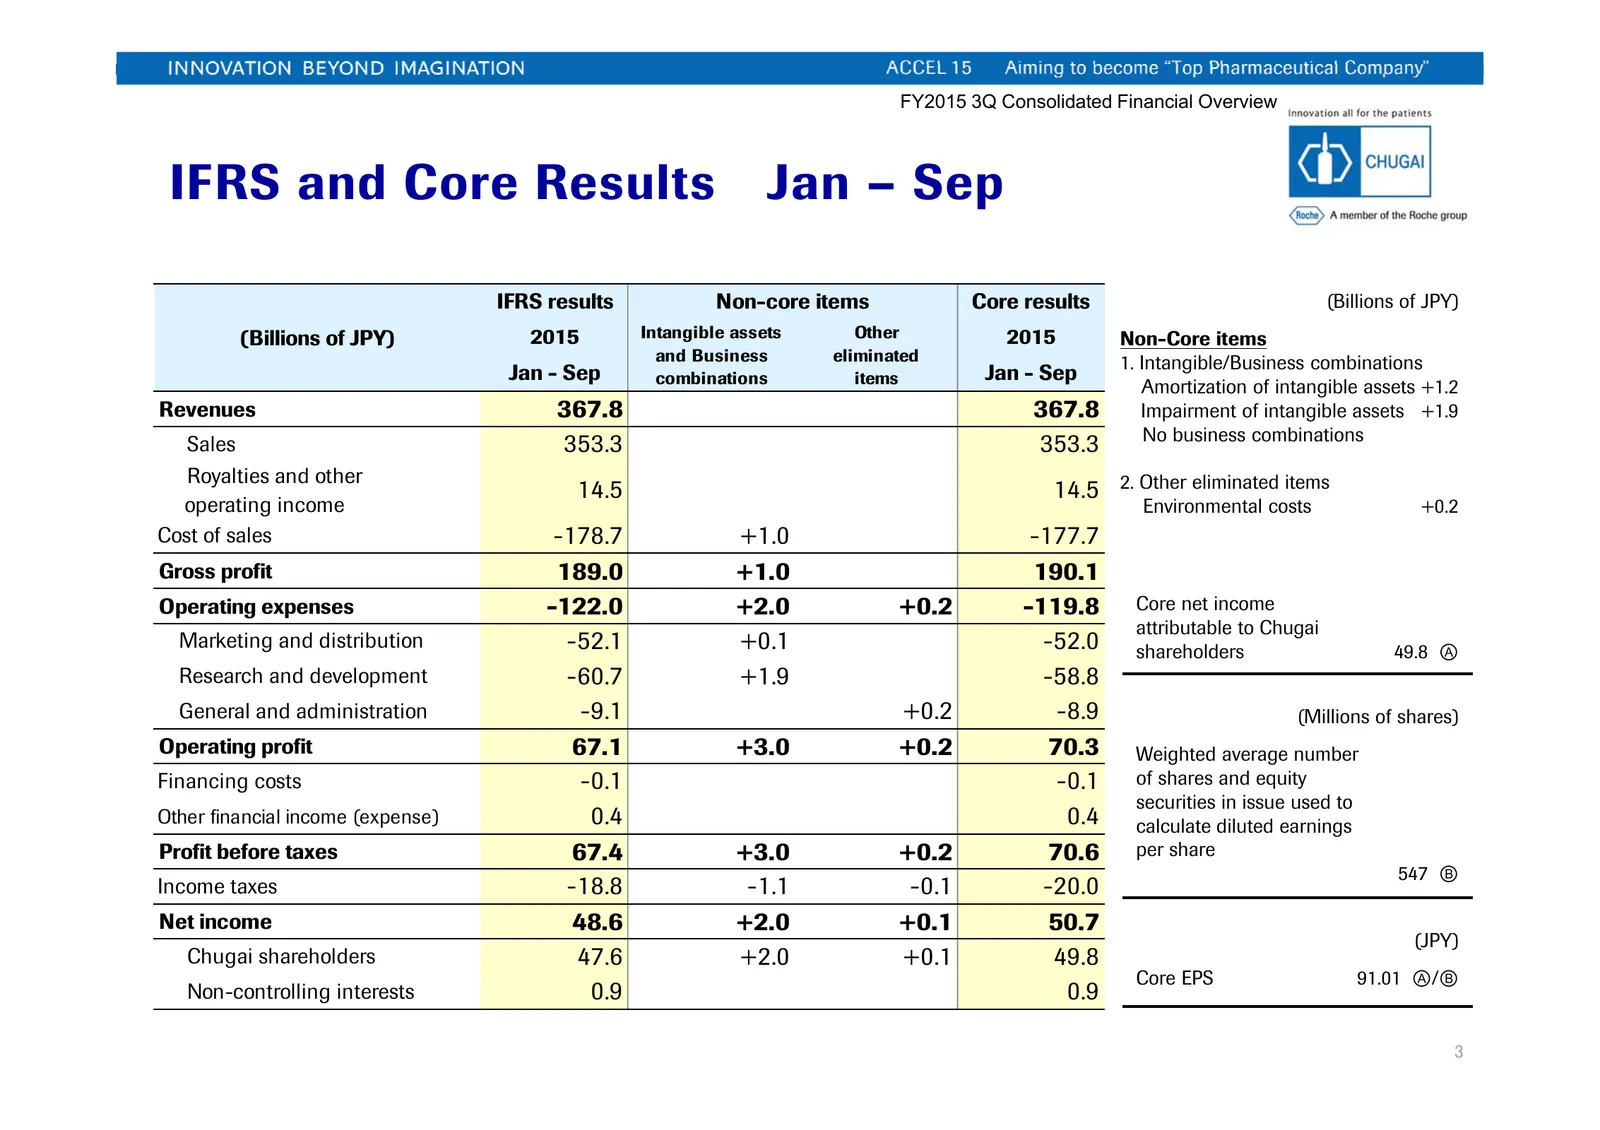
Slide 4: IFRS and Core Results Jan – Sep
FY2015 3Q Consolidated Financial Overview IFRS and Core Results Jan – Sep IFRS results Non-core items Core results (Billions of JPY) (Billions of JPY) 2015 Intangible assets Other 2015 Non-Core items and Business eliminated 1. Intangible/Business combinations Jan - Sep combinations items Jan - Sep A
Slide 5: Financial Overview Jan – Sep
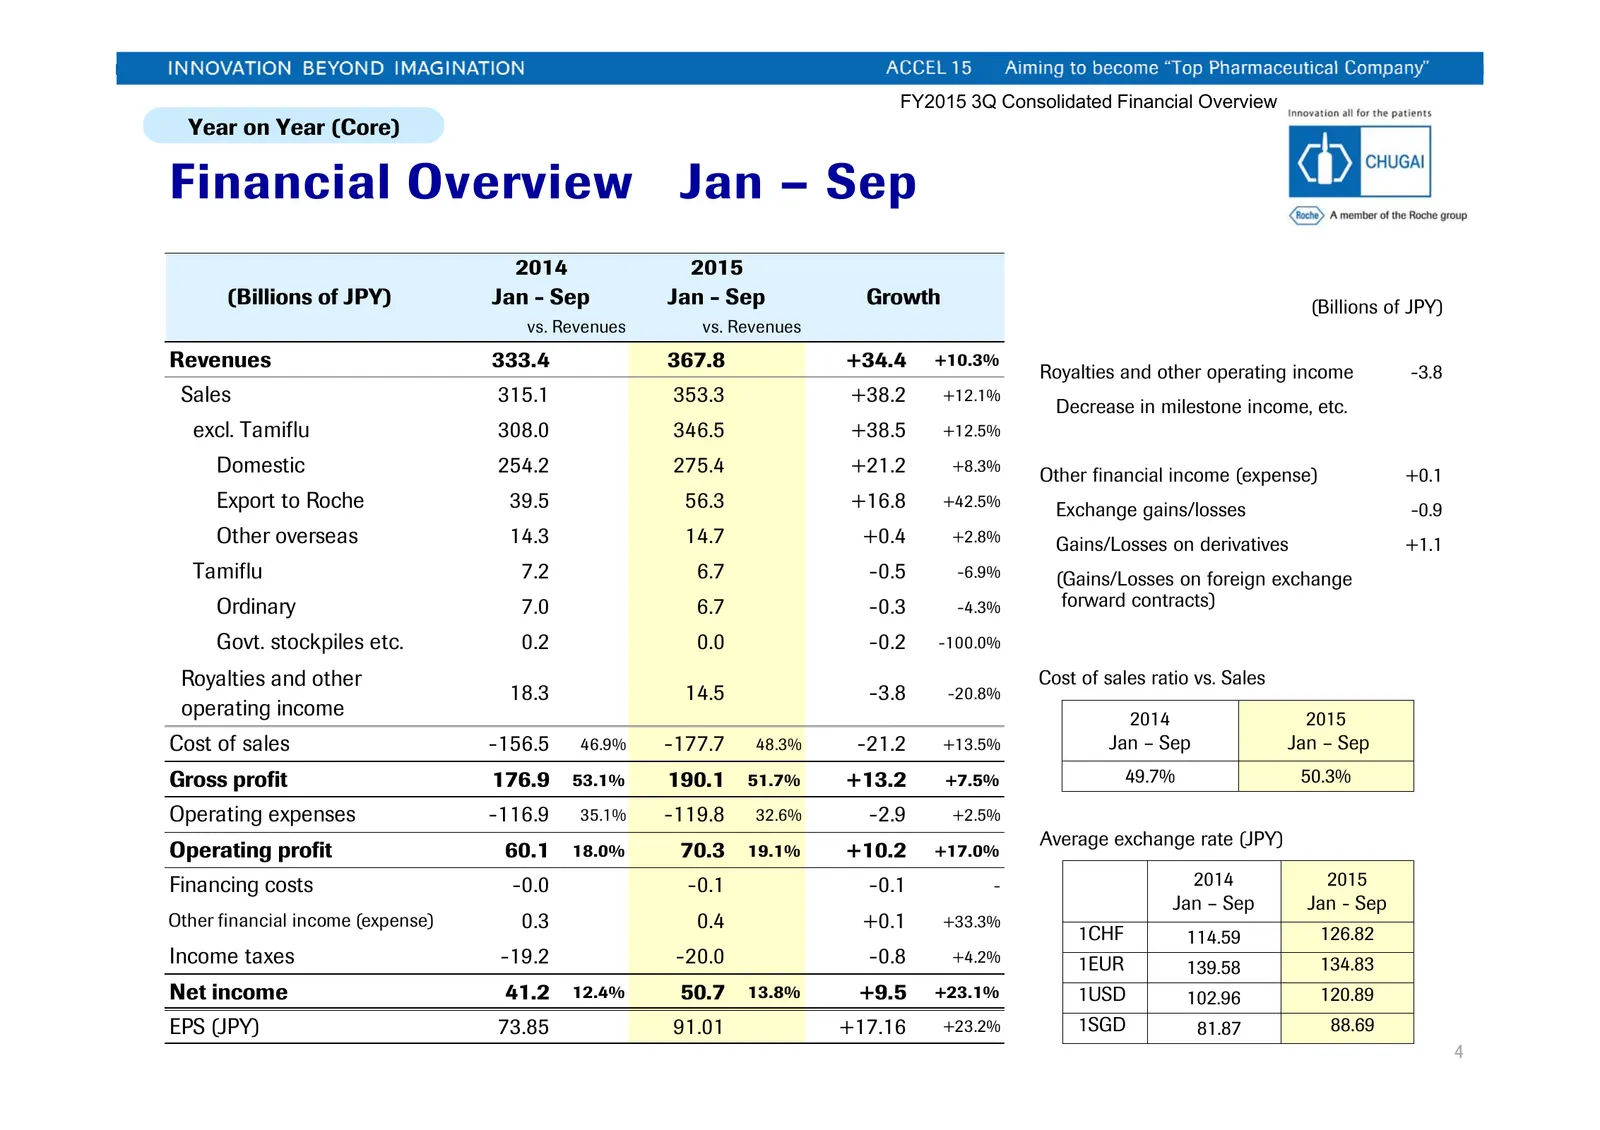
FY2015 3Q Consolidated Financial Overview Year on Year (Core) Financial Overview Jan – Sep 2014 2015 (Billions of JPY) Jan - Sep Jan - Sep Growth (Billions of JPY) vs. Revenues vs. Revenues Revenues 333.4 367.8 +34.4 +10.3% Royalties and other operating income -3.8 Sales 315.1 353.3 +38.2 +12.1% Dec
Slide 6: Sales (excl. Tamiflu) Jan – Sep
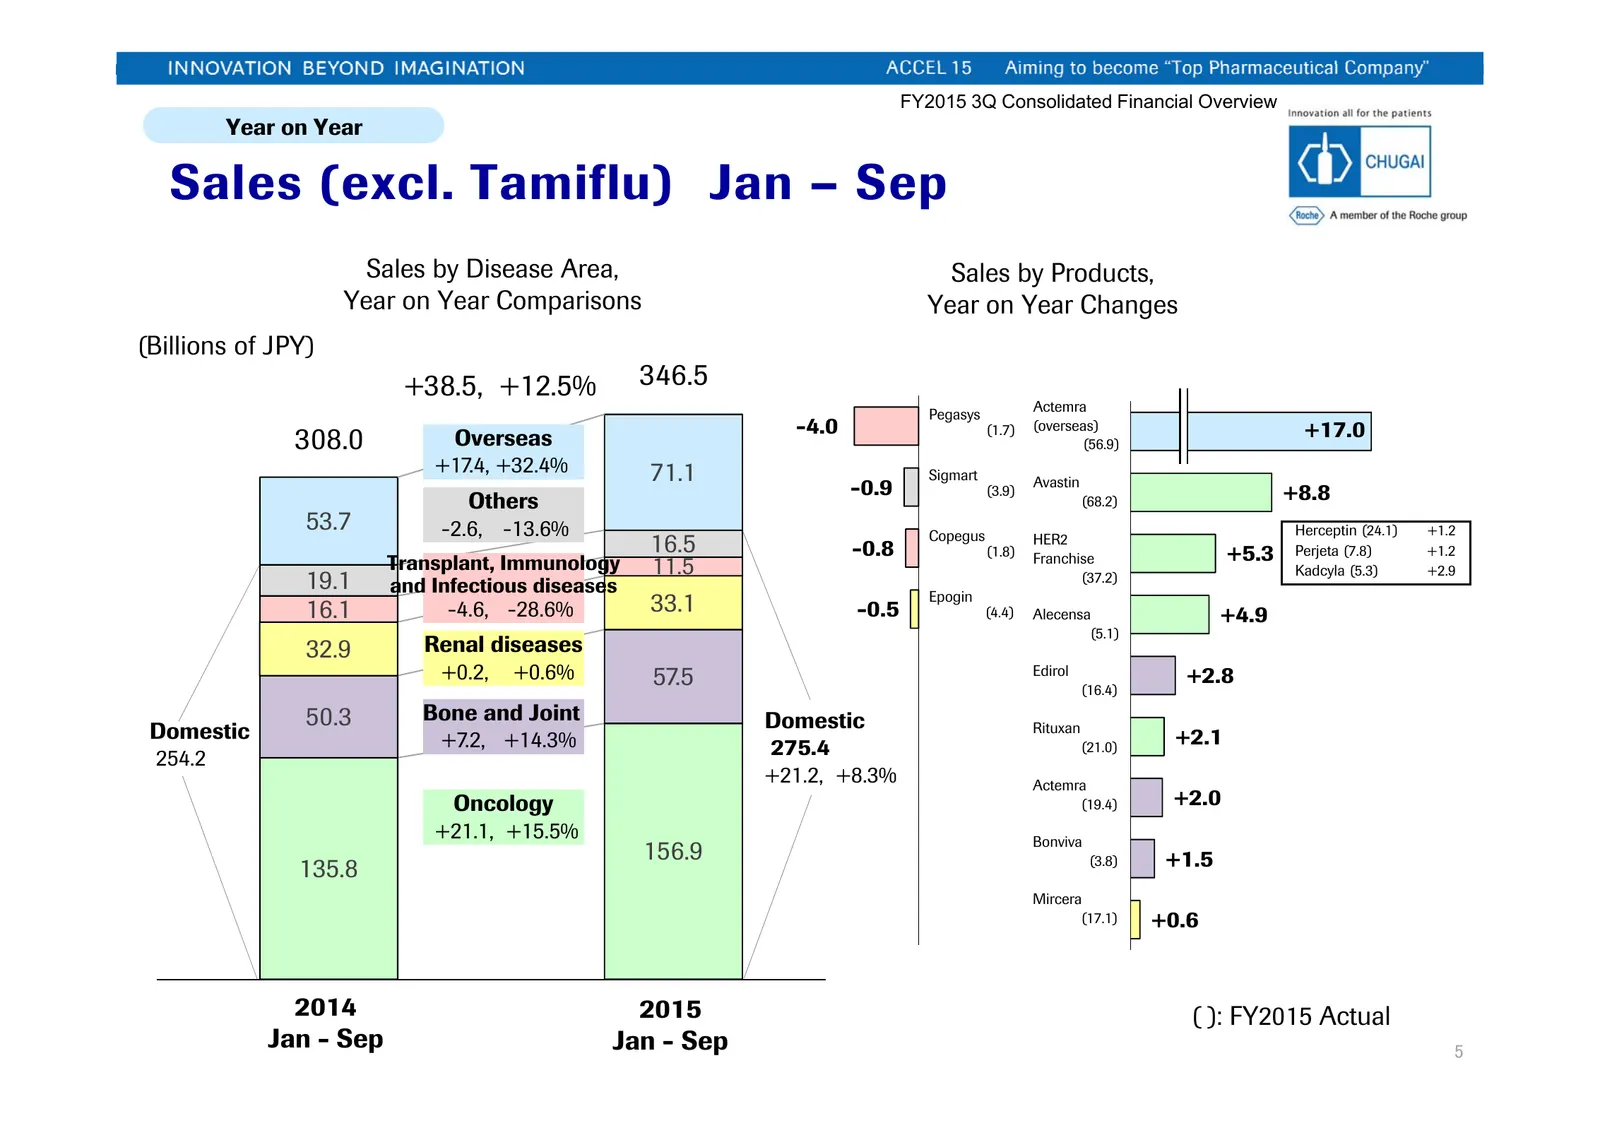
FY2015 3Q Consolidated Financial Overview Year on Year Sales (excl. Tamiflu) Jan – Sep Sales by Disease Area, Sales by Products, Year on Year Comparisons Year on Year Changes (Billions of JPY) +38.5, +12.5% 346.5 Actemra Pegasys -4.0 (1.7) (overseas) +17.0 308.0 Overseas (56.9) +17.4, +32.4% 71.1 Si
Slide 7: Tamiflu Sales Performance
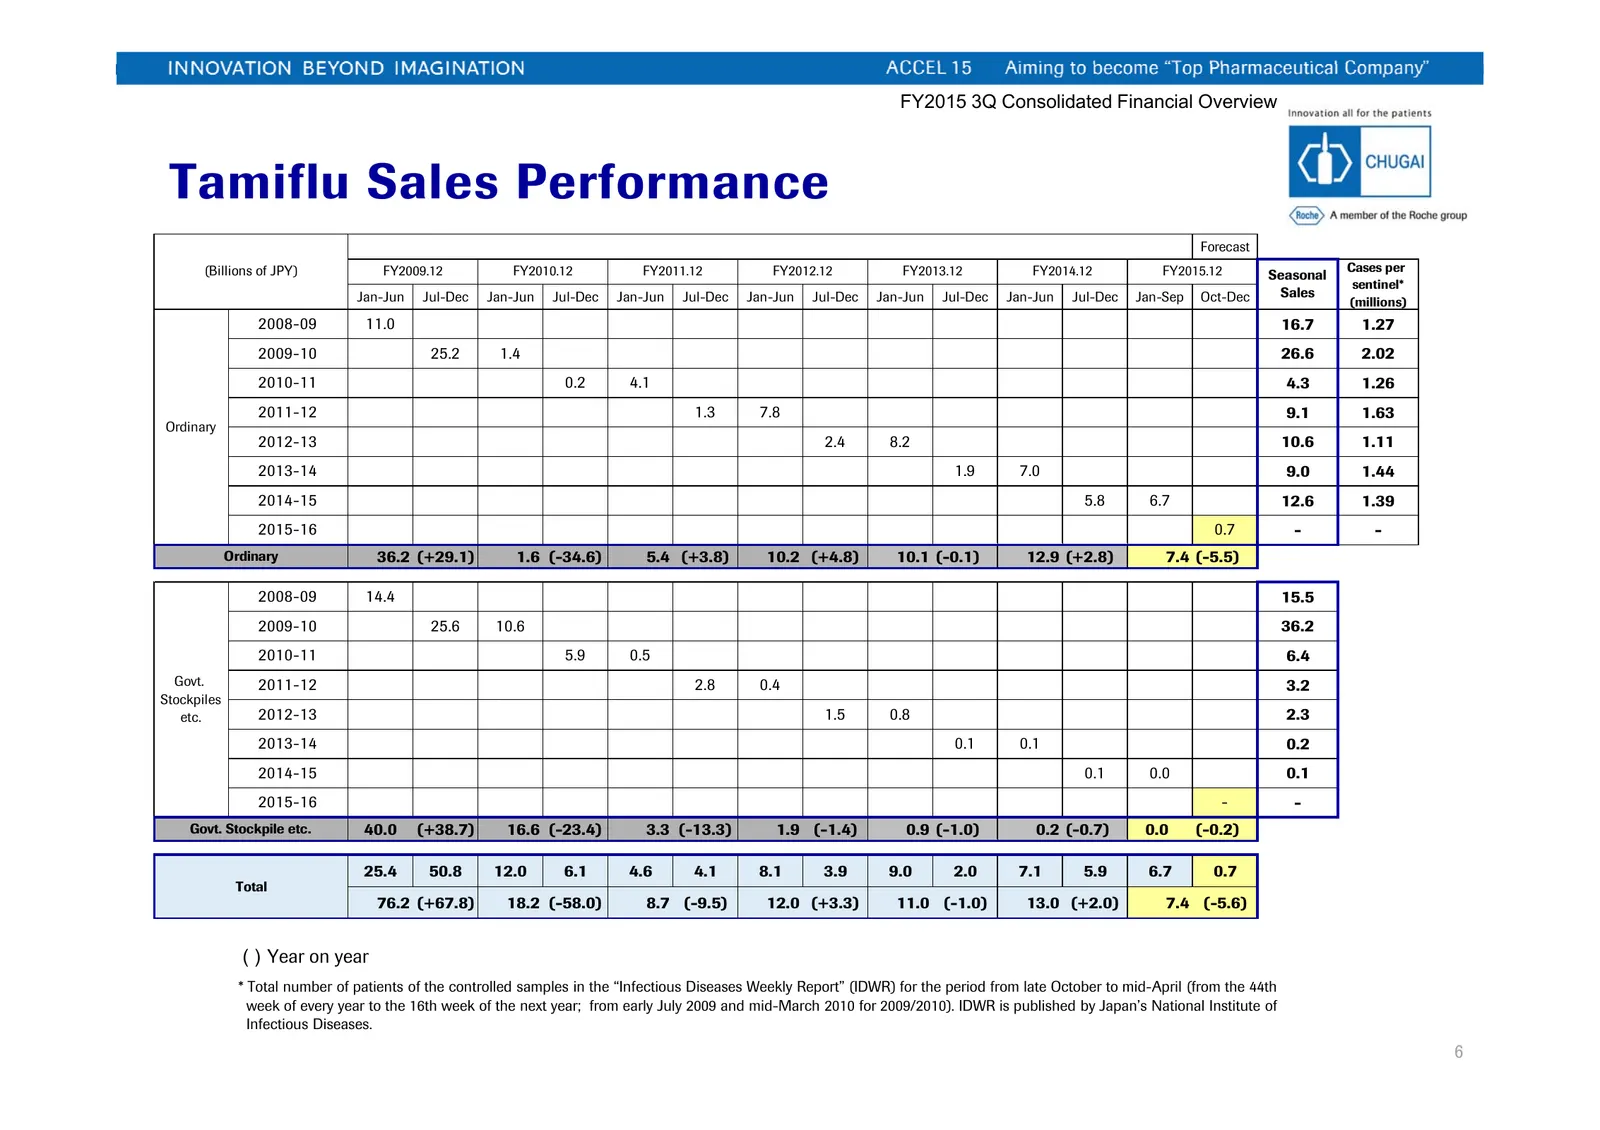
FY2015 3Q Consolidated Financial Overview Tamiflu Sales Performance Forecast (Billions of JPY) FY2009.12 FY2010.12 FY2011.12 FY2012.12 FY2013.12 FY2014.12 FY2015.12 Cases per Seasonal sentinel* Jan-Jun Jul-Dec Jan-Jun Jul-Dec Jan-Jun Jul-Dec Jan-Jun Jul-Dec Jan-Jun Jul-Dec Jan-Jun Jul-Dec Jan-Sep Oc
Slide 8: Operating Profit Jan – Sep
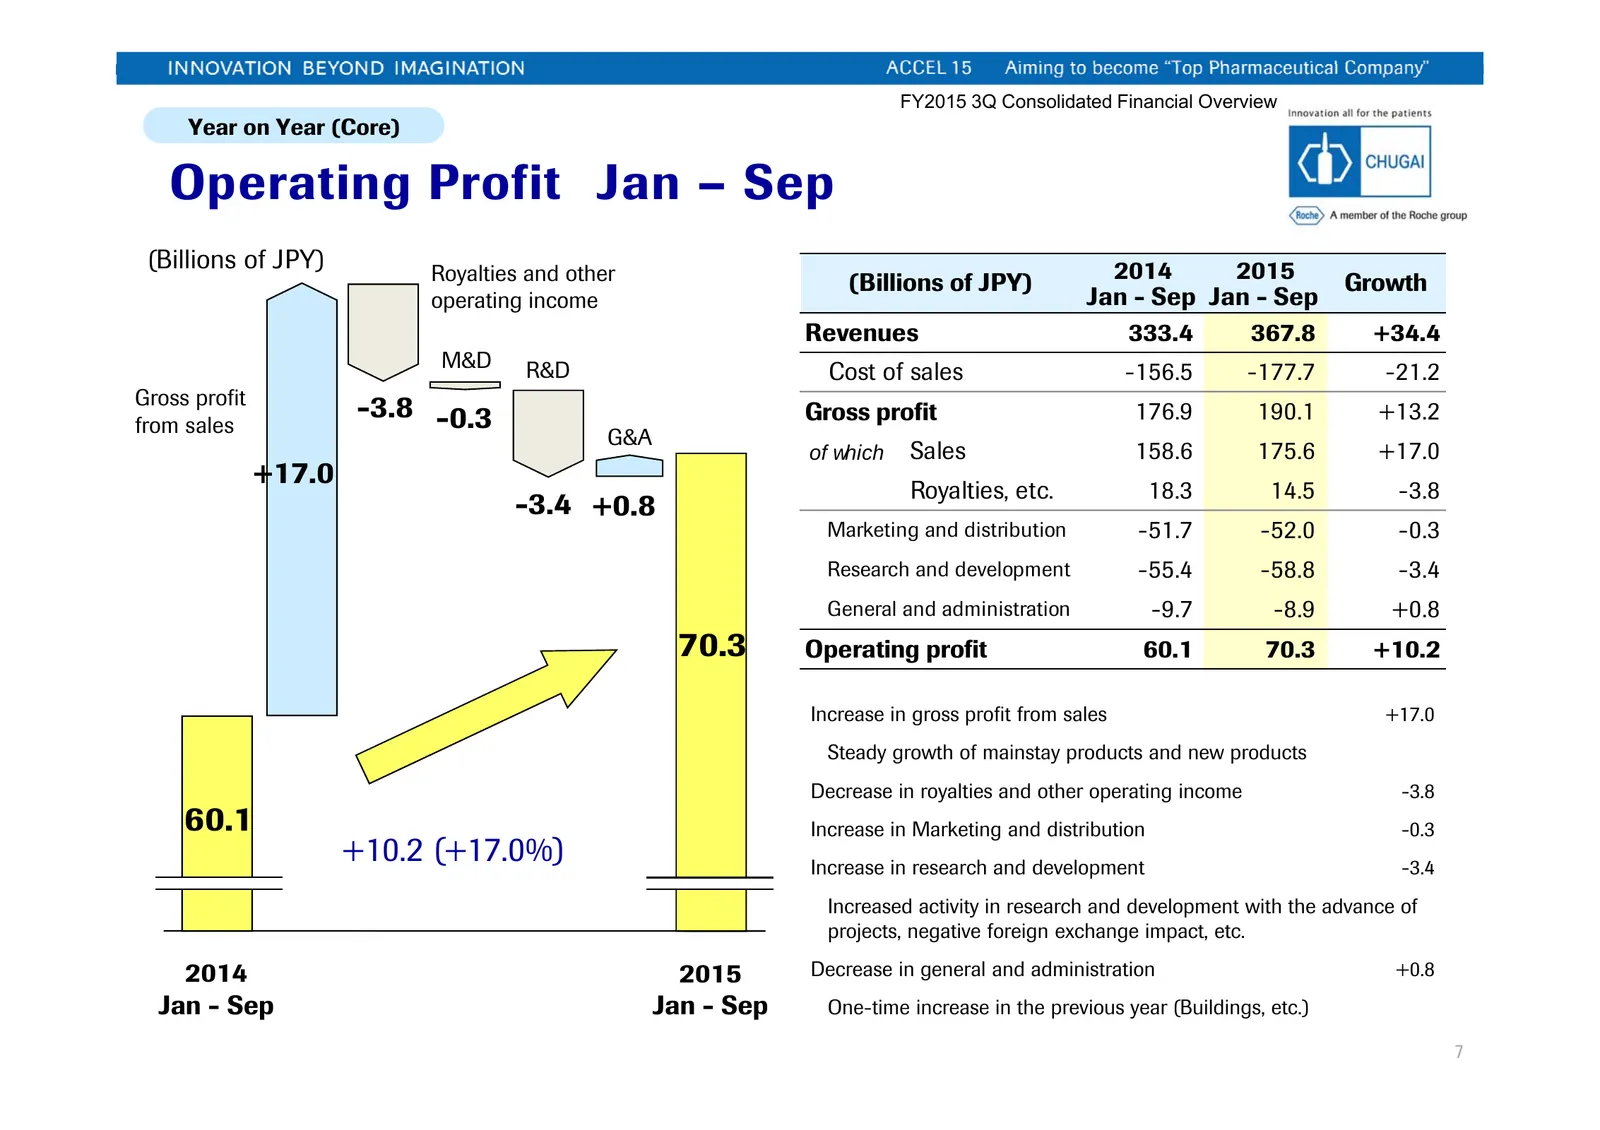
FY2015 3Q Consolidated Financial Overview Year on Year (Core) Operating Profit Jan – Sep (Billions of JPY) Royalties and other 2014 2015 (Billions of JPY) Growth operating income Jan - Sep Jan - Sep Revenues 333.4 367.8 +34.4 M&D R&D Cost of sales -156.5 -177.7 -21.2 Gross profit -3.8 -0.3 Gross pro
Slide 9: Financial Overview Jul – Sep
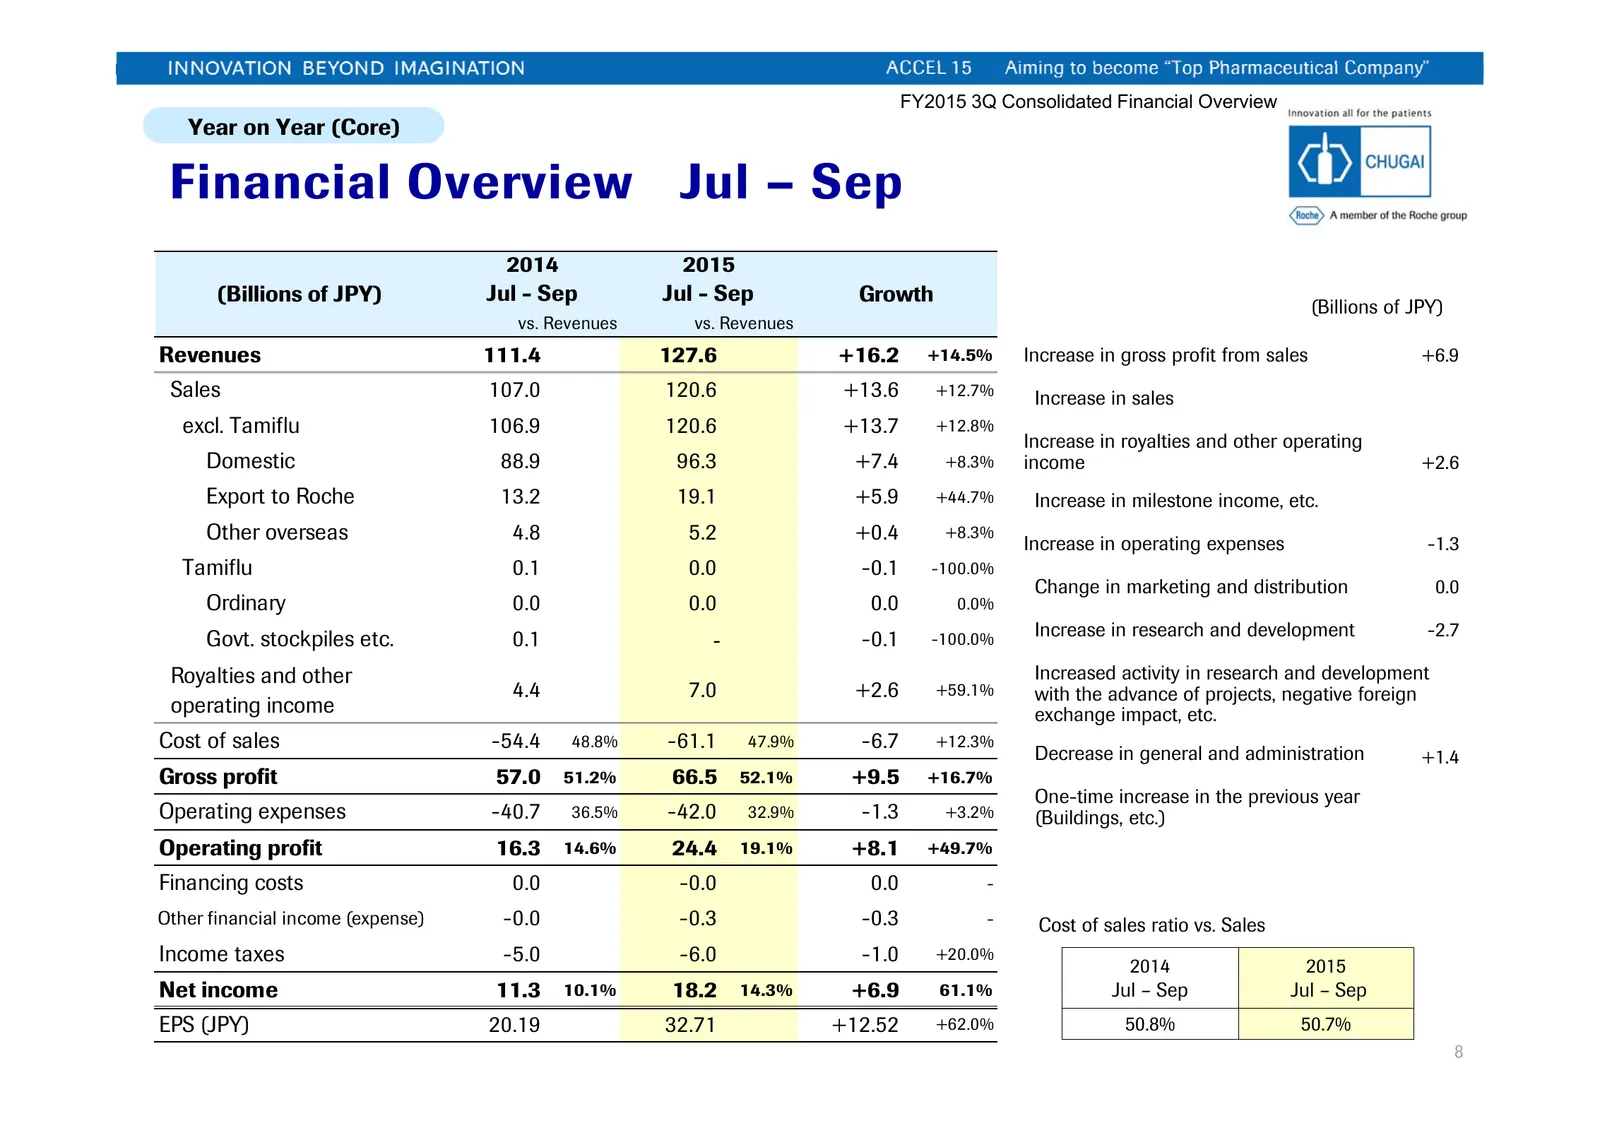
FY2015 3Q Consolidated Financial Overview Year on Year (Core) Financial Overview Jul – Sep 2014 2015 (Billions of JPY) Jul - Sep Jul - Sep Growth (Billions of JPY) vs. Revenues vs. Revenues Revenues 111.4 127.6 +16.2 +14.5% Increase in gross profit from sales +6.9 Sales 107.0 120.6 +13.6 +12.7% Incr
Slide 10: Financial Progress Jan – Sep
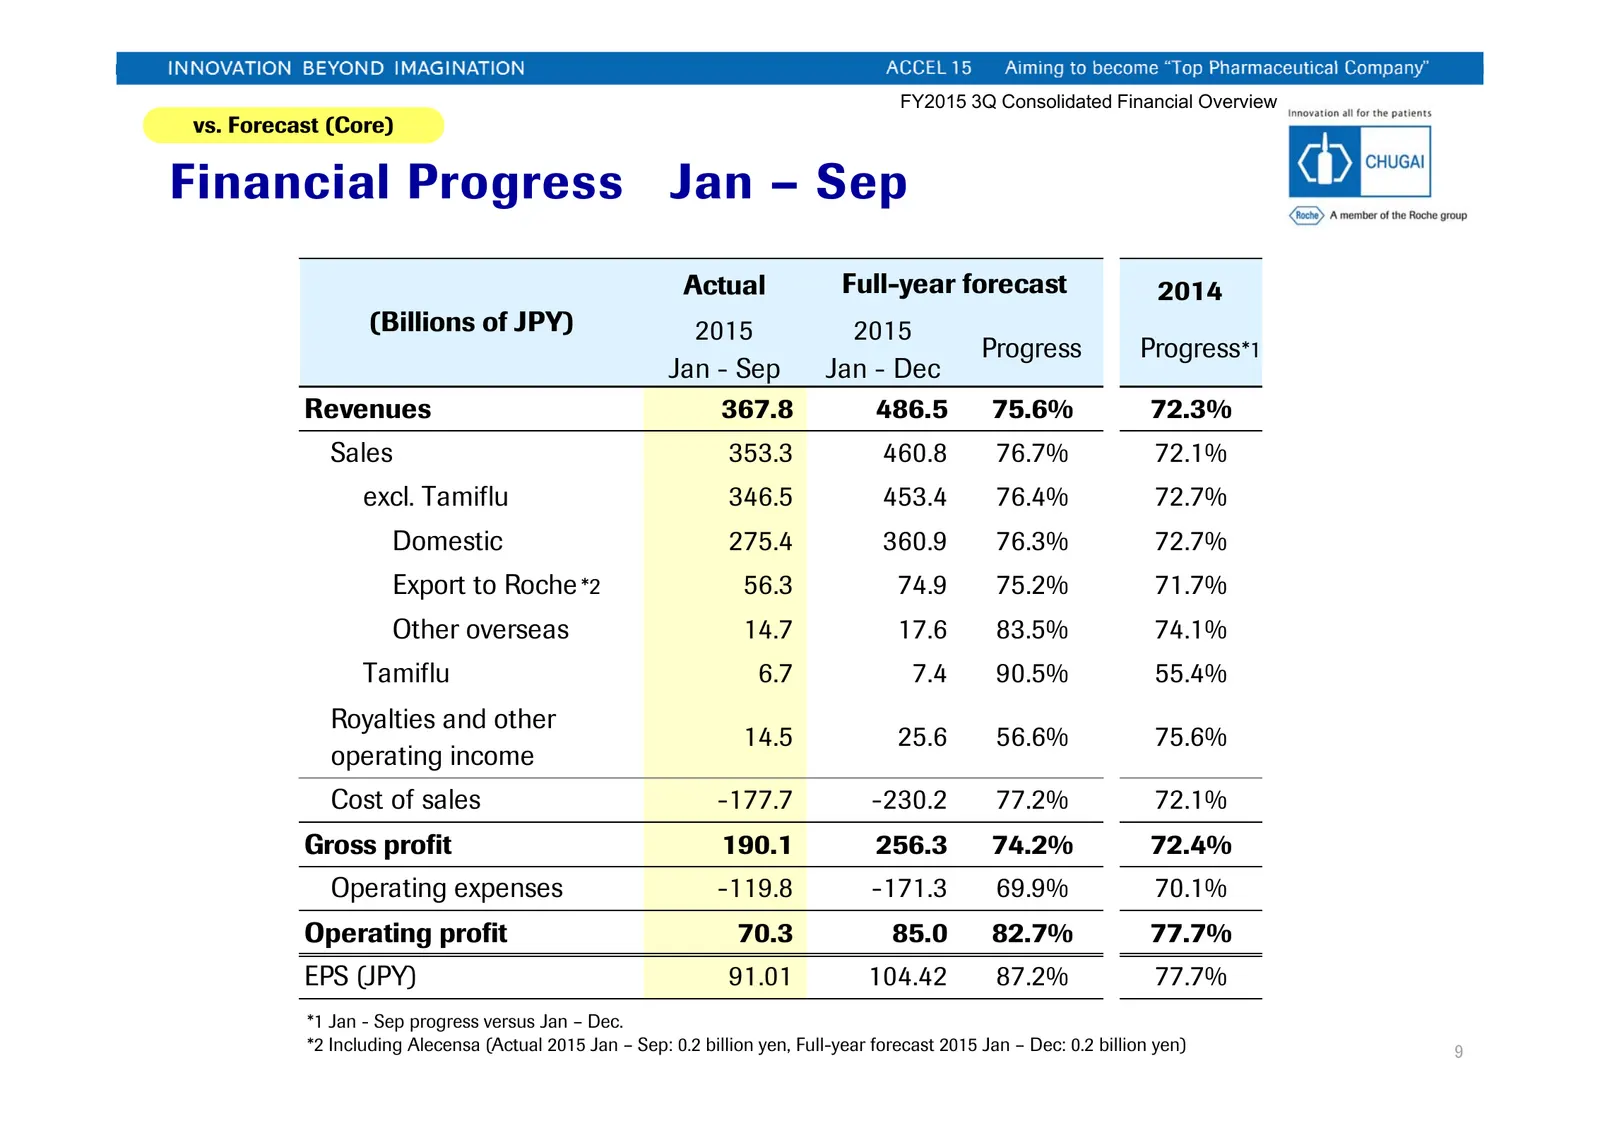
FY2015 3Q Consolidated Financial Overview vs. Forecast (Core) Financial Progress Jan – Sep Actual Full-year forecast 2014 (Billions of JPY) 2015 2015 Progress Progress *1 Jan - Sep Jan - Dec Revenues 367.8 486.5 75.6% 72.3% Sales 353.3 460.8 76.7% 72.1% excl. Tamiflu 346.5 453.4 76.4% 72.7% Domestic
Slide 11: Sales Progress (excl. Tamiflu) Jan – Sep
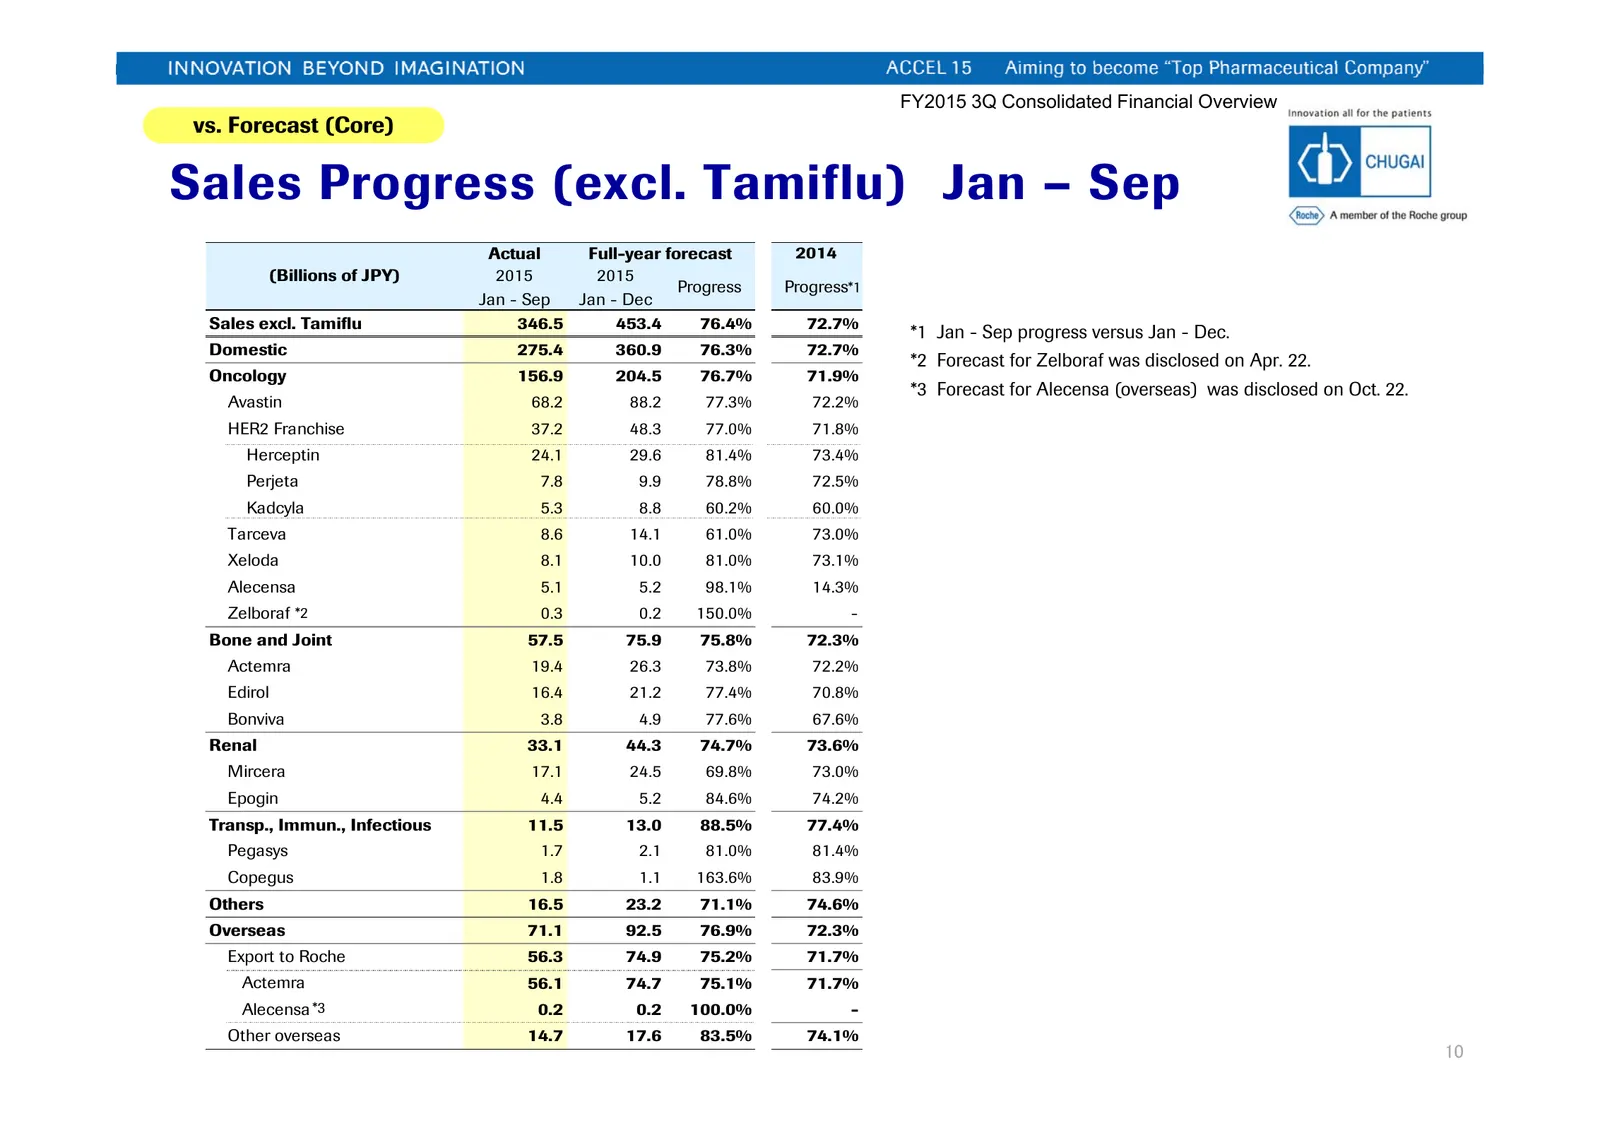
FY2015 3Q Consolidated Financial Overview vs. Forecast (Core) Sales Progress (excl. Tamiflu) Jan – Sep Actual Full-year forecast 2014 (Billions of JPY) 2015 2015 Progress Progress*1 Jan - Sep Jan - Dec Sales excl. Tamiflu 346.5 453.4 76.4% 72.7% *1 Jan - Sep progress versus Jan - Dec. Domestic 275.4
Slide 12: Impact from Foreign Exchange
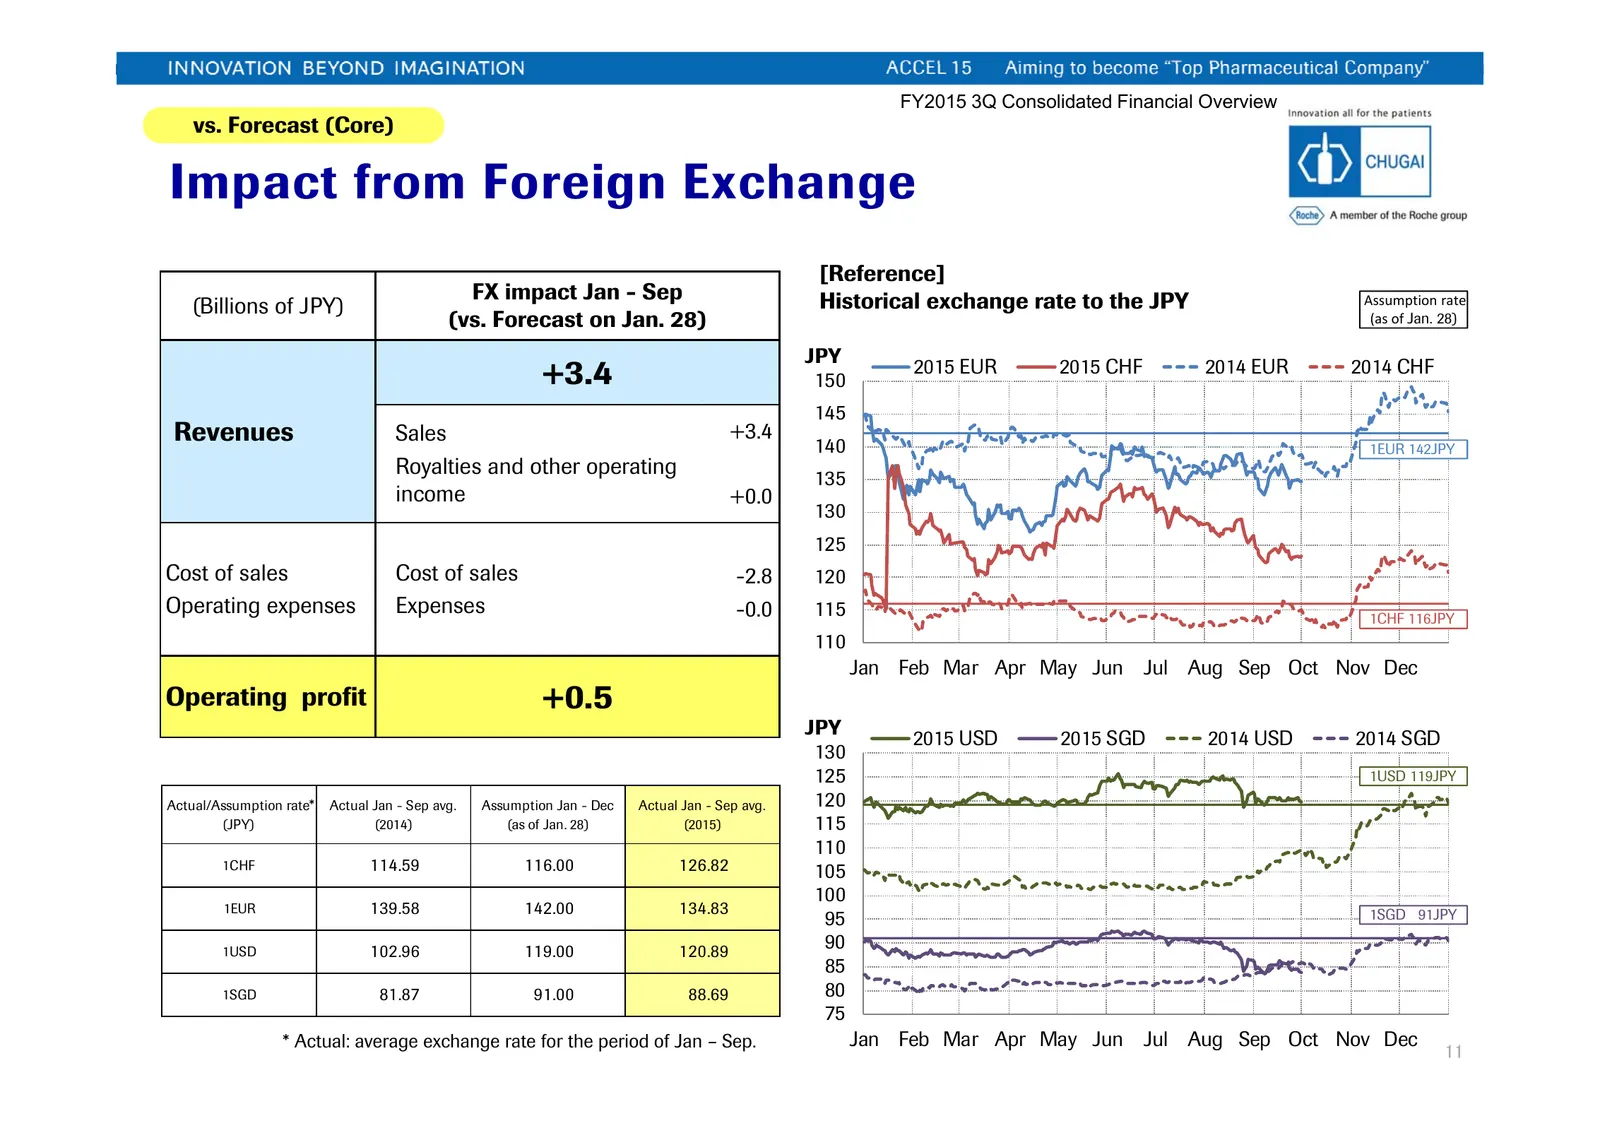
FY2015 3Q Consolidated Financial Overview vs. Forecast (Core) Impact from Foreign Exchange [Reference] FX impact Jan - Sep Historical exchange rate to the JPY Assumption rate (Billions of JPY) (vs. Forecast on Jan. 28) (as of Jan. 28) JPY +3.4 150 2015 EUR 2015 CHF 2014 EUR 2014 CHF 145 Revenues Sal
Slide 13: Overview of Development Pipeline
Overview of Development Pipeline CHUGAI PHARMACEUTICAL CO., LTD. Associate Vice President Deputy Head of Project & Lifecycle Management Unit Department Manager of R&D Portfolio Management Dept. Minoru Watanabe 2015.10.22
Slide 14: Oncology Field Projects under Development
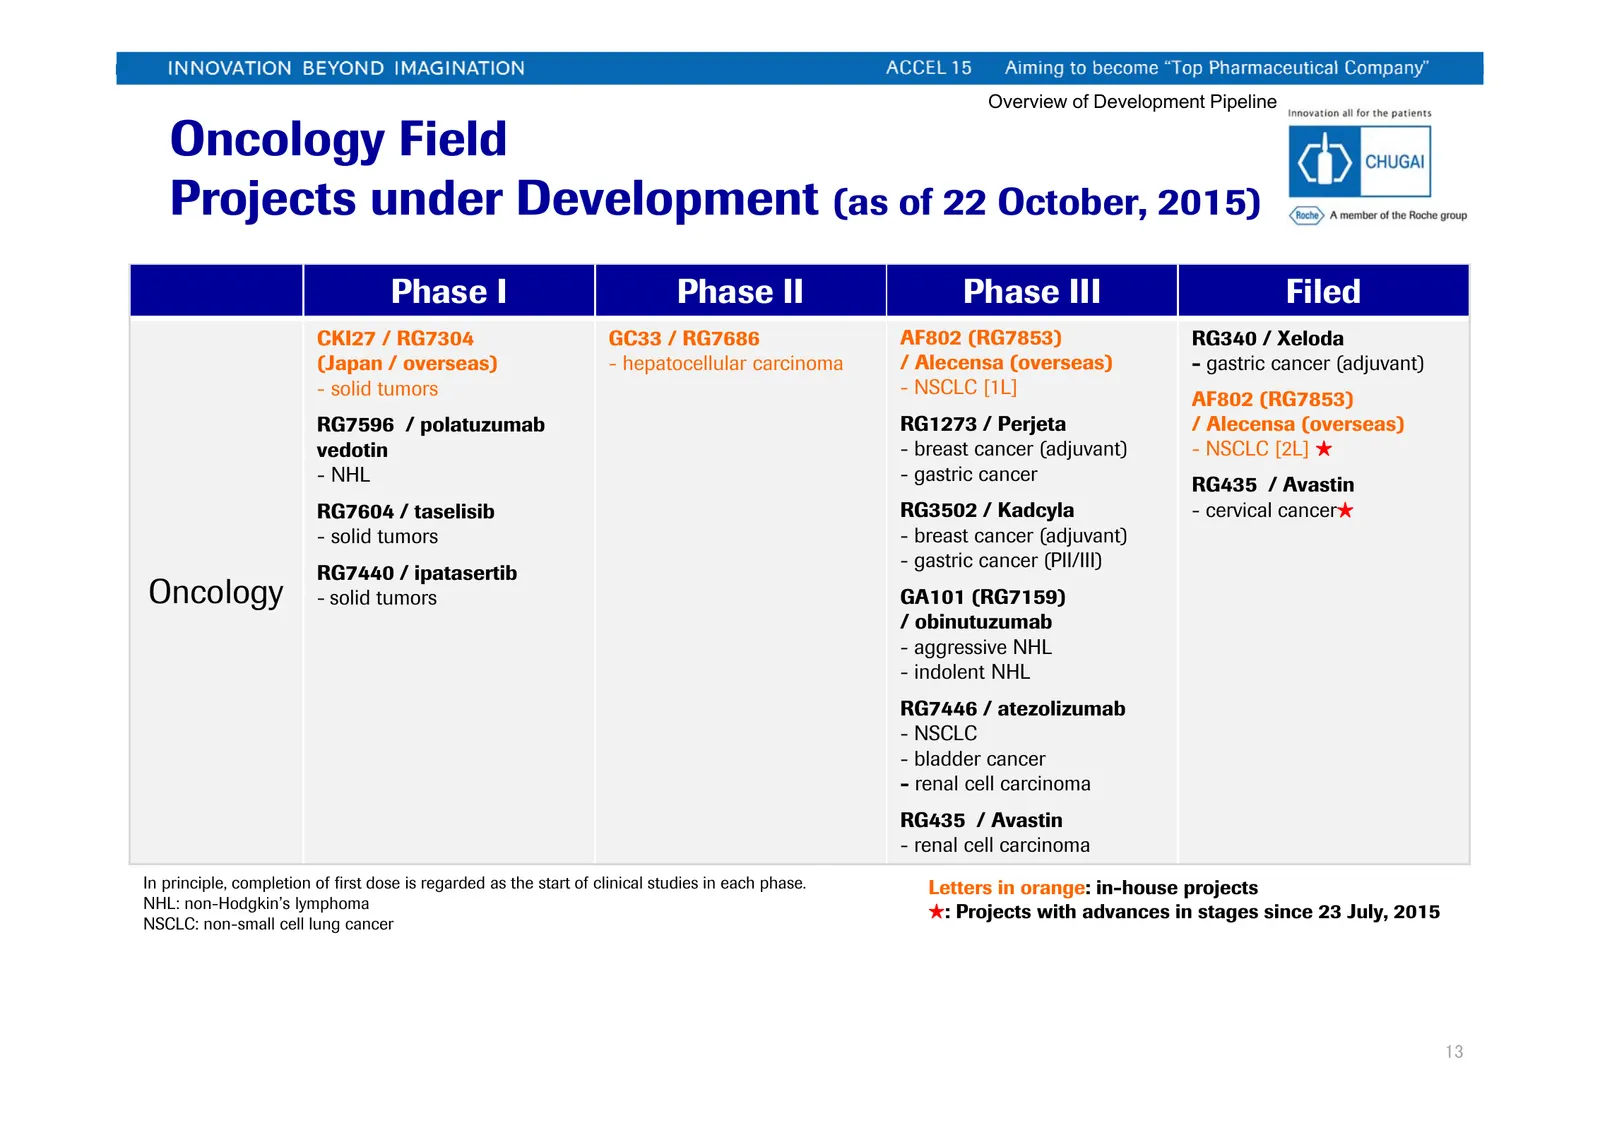
Overview of Development Pipeline Oncology Field Projects under Development (as of 22 October, 2015) Phase I Phase II Phase III Filed CKI27 / RG7304 GC33 / RG7686 AF802 (RG7853) RG340 / Xeloda (Japan / overseas) - hepatocellular carcinoma / Alecensa (overseas) - gastric cancer (adjuvant) - solid tumo
Slide 15: Primary Field Projects under Development
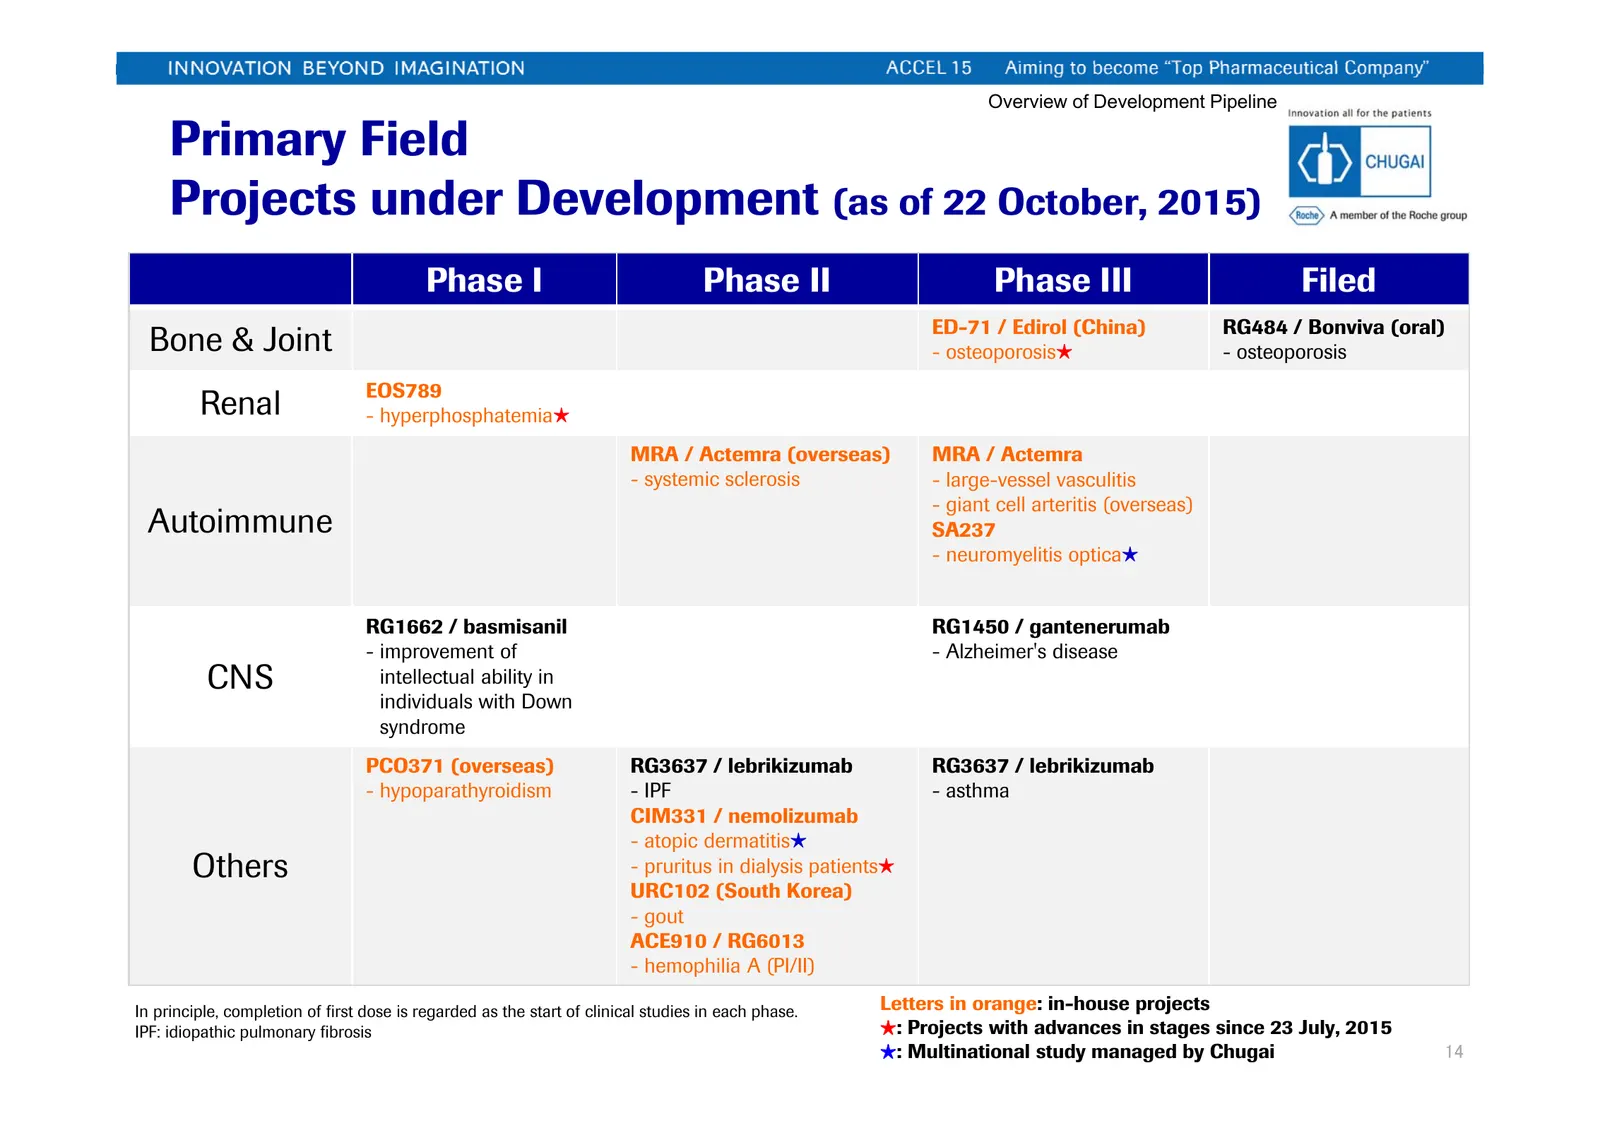
Overview of Development Pipeline Primary Field Projects under Development (as of 22 October, 2015) Phase I Phase II Phase III Filed ED-71 / Edirol (China) RG484 / Bonviva (oral) Bone & Joint - osteoporosis★ - osteoporosis EOS789 Renal - hyperphosphatemia★ MRA / Actemra (overseas) MRA / Actemra - sys
Slide 16: Development Status
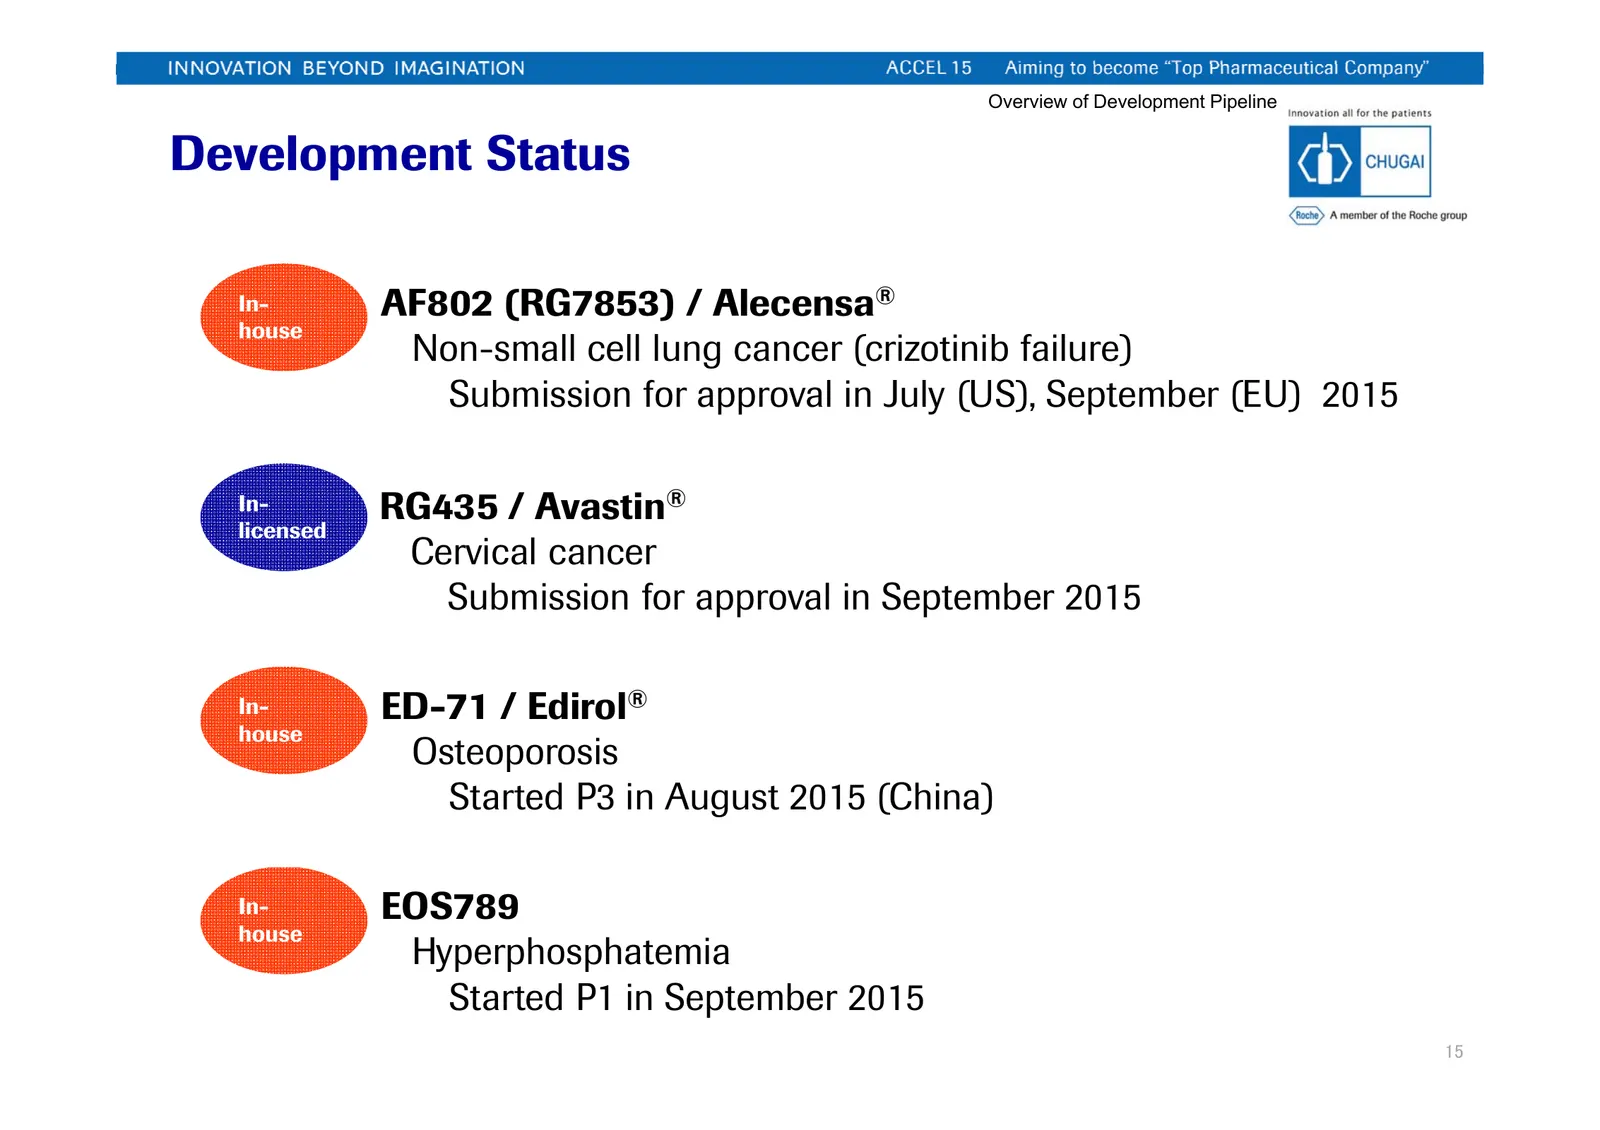
Overview of Development Pipeline Development Status In- AF802 (RG7853) / Alecensa® house Non-small cell lung cancer (crizotinib failure) Submission for approval in July (US), September (EU) 2015 In- RG435 / Avastin® licensed Cervical cancer Submission for approval in September 2015 In- ED-71 / Ediro
Slide 17: Development Status
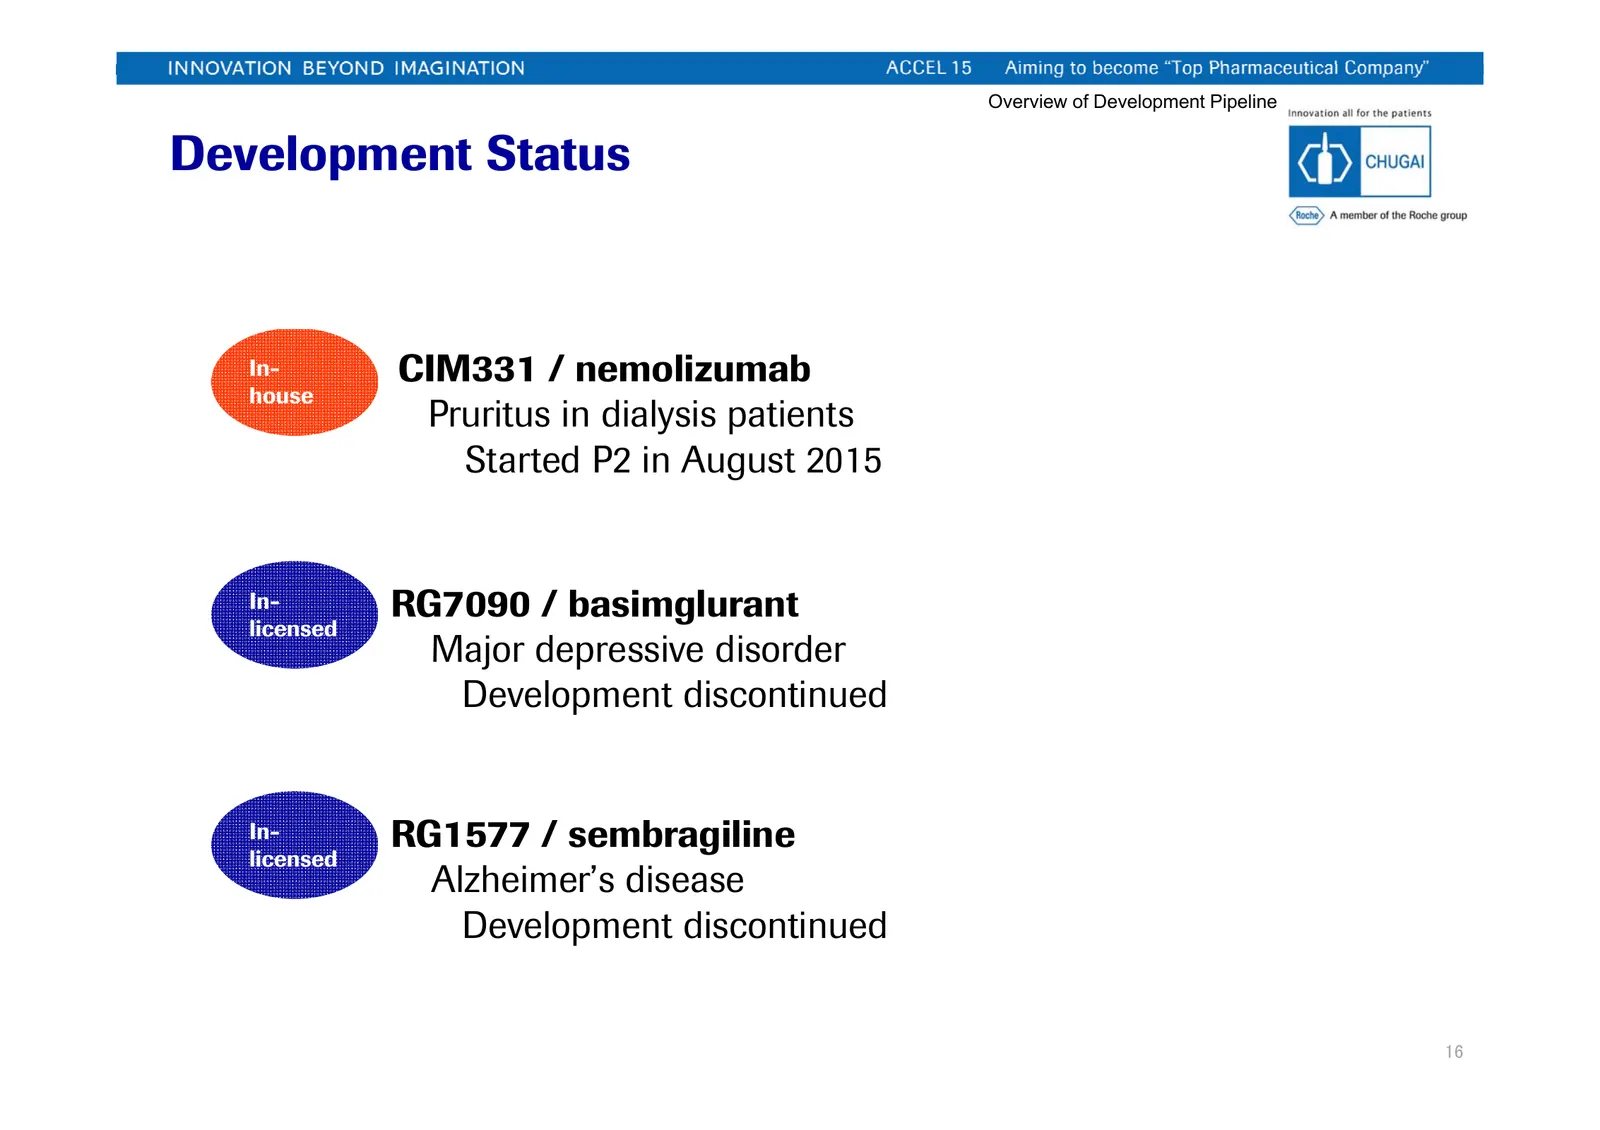
Overview of Development Pipeline Development Status In- CIM331 / nemolizumab house Pruritus in dialysis patients Started P2 in August 2015 In- RG7090 / basimglurant licensed Major depressive disorder Development discontinued In- RG1577 / sembragiline licensed Alzheimer’s disease Development disconti
Slide 18: Other Progress
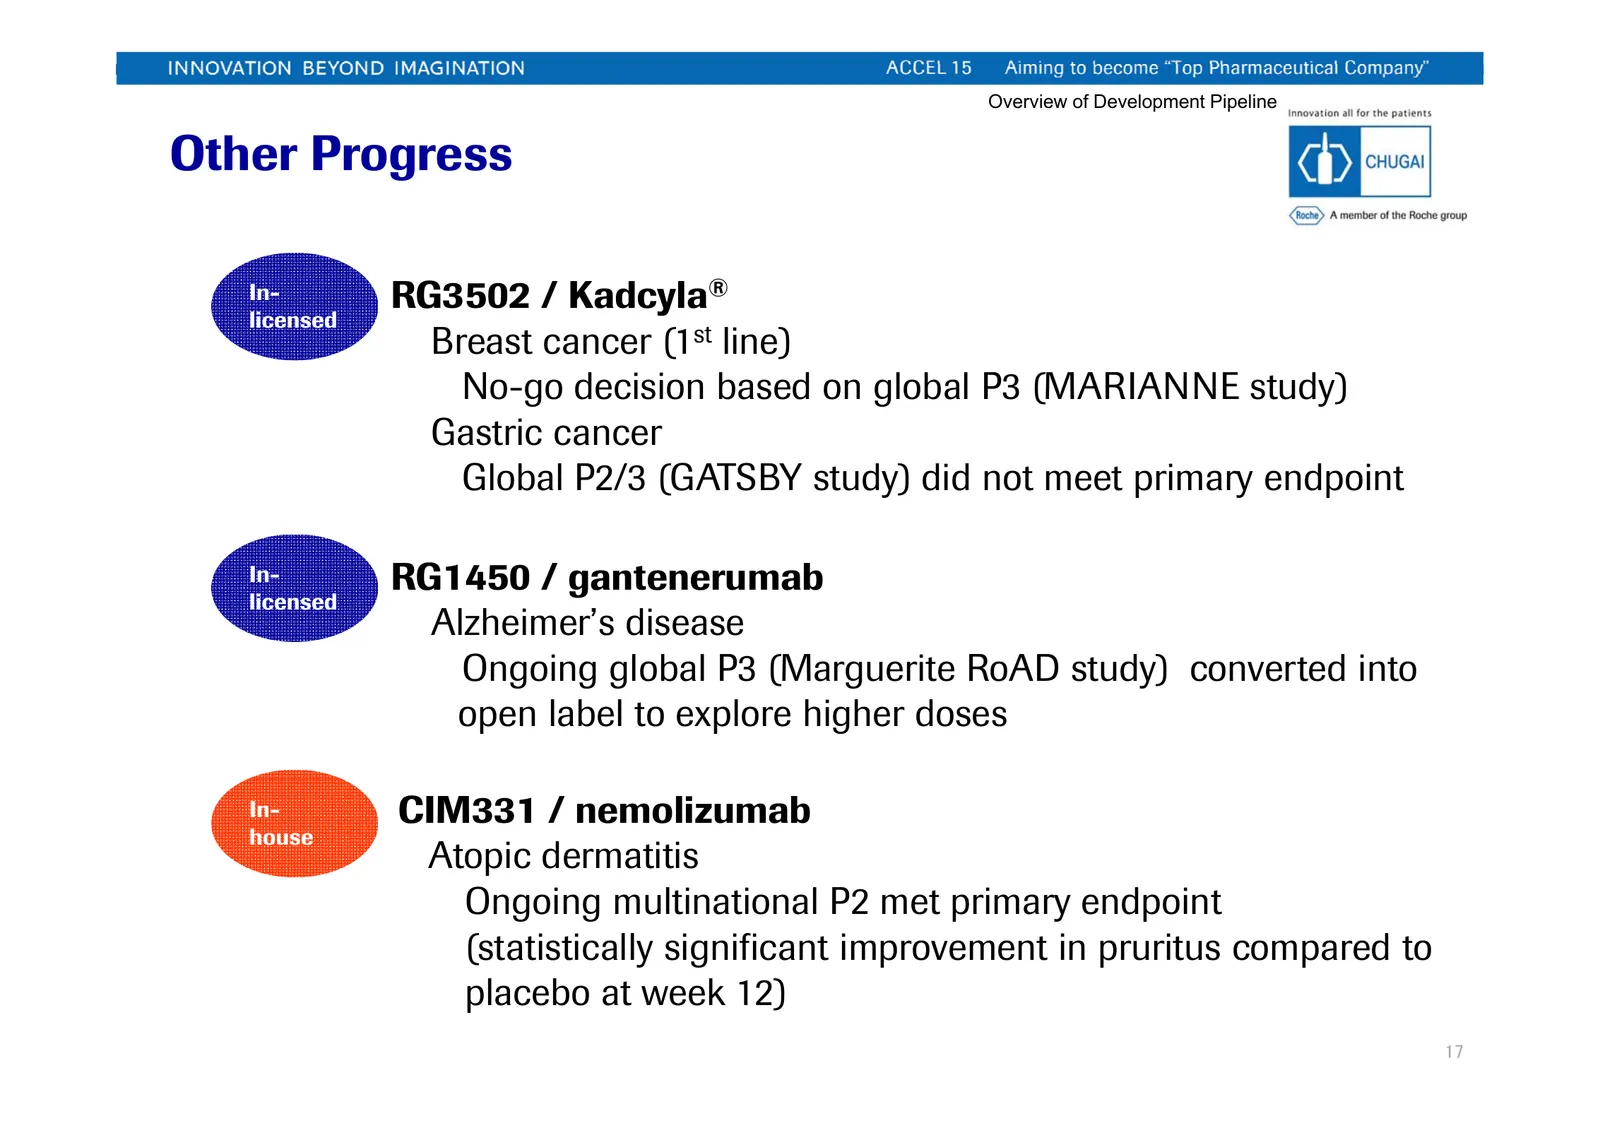
Overview of Development Pipeline Other Progress In- RG3502 / Kadcyla® licensed Breast cancer (1st line) No-go decision based on global P3 (MARIANNE study) Gastric cancer Global P2/3 (GATSBY study) did not meet primary endpoint In- RG1450 / gantenerumab licensed Alzheimer’s disease Ongoing global P3
Slide 19: Other Progress
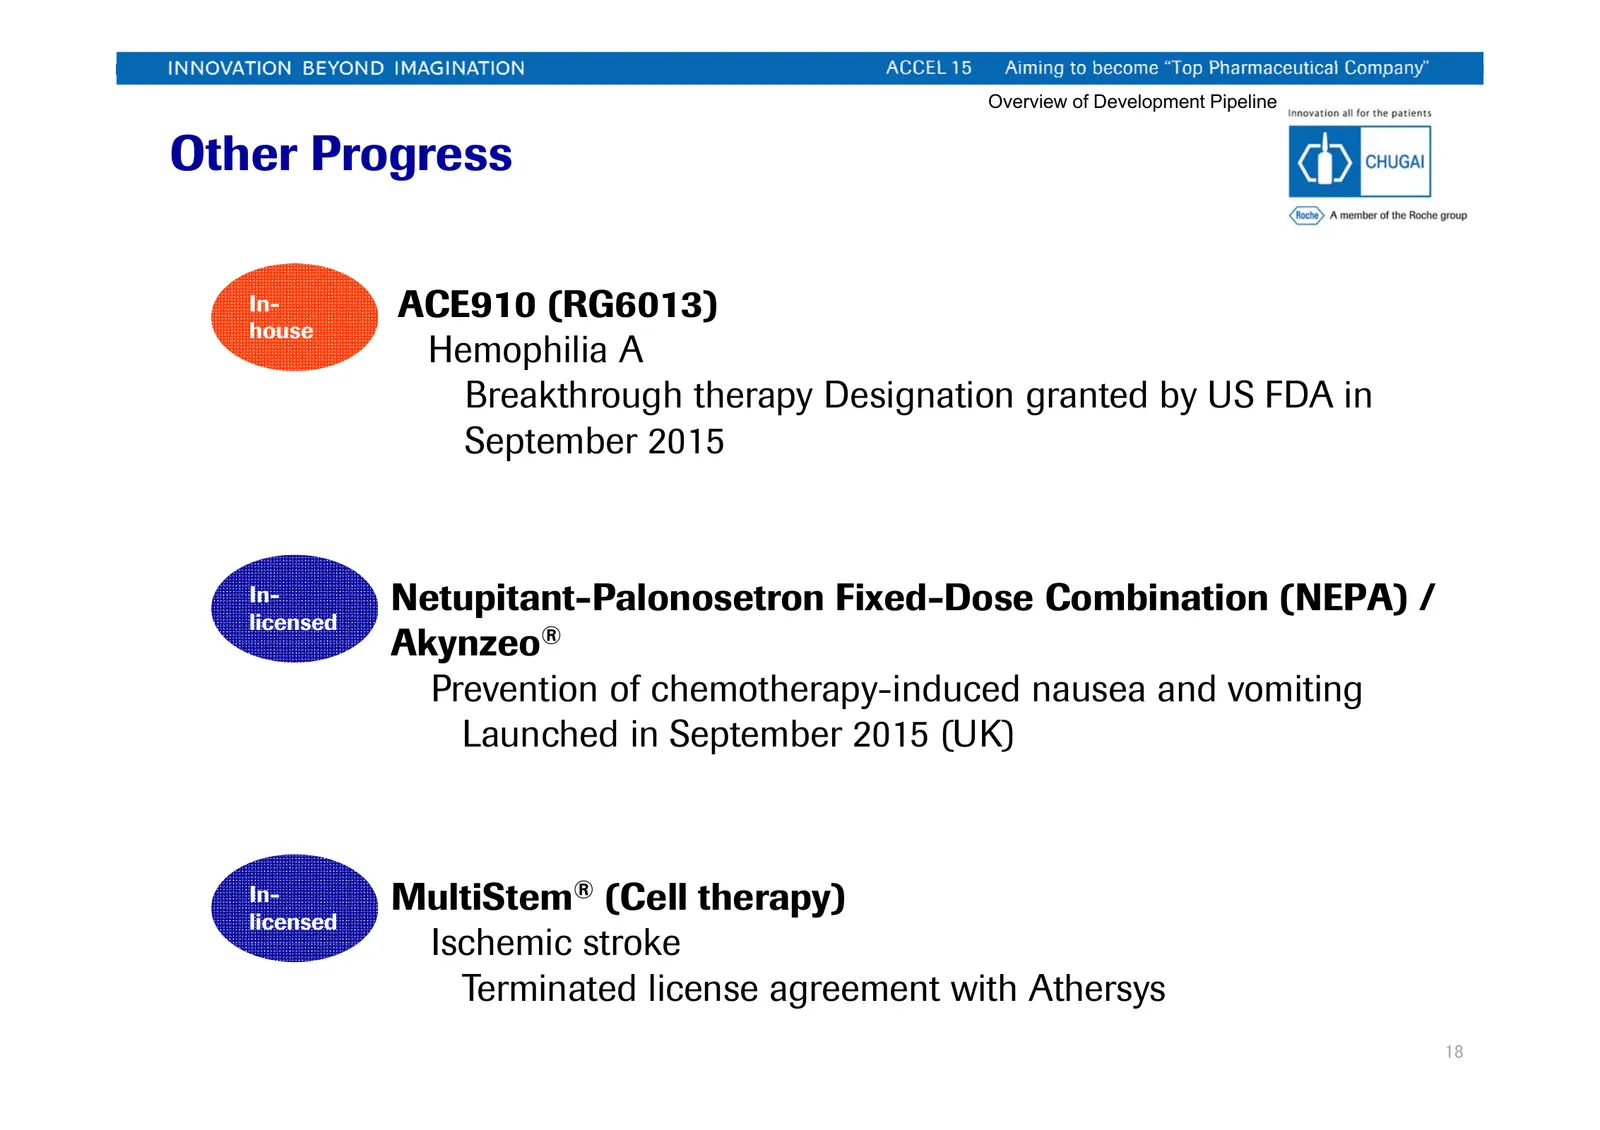
Overview of Development Pipeline Other Progress In- ACE910 (RG6013) house Hemophilia A Breakthrough therapy Designation granted by US FDA in September 2015 In- Netupitant-Palonosetron Fixed-Dose Combination (NEPA) / licensed Akynzeo® Prevention of chemotherapy-induced nausea and vomiting Launched in
Slide 20: ACE910: Phase 3 in Inhibitor Patients
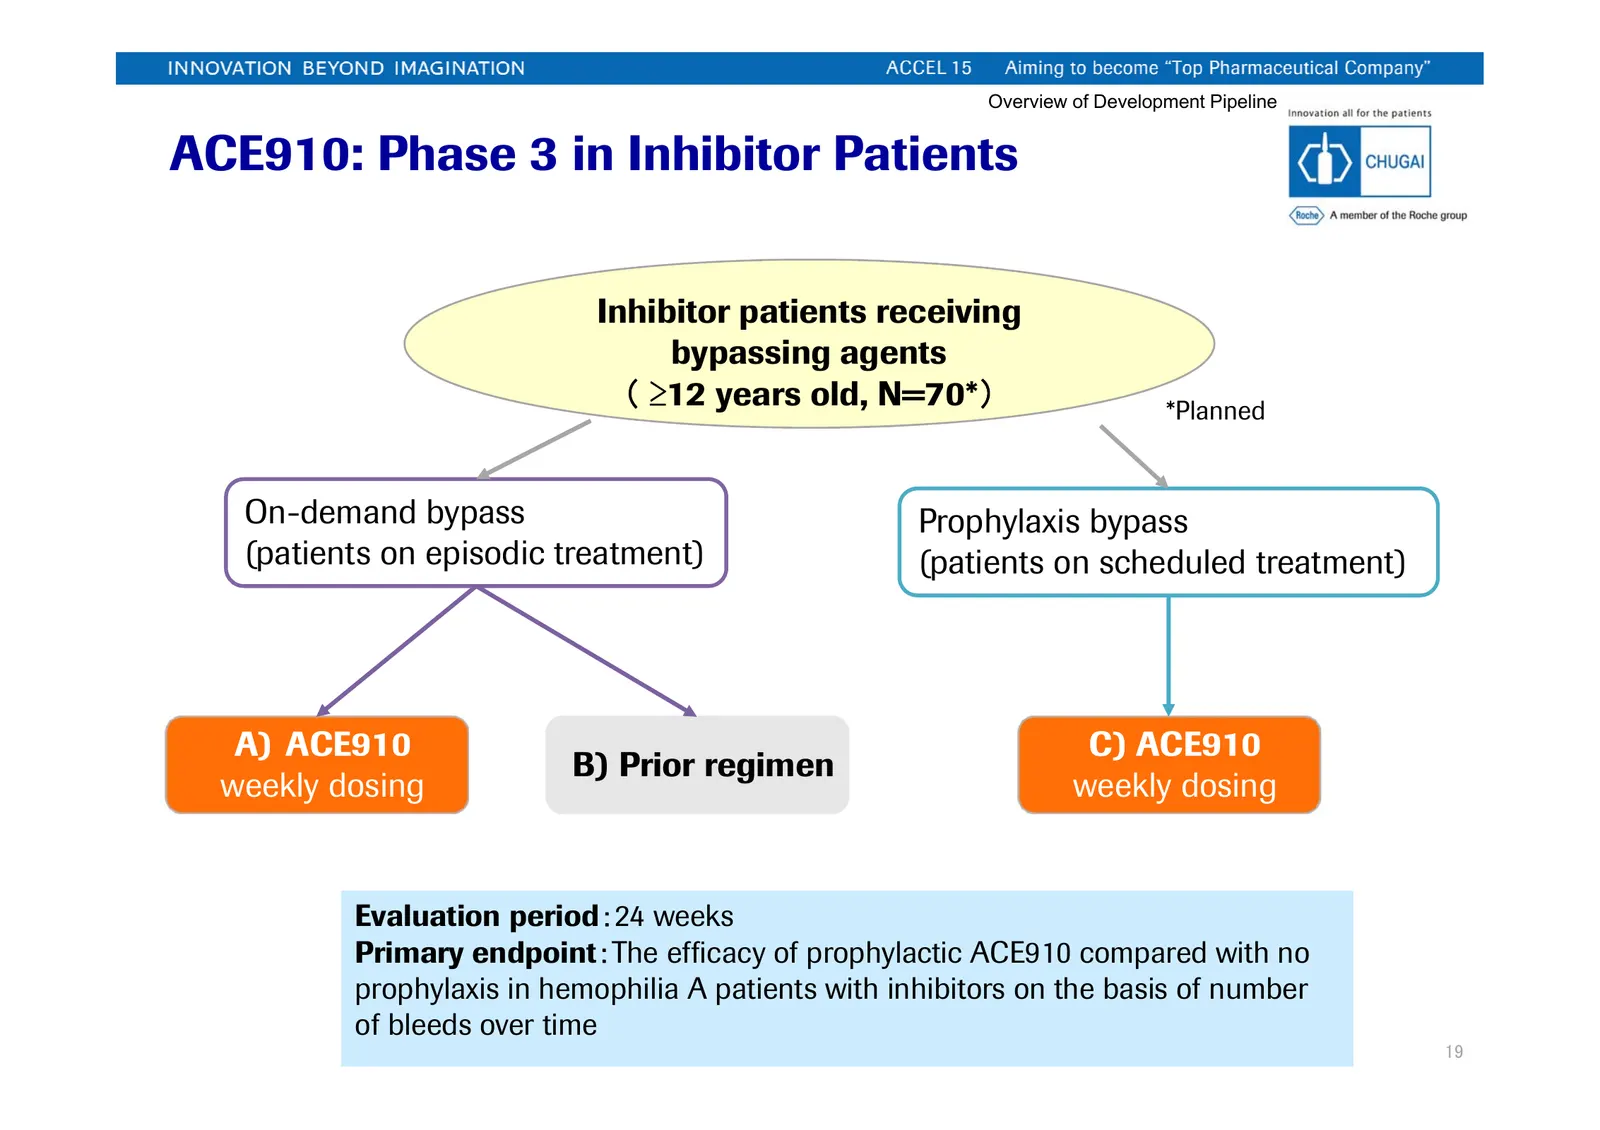
Overview of Development Pipeline ACE910: Phase 3 in Inhibitor Patients Inhibitor patients receiving bypassing agents ( ≥12 years old, N=70*) *Planned On-demand bypass Prophylaxis bypass (patients on episodic treatment) (patients on scheduled treatment) A) ACE910 C) ACE910 B) Prior regimen weekly dos
Slide 21: Projected Submissions (Post PoC NMEs and Products)
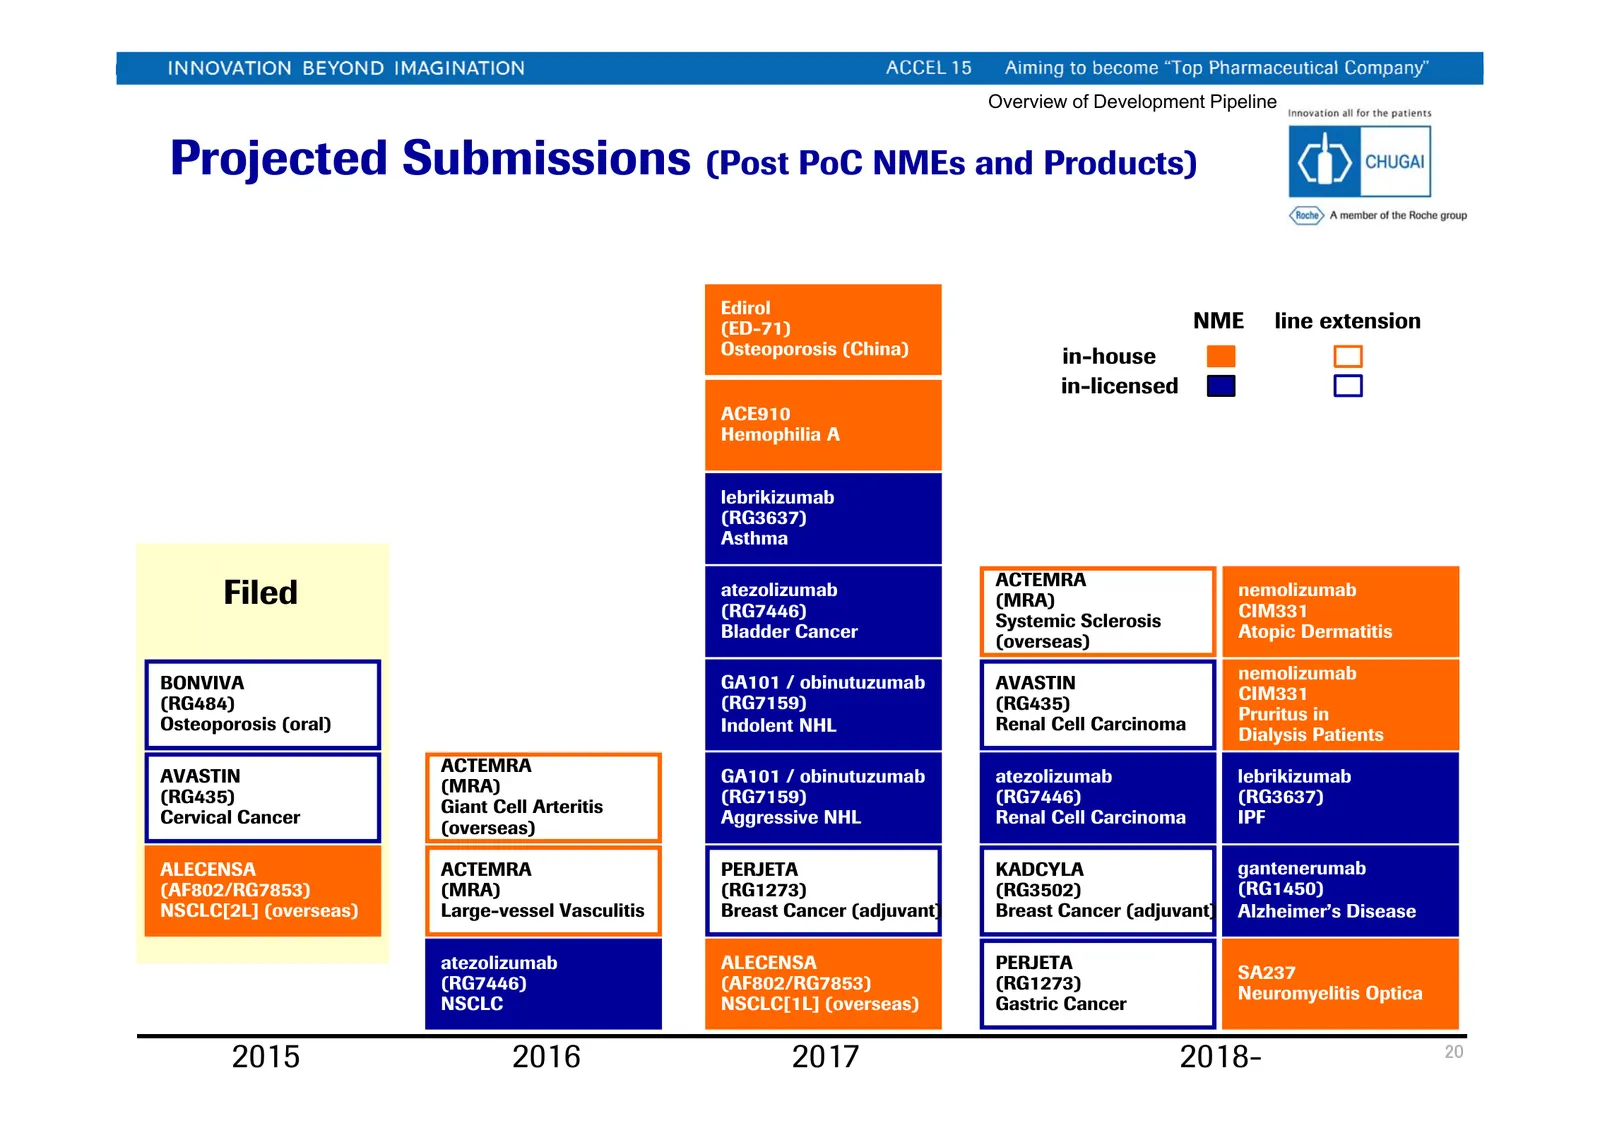
Overview of Development Pipeline Projected Submissions (Post PoC NMEs and Products) Edirol (ED-71) NME line extension Osteoporosis (China) in-house in-licensed ACE910 Hemophilia A lebrikizumab (RG3637) Asthma ACTEMRA Filed atezolizumab (RG7446) (MRA) nemolizumab CIM331 Systemic Sclerosis Bladder Can
Slide 22: Contacts: Corporate Communications Dept.
Contacts: Corporate Communications Dept. Media Relations Group Tel: +81 (0)3-3273-0881 Fax: +81 (0)3-3281-6607 e-mail: pr@chugai-pharm.co.jp Koki Harada, Hiroshi Araki, Sachiyo Yoshimura, Chisato Miyoshi Investor Relations Group Tel: +81 (0)3-3273-0554 Fax: +81 (0)3-3281-6607 e-mail: ir@chugai-pharm
Source: Internet Archive copy of chugai-pharm.co.jp
More decks from Chugai Pharmaceutical Co., Ltd.
 Q3 2026 Earnings Presentation32 slides · Oct 27, 2026
 Q3 2026 Earnings Presentation32 slides · Oct 27, 2026
 Q2 2026 Earnings Presentation34 slides · Jul 24, 2026
 Q2 2026 Earnings Presentation34 slides · Jul 24, 2026
 Technical Presentation (June 2026)45 slides · Jun 17, 2026
 Q1 2026 Earnings Presentation34 slides · Apr 24, 2026