Inland Real Estate — Investor Presentation (April 2006)
34 slides from Inland Real Estate's investor presentation, Apr 4, 2006
Slide 1: Inland Real Estate Corporation
Inland Real Estate Corporation
Slide 2: Forward Looking Statements
FORWARD LOOKING STATEMENTS * These presentation materials contain forward-looking statements. Forward-looking statements are statements that are not historical, including statements regarding management's intentions, beliefs, expectations, representations, plans or predictions of the future, and are
Slide 3: IRC Overview
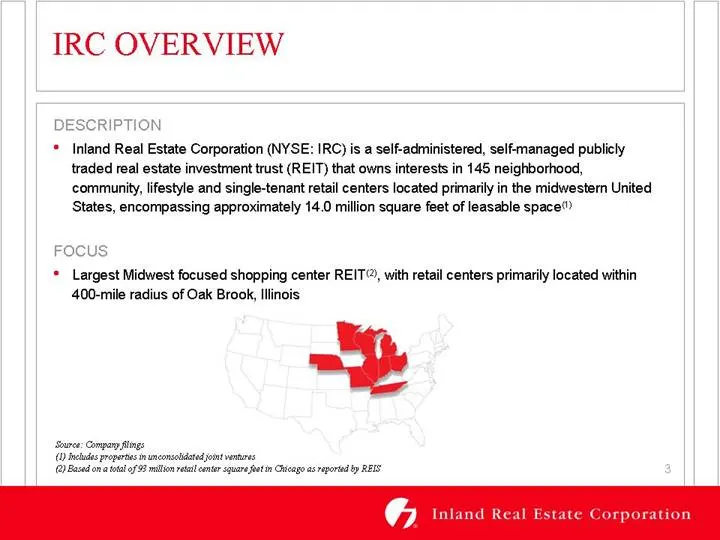
IRC OVERVIEW DESCRIPTION * Inland Real Estate Corporation (NYSE: IRC) is a self-administered, self-managed publicly traded real estate investment trust (REIT) that owns interests in 145 neighborhood, community, lifestyle and single-tenant retail centers located primarily in the midwestern United Sta
Slide 4: IRC Overview: Core Strengths
IRC OVERVIEW CORE STR THS Only shopping center REIT focused exclusively on operating within the attractive Midwest and Chicagoland markets Proven track record with consistent bottom line growth Internal and external growth potential through acquisitions and core portfolio re-leasing Attractive month
Slide 5: Inland's Growth Strategy
INLAND’S GROWTH STRATEGY
Slide 6: Acquisition Strategy
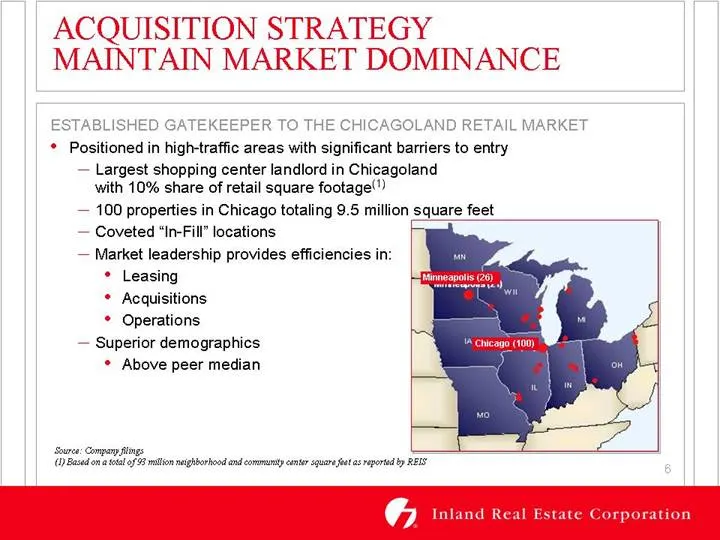
ACQUISITION STRATEGY MAINTAIN MARKET DOMINANCE ESTABLISHED GATEKEEPER TO THE CHICAGOLAND RETAIL MAR * Positioned in high-traffic areas with significant barriers to entry — Largest shopping center landlord in Chicagoland with 10% share of retail square footage”) — 100 properties in Chicago totaling 9
Slide 7: IRC Portfolio Snapshot
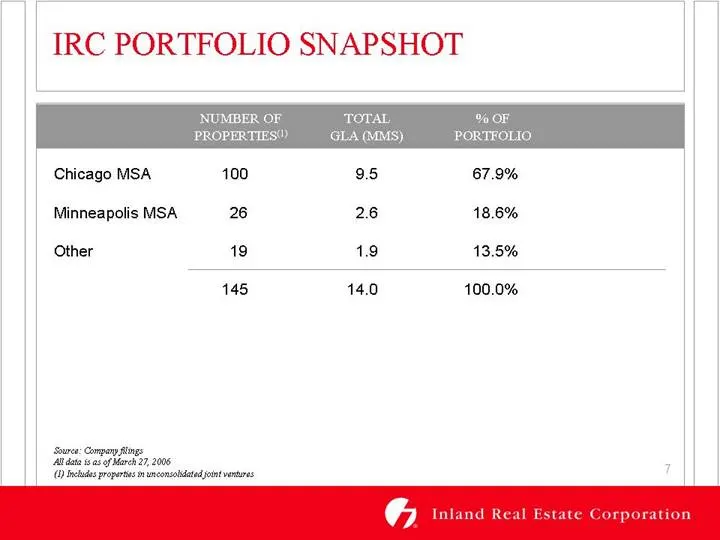
IRC PORTFOLIO SNAPSHOT Chicago MSA 100 95 67.9% Minneapolis MSA 26 26 18.6% Other 19 1.9 13.5% 145 14.0 100.0% Source: Company ings Alta a3 of arch 27,2008 (0) eles propre amconsadetedet vetoes
Slide 8: Acquisition Criteria
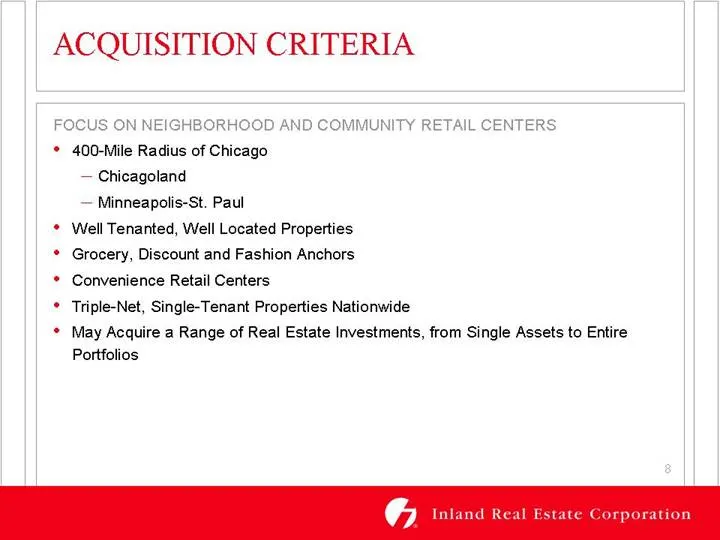
ACQUISITION CRITERIA FOCUS ON NEIGHBORHOOD AND COMMUNITY RETAIL CENTERS * 400-Mile Radius of Chicago — Chicagoland Minneapolis-St. Paul * Well Tenanted, Well Located Properties * Grocery, Discount and Fashion Anchors * Convenience Retail Centers * Triple-Net, Single-Tenant Properties Nationwide * Ma
Slide 9: Recent Acquisitions
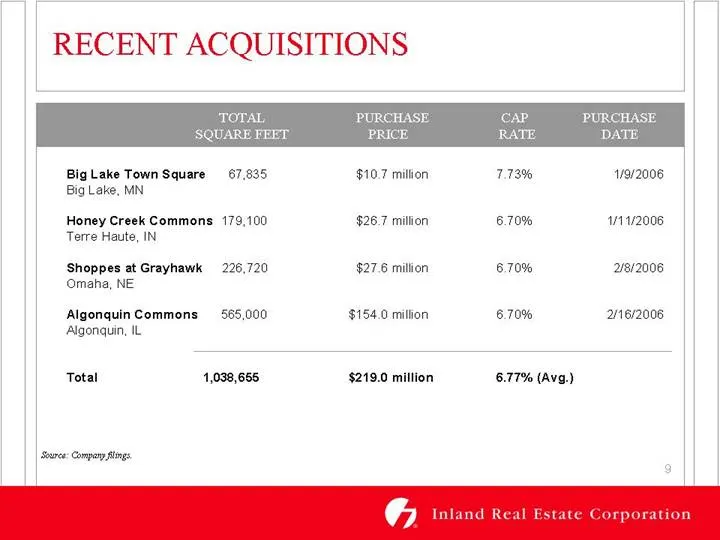
RECENT ACQUISITIONS Big Lake Town Square 67.835 $10.7 million 1.73% 41912006 Big Lake, MN Honey Creek Commons 179,100 $26.7 milion 6.70% 4412006 Terre Haute, IN Shoppes at Grayhawk 226,720 $27.6 milion 670% 2/8/2006 Omaha, NE Algonquin Commons 565,000 $154.0 million 6.70% 26/2008 Algonquin, IL Total
Slide 10: Honey Creek Commons
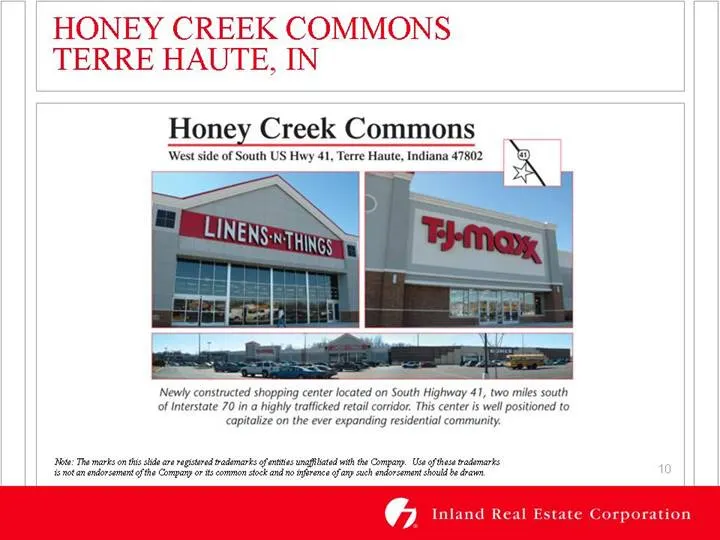
YY CREEK COMMONS TE, IN Honey Creek Commons ‘West side of South US Hwy 41, Terre Haute, Indiana 47802 Newly constructed shopping center located on South Highway 41, two miles south of Interstate 70 in a highly traicked retail corridor. This center is well positioned to Capitalize on the ever expandi
Slide 11: Trademark note
se: The marks on sd ar reiredademarks of ens nated wth he Company. Ue of Base ademarks {cot an endorse ofthe Campy or ts conton tock and mo tree ef sich enorsent kul be drawn
Slide 12: Focus on Acquisitions
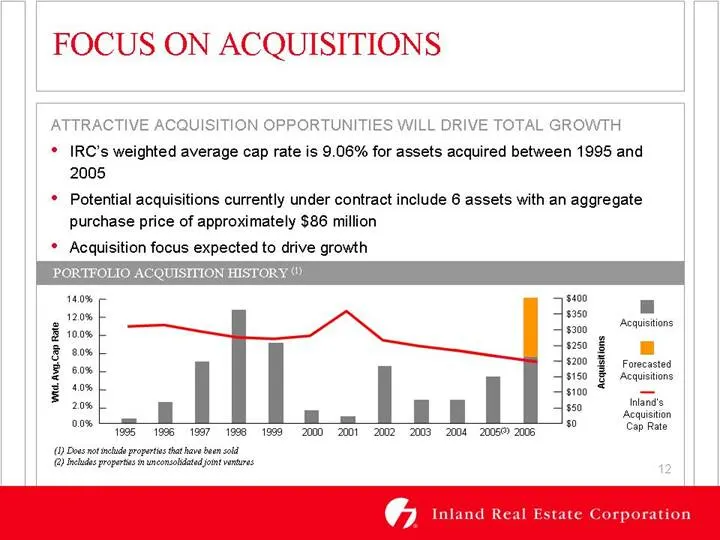
FOCUS ON ACQUISITIONS ATTRACTIVE ACQUISITION OPPORTUNITIES WILL DRIVE TOTAL GROWTH * IRC’s weighted average cap rate is 9.06% for assets acquired between 1995 and 2005 * Potential acquisitions currently under contract include 6 assets with an aggregate purchase price of approximately $86 million n f
Slide 13: Pipeline Strength
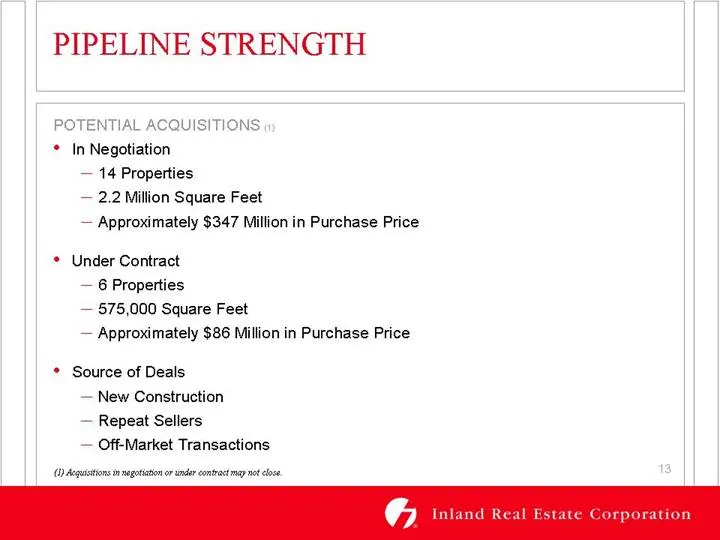
PIPELINE STRENGTH POTENTIAL ACQUISITIONS * In Negotiation ~ 14 Properties, — 2.2 Million Square Feet — Approximately $347 Million in Purchase Price * Under Contract — 6 Properties — 575,000 Square Feet — Approximately $86 Million in Purchase Price * Source of Deals New Construction Repeat Sellers Of
Slide 14: Asset-Based Joint Ventures
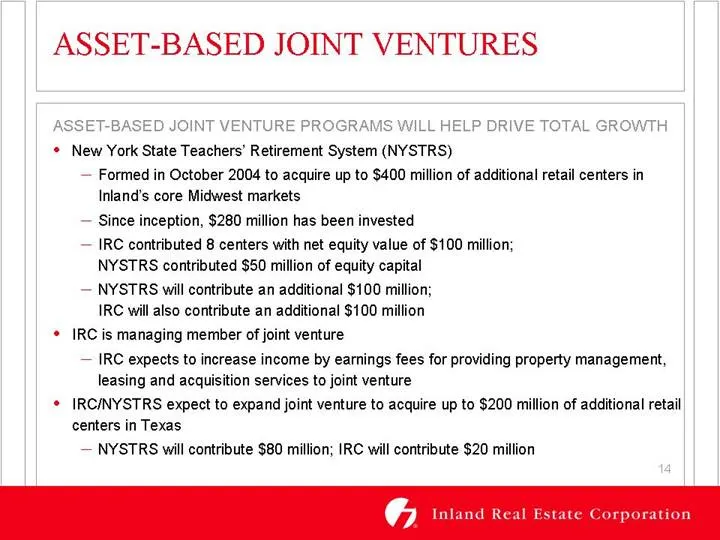
ASSET-BASED JOINT VENTURES JOINT VENTURE PROGRAMS WILL * New York State Teachers’ Retirement System (NYSTRS) Formed in October 2004 to acquire up to $400 million of additional retail centers in Inland’s core Midwest markets Since inception, $280 million has been invested IRC contributed 8 centers wi
Slide 15: Inland's Execution Expertise
INLAND’S EXECUTION EXPERTISE
Slide 16: Proven Operating Track Record
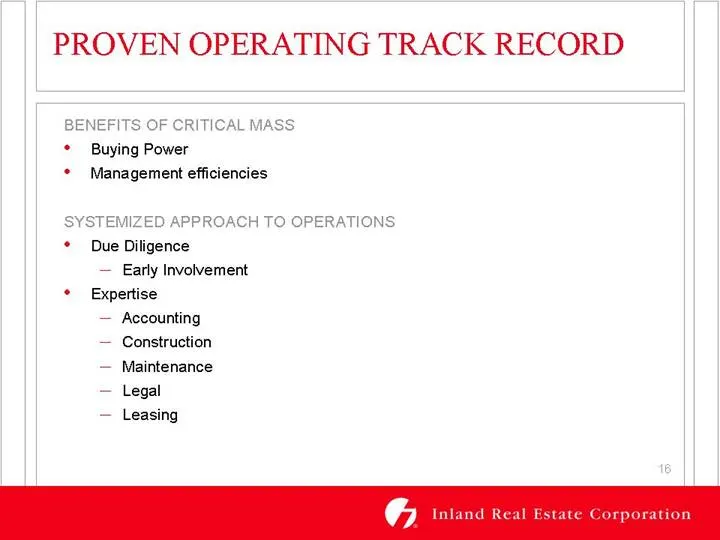
PROVEN OPERATING TRACK RECORD BENEFITS OF CRITICAL MASS * Buying Power * Management efficiencies SYSTEMIZED APPROACH TO OPERATIONS * Due Diligence — Early Involvement * Expertise — Accounting — Construction — Maintenance — Legal — Leasing 1 Estate Corp
Slide 17: Disciplined Cost Control
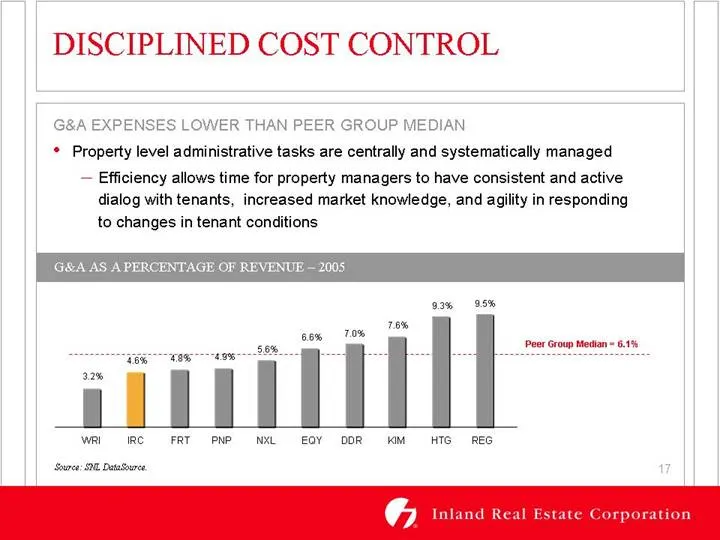
DISCIPLINED COST CONTROL G&A EXPENSES LOWER THAN PEER GROUP MEDIAN * Property level administrative tasks are centrally and systematically managed — Efficiency allows time for property managers to have consistent and active dialog with tenants, increased market knowledge, and agility in responding to
Slide 18: Diversified Portfolio
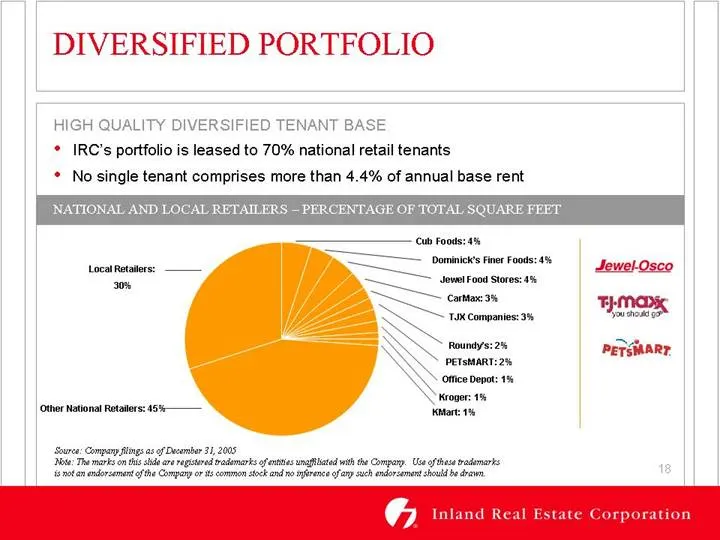
DIVERSIFIED PORTFOLIO HIGH QUALITY DIVERSIFIED TENANT BASE * IRC’s portfolio is leased to 70% national retail tenants * No single tenant comprises more than 4.4% of annual base rent cu Foods: 4% Dy, orminicks Finer Foods: 486 Sa ee =e SS ‘TIX Companies:3% Roundy: 2% PETsMART: ‘ontce Depot: 1% roger:
Slide 19: Stable Lease Rollover
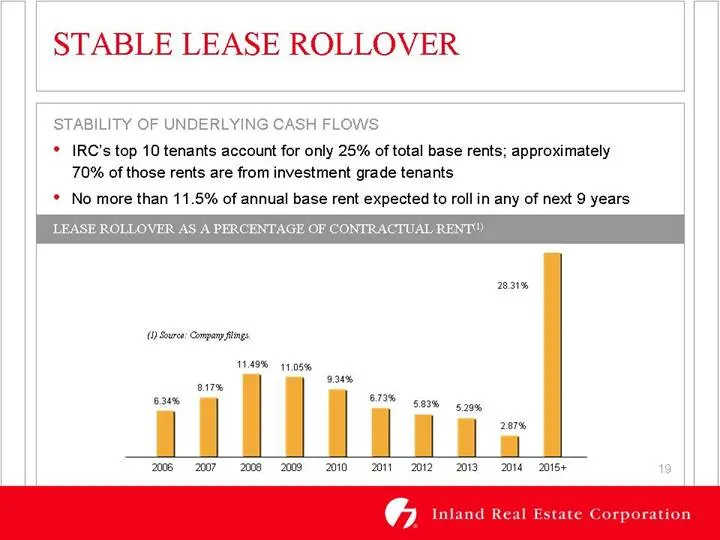
STABLE LEASE ROLLOVER STABILITY OF UNDERLYING CASH FLOWS * IRC’s top 10 tenants account for only 25% of total base rents; approximately 70% of those rents are from investment grade tenants * No more than 11.5% of annual base rent expected to roll in any of next 9 years E ROLL 20.31% (9 Swe: Company
Slide 20: Leasing Efficiencies
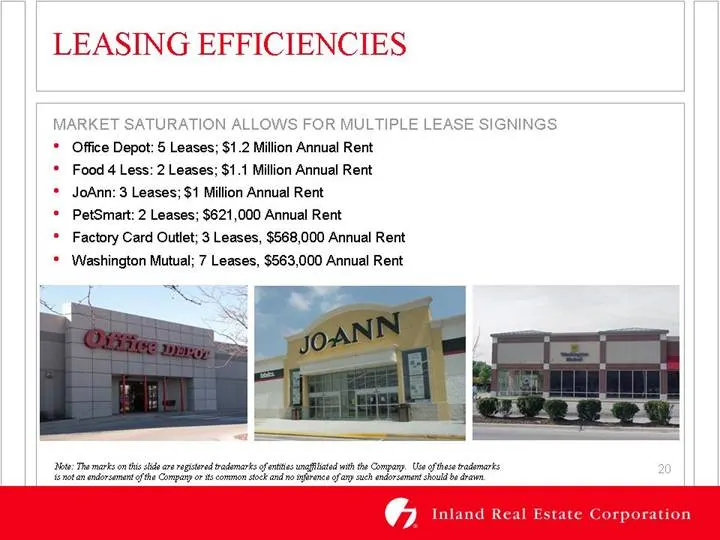
NG EFF EFFICIENCIES ULES MARKET SATURATION ALLOWS FOR MULTIPLE LEASE SIGNINGS * Office Depot: 5 Leases; $1.2 Million Annual Rent * Food 4 Less: 2 Leases; $1.1 Million Annual Rent * JoAnn: 3 Leases; $1 Million Annual Rent * PetSmart: 2 Leases; $621,000 Annual Rent * Factory Card Outlet; 3 Leases, $56
Slide 21: Growth in Rental Rates
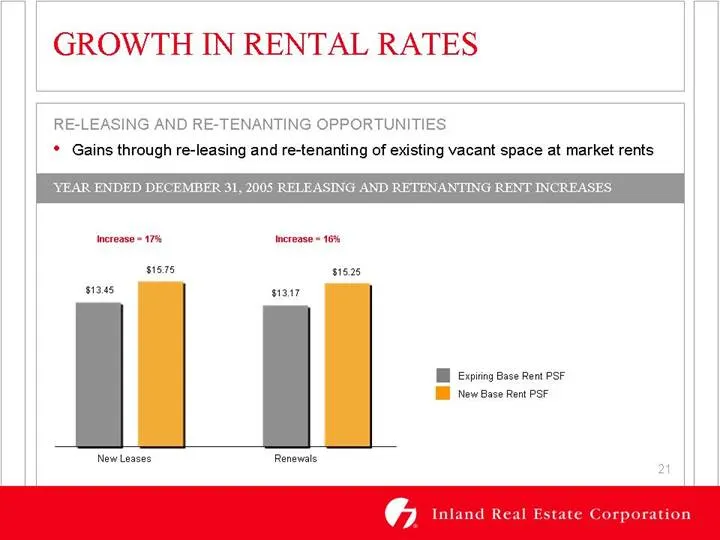
GROWTH IN RENTAL RATES RE-LEASING AND RE-TENANTING OPPORTUNITIES * Gains through re-leasing and re-tenanting of existing vacant space at market rents Increase = 17% Increase = 16% $15.75 spring Base Rent PSF TBE New Base Rent PSF New Leases Estate Corp 21
Slide 22: Asset Improvement Initiatives
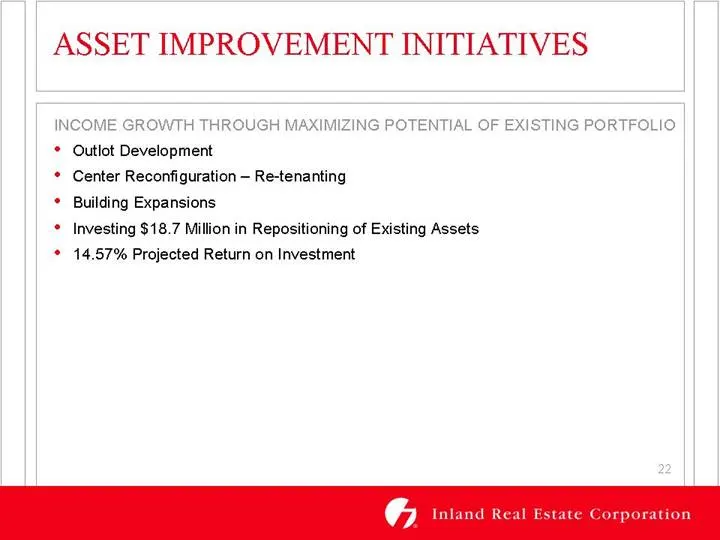
ASSET IMPROVEMENT INITIATIVES INCOME GROWTH THROUGH MAXIMIZING POTENTIAL OF EXISTING PORTFOLIO * Outlot Development * Center Reconfiguration — Re-tenanting * Building Expansions * Investing $18.7 Million in Repositioning of Existing Assets * 14.57% Projected Return on Investment 1 Estate Corp
Slide 23: Financial Snapshot
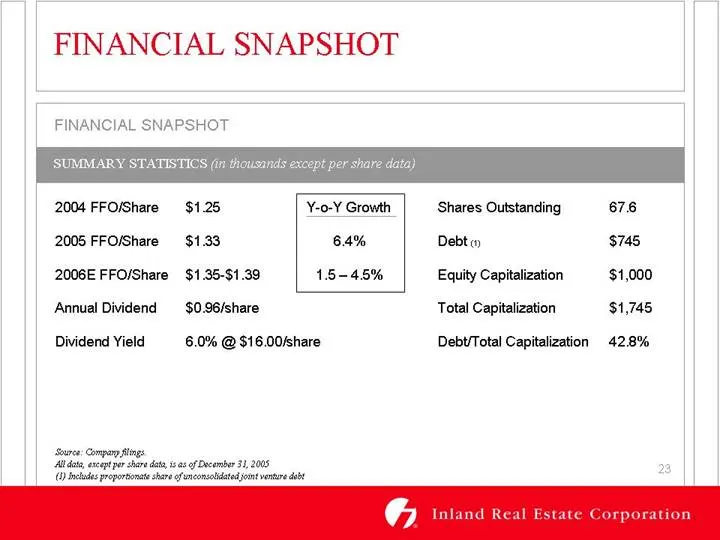
FINANCIAL SNAPSHOT FINANCIAL SNAPSHOT 2004 FFOShare = $1.25 Y-0-Y Growth ‘Shares Outstanding 676 2005 FFO/Share $1.33 6.4% Debt « $745 2006E FFO/Share $1.35-$1.39 15-45% Equity Capitalization $1,000 Annual Dividend —_ $0.96/share Total Capitalization $1,745 Dividend Yield 6.0% @ $16.00/share Debt/To
Slide 24: Proven Results
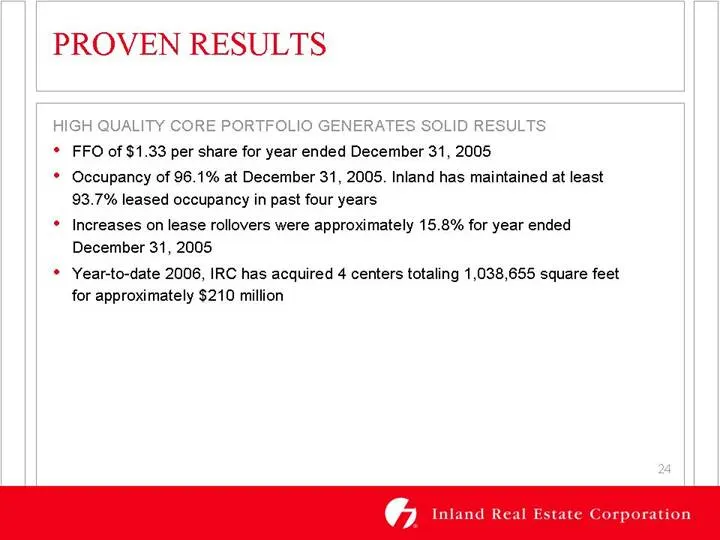
PROVEN RESULTS ES SOLI H QUALITY CORI ORT * FFO of $1.33 per share for year ended December 31, 2005 * Occupancy of 96.1% at December 31, 2005. Inland has maintained at least 93.7% leased occupancy in past four years * Increases on lease rollovers were approximately 15.8% for year ended December 31,
Slide 25: Capital Structure / Financing Philosophy
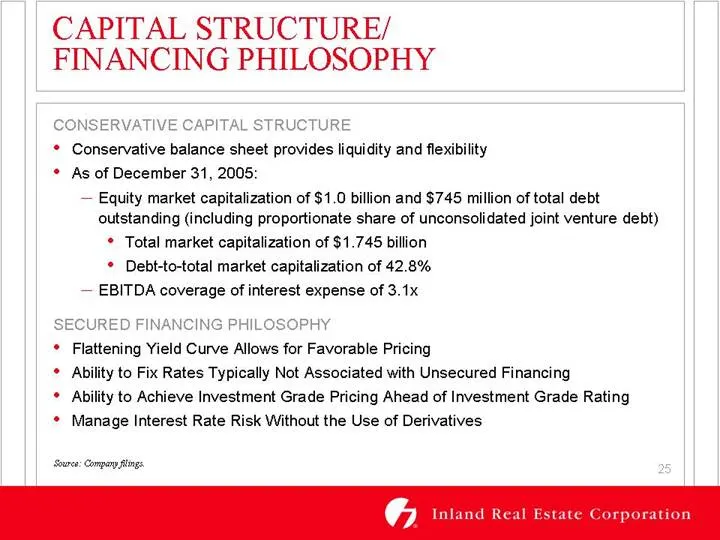
CAPITAL STRUCTURE/ FINANCING PHILOSOPHY ERVATIVE C. ITAL S TURE * Conservative balance sheet provides liquidity and flexibility * As of December 31, 2005: — Equity market capitalization of $1.0 billion and $745 million of total debt outstanding (including proportionate share of unconsolidated joint
Slide 26: Average Interest Rates
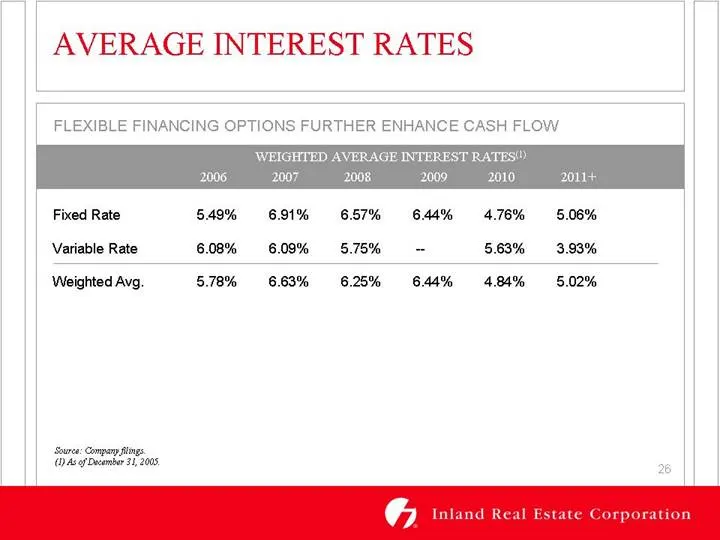
AVERAGE INTEREST RATES FLEXIBLE FINANCING OPTIONS FURTHER ENHANCE CASH FLOW 2010 Fixed Rate 549% 6.91% 657% 644% 4.76% 5.06% Variable Rate 6.08% 6.09% 575% - 5.63% 3.93% Weighted Avg. 5.78% 6.63% 6.25% 6.44% 4.84% 5.02% See Company fines. (yA ef December 31,2005
Slide 27: Debt Maturities
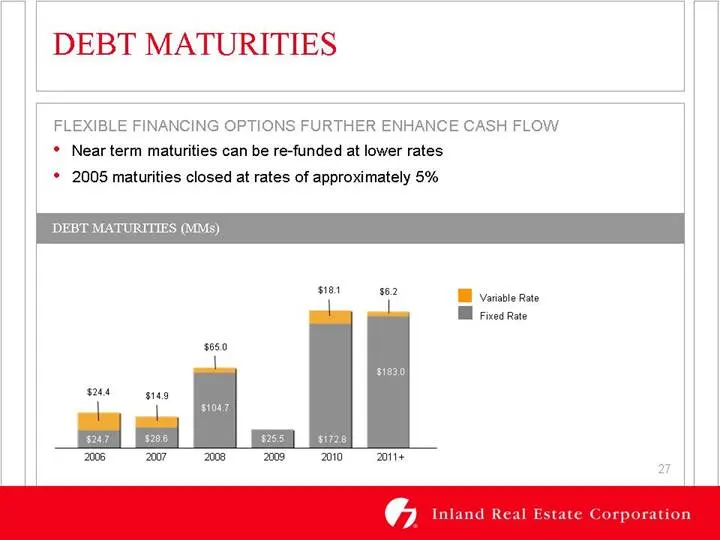
DEBT MATURITIES sie $680 we guag 2005 mor «BSCS FLEXIBLE FINANCING OPTIONS FURTHER ENHANCE CASH FLOW * Near term maturities can be re-funded at lower rates * 2005 maturities closed at rates of approximately 5% DEBT MATURI ii BE Variable Rate Ears tion
Slide 28: Equity Line of Credit / Investment Grade Rating
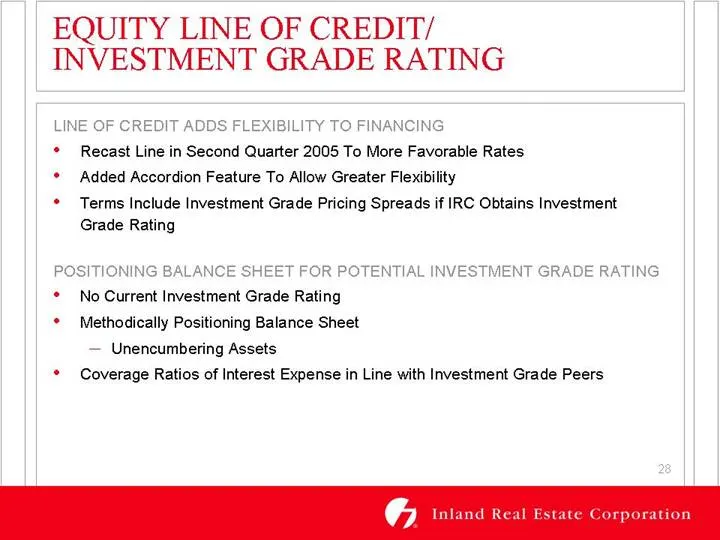
EQUITY LINE OF CREDIT/ INVESTMENT GRADE RATING LINE OF CREDIT ADDS FLEXIBILITY TO FINANCING * Recast Line in Second Quarter 2005 To More Favorable Rates * Added Accordion Feature To Allow Greater Flexibility * Terms Include Investment Grade Pricing Spreads if IRC Obtains Investment Grade Rating POSI
Slide 29: Financial Track Record
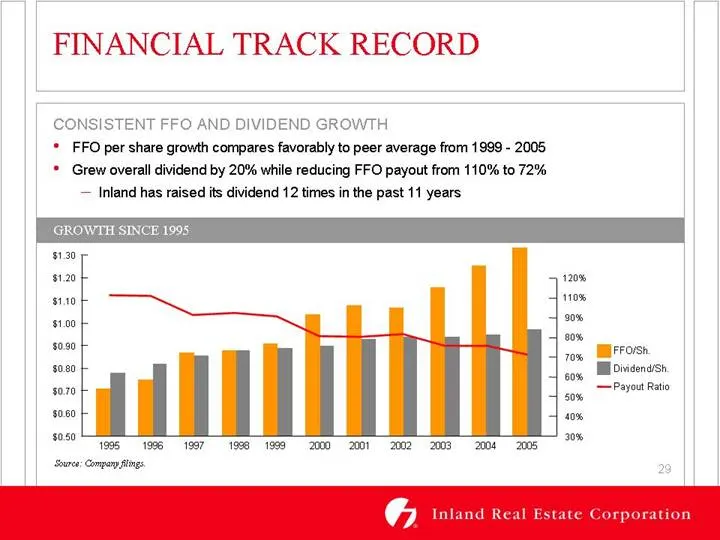
FINANCIAL TRACK RECORD CONSISTENT FFO AND DIVIDEND GROWTH * FFO per share growth compares favorably to peer average from 1999 - 2005 * Grew overall dividend by 20% while reducing FFO payout from 110% to 72% — Inland has raised its dividend 12 times in the past 11 years $120 120% 110 — 110% $1.00 oo
Slide 30: Biographies: Senior Management
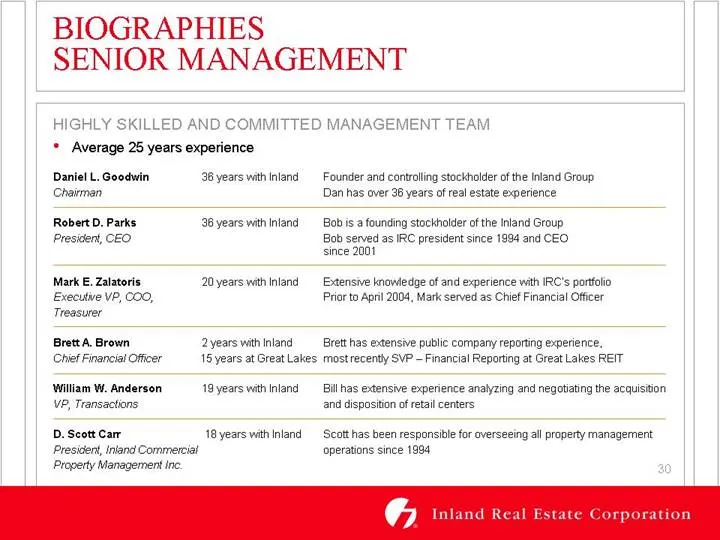
BIOGRAPHIES SENIOR MANAGEMENT HIGHLY SKILLED AND COMMITTED MANAGEMENT TEAM * Average 25 years experience Danie! L. Goodwin 36 years with inland Founder and controling stockholder ofthe Inland Group Charman Dan has over 36 years of real estate experience Robert D. Parks 36 years with Inland Bob is a
Slide 31: Biographies: Board of Directors
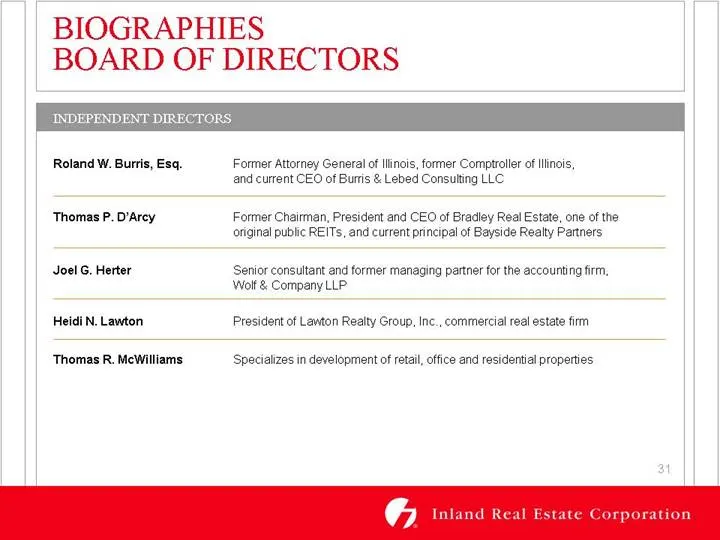
BIOGRAPHIES BOARD OF DIRECTORS INDEPEND! INT DIRE Roland W. Burris, Esq. Former Attorney General of Ilincis, former Comptroller of Ilinois, and current CEO of Burs & Lebed Consutting LLC ‘Thomas P. D'Arcy Former Chaitman, President and CEO of Bradley Real Estate, one of the original public REITS, an
Slide 32: Appendix: Reconciliation of Non-GAAP Financial Metrics
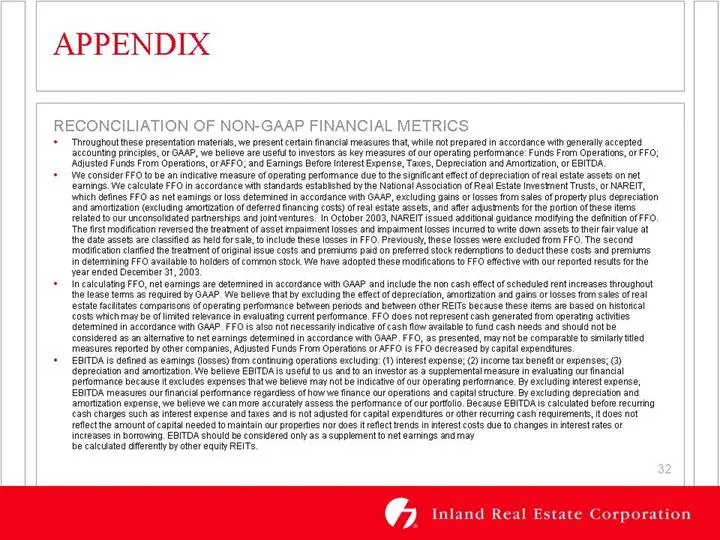
APPENDIX RECONCILIATION OF NON-GAAP FINANCIAL METRICS “Throughout these presentation materia, we present cota fnanclt measures that while nat prepared in accordance win generally accepted ‘accountng panciles, or GAP, we belive ate use to Investor as key mescures of our operating performance. Funds F
Slide 33: Appendix: Reconciliation of Non-GAAP Financial Metrics
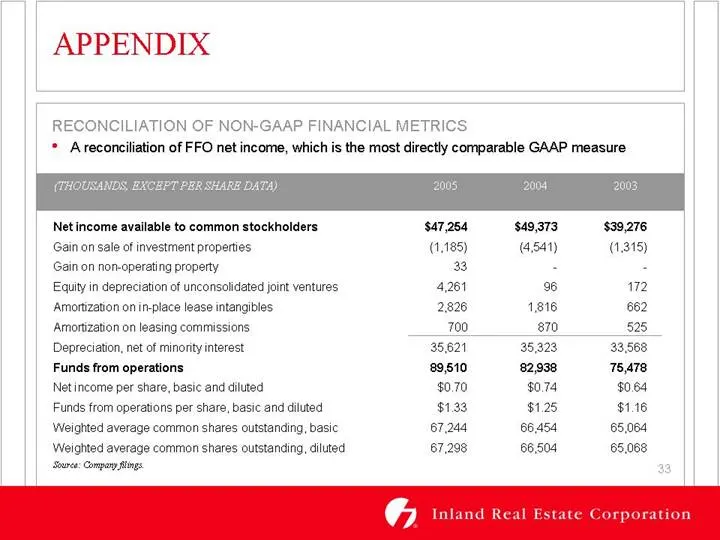
APPENDIX RECONCILIATION OF NON-GAAP FINANCIAL METRICS * Areconciliation of FFO net income, which is the most directly comparable GAAP measure Net income available to common stockholders $47,284 $49,373 $39,276 Gain on sale of investment properties (1.185) 4541) (ats) Gain on non-operating property 3
Slide 34: Searchable text section of graphics shown above
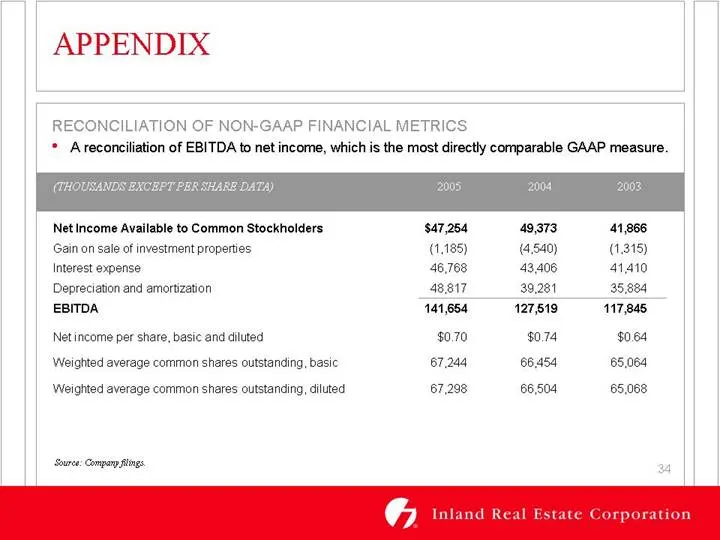
Searchable text section of graphics shown above [LOGO] The Midwest Marketplace for Retail Space NYSE: IRC www.inlandrealestate.com April 2006 FO RWARD LOOKING STATEMENTS • These presentation materials contain forward-looking statements. Forward-looking statements are statements that are not historic
Source: SEC EDGAR · 8-K filed Apr 4, 2006
More decks from Inland Real Estate Corp
 Investor Presentation (November 2015)30 slides · Nov 17, 2015
 Investor Presentation (September 2015)29 slides · Sep 16, 2015
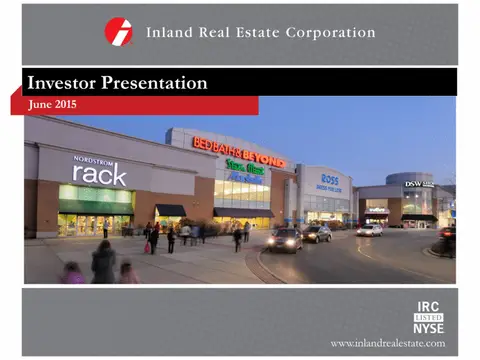 Investor Presentation (June 2015)29 slides · Jun 9, 2015
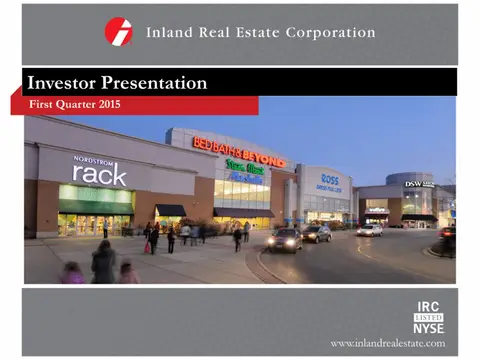 Investor Presentation (May 2015)26 slides · May 15, 2015
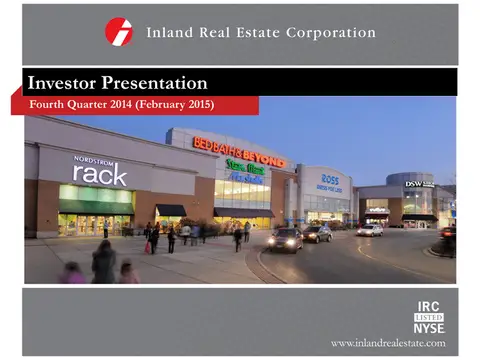 Investor Presentation (February 2015)26 slides · Feb 24, 2015
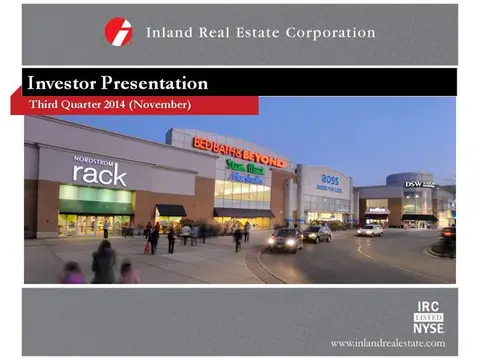 Investor Presentation (November 2014)26 slides · Nov 5, 2014