Inland Real Estate — Investor Presentation (September 2013)
24 slides from Inland Real Estate's investor presentation, Sep 11, 2013
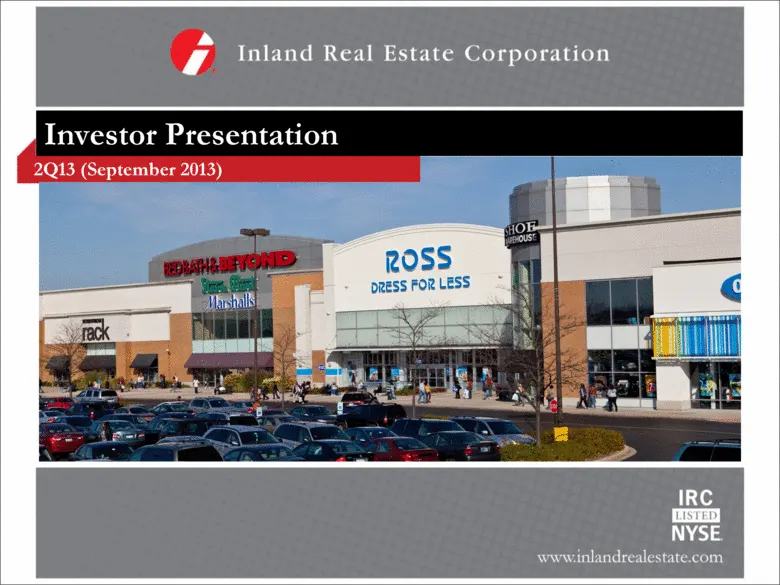
Slide 1: Investor Presentation 2Q13 (September 2013)
Investor Presentation 2Q13 (September 2013)
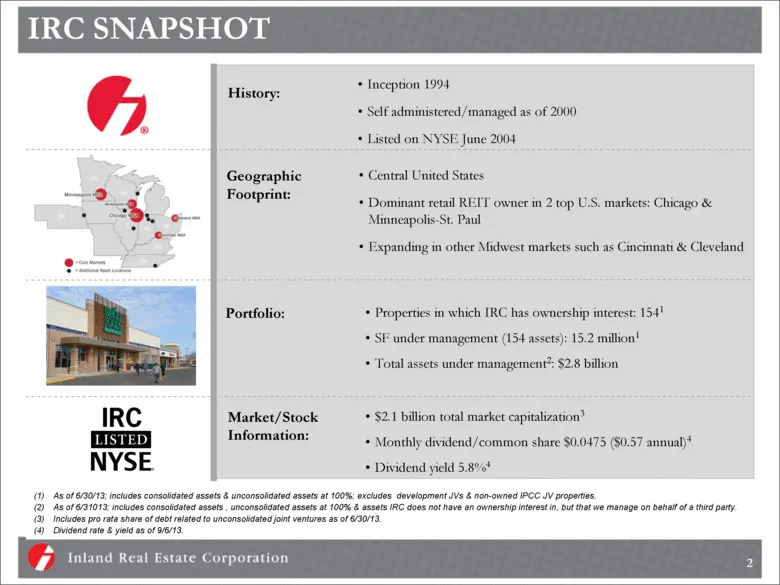
Slide 2: IRC Snapshot
IRC SNAPSHOT Inception 1994 Self administered/managed as of 2000 Listed on NYSE June 2004 Properties in which IRC has ownership interest: 1541 SF under management (154 assets): 15.2 million1 Total assets under management2: $2.8 billion $2.1 billion total market capitalization3 Monthly dividend/commo
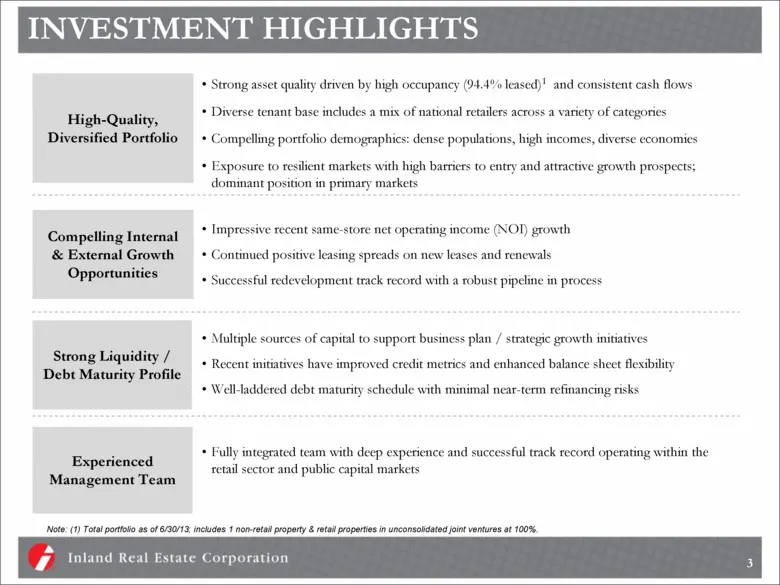
Slide 3: Investment Highlights
INVESTMENT HIGHLIGHTS High-Quality, Diversified Portfolio Strong asset quality driven by high occupancy (94.4% leased)1 and consistent cash flows Diverse tenant base includes a mix of national retailers across a variety of categories Compelling portfolio demographics: dense populations, high incomes
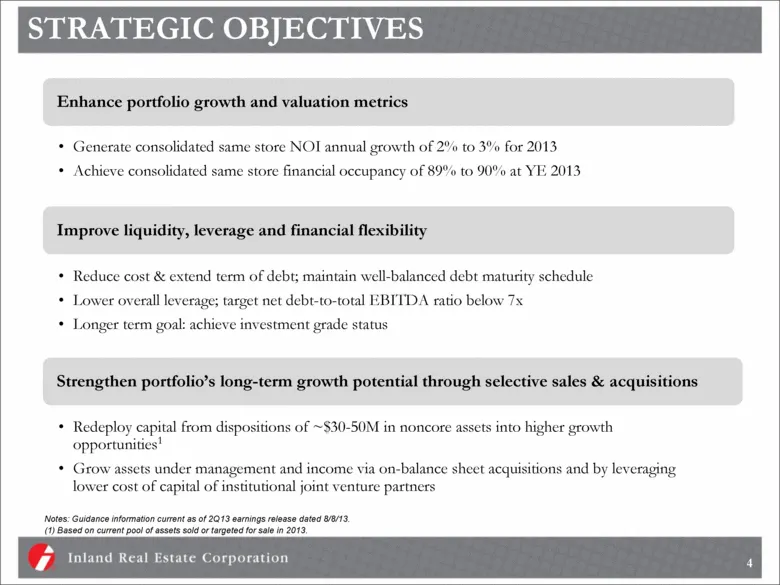
Slide 4: Strategic Objectives
STRATEGIC OBJECTIVES Generate consolidated same store NOI annual growth of 2% to 3% for 2013 Achieve consolidated same store financial occupancy of 89% to 90% at YE 2013 Enhance portfolio growth and valuation metrics Reduce cost & extend term of debt; maintain well-balanced debt maturity schedule Lo
Slide 5: High Quality, Stable Portfolio
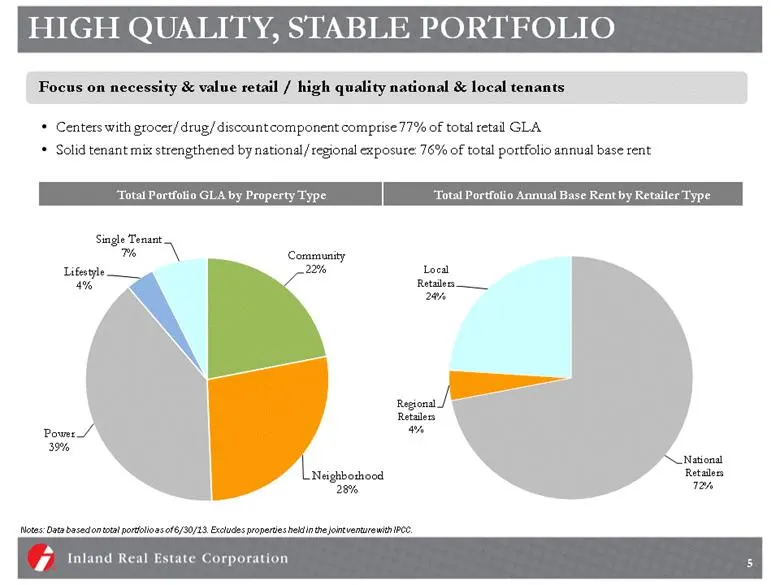
HIGH QUALITY, STABLE PORTFOLIO Centers with grocer/drug/discount component comprise 77% of total retail GLA Solid tenant mix strengthened by national/regional exposure: 76% of total portfolio annual base rent Focus on necessity & value retail / high quality national & local tenants Total Portfolio G
Slide 6: Diversified Tenant Base
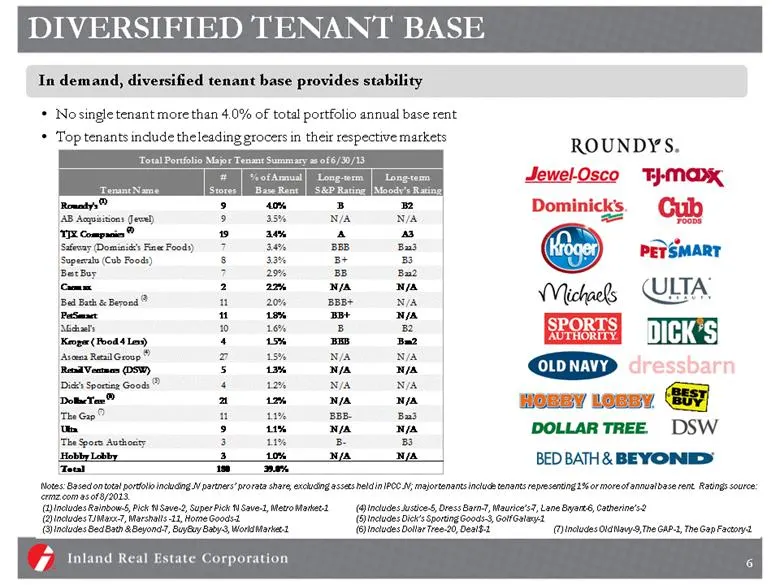
DIVERSIFIED TENANT BASE No single tenant more than 4.0% of total portfolio annual base rent Top tenants include the leading grocers in their respective markets In demand, diversified tenant base provides stability (1) Includes Rainbow-5, Pick ‘N Save-2, Super Pick ‘N Save-1, Metro Market-1 (2) Inclu
Slide 7: Strong Market Demographics
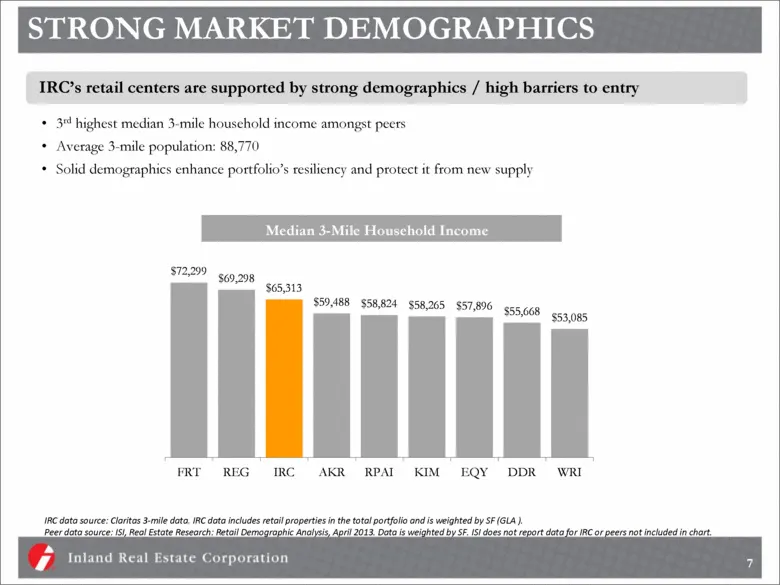
STRONG MARKET DEMOGRAPHICS 3rd highest median 3-mile household income amongst peers Average 3-mile population: 88,770 Solid demographics enhance portfolio’s resiliency and protect it from new supply IRC’s retail centers are supported by strong demographics / high barriers to entry Median 3-Mile Hous
Slide 8: Primary Markets
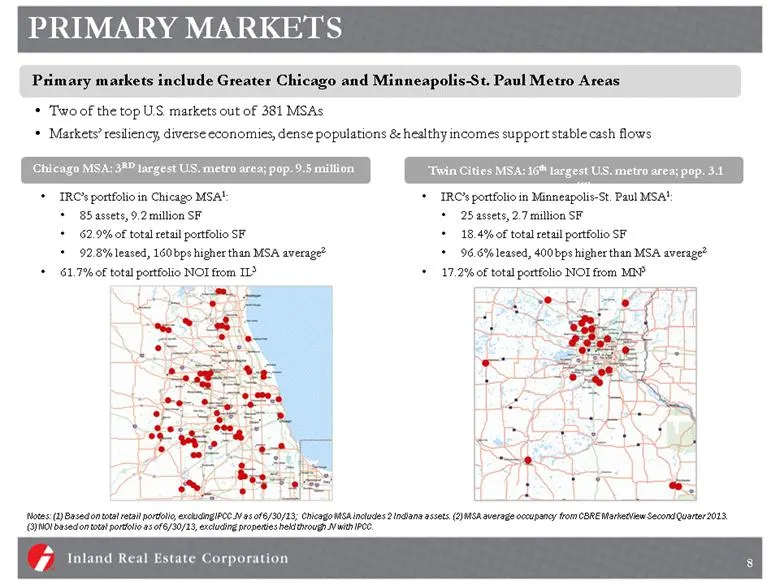
PRIMARY MARKETS Primary markets include Greater Chicago and Minneapolis-St. Paul Metro Areas Two of the top U.S. markets out of 381 MSAs Markets’ resiliency, diverse economies, dense populations & healthy incomes support stable cash flows Notes: (1) Based on total retail portfolio, excluding IPCC JV
Slide 9: Dominant REIT in Primary Markets
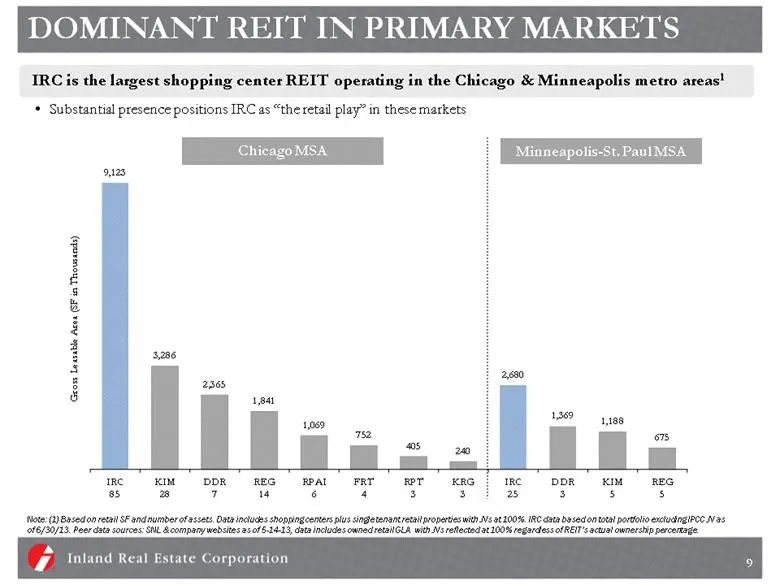
DOMINANT REIT IN PRIMARY MARKETS IRC is the largest shopping center REIT operating in the Chicago & Minneapolis metro areas1 Substantial presence positions IRC as “the retail play” in these markets Minneapolis-St. Paul MSA Note: (1) Based on retail SF and number of assets. Data includes shopping cen
Slide 10: Operating Strategy in Primary Markets
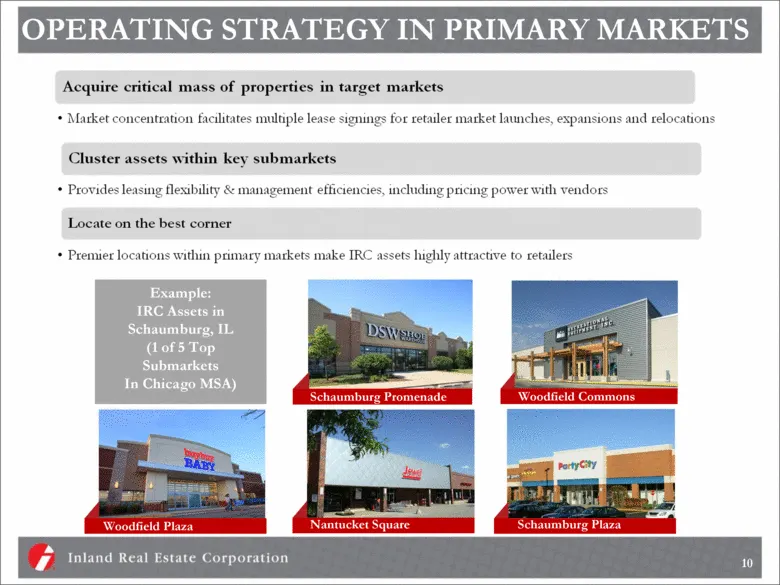
OPERATING STRATEGY IN PRIMARY MARKETS Schaumburg Promenade Woodfield Plaza Woodfield Commons Nantucket Square Example: IRC Assets in Schaumburg, IL (1 of 5 Top Submarkets In Chicago MSA) 10 Schaumburg Plaza Acquire critical mass of properties in target markets Market concentration facilitates multip
Slide 11: Internal Growth: Positive Rent Spreads
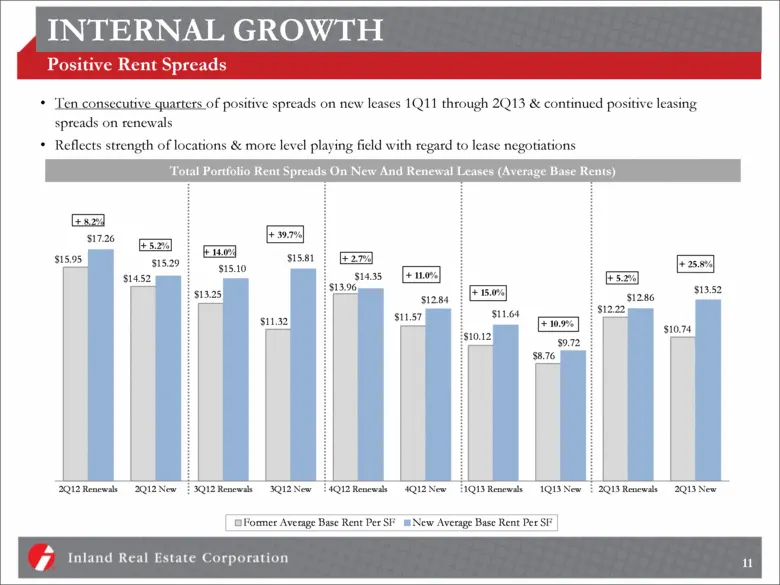
INTERNAL GROWTH Positive Rent Spreads Ten consecutive quarters of positive spreads on new leases 1Q11 through 2Q13 & continued positive leasing spreads on renewals Reflects strength of locations & more level playing field with regard to lease negotiations + 8.2% + 5.2% + 5.2% + 25.8% + 39.7% + 14.0%
Slide 12: Internal Growth: Consolidated Same Store NOI
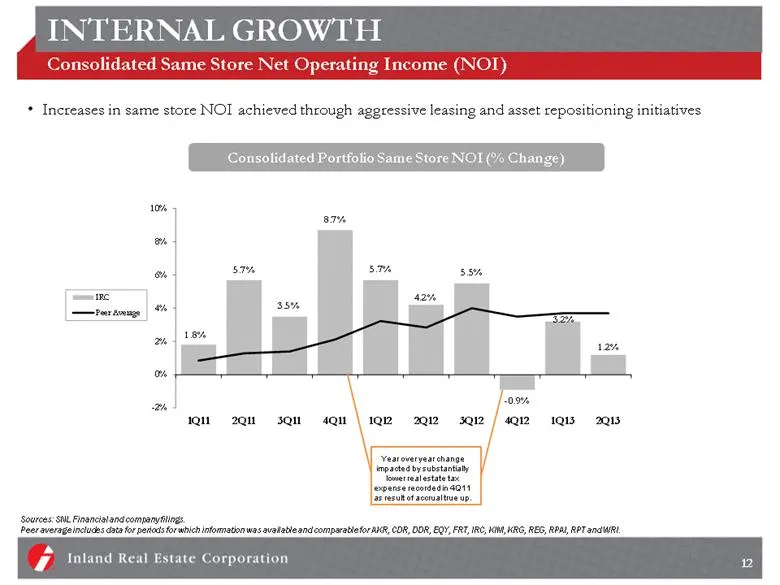
INTERNAL GROWTH Consolidated Same Store Net Operating Income (NOI) Increases in same store NOI achieved through aggressive leasing and asset repositioning initiatives Consolidated Portfolio Same Store NOI (% Change) Sources: SNL Financial and company filings. Peer average includes data for periods f
Slide 13: Value Creation: Repositioning/Redevelopment Track Record
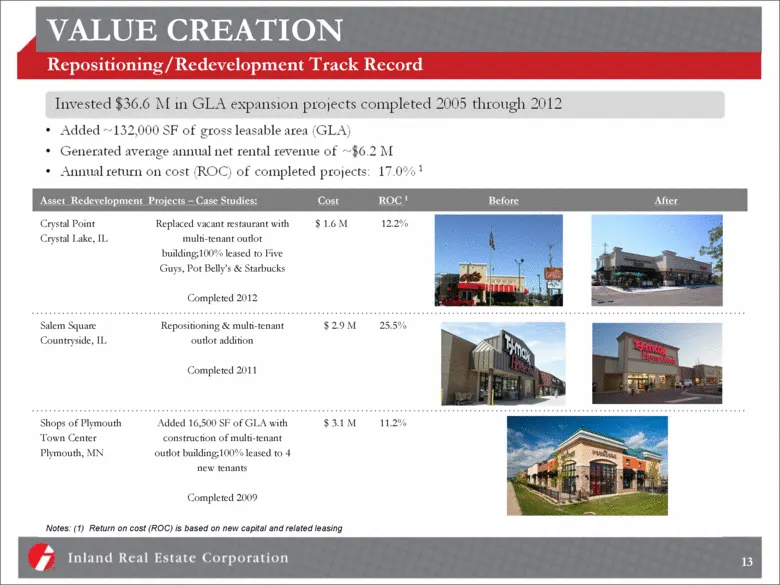
VALUE CREATION Repositioning/Redevelopment Track Record Asset Redevelopment Projects – Case Studies: Cost ROC 1 Before After Crystal Point Crystal Lake, IL Replaced vacant restaurant with multi-tenant outlot building;100% leased to Five Guys, Pot Belly’s & Starbucks Completed 2012 $ 1.6 M 12.2% Sale
Slide 14: Value Creation: Projects in Process
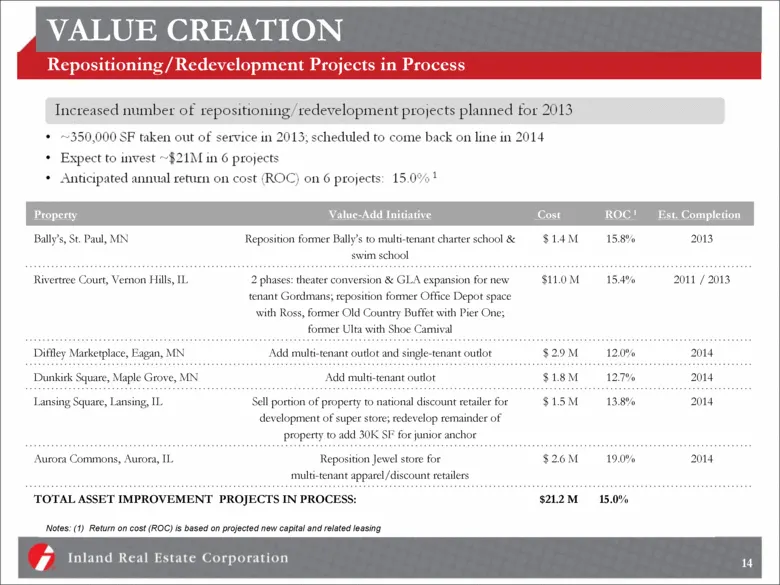
VALUE CREATION Repositioning/Redevelopment Projects in Process Property Value-Add Initiative Cost ROC 1 Est. Completion Bally’s, St. Paul, MN Reposition former Bally’s to multi-tenant charter school & swim school $ 1.4 M 15.8% 2013 Rivertree Court, Vernon Hills, IL 2 phases: theater conversion & GLA
Slide 15: Disciplined Investment Strategy
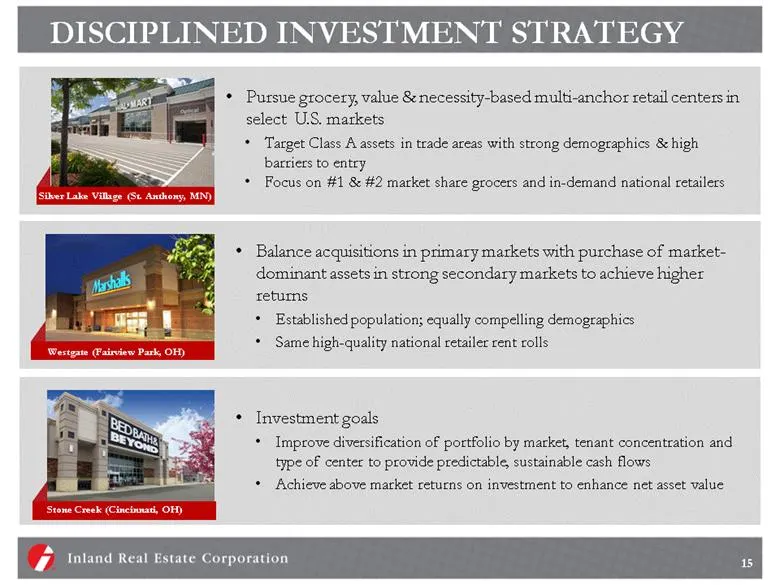
DISCIPLINED INVESTMENT STRATEGY Pursue grocery, value & necessity-based multi-anchor retail centers in select U.S. markets Target Class A assets in trade areas with strong demographics & high barriers to entry Focus on #1 & #2 market share grocers and in-demand national retailers Westgate (Fairview
Slide 16: Acquisition of NYSTRS Interest in JV
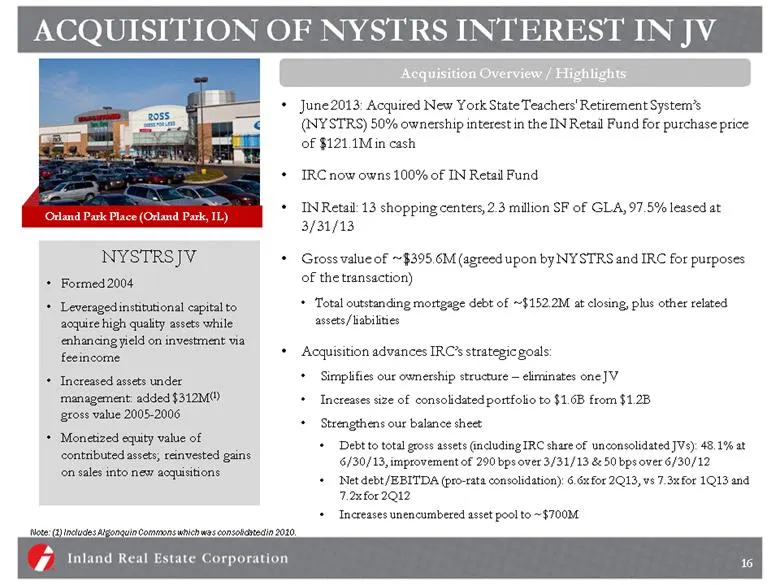
ACQUISITION OF NYSTRS INTEREST IN JV June 2013: Acquired New York State Teachers' Retirement System’s (NYSTRS) 50% ownership interest in the IN Retail Fund for purchase price of $121.1M in cash IRC now owns 100% of IN Retail Fund IN Retail: 13 shopping centers, 2.3 million SF of GLA, 97.5% leased at
Slide 17: Joint Venture Growth Strategies
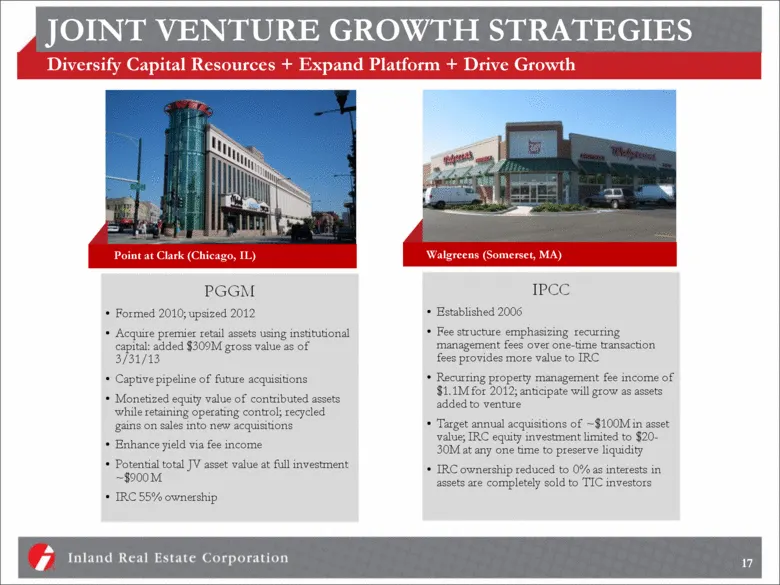
JOINT VENTURE GROWTH STRATEGIES Diversify Capital Resources + Expand Platform + Drive Growth Point at Clark (Chicago, IL) Walgreens (Somerset, MA) 17 PGGM Formed 2010; upsized 2012 Acquire premier retail assets using institutional capital: added $309M gross value as of 3/31/13 Captive pipeline of fu
Slide 18: Joint Venture Fee Income
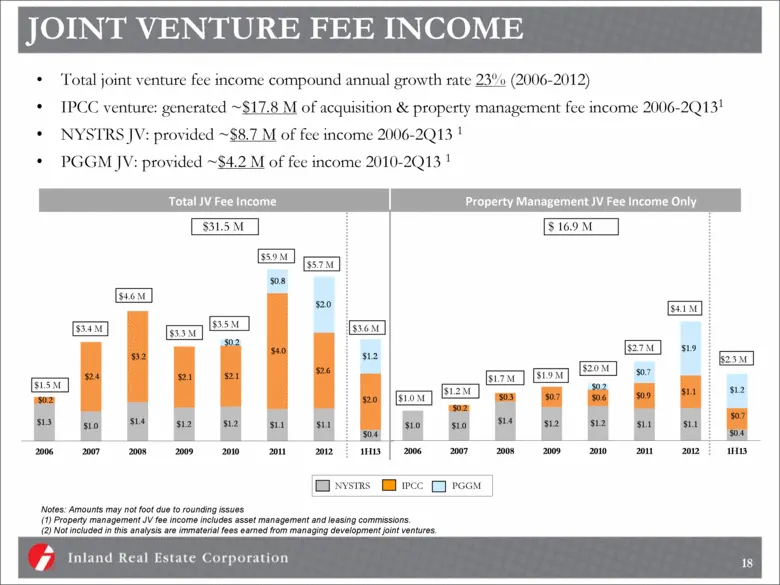
JOINT VENTURE FEE INCOME Total joint venture fee income compound annual growth rate 23% (2006-2012) IPCC venture: generated ~$17.8 M of acquisition & property management fee income 2006-2Q131 NYSTRS JV: provided ~$8.7 M of fee income 2006-2Q13 1 PGGM JV: provided ~$4.2 M of fee income 2010-2Q13 1 $3
Slide 19: Transaction History
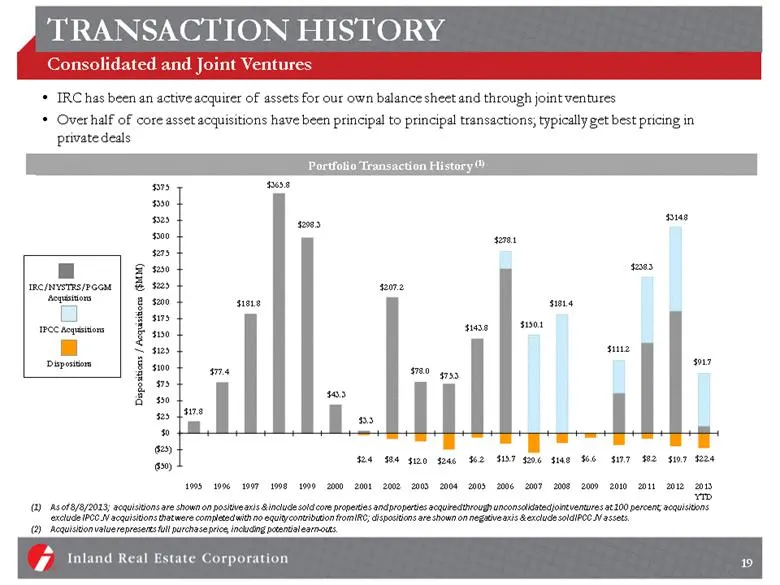
TRANSACTION HISTORY Consolidated and Joint Ventures IRC has been an active acquirer of assets for our own balance sheet and through joint ventures Over half of core asset acquisitions have been principal to principal transactions; typically get best pricing in private deals IRC/NYSTRS/PGGM Acquisiti
Slide 20: Recent Balance Sheet Initiatives
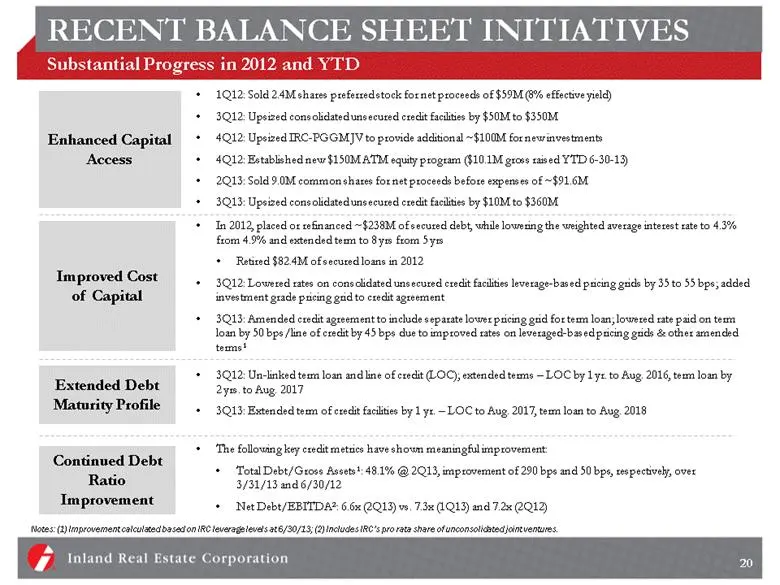
RECENT BALANCE SHEET INITIATIVES Substantial Progress in 2012 and YTD Enhanced Capital Access 1Q12: Sold 2.4M shares preferred stock for net proceeds of $59M (8% effective yield) 3Q12: Upsized consolidated unsecured credit facilities by $50M to $350M 4Q12: Upsized IRC-PGGM JV to provide additional ~
Slide 21: Consolidated Debt Maturities
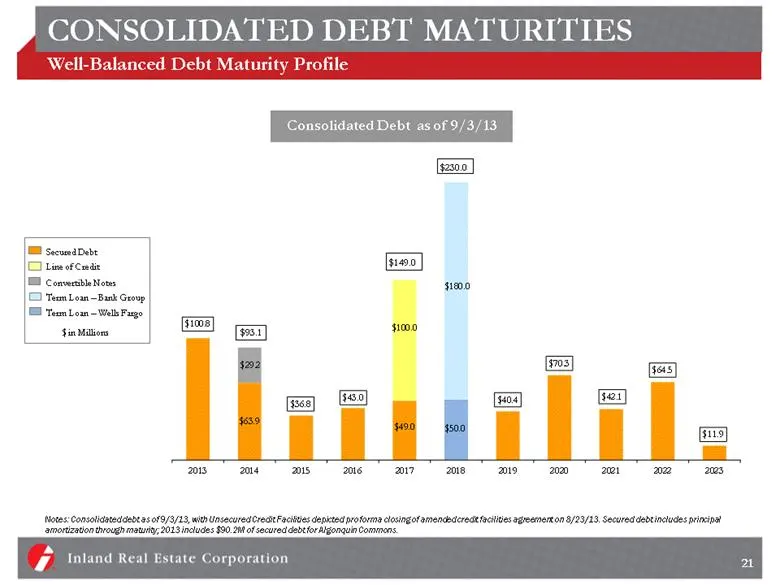
CONSOLIDATED DEBT MATURITIES Well-Balanced Debt Maturity Profile Consolidated Debt as of 9/3/13 Notes: Consolidated debt as of 9/3/13, with Unsecured Credit Facilities depicted pro forma closing of amended credit facilities agreement on 8/23/13. Secured debt includes principal amortization through m
Slide 22: Investment Summary
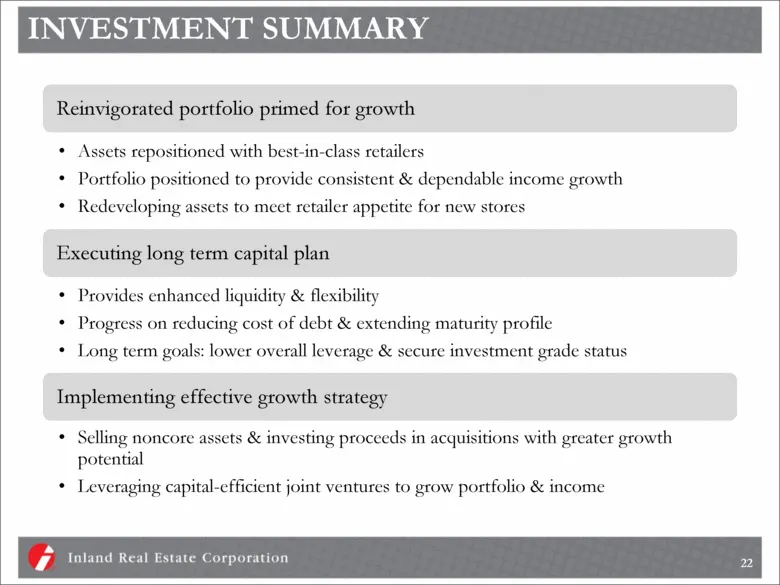
INVESTMENT SUMMARY Assets repositioned with best-in-class retailers Portfolio positioned to provide consistent & dependable income growth Redeveloping assets to meet retailer appetite for new stores Reinvigorated portfolio primed for growth Provides enhanced liquidity & flexibility Progress on reduc
Slide 23: Experienced Leadership Team
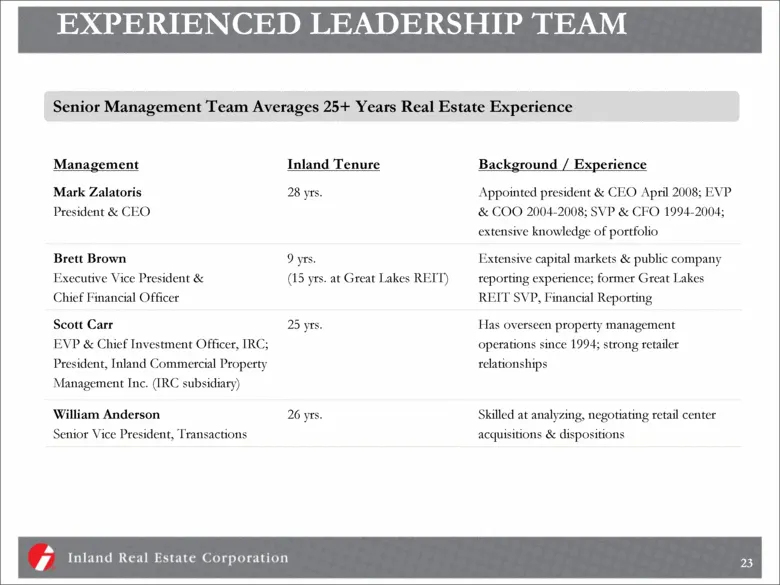
EXPERIENCED LEADERSHIP TEAM Management Inland Tenure Background / Experience Mark Zalatoris President & CEO 28 yrs. Appointed president & CEO April 2008; EVP & COO 2004-2008; SVP & CFO 1994-2004; extensive knowledge of portfolio Brett Brown Executive Vice President & Chief Financial Officer 9 yrs. (
Slide 24: Forward-Looking Statements
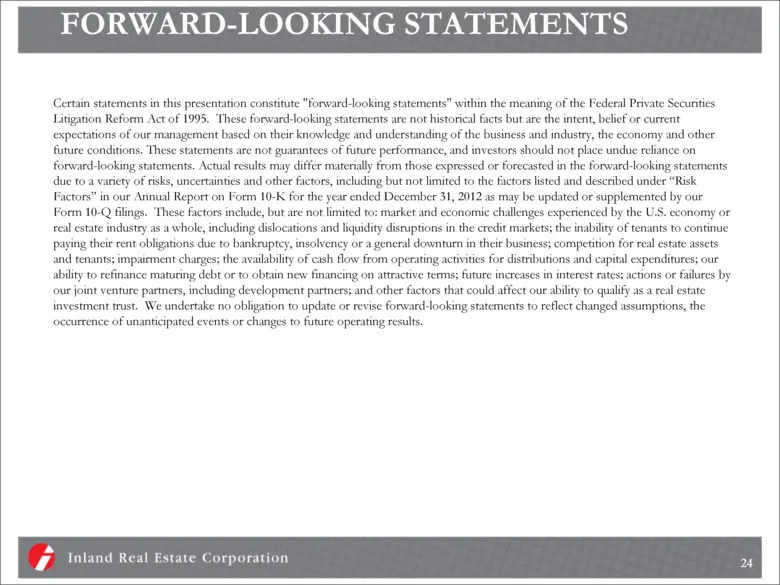
FORWARD-LOOKING STATEMENTS Certain statements in this presentation constitute "forward-looking statements" within the meaning of the Federal Private Securities Litigation Reform Act of 1995. These forward-looking statements are not historical facts but are the intent, belief or current expectations
Source: SEC EDGAR · 8-K filed Sep 11, 2013
More decks from Inland Real Estate Corp
 Investor Presentation (November 2015)30 slides · Nov 17, 2015
 Investor Presentation (September 2015)29 slides · Sep 16, 2015
 Investor Presentation (June 2015)29 slides · Jun 9, 2015
 Investor Presentation (May 2015)26 slides · May 15, 2015
 Investor Presentation (February 2015)26 slides · Feb 24, 2015
 Investor Presentation (November 2014)26 slides · Nov 5, 2014