Franklin Financial Network Inc
Franklin Financial Network — Shareholder Meeting (May 2016)
30 slides from Franklin Financial Network's shareholder meeting presentation, May 26, 2016
Slide 1: Franklin Financial Network Annual Meeting
May 26, 2016 Franklin Financial Network Annual Meeting Exhibit 99.1
Slide 2: Forward-Looking Statements
Forward-Looking Statements Except for the historical information contained herein, this presentation contains forward-looking statements within the meaning of Section 27A of the Securities Act of 1933, as amended, and Section 21E of the Securities Exchange Act of 1934, as amended. The forward-lookin
Slide 3: Agenda
Agenda Official Business Franklin Synergy Bank Progress Report Questions
Slide 4: Business: Election of Directors and Ratification of Auditors
Business First Item: Election of Board of Directors Second Item: Ratification of Auditors Mandy Garland Appointed Judge of the Election Quorum Is Present, Either in Person or by Proxy Anyone Who Would Like to Vote in Person or Who Would Like to Change Their Proxy? Results of Ballot
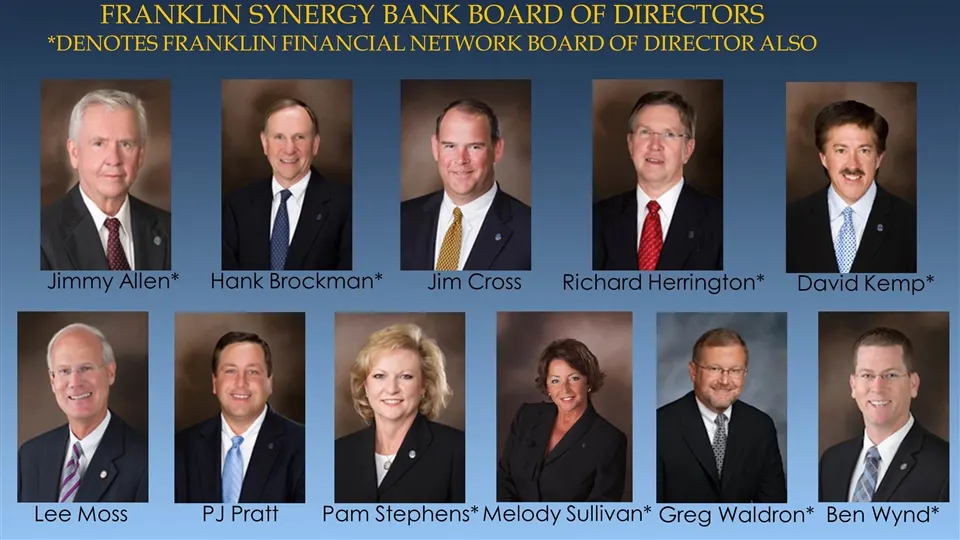
Slide 5: Franklin Synergy Bank Board of Directors
Franklin Synergy Bank Board of Directors *denotes Franklin Financial Network Board of Director also Jimmy Allen* Hank Brockman* PJ Pratt Pam Stephens* Lee Moss David Kemp* Richard Herrington* Jim Cross Greg Waldron* Melody Sullivan* Ben Wynd*

Slide 6: The Success of Franklin Synergy Bank
The Success of Franklin Synergy Bank
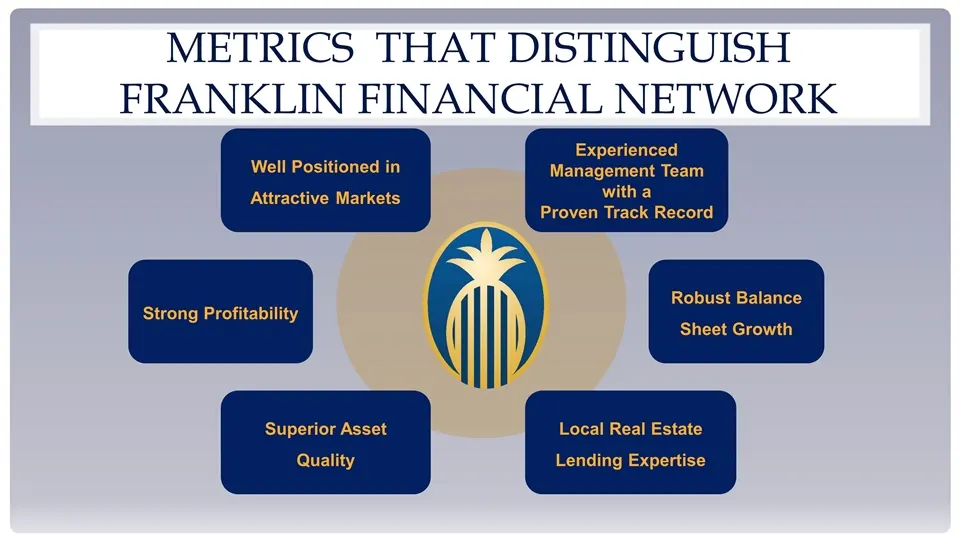
Slide 7: Metrics that Distinguish Franklin Financial Network
Metrics that distinguish Franklin financial network Experienced Management Team with a Proven Track Record Robust Balance Sheet Growth Local Real Estate Lending Expertise Well Positioned in Attractive Markets Color Scheme 255 175 53 249 221 151 255 212 64 128 180 220 43 98 182 21 47 88 Superior Asse
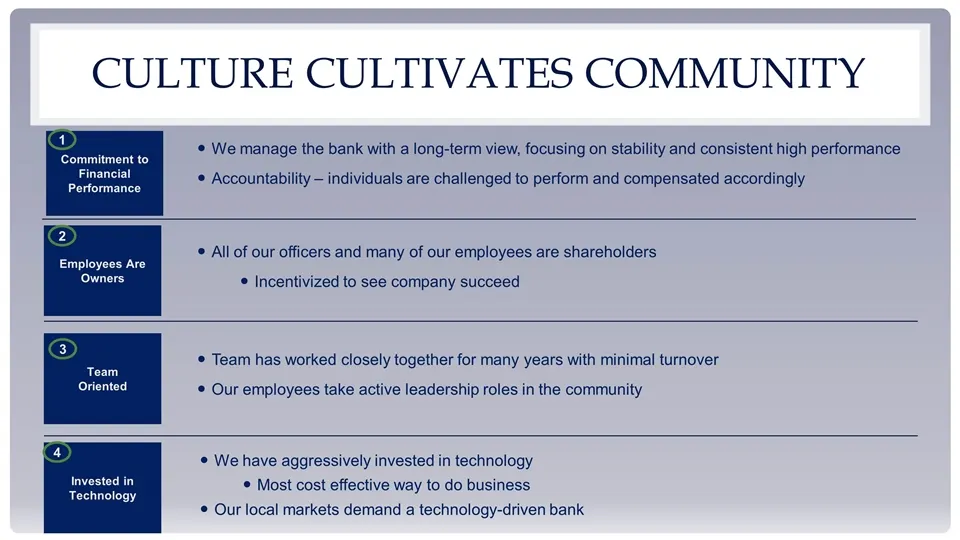
Slide 8: Culture Cultivates Community
Culture Cultivates Community Color Scheme 255 175 53 249 221 151 255 212 64 128 180 220 43 98 182 21 47 88 Commitment to Financial Performance Employees Are Owners Team Oriented 1 2 3 Invested in Technology 4 We manage the bank with a long-term view, focusing on stability and consistent high perform
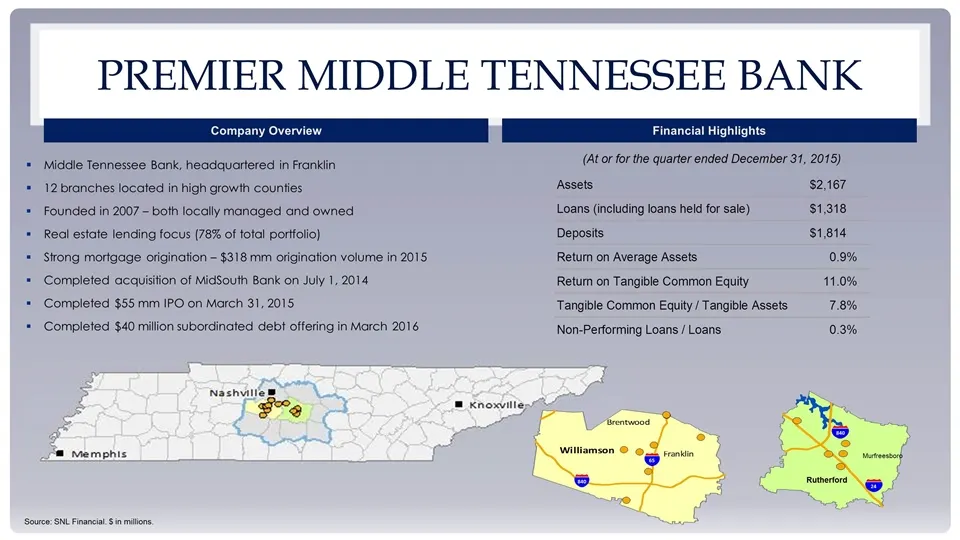
Slide 9: Premier Middle Tennessee Bank
Middle Tennessee Bank, headquartered in Franklin 12 branches located in high growth counties Founded in 2007 – both locally managed and owned Real estate lending focus (78% of total portfolio) Strong mortgage origination – $318 mm origination volume in 2015 Completed acquisition of MidSouth Bank on
Slide 10: Our Mission Statement
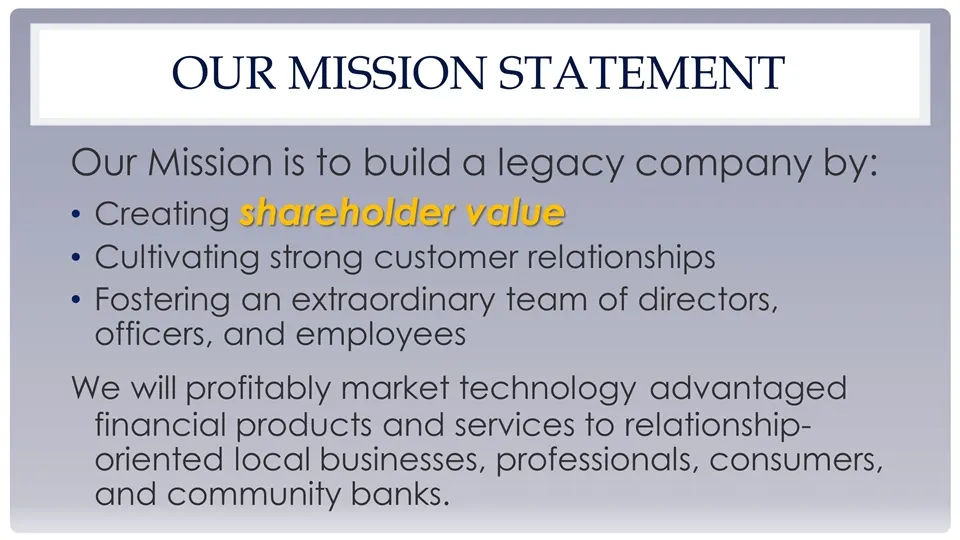
Our mission statement Our Mission is to build a legacy company by: Creating shareholder value Cultivating strong customer relationships Fostering an extraordinary team of directors, officers, and employees We will profitably market technology advantaged financial products and services to relationshi
Slide 11: Managing Banking Success
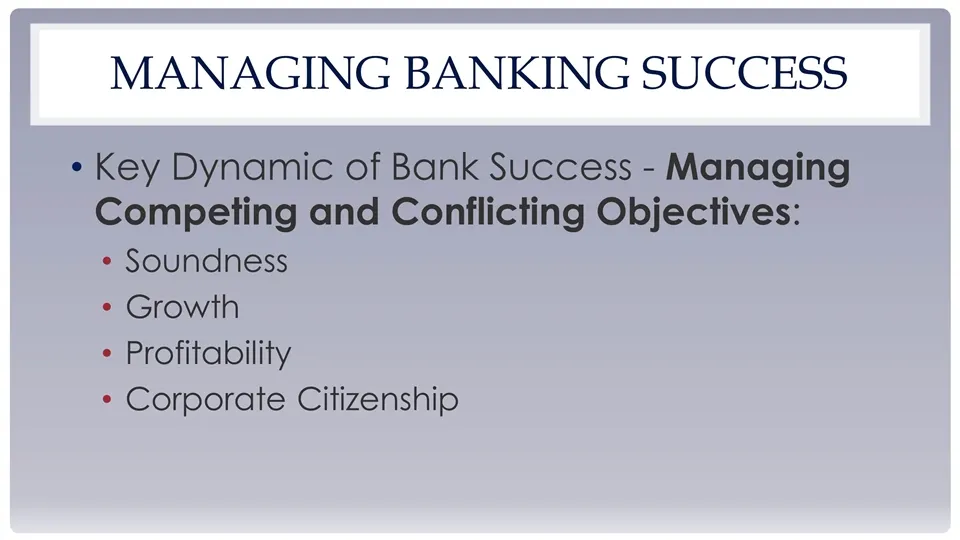
Managing Banking Success Key Dynamic of Bank Success - Managing Competing and Conflicting Objectives: Soundness Growth Profitability Corporate Citizenship

Slide 12: Soundness
SOUNDNESS Po
Slide 13: Asset Quality
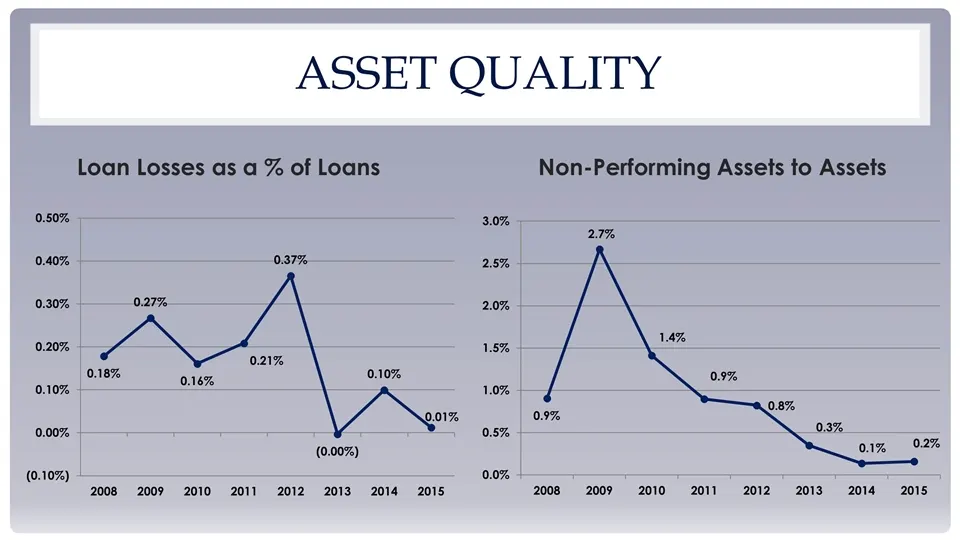
Asset Quality
Slide 14: Asset Quality - Texas Ratio
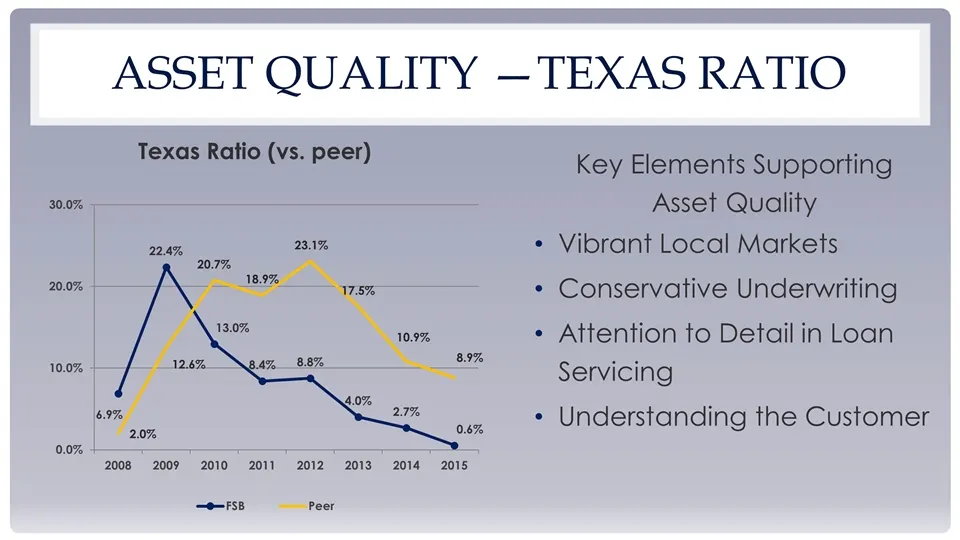
Asset Quality —Texas ratio Key Elements Supporting Asset Quality Vibrant Local Markets Conservative Underwriting Attention to Detail in Loan Servicing Understanding the Customer

Slide 15: Growth
GROWTH FT
Slide 16: Asset Growth
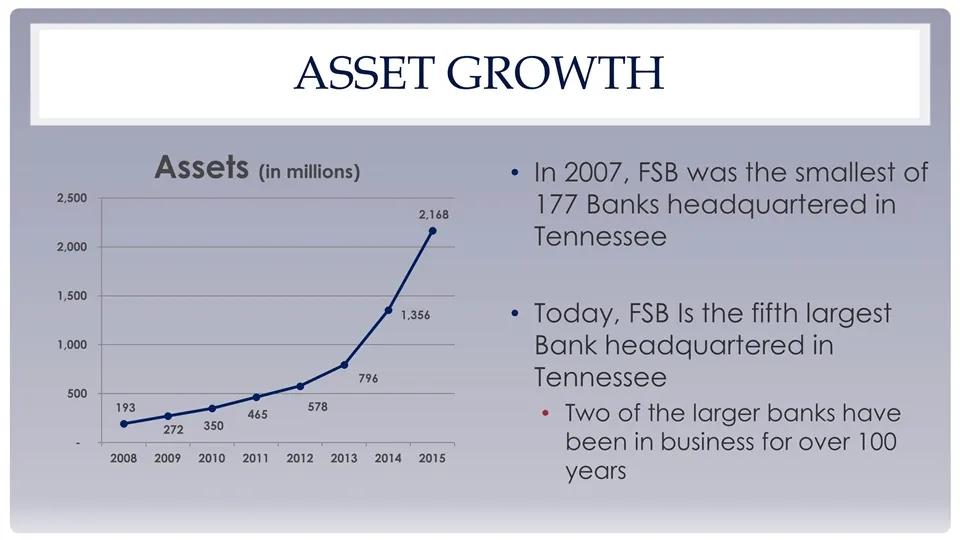
Asset Growth In 2007, FSB was the smallest of 177 Banks headquartered in Tennessee Today, FSB Is the fifth largest Bank headquartered in Tennessee Two of the larger banks have been in business for over 100 years
Slide 17: Deposit Growth
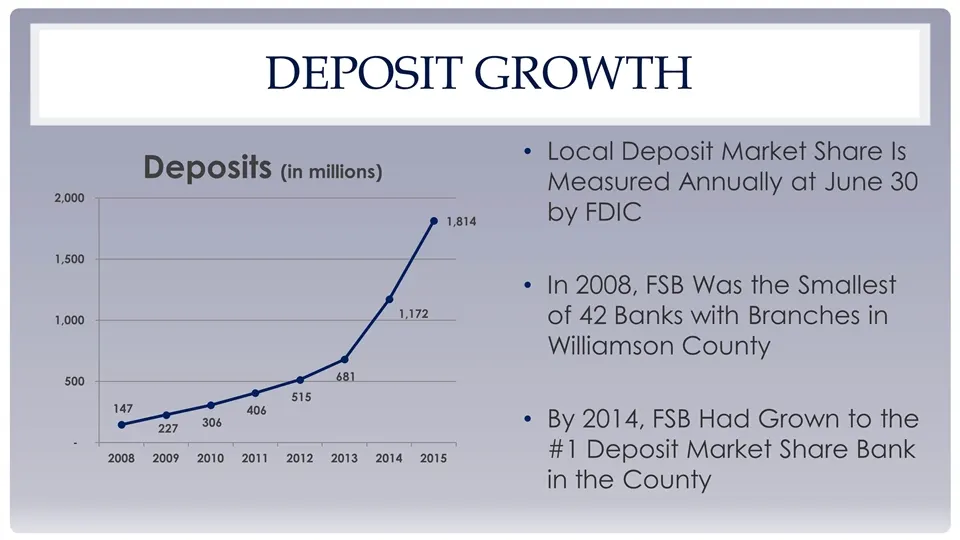
Deposit Growth Local Deposit Market Share Is Measured Annually at June 30 by FDIC In 2008, FSB Was the Smallest of 42 Banks with Branches in Williamson County By 2014, FSB Had Grown to the #1 Deposit Market Share Bank in the County
Slide 18: Loan Growth
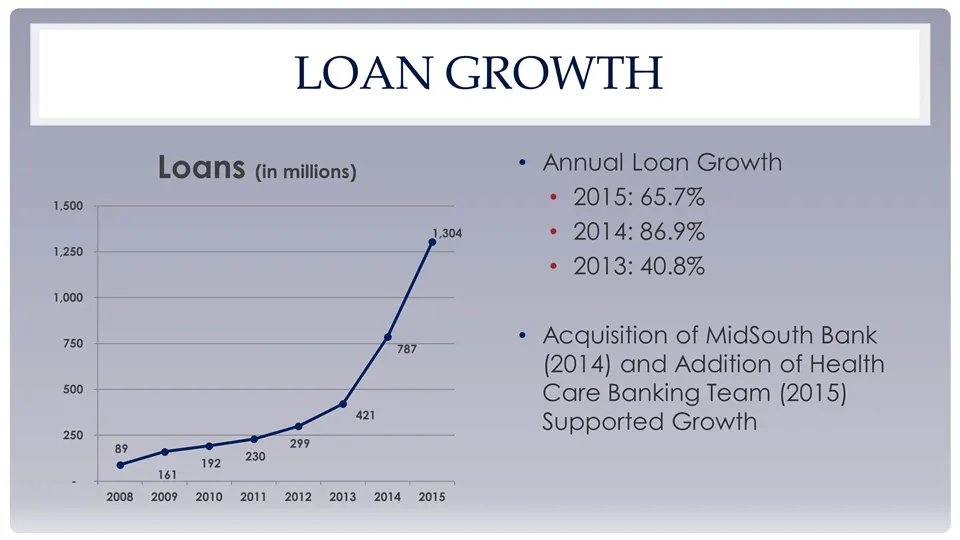
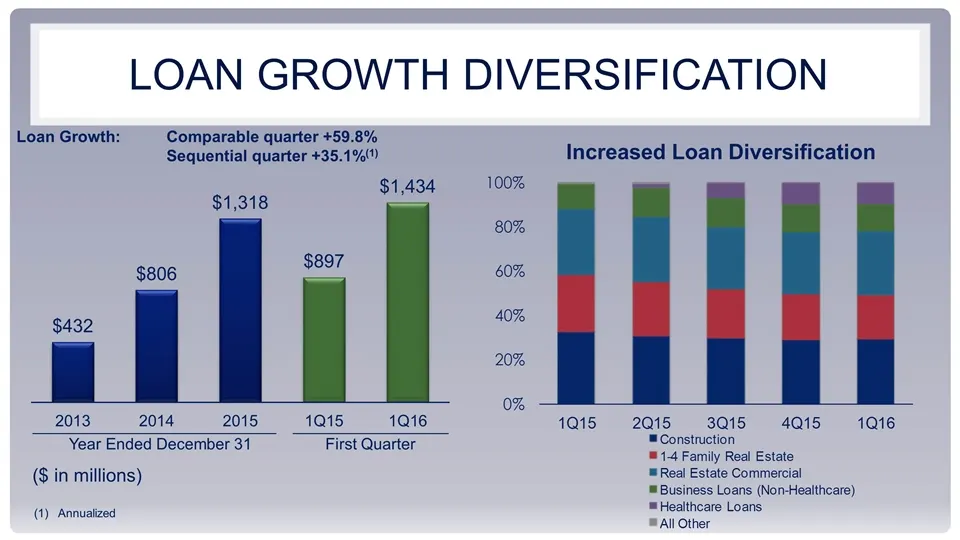
Loan Growth Annual Loan Growth 2015: 65.7% 2014: 86.9% 2013: 40.8% Acquisition of MidSouth Bank (2014) and Addition of Health Care Banking Team (2015) Supported Growth

Slide 19: Profitability
PROFITABILITY Po
Slide 20: Growth in Net Income and EPS
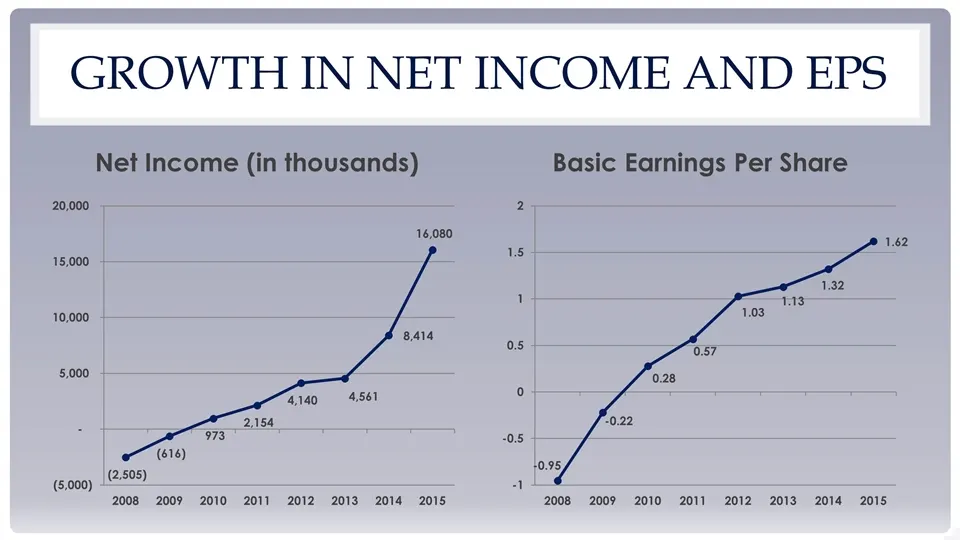
Growth in Net Income and EPS
Slide 21: Increasing Profitability
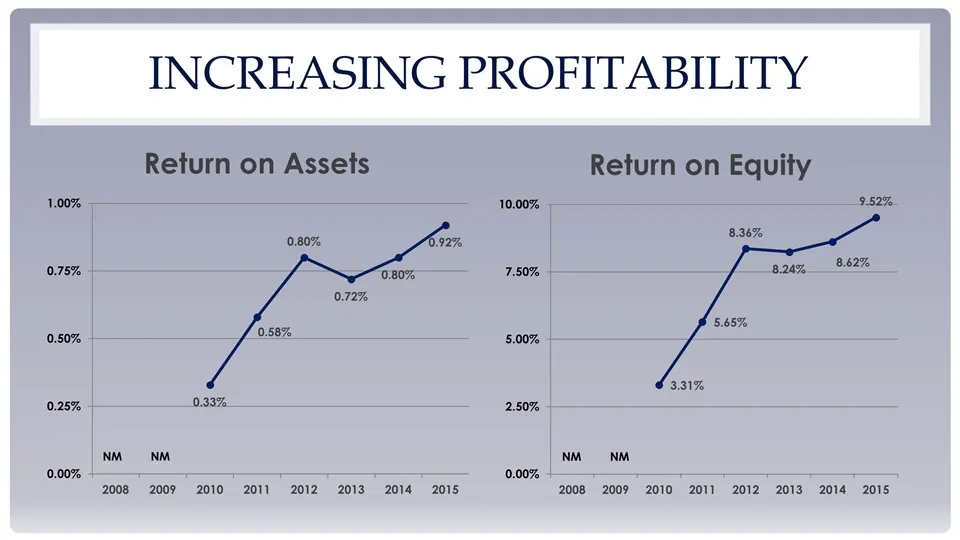
Increasing Profitability
Slide 22: Key Elements of Profitability
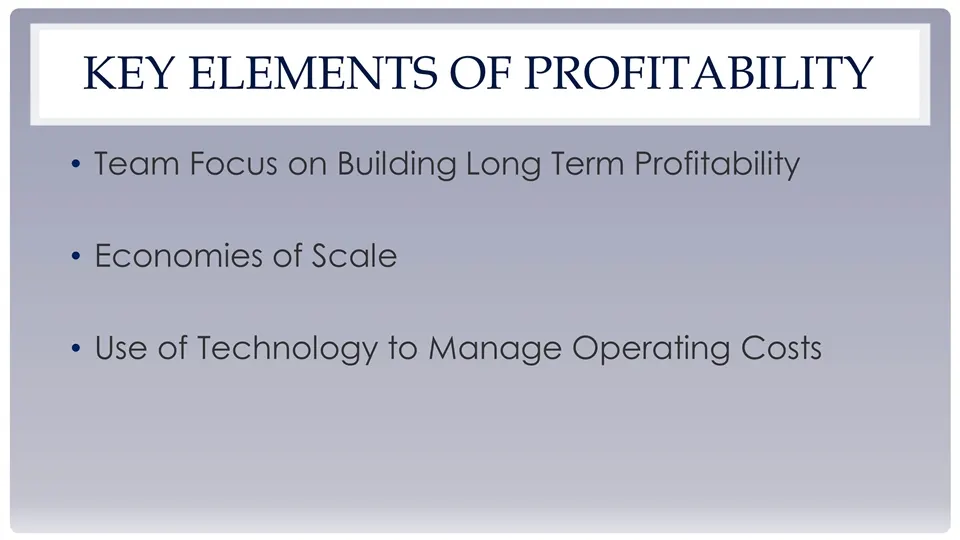
Key Elements of Profitability Team Focus on Building Long Term Profitability Economies of Scale Use of Technology to Manage Operating Costs

Slide 23: Corporate Citizenship
CORPORATE CITIZENSHIP Po

Slide 24: Corporate Citizenship
Corporate Citizenship Provide Leadership for Civic, Professional, and Charitable Organizations within the Community As “Trustee of Public Faith”, Adhere to Regulatory Guidelines and Practices

Slide 25: First Quarter 2016 Update
FIRST QUARTER 2016 UPDATE Po
Slide 26: First Quarter 2016 Highlights
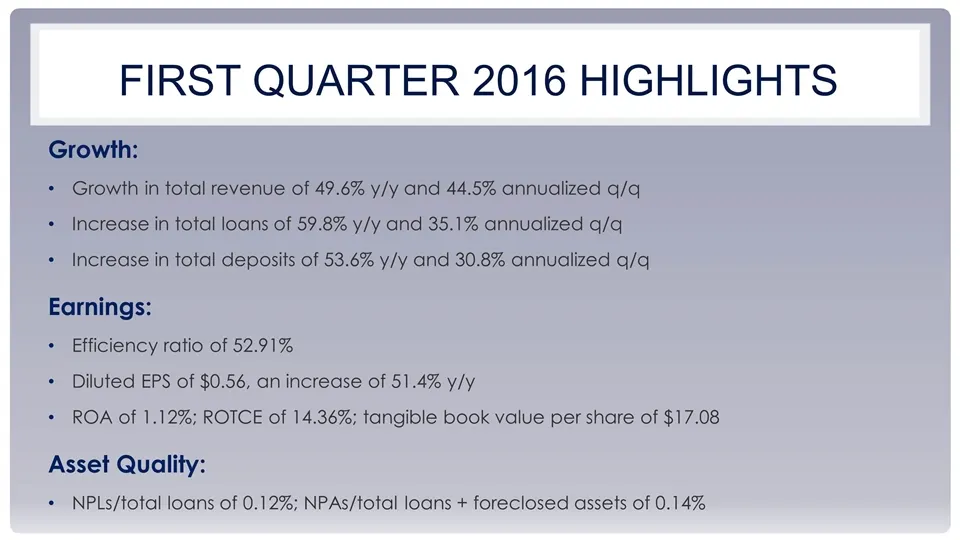
First Quarter 2016 Highlights Growth: Growth in total revenue of 49.6% y/y and 44.5% annualized q/q Increase in total loans of 59.8% y/y and 35.1% annualized q/q Increase in total deposits of 53.6% y/y and 30.8% annualized q/q Earnings: Efficiency ratio of 52.91% Diluted EPS of $0.56, an increase of
Slide 27: First Quarter Loan Growth Diversification
First Quarter Loan Growth Diversification ($ in millions) Loan Growth:Comparable quarter +59.8% Sequential quarter +35.1%(1) Increased Loan Diversification Year Ended December 31 Annualized
Slide 28: Asset Quality Remains Strong
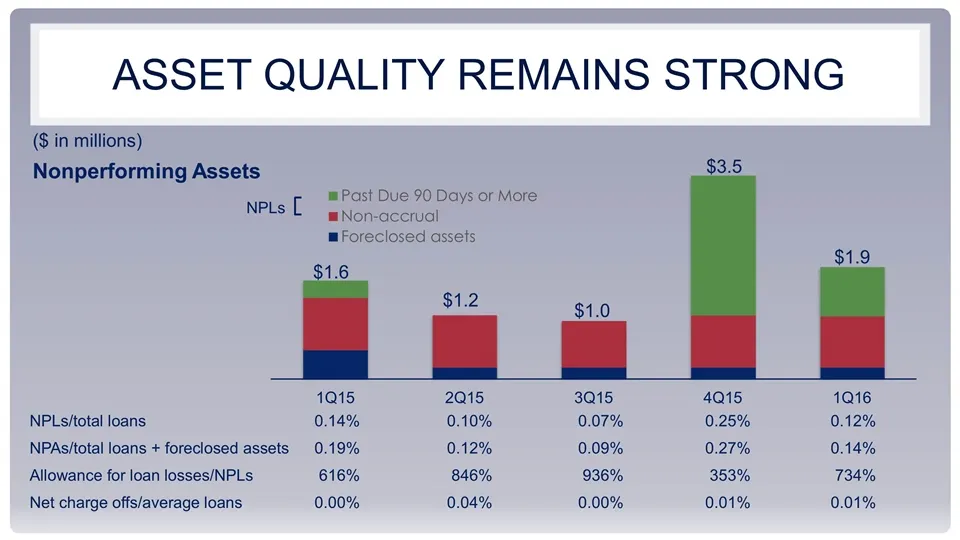
Asset Quality Remains Strong ($ in millions) Nonperforming Assets NPLs/total loans0.14%0.10%0.07%0.25%0.12% NPAs/total loans + foreclosed assets0.19% 0.12% 0.09% 0.27% 0.14% Allowance for loan losses/NPLs 616% 846% 936% 353% 734% Net charge offs/average loans 0.00% 0.04% 0.00% 0.01% 0.01% $1.6 $1.2
Slide 29: Improving Efficiencies
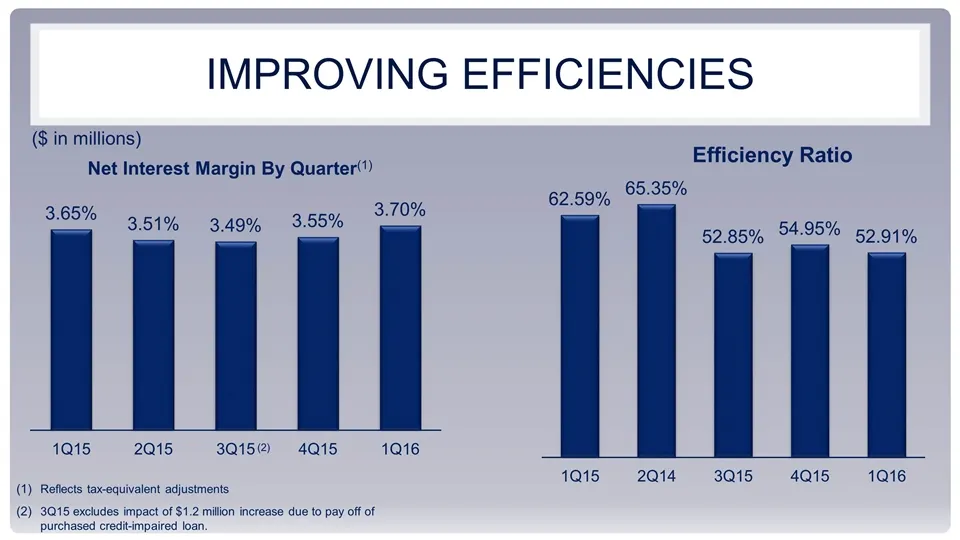
Improving Efficiencies ($ in millions) Net Interest Margin By Quarter(1) Reflects tax-equivalent adjustments 3Q15 excludes impact of $1.2 million increase due to pay off of purchased credit-impaired loan. (2) Efficiency Ratio (2)

Slide 30: Questions
QUESTIONS Po
Source: SEC EDGAR · 8-K filed May 26, 2016
More decks from Franklin Financial Network Inc
 Merger or Acquisition (January 2020)17 slides · Jan 21, 2020
 Q3 2019 Earnings Presentation21 slides · Nov 1, 2019
 Q3 2019 Earnings Presentation15 slides · Oct 23, 2019
 Q2 2019 Earnings Presentation19 slides · Jul 26, 2019
 Q2 2019 Earnings Presentation15 slides · Jul 24, 2019
 Q1 2019 Earnings Presentation19 slides · May 10, 2019