Teppco Partners LP — Investor Day (August 2006)
84 slides from Teppco Partners LP's investor day presentation, Aug 16, 2006
Slide 1: TEPPCO Partners, L.P. Analyst Meeting August 16, 2006
TEPPCO Partners, L.P. Analyst Meeting August 16, 2006
Slide 2: Forward-looking Statements
Forward-looking Statements The material and information furnished in this presentation includes “forward-looking statements” within the meaning of the federal securities laws. All statements that express belief, expectation, estimates or intentions, as well as those that are not statements of histor
Slide 3: Forward-looking Statements (continued)
Forward-looking Statements ....trucking and railroad freight, agricultural usage and military usage; the demand for propane is sensitive to the weather and prevailing economic conditions; the demand for petrochemicals is dependent upon prices for products produced from petrochemicals; the demand for
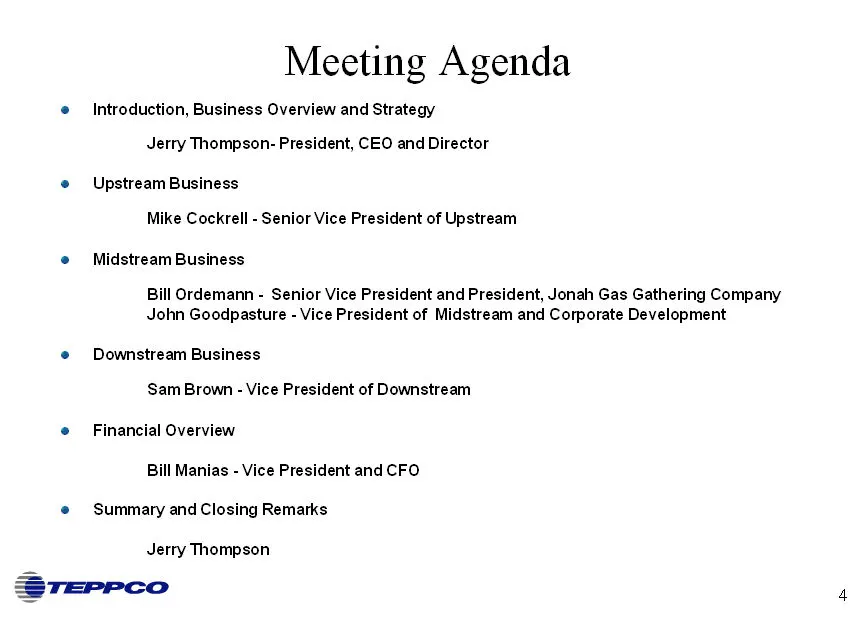
Slide 4: Meeting Agenda
Meeting Agenda Introduction, Business Overview and Strategy Jerry Thompson- President, CEO and Director Upstream Business Mike Cockrell - Senior Vice President of Upstream Midstream Business Bill Ordemann - Senior Vice President and President, Jonah Gas Gathering Company John Goodpasture - Vice Pres
Slide 5: Introduction: Business Overview and Strategy
Introduction Business Overview and Strategy Jerry Thompson
Slide 6: TEPPCO System Map
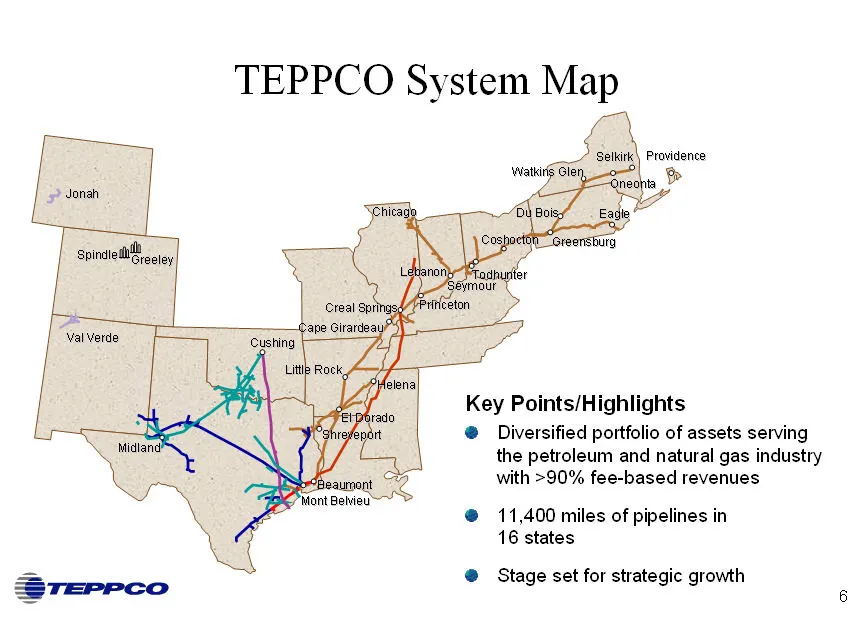
TEPPCO System Map Key Points/Highlights Diversified portfolio of assets serving the petroleum and natural gas industry with >90% fee-based revenues 11,400 miles of pipelines in 16 states Stage set for strategic growth
Slide 7: Diversified Operations
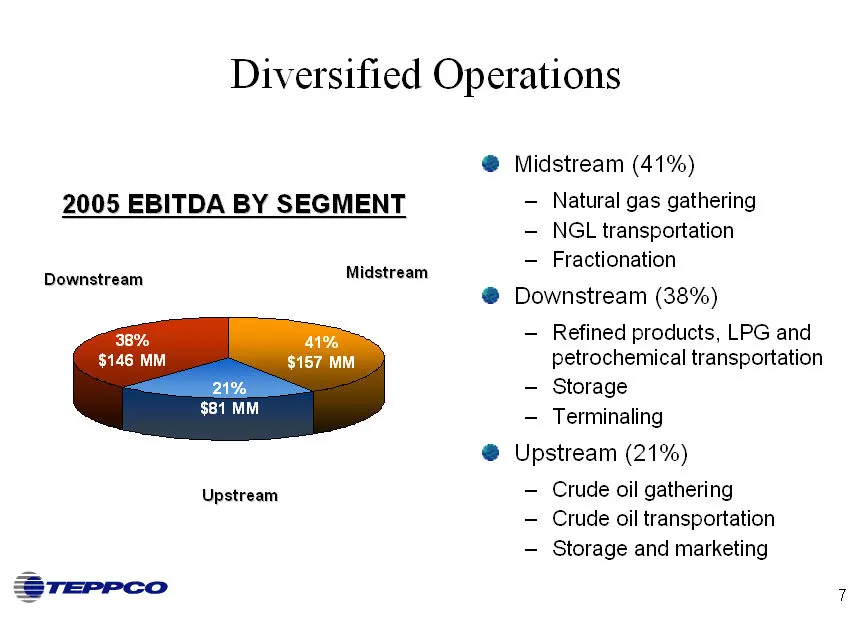
Diversified Operations Midstream (41%) Natural gas gathering NGL transportation Fractionation Downstream (38%) Refined products, LPG and petrochemical transportation Storage Terminaling Upstream (21%) Crude oil gathering Crude oil transportation Storage and marketing
Slide 8: Demonstrated Distribution Growth and Attractive Returns
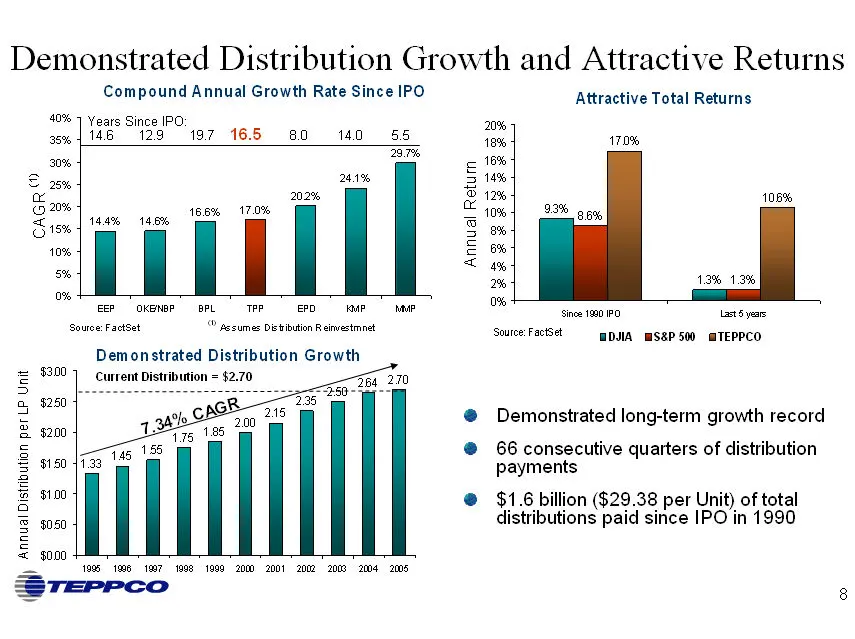
Demonstrated Distribution Growth and Attractive Returns Demonstrated long-term growth record 66 consecutive quarters of distribution payments $1.6 billion ($29.38 per Unit) of total distributions paid since IPO in 1990
Slide 9: U.S. Refining and Marketing Business Fundamentals
U.S. Refining and Marketing Business Fundamentals
Slide 10: World Environment
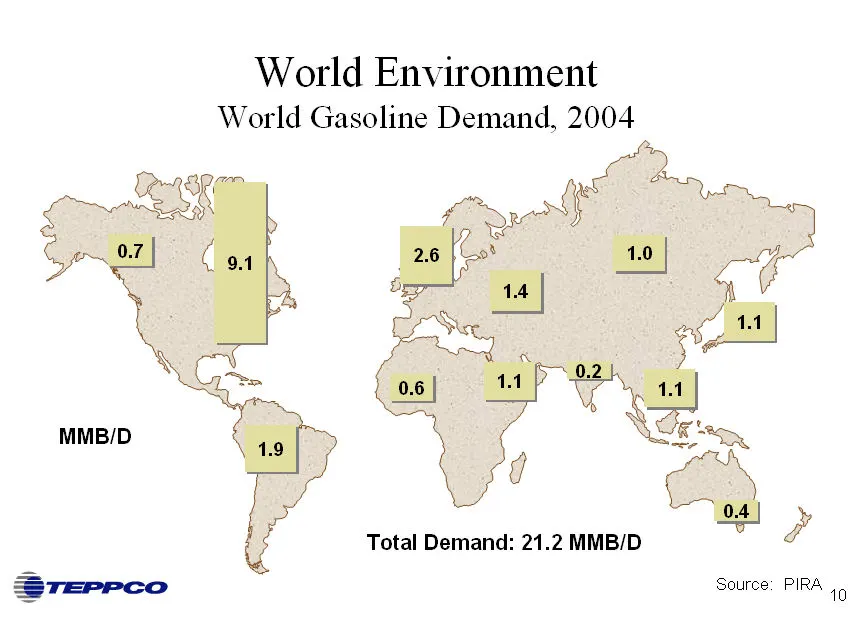
World Environment World Gasoline Demand, 2004 Total Demand: 21.2 MMB/D
Slide 11: U.S. Refining Industry
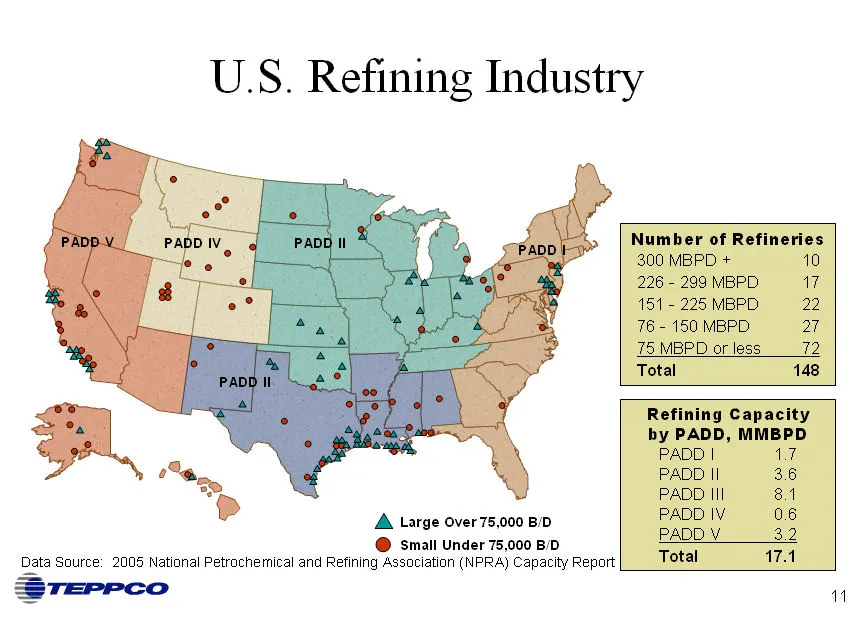
U.S. Refining Industry Data Source: 2005 National Petrochemical and Refining Association (NPRA) Capacity Report
Slide 12: U.S. Gasoline Trade Flow
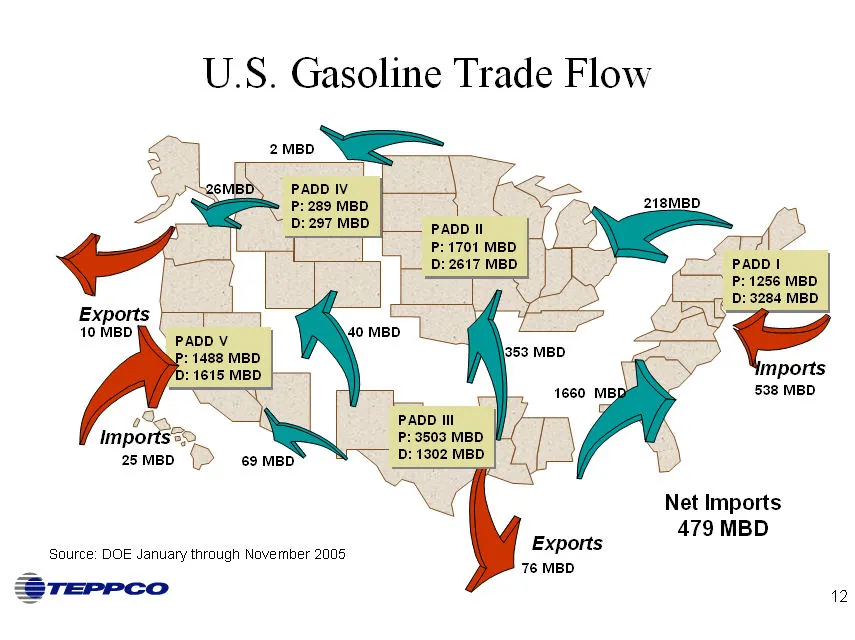
U.S. Gasoline Trade Flow Source: DOE January through November 2005
Slide 13: U.S. Jet Trade Flow
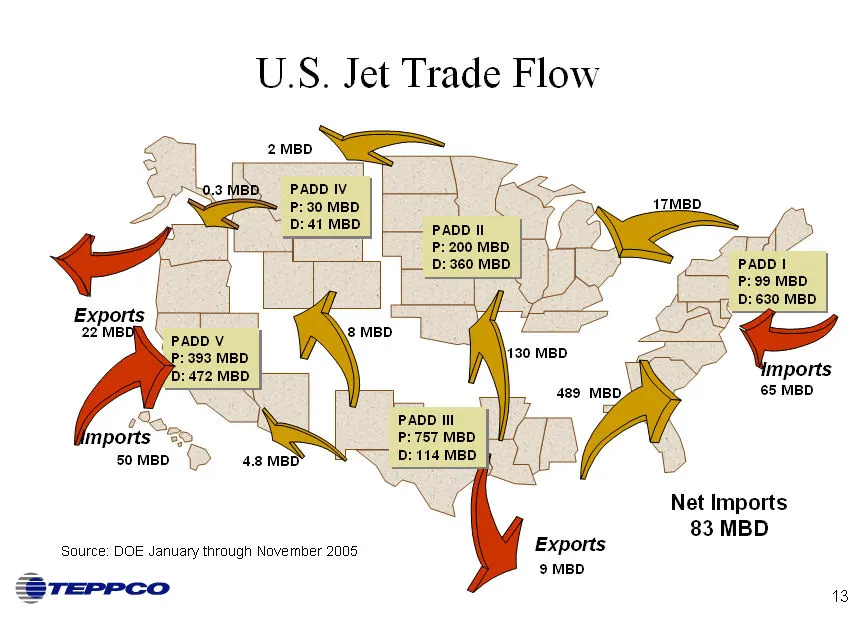
U.S. Jet Trade Flow Source: DOE January through November 2005
Slide 14: U.S. Distillate Trade Flow
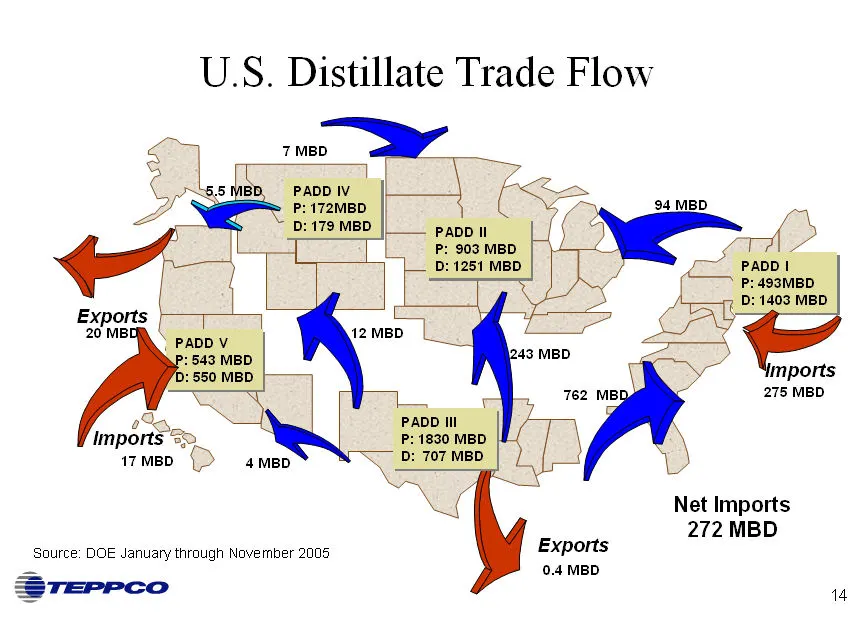
U.S. Distillate Trade Flow Source: DOE January through November 2005
Slide 15: U.S. Crude Imports and Forecast
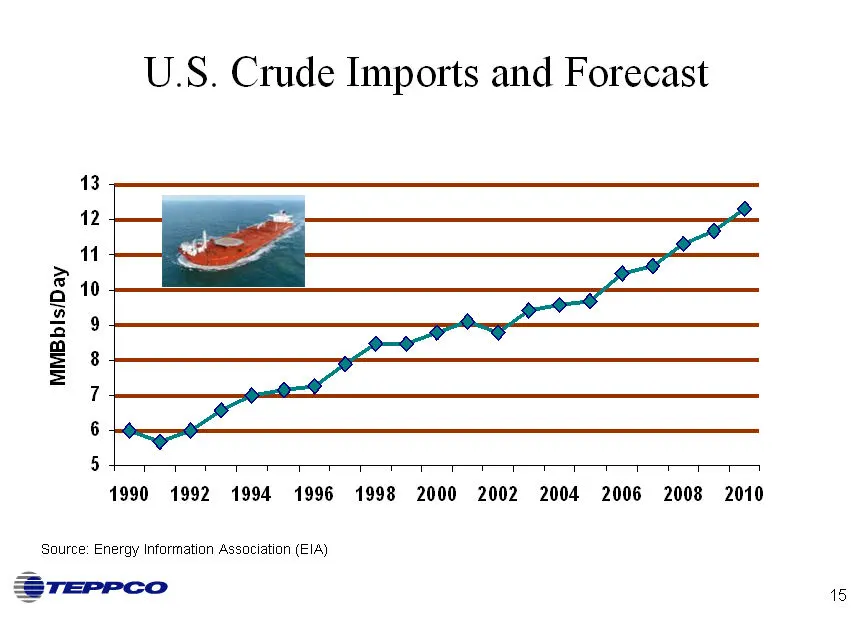
U.S. Crude Imports and Forecast Source: Energy Information Association (EIA)
Slide 16: Canadian Crude Supply Forecast by Type
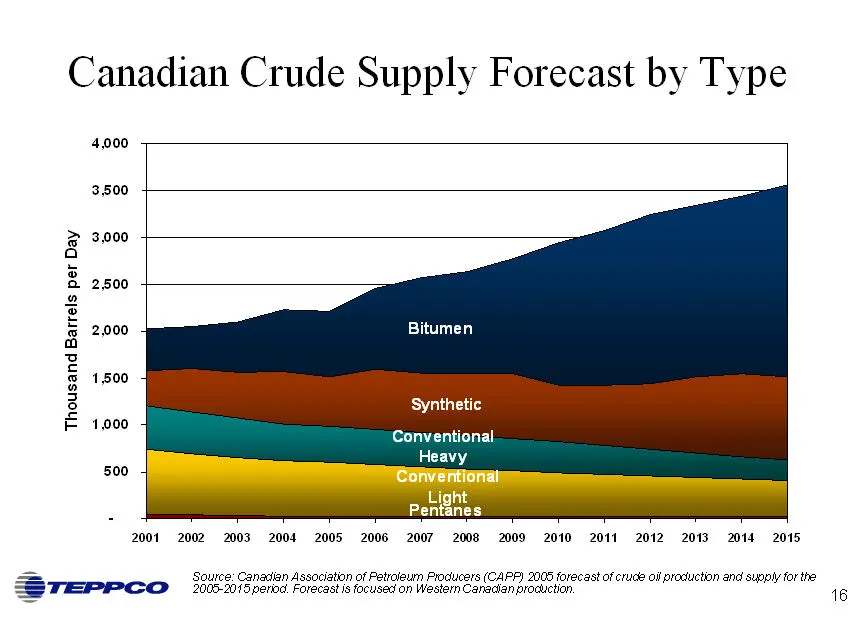
Canadian Crude Supply Forecast by Type Source: Canadian Association of Petroleum Producers (CAPP) 2005 forecast of crude oil production and supply for the 2005-2015 period. Forecast is focused on Western Canadian production.
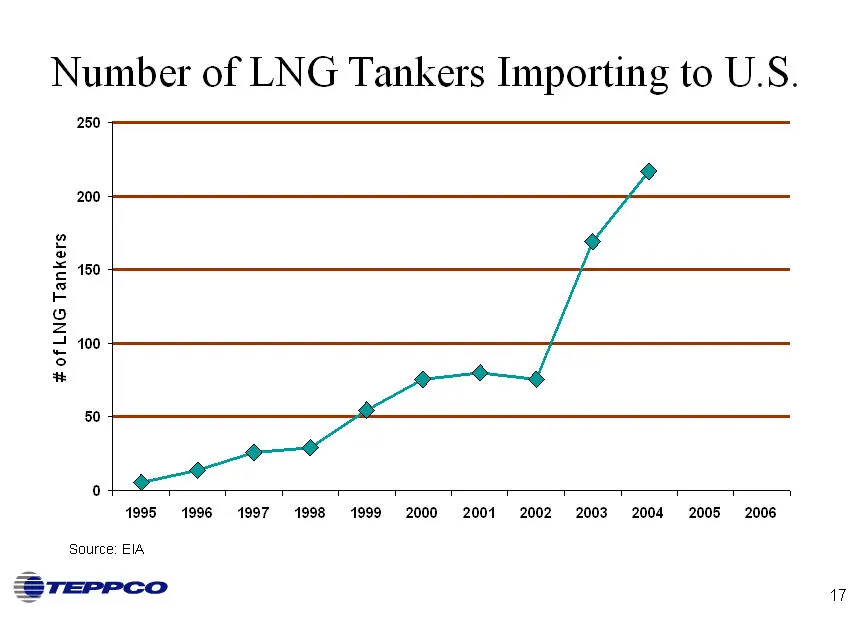
Slide 17: Number of LNG Tankers Importing to U.S.
Number of LNG Tankers Importing to U.S. Source: EIA
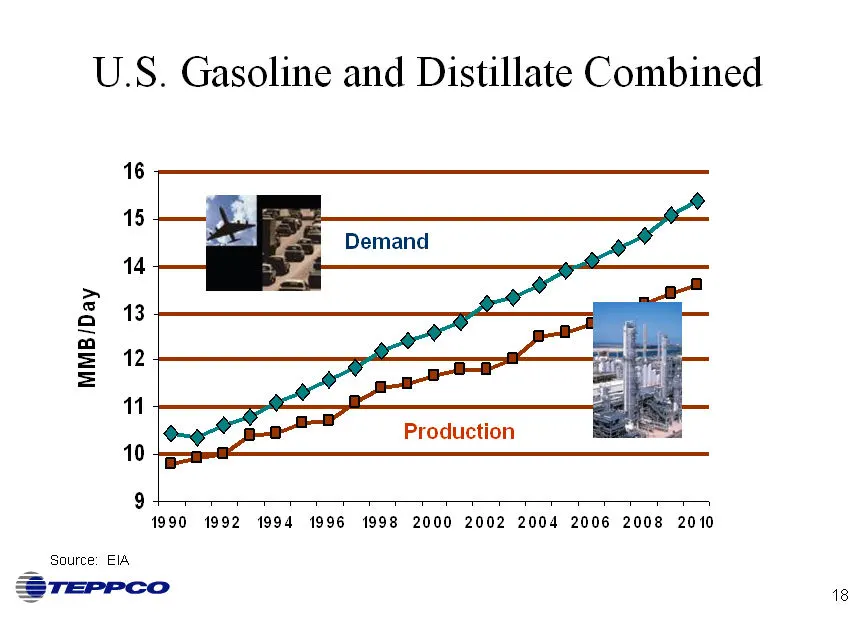
Slide 18: U.S. Gasoline and Distillate Combined
U.S. Gasoline and Distillate Combined Source: EIA
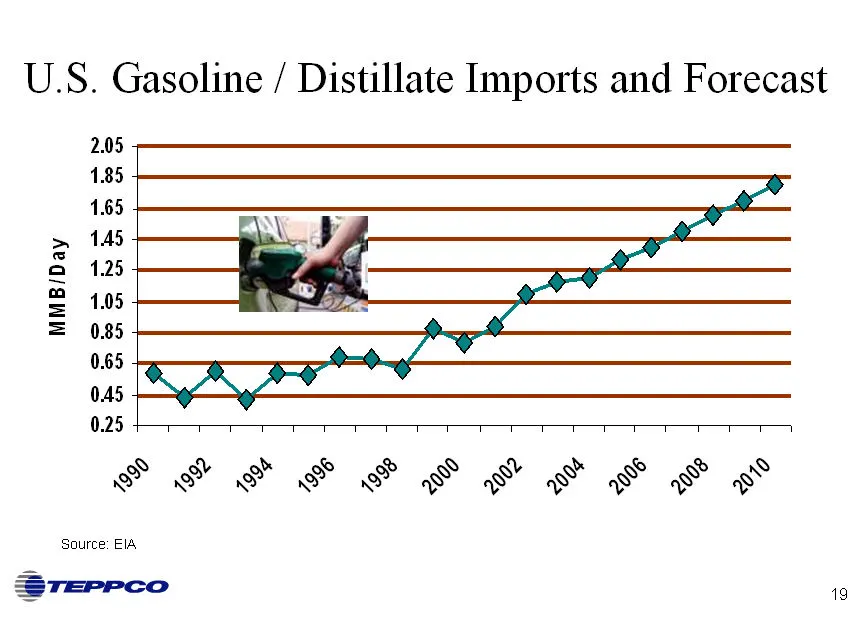
Slide 19: U.S. Gasoline / Distillate Imports and Forecast
U.S. Gasoline / Distillate Imports and Forecast Source: EIA
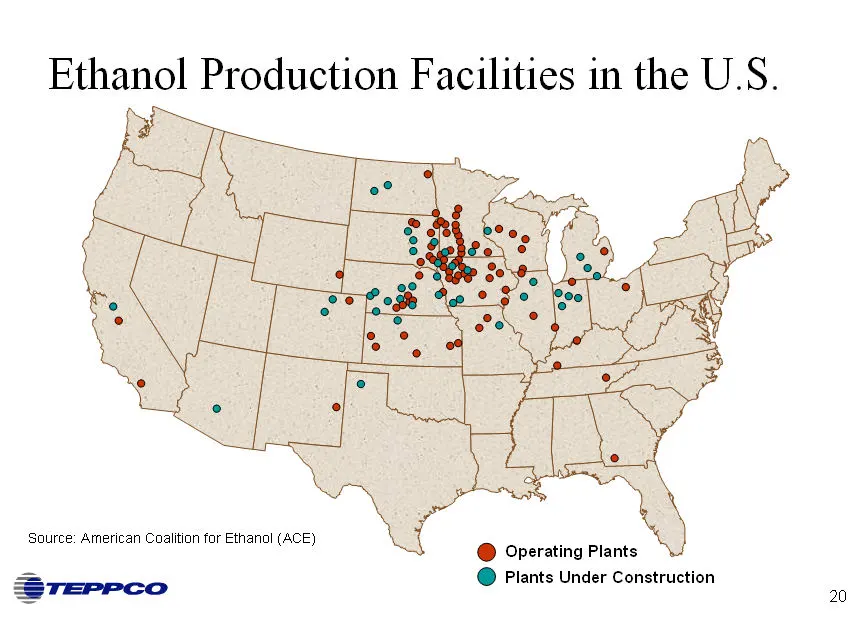
Slide 20: Ethanol Production Facilities in the U.S.
Ethanol Production Facilities in the U.S. Source: American Coalition for Ethanol (ACE)
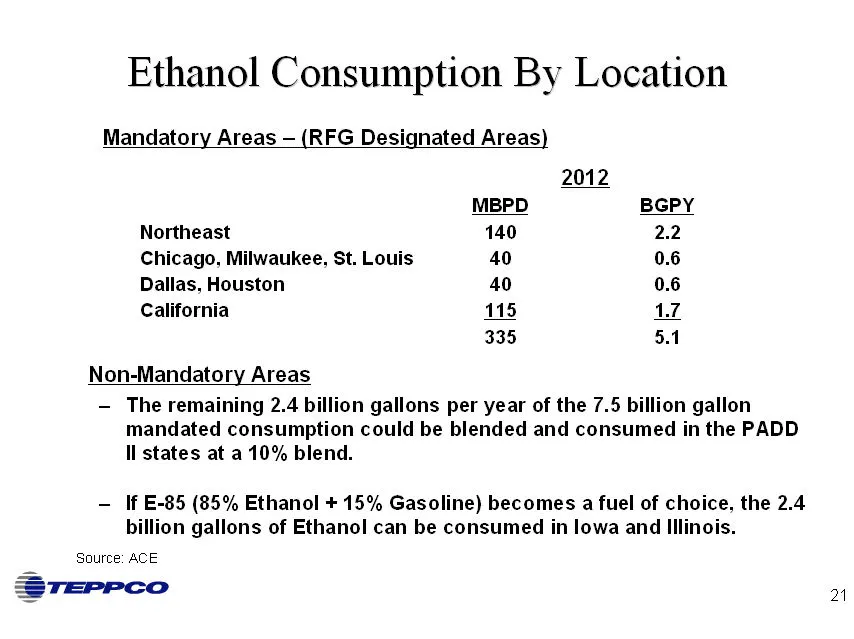
Slide 21: Ethanol Consumption By Location
Ethanol Consumption By Location Non-Mandatory Areas The remaining 2.4 billion gallons per year of the 7.5 billion gallon mandated consumption could be blended and consumed in the PADD II states at a 10% blend. If E-85 (85% Ethanol + 15% Gasoline) becomes a fuel of choice, the 2.4 billion gallons of
Slide 22: Strategic Direction: Business Environment for Growth
Strategic Direction Business Environment for Growth Based on a detailed analysis of the business environment, six key trends are driving TEPPCO’s growth strategy beyond organic growth.
Slide 23: Business Environment for Growth
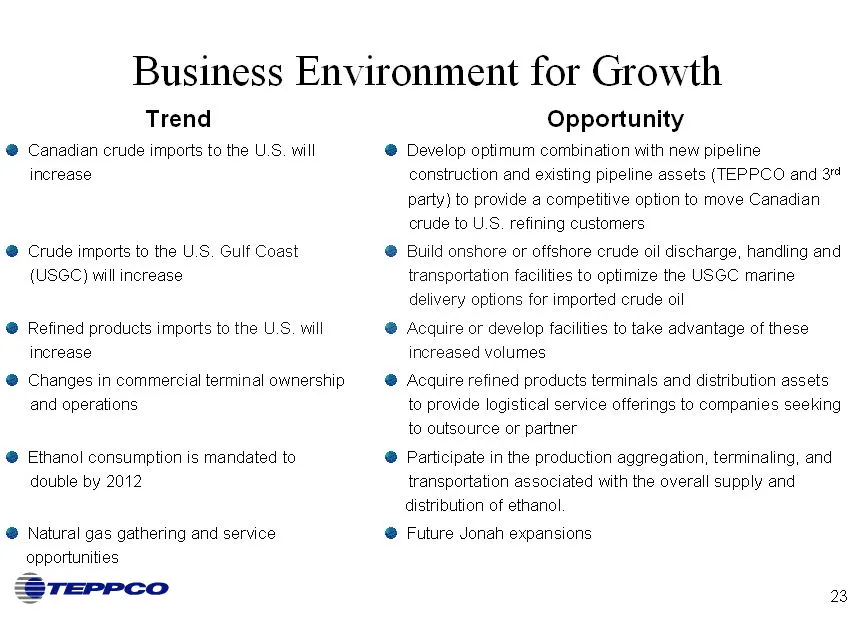
Business Environment for Growth Trend Canadian crude imports to the U.S. will increase Crude imports to the U.S. Gulf Coast (USGC) will increase Refined products imports to the U.S. will increase Changes in commercial terminal ownership and operations Ethanol consumption is mandated to double by 201
Slide 24: Business Opportunities Among Affiliates
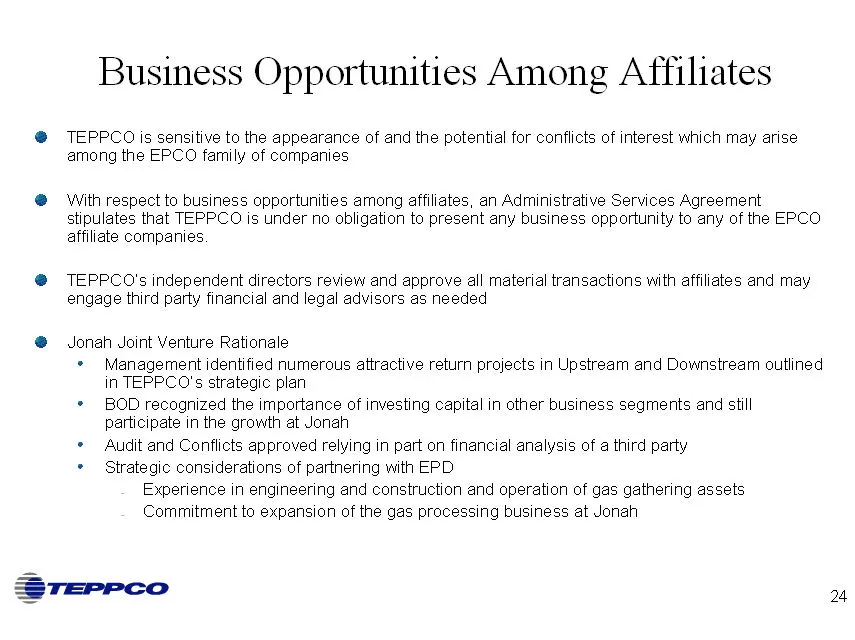
Business Opportunities Among Affiliates TEPPCO is sensitive to the appearance of and the potential for conflicts of interest which may arise among the EPCO family of companies With respect to business opportunities among affiliates, an Administrative Services Agreement stipulates that TEPPCO is unde
Slide 25: Upstream Business
Upstream Business Mike Cockrell
Slide 26: Upstream Overview
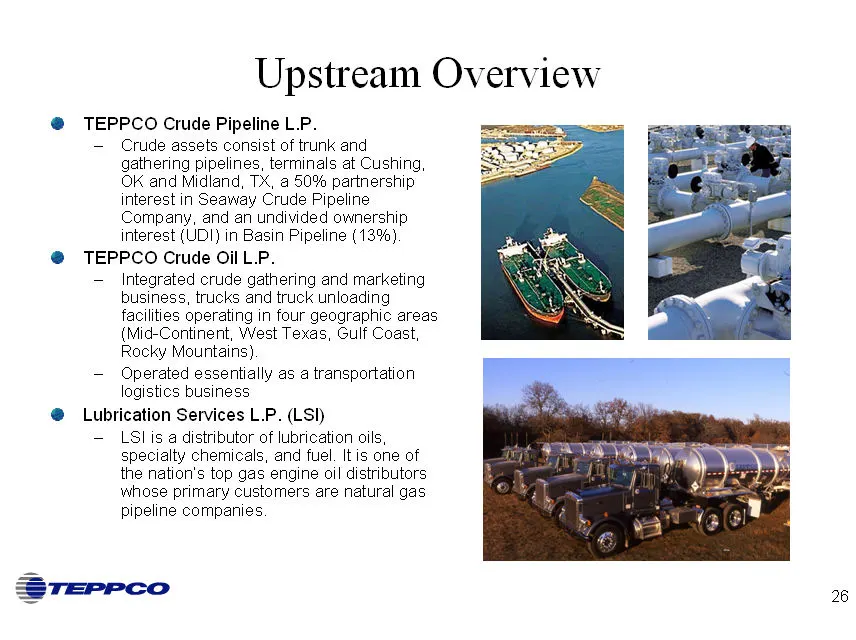
Upstream Overview TEPPCO Crude Pipeline L.P. Crude assets consist of trunk and gathering pipelines, terminals at Cushing, OK and Midland, TX, a 50% partnership interest in Seaway Crude Pipeline Company, and an undivided ownership interest (UDI) in Basin Pipeline (13%). TEPPCO Crude Oil L.P. Integrat
Slide 27: TEPPCO Upstream Oil Pipeline Assets
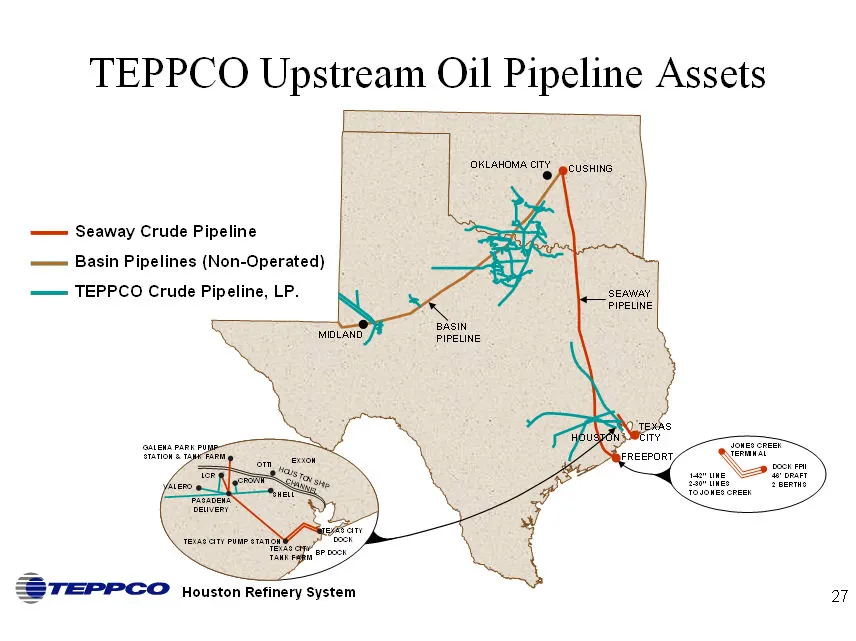
TEPPCO Upstream Oil Pipeline Assets Seaway Crude Pipeline Basin Pipelines (Non-Operated) TEPPCO Crude Pipeline, LP.
Slide 28: TEPPCO Crude Gathering and Marketing
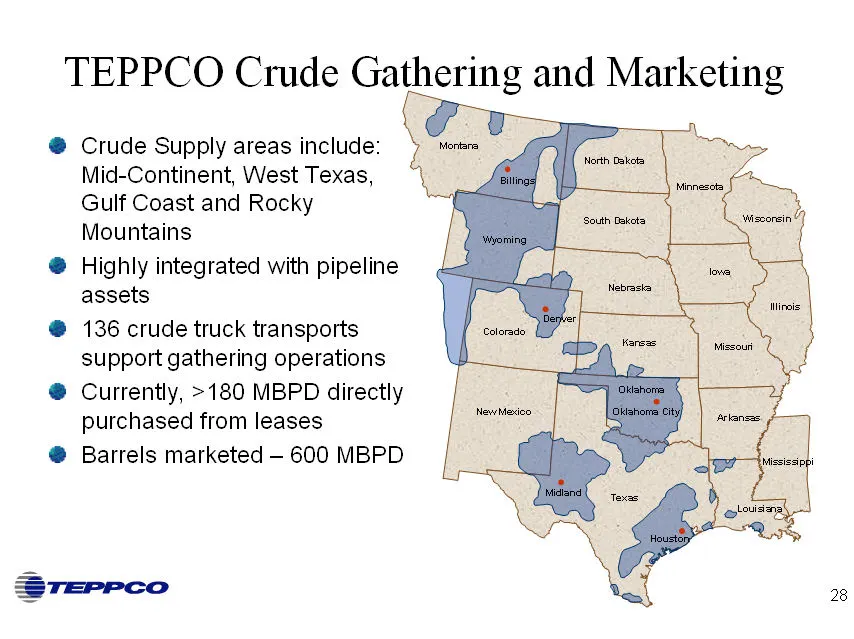
TEPPCO Crude Gathering and Marketing Crude Supply areas include: Mid-Continent, West Texas, Gulf Coast and Rocky Mountains Highly integrated with pipeline assets 136 crude truck transports support gathering operations Currently, >180 MBPD directly purchased from leases Barrels marketed - 600 MBPD
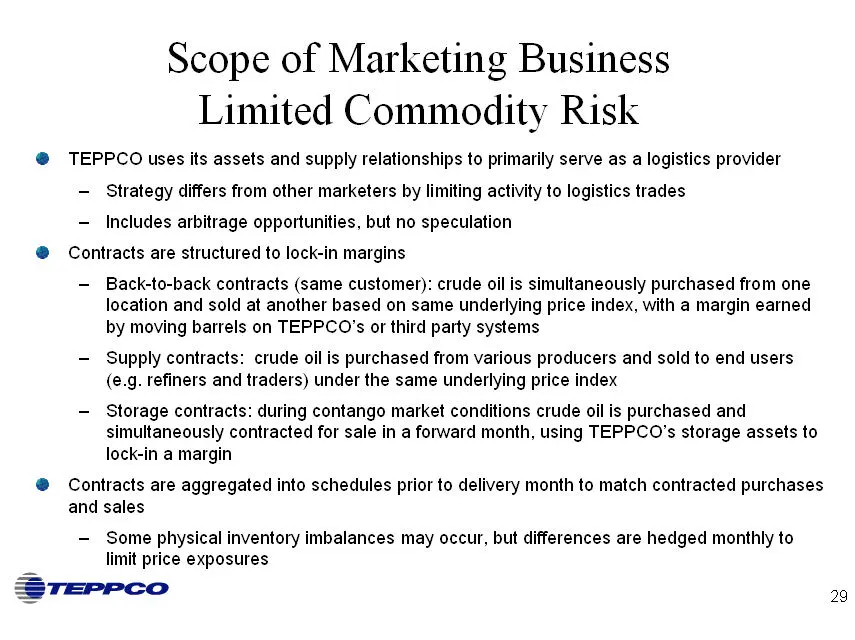
Slide 29: Scope of Marketing Business
Scope of Marketing Business Limited Commodity Risk TEPPCO uses its assets and supply relationships to primarily serve as a logistics provider Strategy differs from other marketers by limiting activity to logistics trades Includes arbitrage opportunities, but no speculation Contracts are structured t
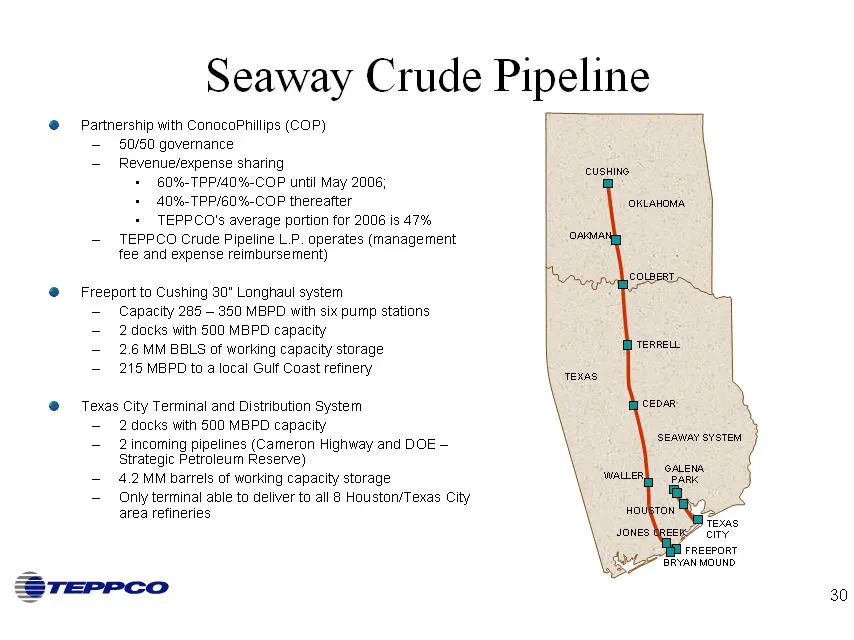
Slide 30: Seaway Crude Pipeline
Seaway Crude Pipeline Partnership with ConocoPhillips (COP) 50/50 governance Revenue/expense sharing 60%-TPP/40%-COP until May 2006; 40%-TPP/60%-COP thereafter TEPPCO’s average portion for 2006 is 47% TEPPCO Crude Pipeline L.P. operates (management fee and expense reimbursement) Freeport to Cushing
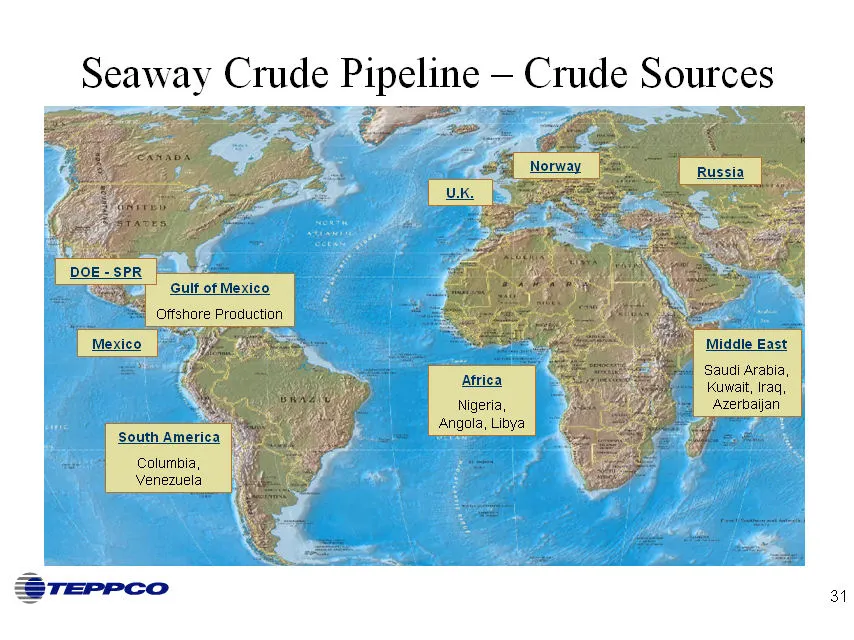
Slide 31: Seaway Crude Pipeline - Crude Sources
Seaway Crude Pipeline - Crude Sources DOE - SPR Gulf of Mexico Offshore Production Mexico South America Columbia, Venezuela U.K. Norway Russia Africa Nigeria, Angola, Libya Middle East Saudi Arabia, Kuwait, Iraq, Azerbaijan
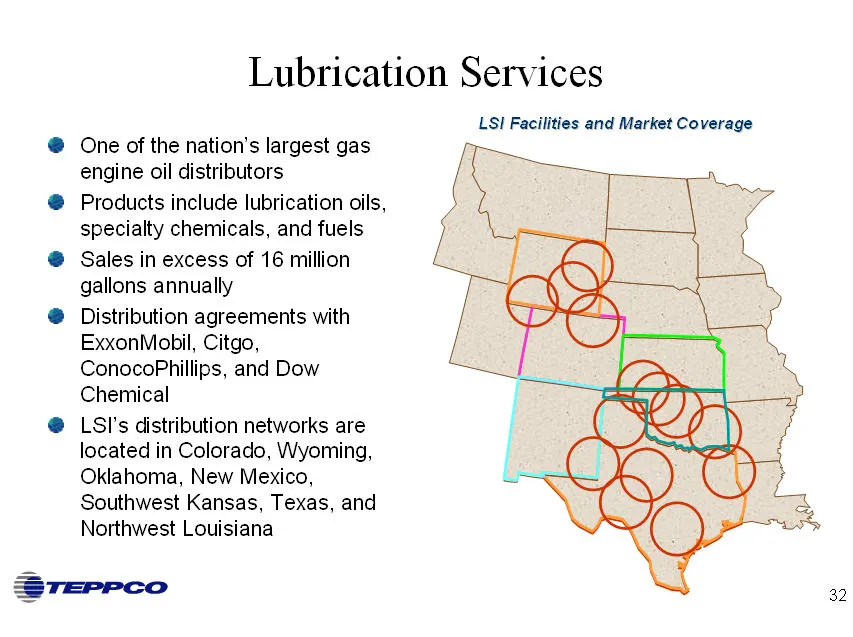
Slide 32: Lubrication Services
Lubrication Services One of the nation’s largest gas engine oil distributors Products include lubrication oils, specialty chemicals, and fuels Sales in excess of 16 million gallons annually Distribution agreements with ExxonMobil, Citgo, ConocoPhillips, and Dow Chemical LSI’s distribution networks a
Slide 33: Business Environment for Growth: Upstream
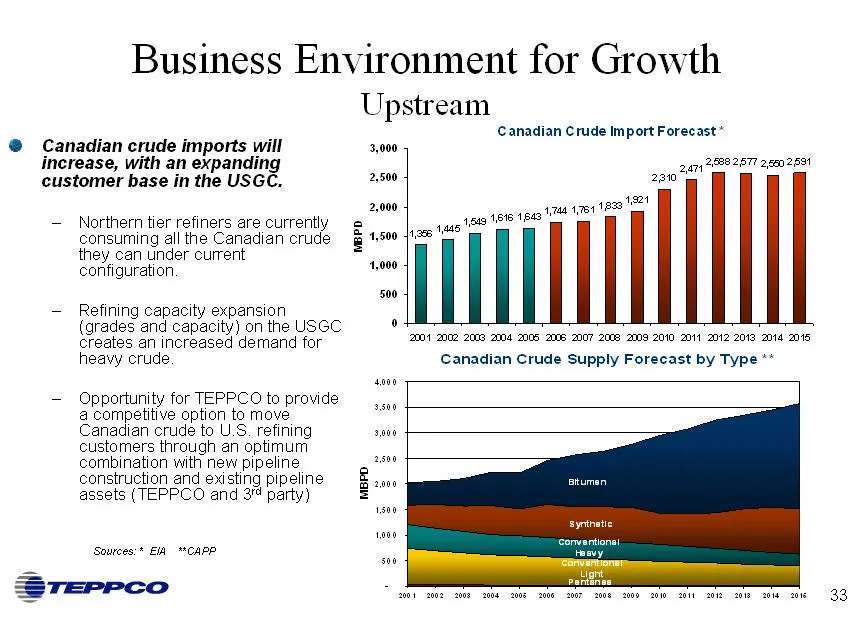
Business Environment for Growth Upstream Canadian crude imports will increase, with an expanding customer base in the USGC. Northern tier refiners are currently consuming all the Canadian crude they can under current configuration. Refining capacity expansion (grades and capacity) on the USGC create
Slide 34: Business Environment for Growth: Upstream Gulf Coast Refinery Complex
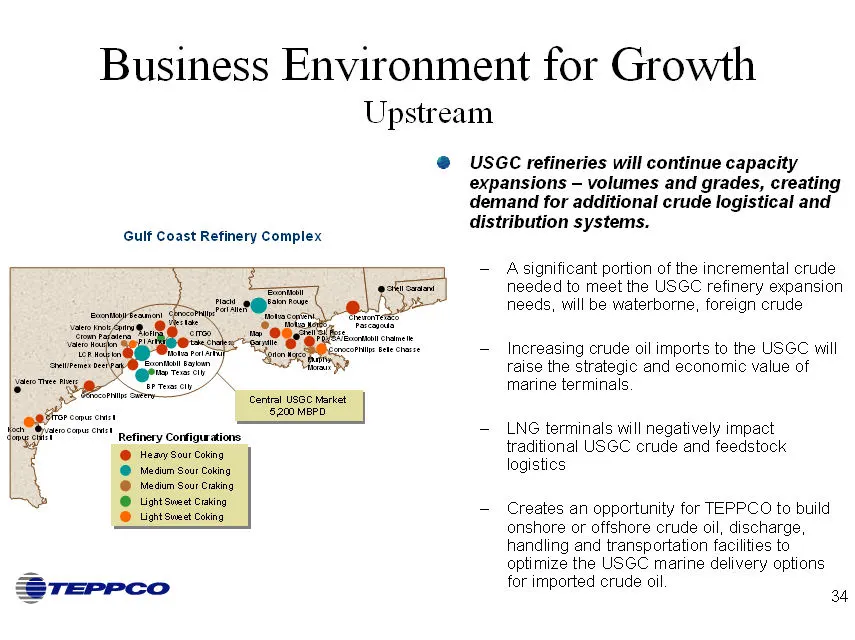
Business Environment for Growth Upstream Gulf Coast Refinery Complex USGC refineries will continue capacity expansions - volumes and grades, creating demand for additional crude logistical and distribution systems. A significant portion of the incremental crude needed to meet the USGC refinery expan
Slide 35: Business Environment for Growth: Upstream
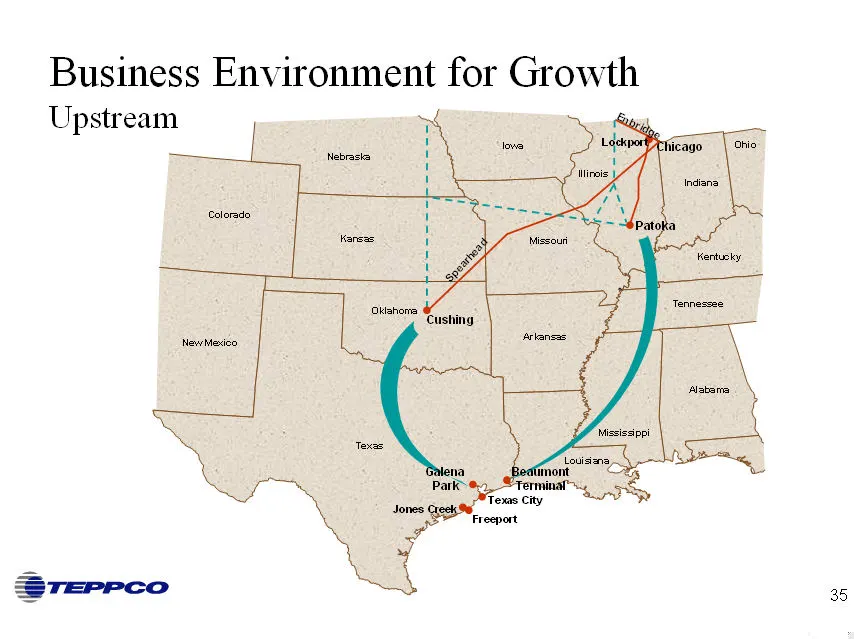
Business Environment for Growth Upstream
Slide 36: Business Environment for Growth: Cushing Storage Expansion
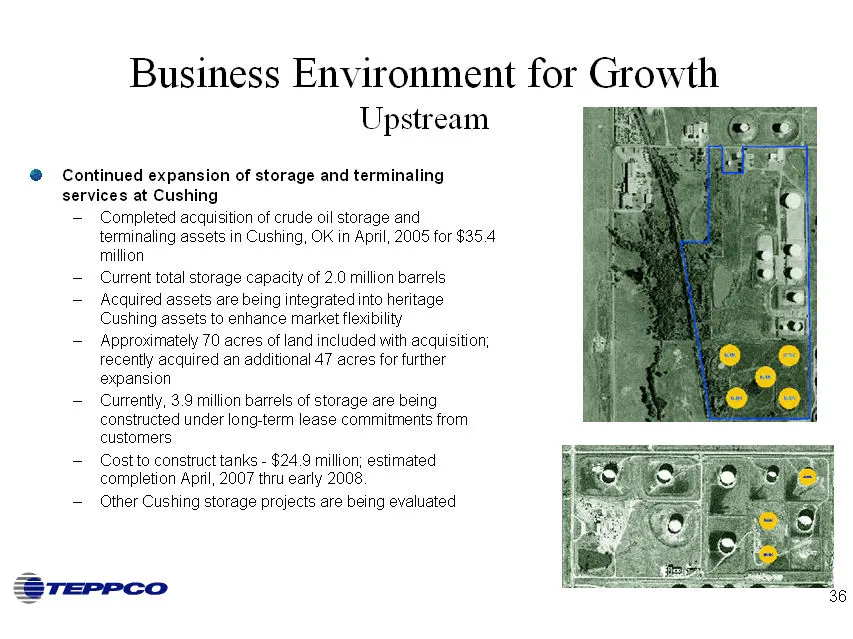
Business Environment for Growth Upstream Continued expansion of storage and terminaling services at Cushing Completed acquisition of crude oil storage and terminaling assets in Cushing, OK in April, 2005 for $35.4 million Current total storage capacity of 2.0 million barrels Acquired assets are bein
Slide 37: Business Environment for Growth: Gulf of Mexico Production
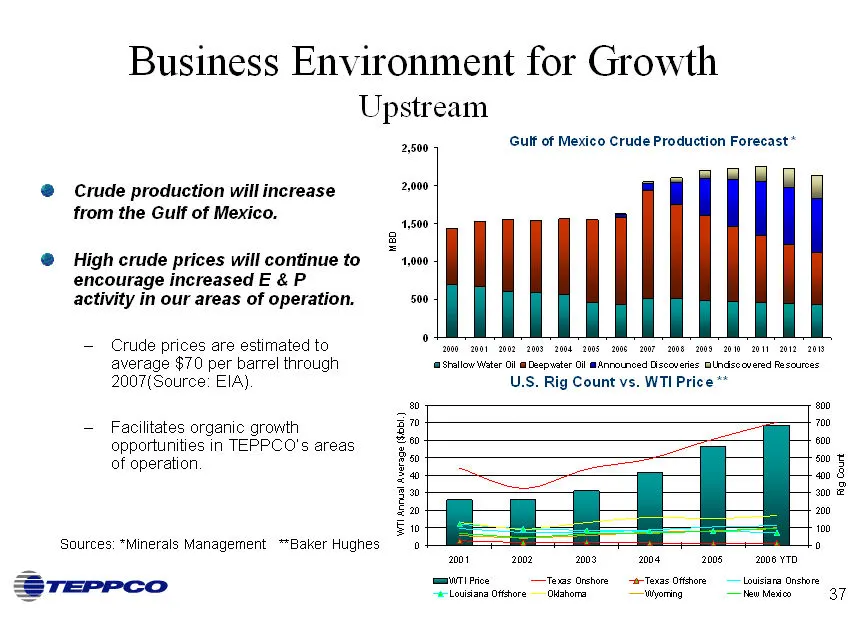
Business Environment for Growth Upstream Crude production will increase from the Gulf of Mexico. High crude prices will continue to encourage increased E & P activity in our areas of operation. Crude prices are estimated to average $70 per barrel through 2007(Source: EIA). Facilitates organic growth
Slide 38: Competitive Position: Upstream
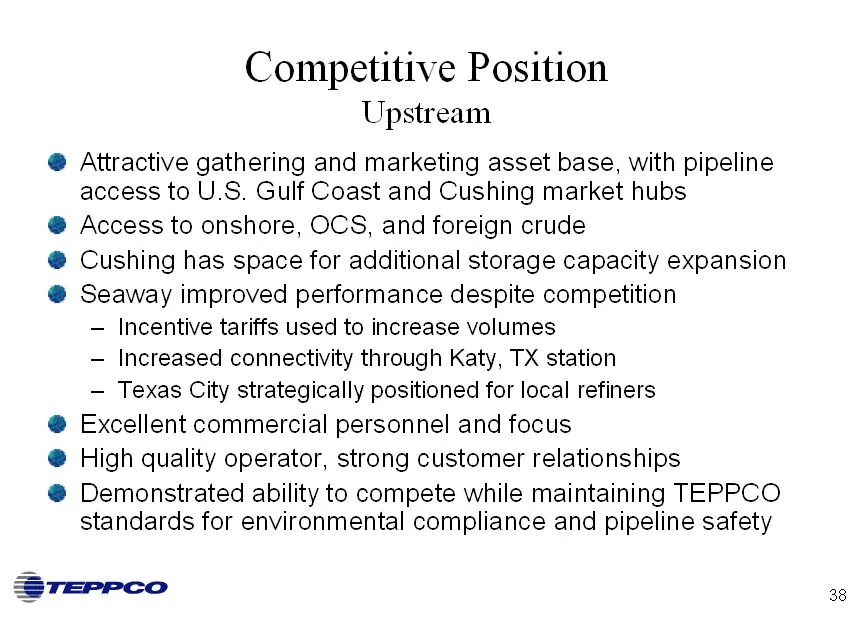
Competitive Position Upstream Attractive gathering and marketing asset base, with pipeline access to U.S. Gulf Coast and Cushing market hubs Access to onshore, OCS, and foreign crude Cushing has space for additional storage capacity expansion Seaway improved performance despite competition Incentive
Slide 39: Strategy: Upstream
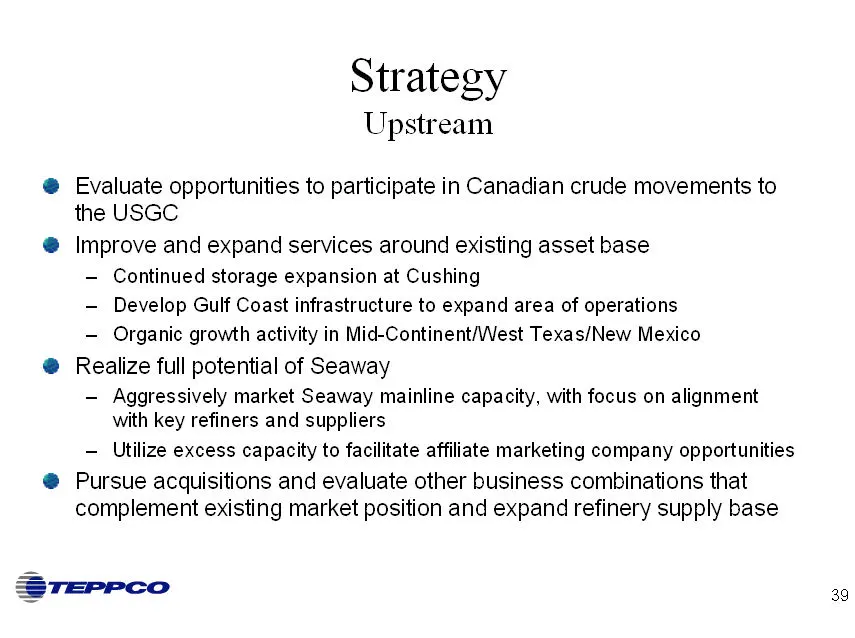
Strategy Upstream Evaluate opportunities to participate in Canadian crude movements to the USGC Improve and expand services around existing asset base Continued storage expansion at Cushing Develop Gulf Coast infrastructure to expand area of operations Organic growth activity in Mid-Continent/West T
Slide 40: Midstream Business: Jonah Gas Gathering System
Midstream Business Jonah Gas Gathering System Bill Ordemann
Slide 41: Jonah Gas Gathering System Overview
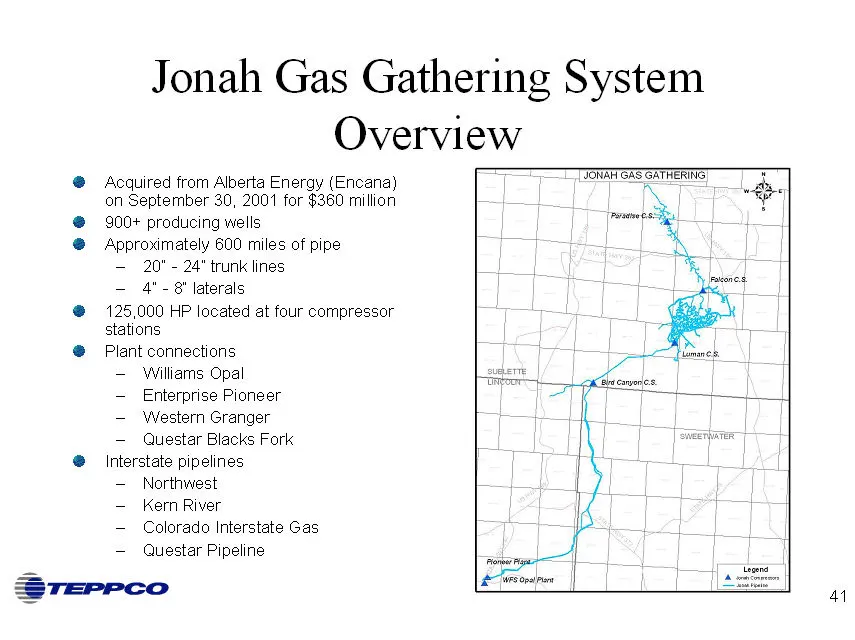
Jonah Gas Gathering System Overview Acquired from Alberta Energy (Encana) on September 30, 2001 for $360 million 900+ producing wells Approximately 600 miles of pipe 20” - 24” trunk lines 4” - 8” laterals 125,000 HP located at four compressor stations Plant connections Williams Opal Enterprise Pione
Slide 42: Jonah Gas Gathering System Performance
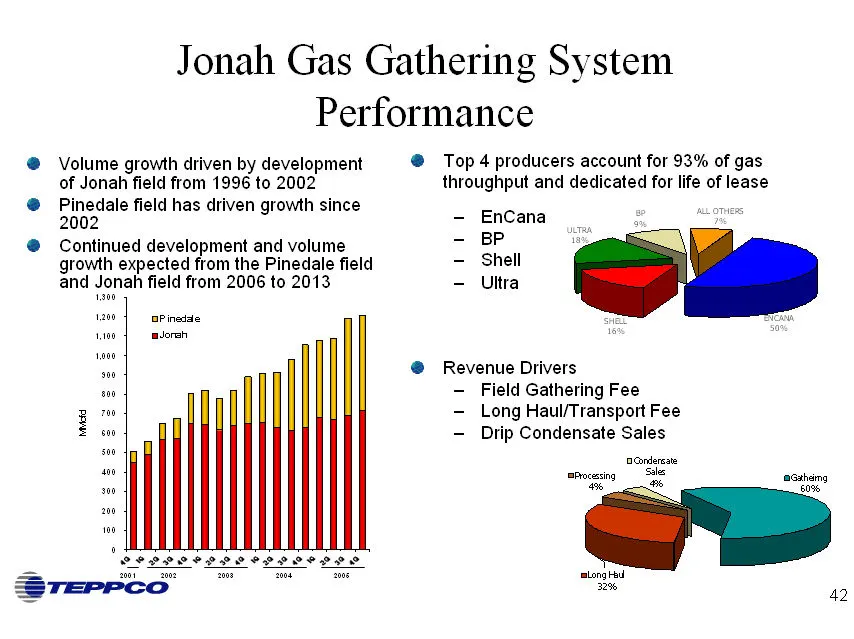
Jonah Gas Gathering System Performance Volume growth driven by development of Jonah field from 1996 to 2002 Pinedale field has driven growth since 2002 Continued development and volume growth expected from the Pinedale field and Jonah field from 2006 to 2013 Top 4 producers account for 93% of gas th
Slide 43: Jonah Area Production Growth
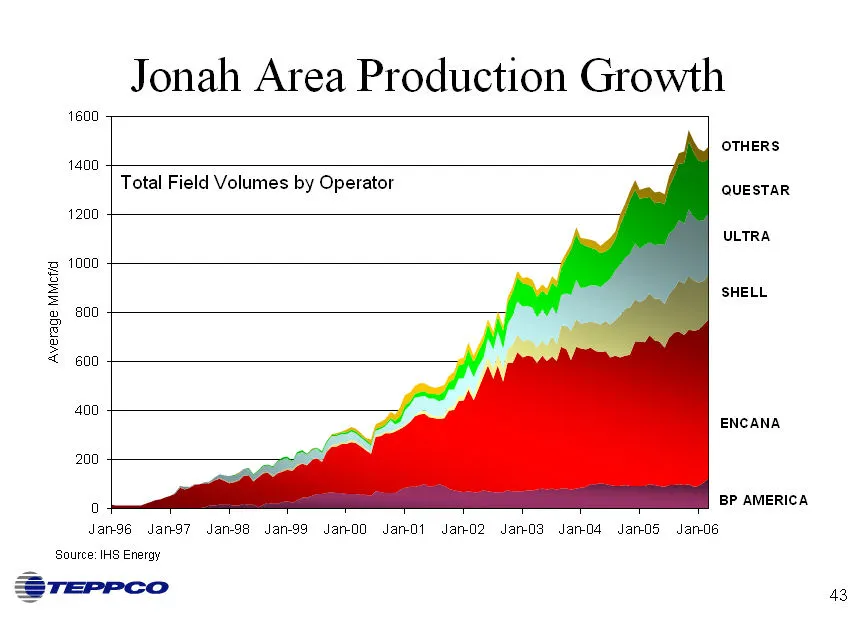
Jonah Area Production Growth Total Field Volumes by Operator
Slide 44: Jonah Gas Gathering System Expansion History
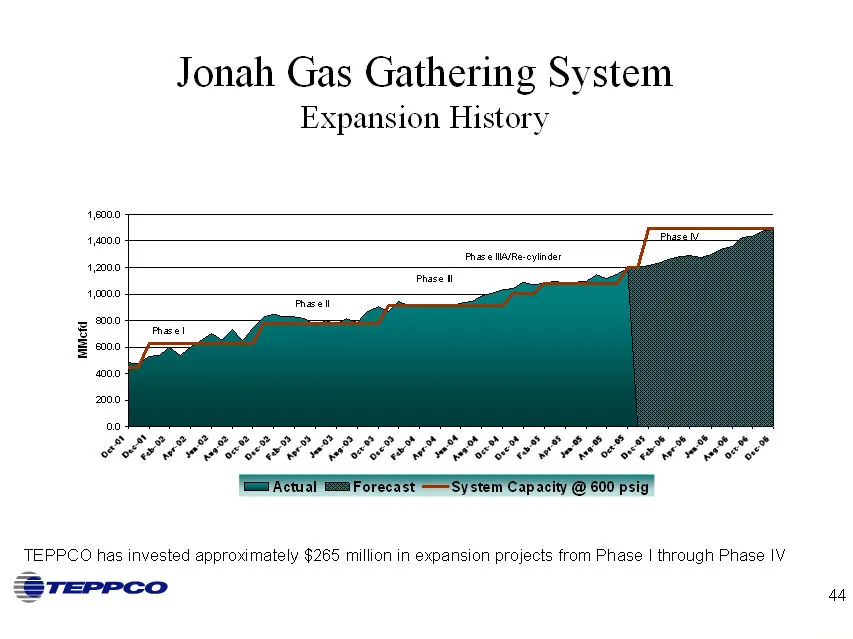
Jonah Gas Gathering System Expansion History TEPPCO has invested approximately $265 million in expansion projects from Phase I through Phase IV
Slide 45: Jonah Gas Gathering System Potential
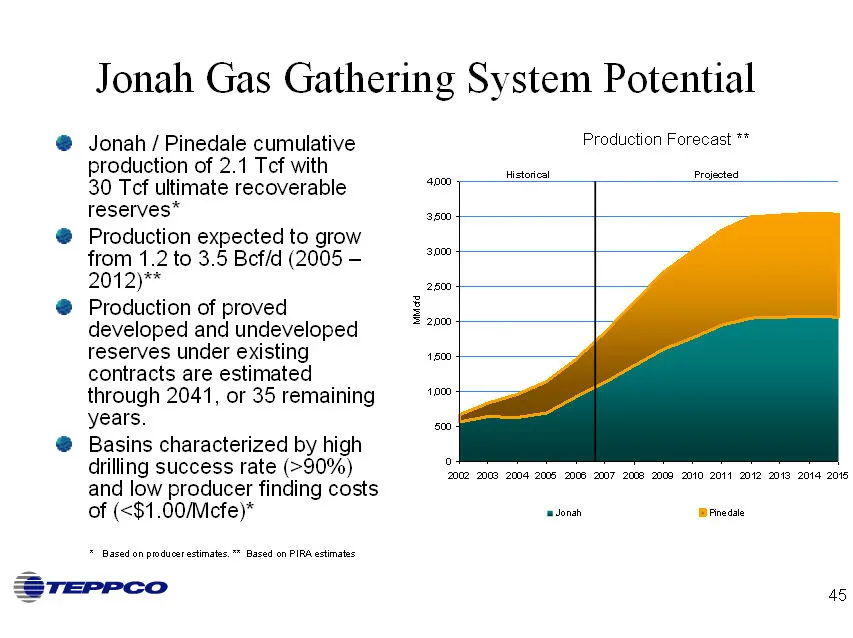
Jonah Gas Gathering System Potential Jonah / Pinedale cumulative production of 2.1 Tcf with 30 Tcf ultimate recoverable reserves* Production expected to grow from 1.2 to 3.5 Bcf/d (2005 -2012)** Production of proved developed and undeveloped reserves under existing contracts are estimated through 20
Slide 46: Jonah Phase V Expansion Project Objectives
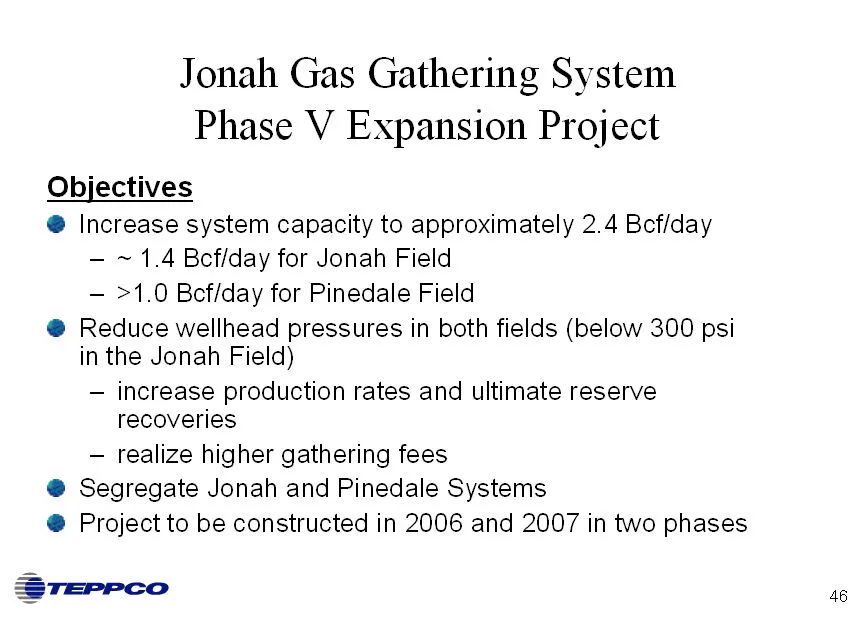
Jonah Gas Gathering System Phase V Expansion Project Objectives Increase system capacity to approximately 2.4 Bcf/day ~ 1.4 Bcf/day for Jonah Field >1.0 Bcf/day for Pinedale Field Reduce wellhead pressures in both fields (below 300 psi in the Jonah Field) increase production rates and ultimate reser
Slide 47: Jonah Phase V Expansion: 2006 Project
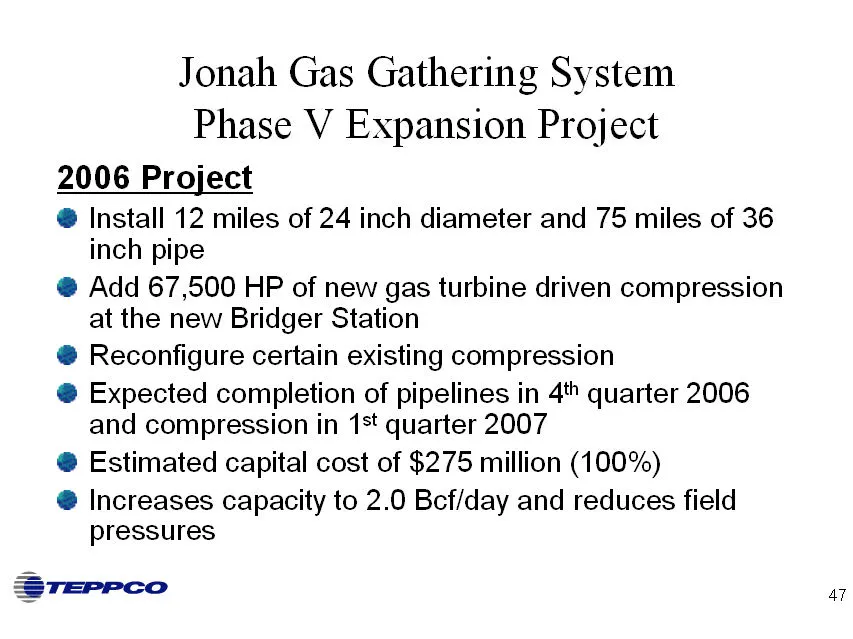
Jonah Gas Gathering System Phase V Expansion Project 2006 Project Install 12 miles of 24 inch diameter and 75 miles of 36 inch pipe Add 67,500 HP of new gas turbine driven compression at the new Bridger Station Reconfigure certain existing compression Expected completion of pipelines in 4th quarter
Slide 48: Jonah Phase V Expansion: 2007 Project
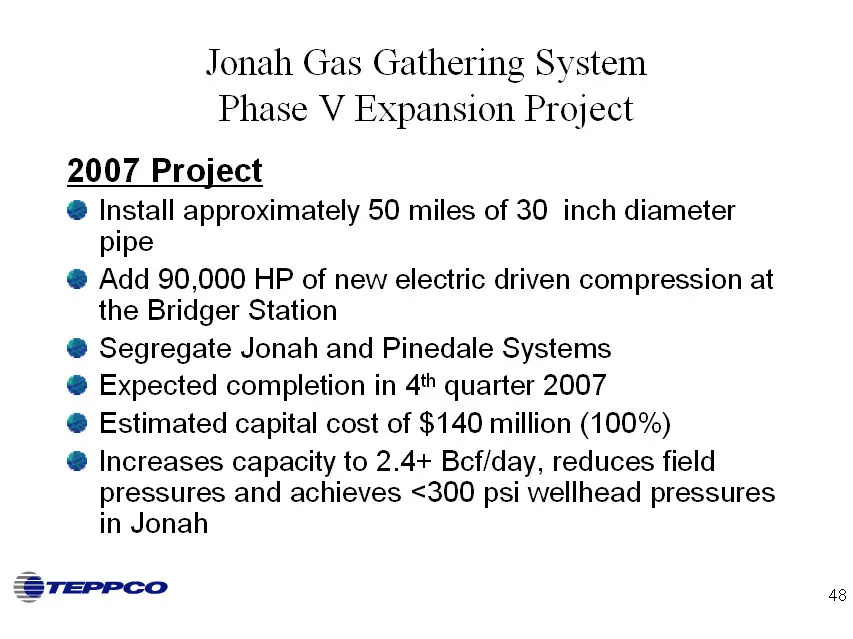
Jonah Gas Gathering System Phase V Expansion Project 2007 Project Install approximately 50 miles of 30 inch diameter pipe Add 90,000 HP of new electric driven compression at the Bridger Station Segregate Jonah and Pinedale Systems Expected completion in 4th quarter 2007 Estimated capital cost of $14
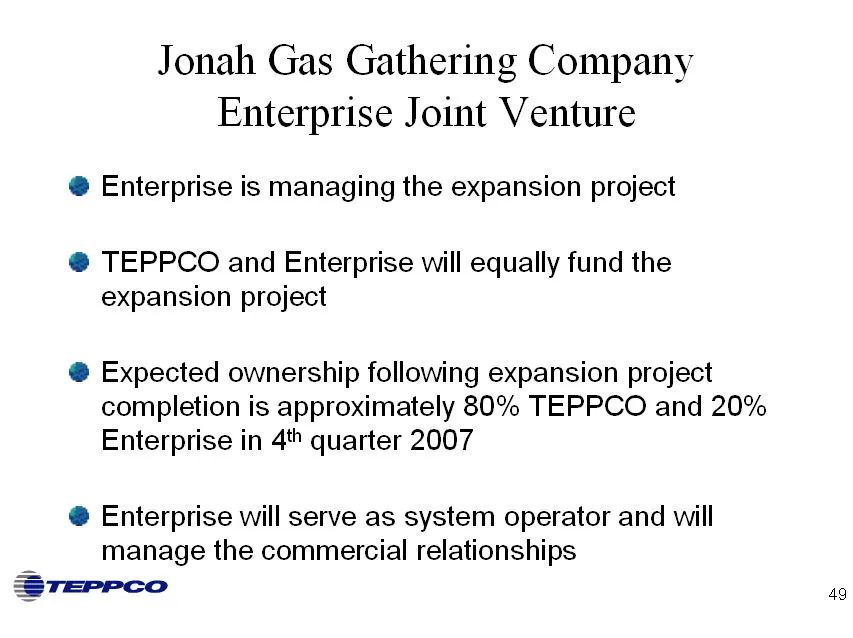
Slide 49: Jonah Gas Gathering Company Enterprise Joint Venture
Jonah Gas Gathering Company Enterprise Joint Venture Enterprise is managing the expansion project TEPPCO and Enterprise will equally fund the expansion project Expected ownership following expansion project completion is approximately 80% TEPPCO and 20% Enterprise in 4th quarter 2007 Enterprise will
Slide 50: Midstream Business: Val Verde Gas Gathering System, NGL Pipelines
Midstream Business Val Verde Gas Gathering System NGL Pipelines John Goodpasture
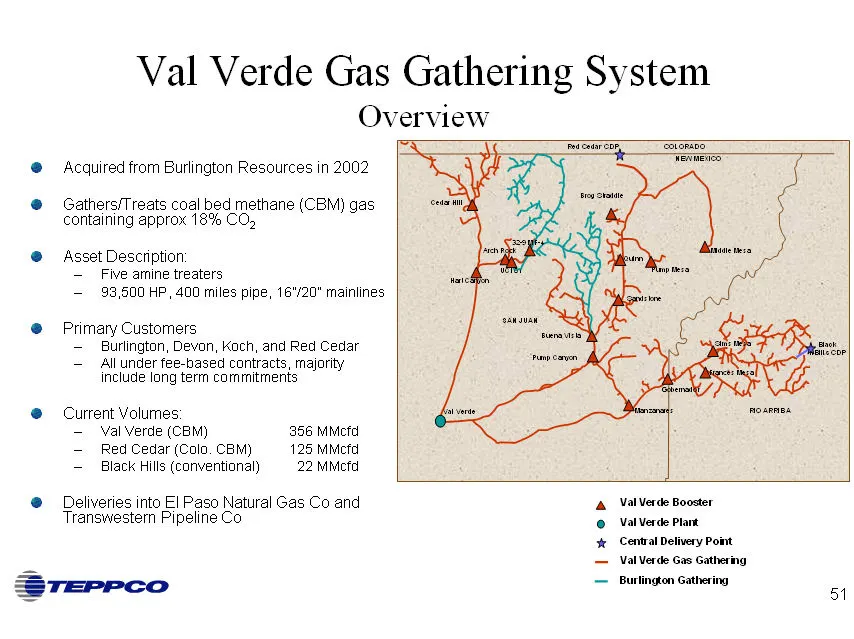
Slide 51: Val Verde Gas Gathering System Overview
Val Verde Gas Gathering System Overview Acquired from Burlington Resources in 2002 Gathers/Treats coal bed methane (CBM) gas containing approx 18% CO2 Asset Description: Five amine treaters 93,500 HP, 400 miles pipe, 16”/20” mainlines Primary Customers Burlington, Devon, Koch, and Red Cedar All unde
Slide 52: Val Verde Commercial Strategy
Val Verde Gas Gathering System Commercial Strategy Val Verde is a relatively new and efficient facility with excess capacity New business requires only minimal additional capital Excess capacity permitted reconfiguration of system to efficiently handle both CBM and conventional gas Val Verde has exp
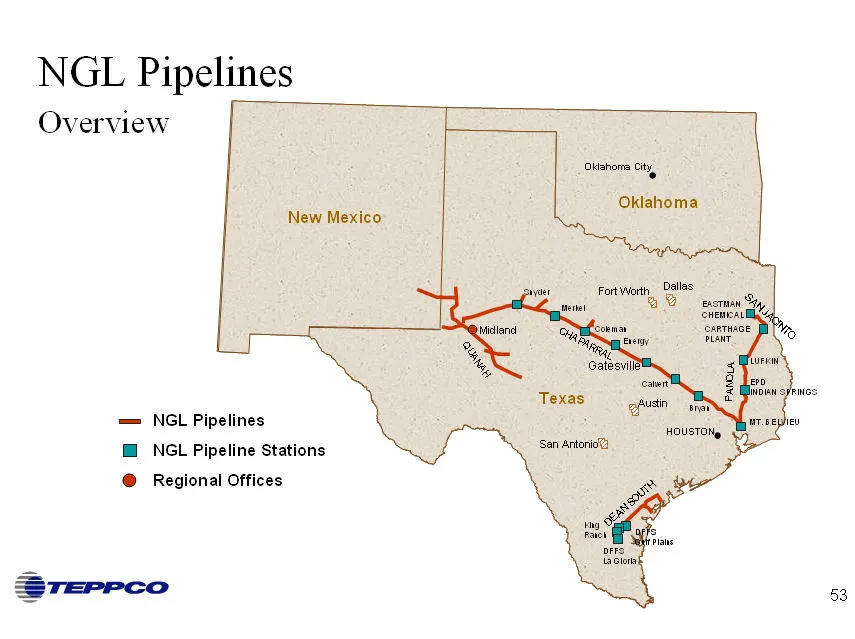
Slide 53: NGL Pipelines Overview
NGL Pipelines Overview NGL Pipelines NGL Pipeline Stations Regional Offices
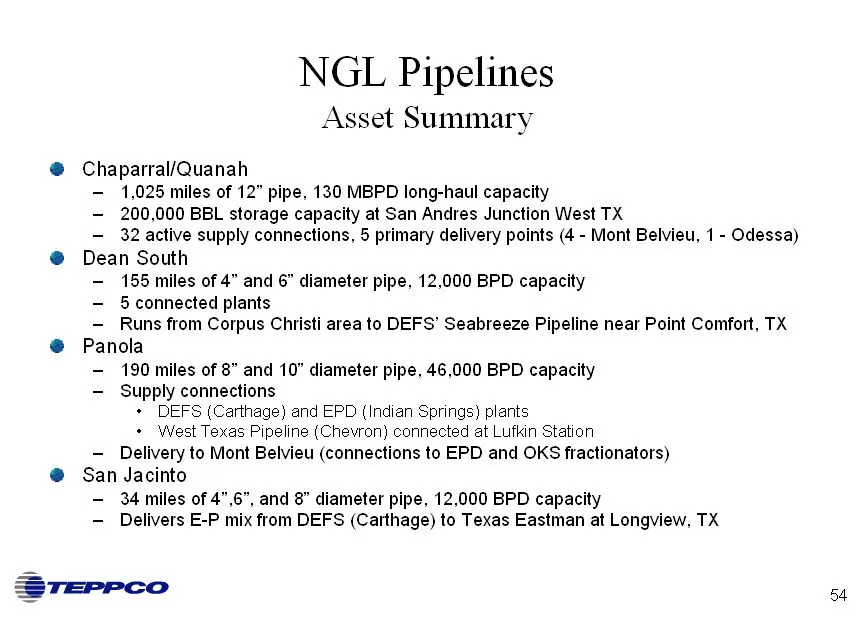
Slide 54: NGL Pipelines Asset Summary
NGL Pipelines Asset Summary Chaparral/Quanah 1,025 miles of 12” pipe, 130 MBPD long-haul capacity 200,000 BBL storage capacity at San Andres Junction West TX 32 active supply connections, 5 primary delivery points (4 - Mont Belvieu, 1 - Odessa) Dean South 155 miles of 4” and 6” diameter pipe, 12,000
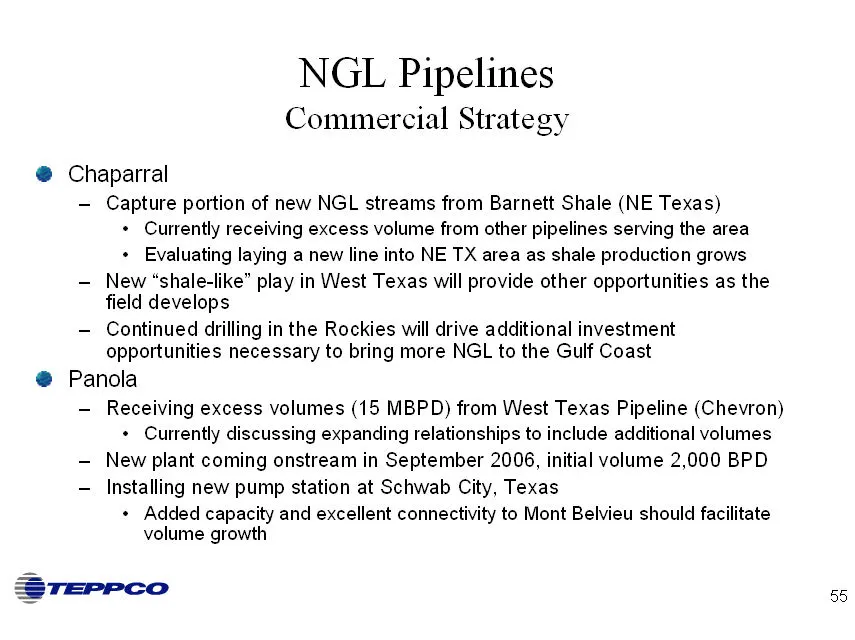
Slide 55: NGL Pipelines Commercial Strategy
NGL Pipelines Commercial Strategy Chaparral Capture portion of new NGL streams from Barnett Shale (NE Texas) Currently receiving excess volume from other pipelines serving the area Evaluating laying a new line into NE TX area as shale production grows New ”shale-like” play in West Texas will provide
Slide 56: Downstream Business
Downstream Business Sam Brown
Slide 57: TEPPCO's Downstream Business
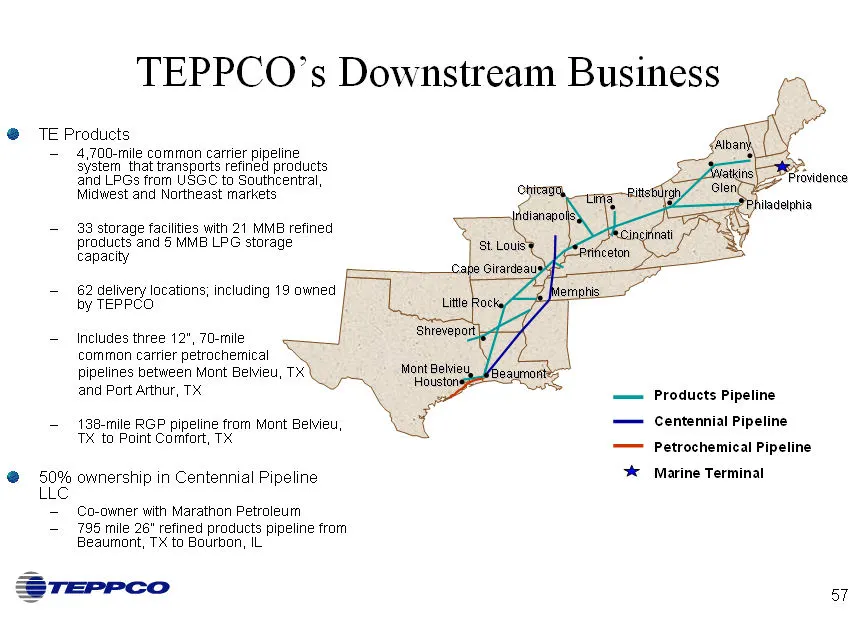
TEPPCO’s Downstream Business TE Products 4,700-mile common carrier pipeline system that transports refined products and LPGs from USGC to Southcentral, Midwest and Northeast markets 33 storage facilities with 21 MMB refined products and 5 MMB LPG storage capacity 62 delivery locations; including 19
Slide 58: Refined Products Overview
Refined Products Overview Transport gasoline, diesel, jet fuel and various feedstocks that originate from refinery and third party terminal connections in the Houston and Beaumont area Revenues are generated through a combination of Market Based and Indexed tariffs that cover mainline transportation
Slide 59: Centennial has facilitated growth
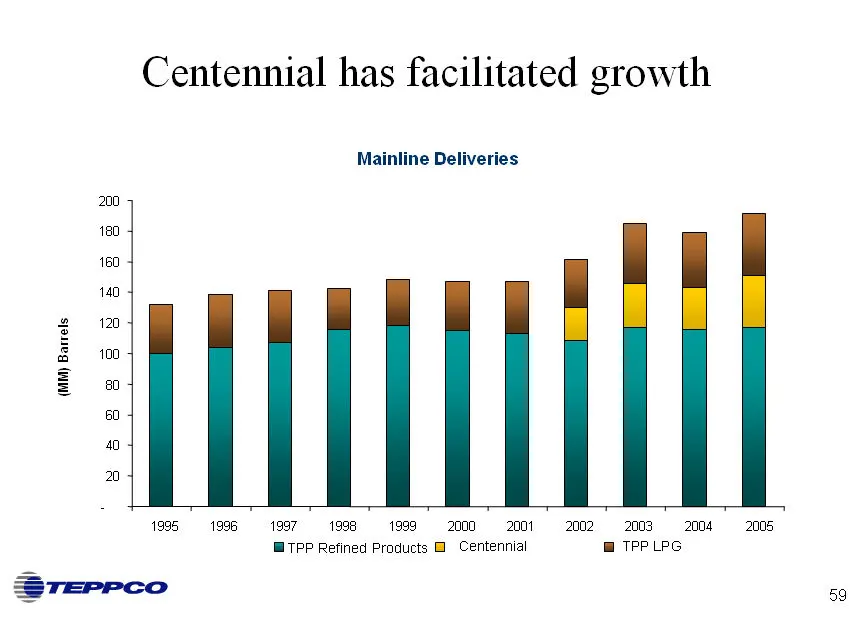
Centennial has facilitated growth Mainline Deliveries
Slide 60: Integration of Texas Genco Pipeline & Storage Facilities
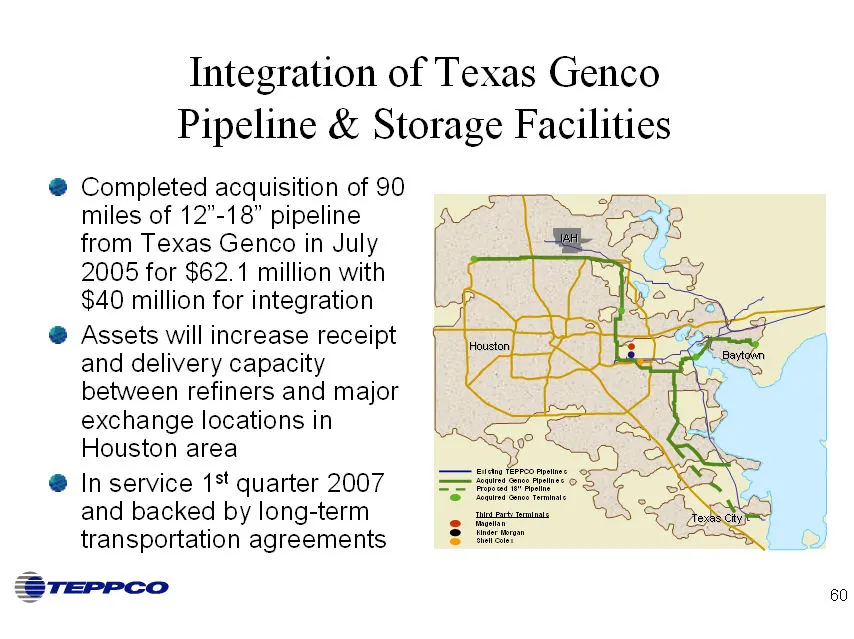
Integration of Texas Genco Pipeline & Storage Facilities Completed acquisition of 90 miles of 12”-18” pipeline from Texas Genco in July 2005 for $62.1 million with $40 million for integration Assets will increase receipt and delivery capacity between refiners and major exchange locations in Houston
Slide 61: Incremental Genco Projects
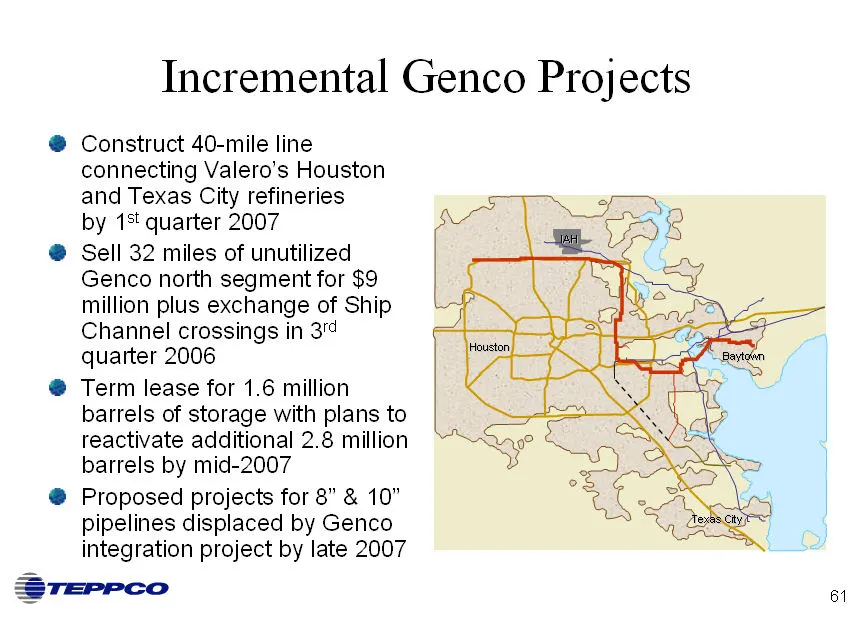
Incremental Genco Projects Construct 40-mile line connecting Valero’s Houston and Texas City refineries by 1st quarter 2007 Sell 32 miles of unutilized Genco north segment for $9 million plus exchange of Ship Channel crossings in 3rd quarter 2006 Term lease for 1.6 million barrels of storage with pl
Slide 62: Memphis/FedEx Connection
Memphis/FedEx Connection Executed 15-year Transportation Agreement with WesPac to support construction of Mississippi River pipeline crossing into Memphis, TN to serve Federal Express Initial deliveries limited to jet fuel and distillate at Memphis airport Additional commercial opportunities to prov
Slide 63: LPG Overview
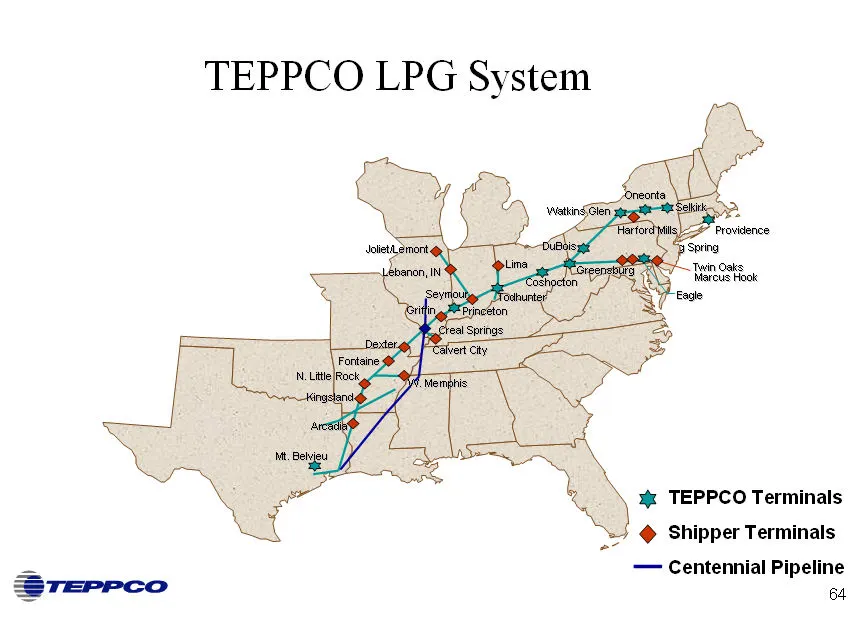
LPG Overview Transport propane, normal butane, and iso-butane from Mont Belvieu to Midwest and Northeast markets Substantially all of the products transported and stored in our system are owned by our customers Over 60 LPG customers LPG customers include refiners, propane wholesalers and retailers,
Slide 64: TEPPCO LPG System
TEPPCO LPG System TEPPCO Terminals Shipper Terminals Centennial Pipeline
Slide 65: Business Growth Environment: Downstream
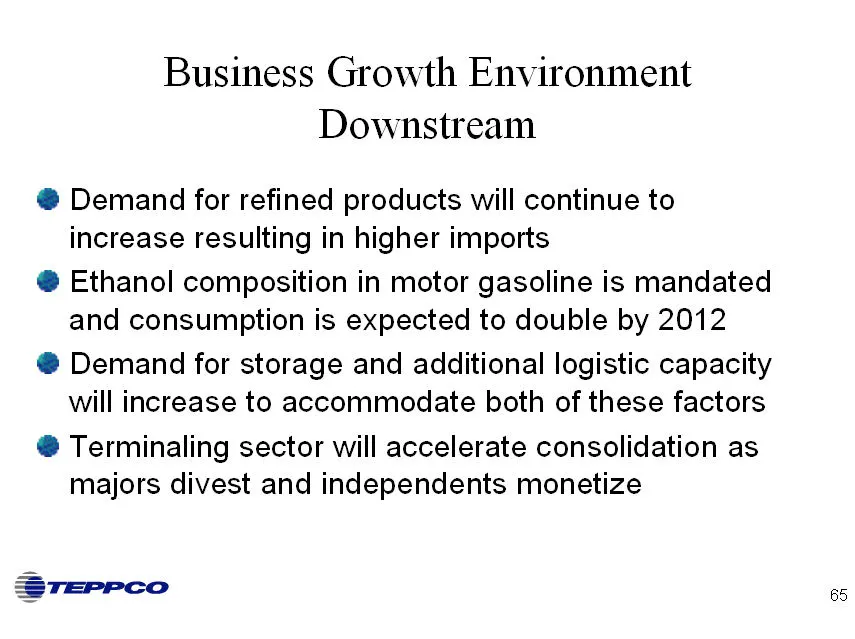
Business Growth Environment Downstream Demand for refined products will continue to increase resulting in higher imports Ethanol composition in motor gasoline is mandated and consumption is expected to double by 2012 Demand for storage and additional logistic capacity will increase to accommodate bo
Slide 66: Downstream Segment Growth Strategy
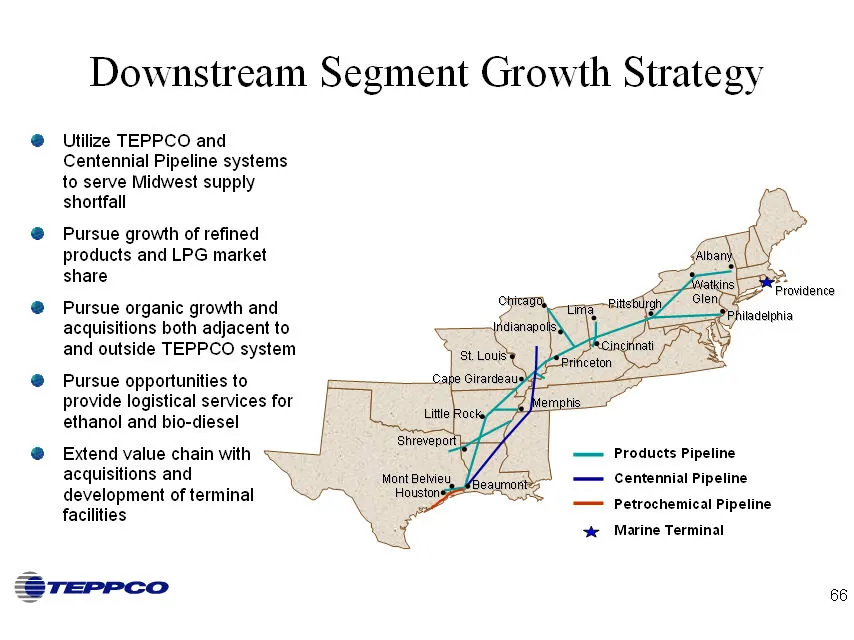
Downstream Segment Growth Strategy Utilize TEPPCO and Centennial Pipeline systems to serve Midwest supply shortfall Pursue growth of refined products and LPG market share Pursue organic growth and acquisitions both adjacent to and outside TEPPCO system Pursue opportunities to provide logistical serv
Slide 67: Financial Overview
Financial Overview Bill Manias
Slide 68: Consistent EBITDA Growth Expected
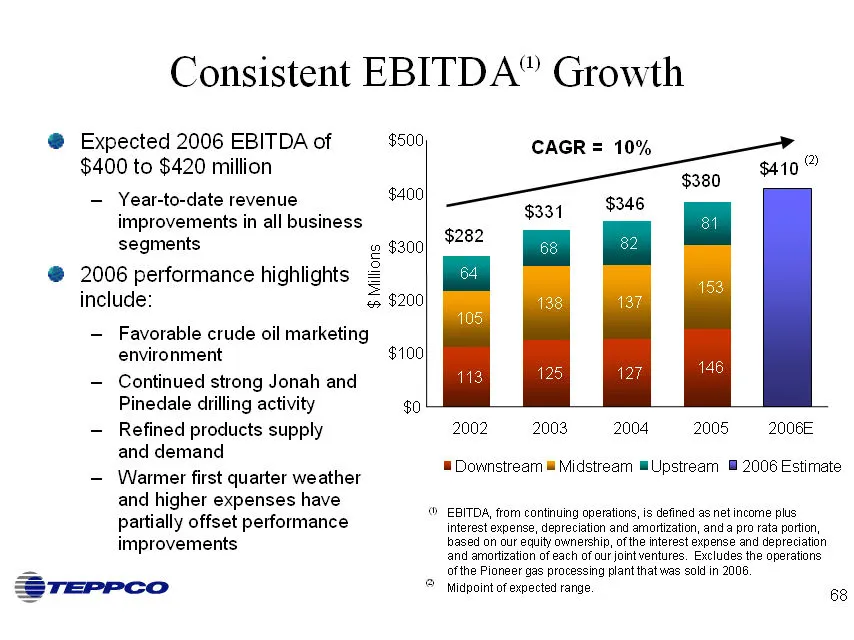
Consistent EBITDA(1) Growth Expected 2006 EBITDA of $400 to $420 million Year-to-date revenue improvements in all business segments 2006 performance highlights include: Favorable crude oil marketing environment Continued strong Jonah and Pinedale drilling activity Refined products supply and demand
Slide 69: Organic Growth Opportunities Continue Across All Business Segments
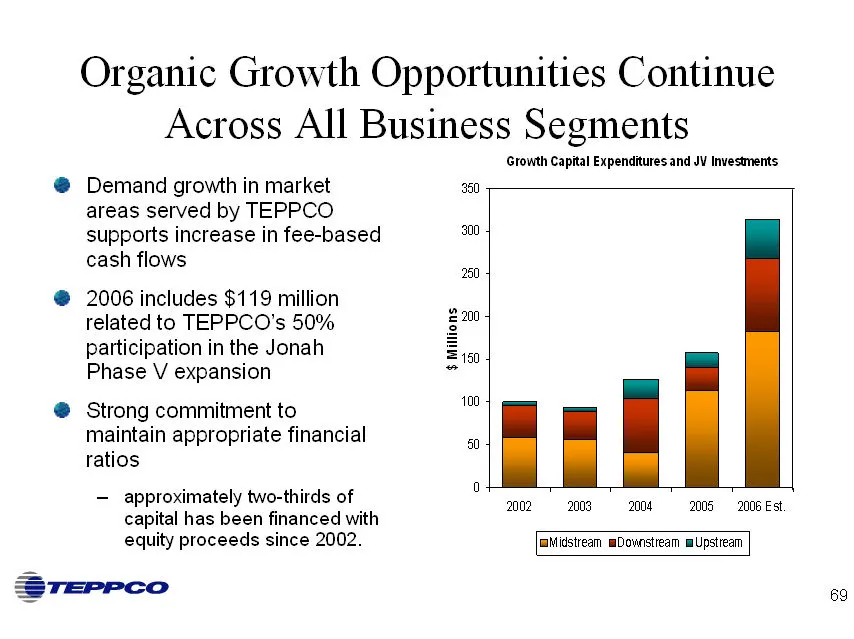
Organic Growth Opportunities Continue Across All Business Segments Demand growth in market areas served by TEPPCO supports increase in fee-based cash flows 2006 includes $119 million related to TEPPCO’s 50% participation in the Jonah Phase V expansion Strong commitment to maintain appropriate financ
Slide 70: Consistent Investment Grade Financial Metrics
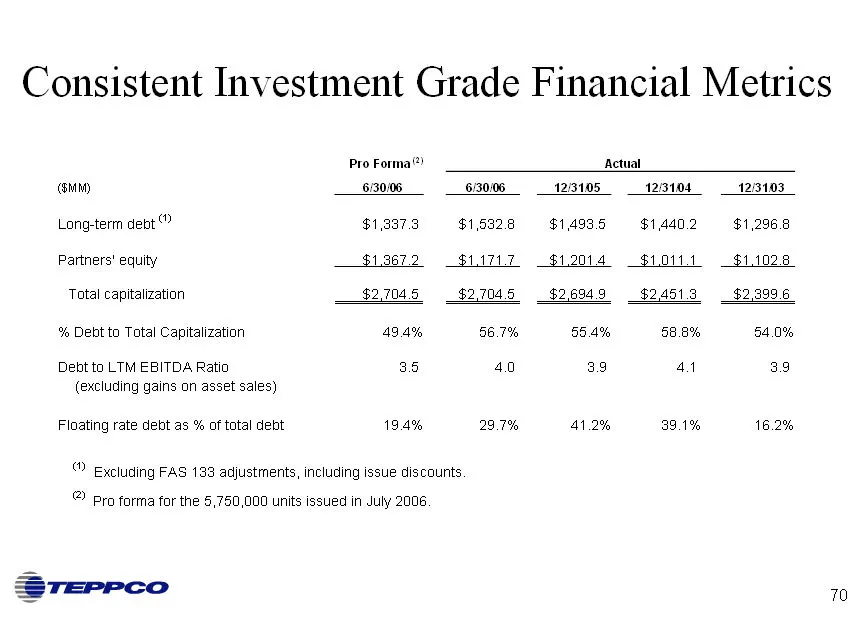
Consistent Investment Grade Financial Metrics
Slide 71: Proposal to Amend Partnership Agreement
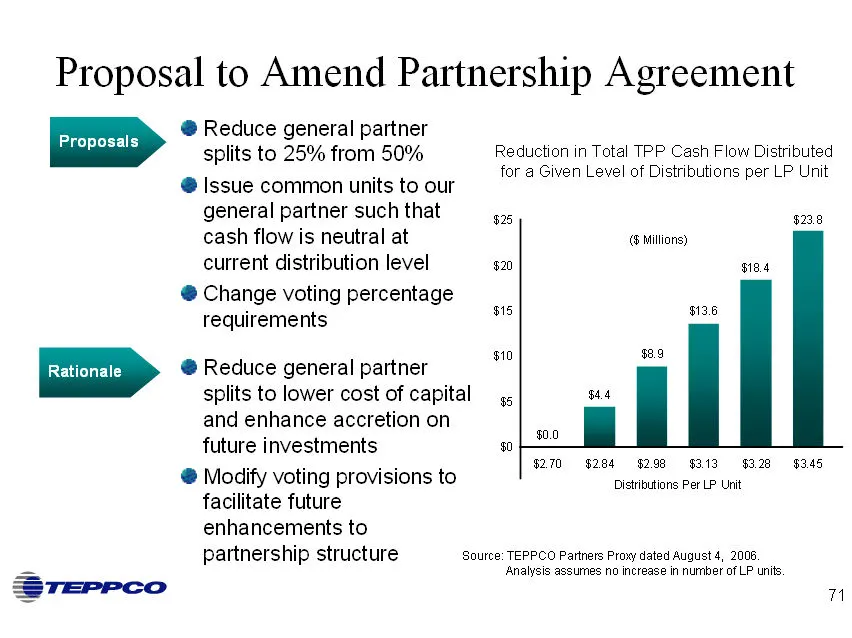
Proposal to Amend Partnership Agreement Reduce general partner splits to 25% from 50% Issue common units to our general partner such that cash flow is neutral at current distribution level Change voting percentage requirements Reduce general partner splits to lower cost of capital and enhance accret
Slide 72: Key Financial Strengths
Key Financial Strengths Stable fee-based cash flows from diversified assets Investment grade ratings with stable outlooks from S&P and Moody’s Financial metrics to support future growth opportunities New strategy of allocating more capital to attractive return opportunities in upstream and downstrea
Slide 73: Summary and Closing Remarks
Summary and Closing Remarks Jerry Thompson
Slide 74: Summary and Closing Remarks
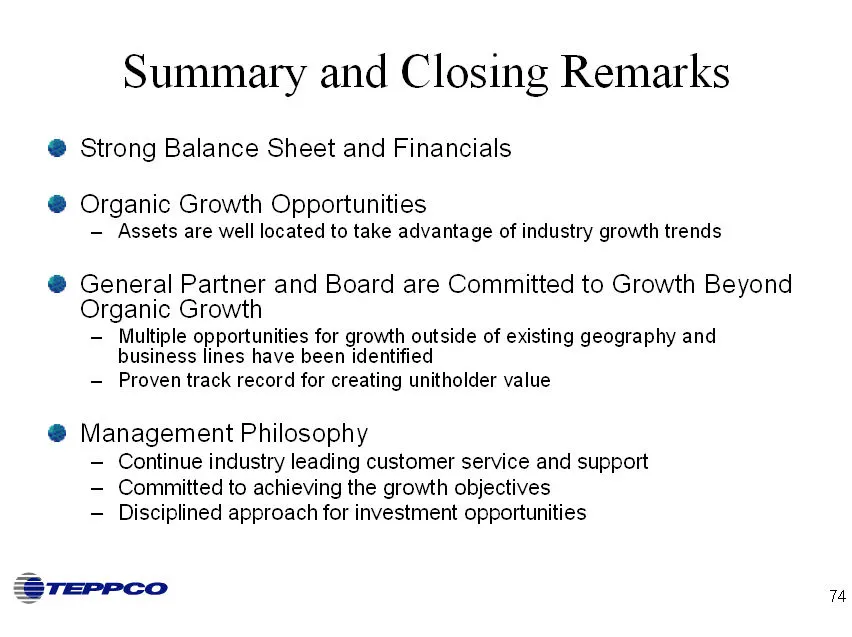
Summary and Closing Remarks Strong Balance Sheet and Financials Organic Growth Opportunities Assets are well located to take advantage of industry growth trends General Partner and Board are Committed to Growth Beyond Organic Growth Multiple opportunities for growth outside of existing geography and
Slide 75: Questions and Answers
Questions and Answers NYSE: TPP www.teppco.com (800) 659-0059
Slide 76: Appendix
a] Appendix 76
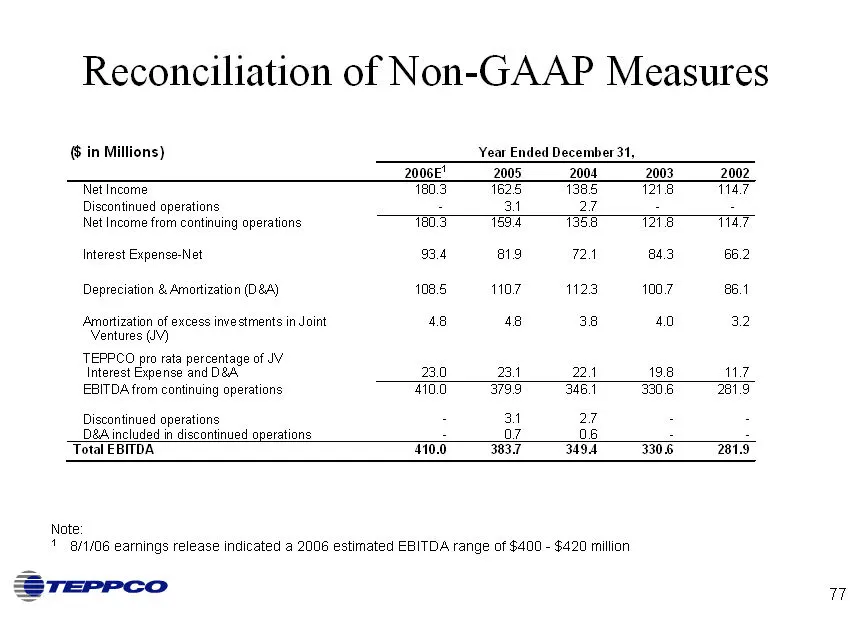
Slide 77: Reconciliation of Non-GAAP Measures
Reconciliation of Non-GAAP Measures
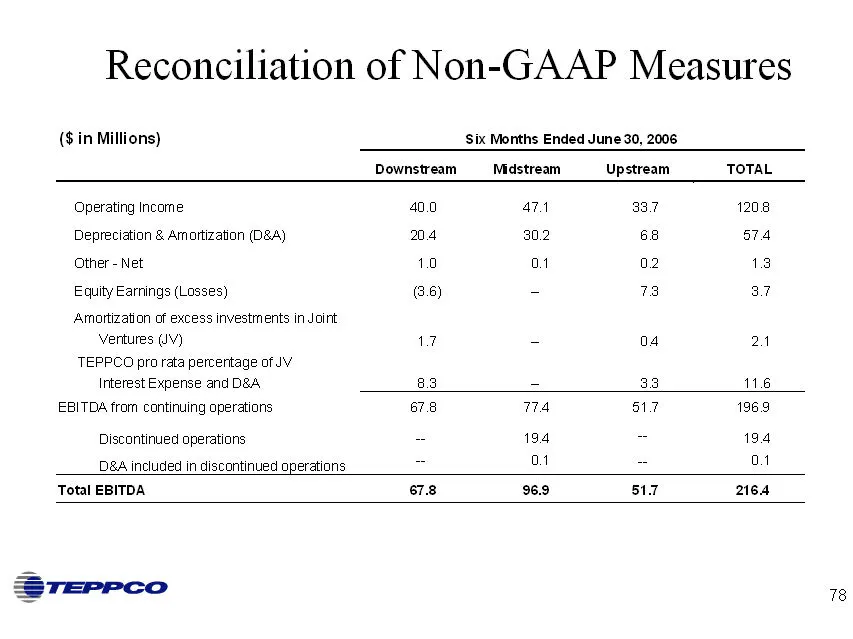
Slide 78: Reconciliation of Non-GAAP Measures
Reconciliation of Non-GAAP Measures
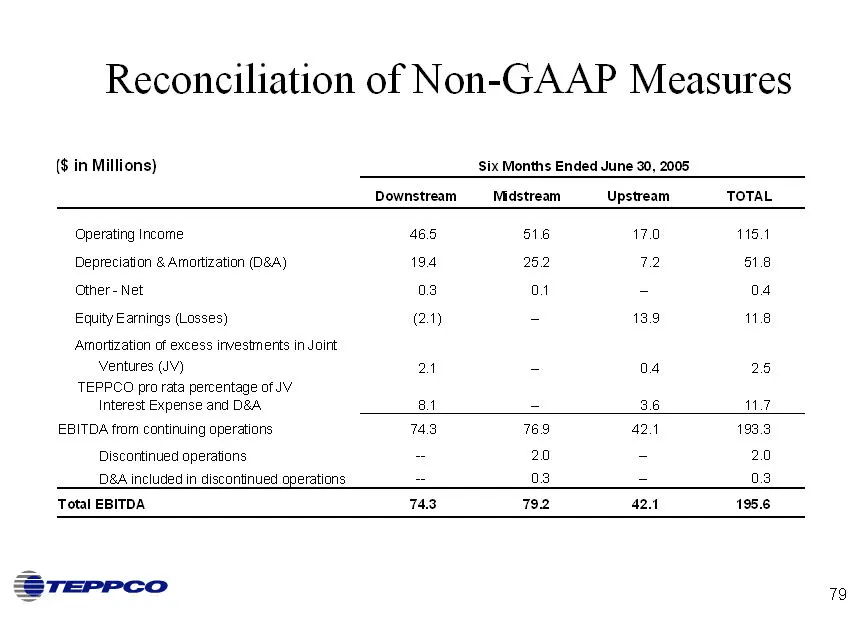
Slide 79: Reconciliation of Non-GAAP Measures
Reconciliation of Non-GAAP Measures
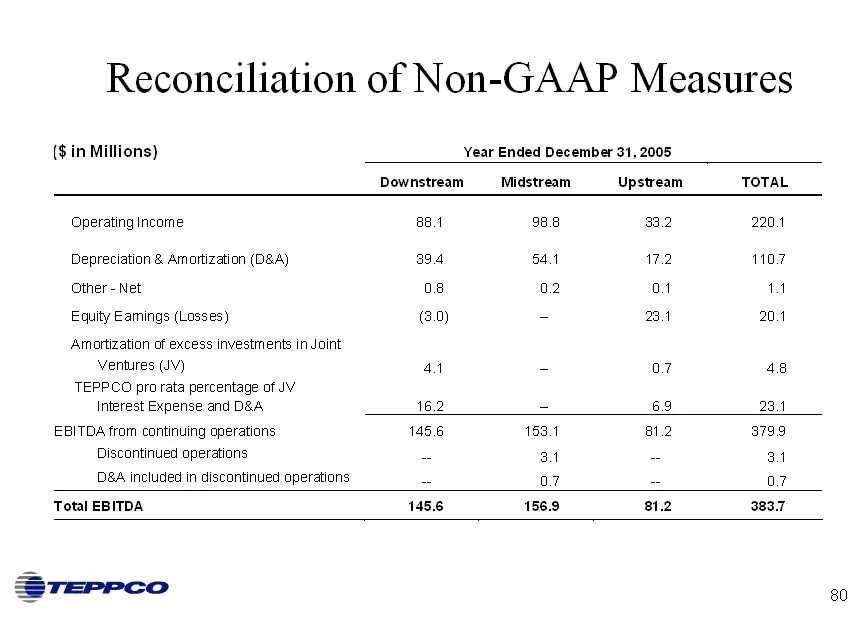
Slide 80: Reconciliation of Non-GAAP Measures
Reconciliation of Non-GAAP Measures
Slide 81: Reconciliation of Non-GAAP Measures
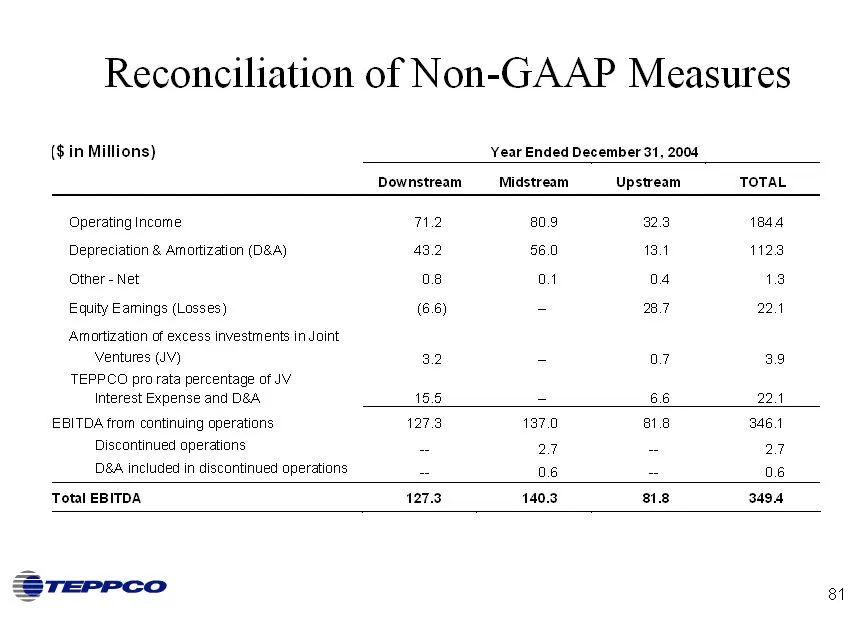
Reconciliation of Non-GAAP Measures
Slide 82: Reconciliation of Non-GAAP Measures
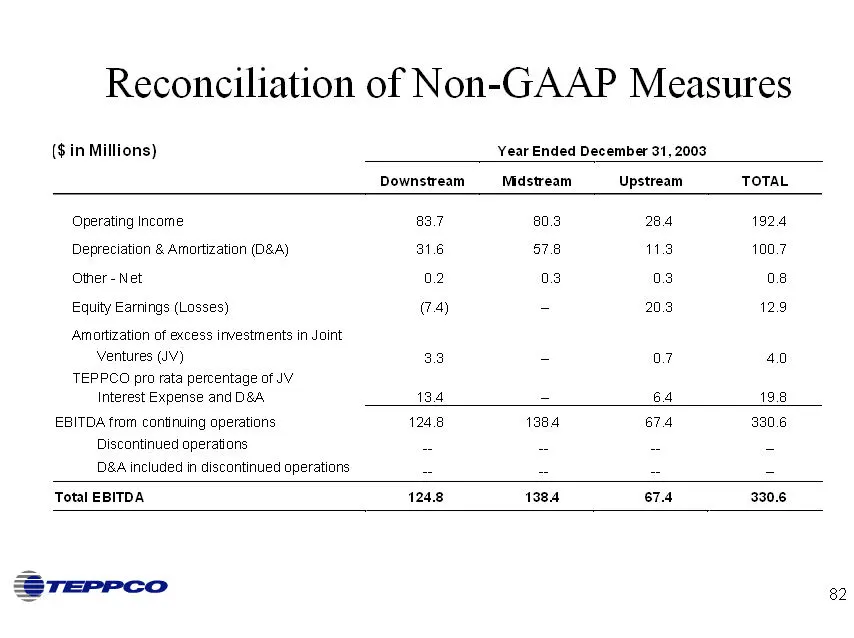
Reconciliation of Non-GAAP Measures
Slide 83: Reconciliation of Non-GAAP Measures
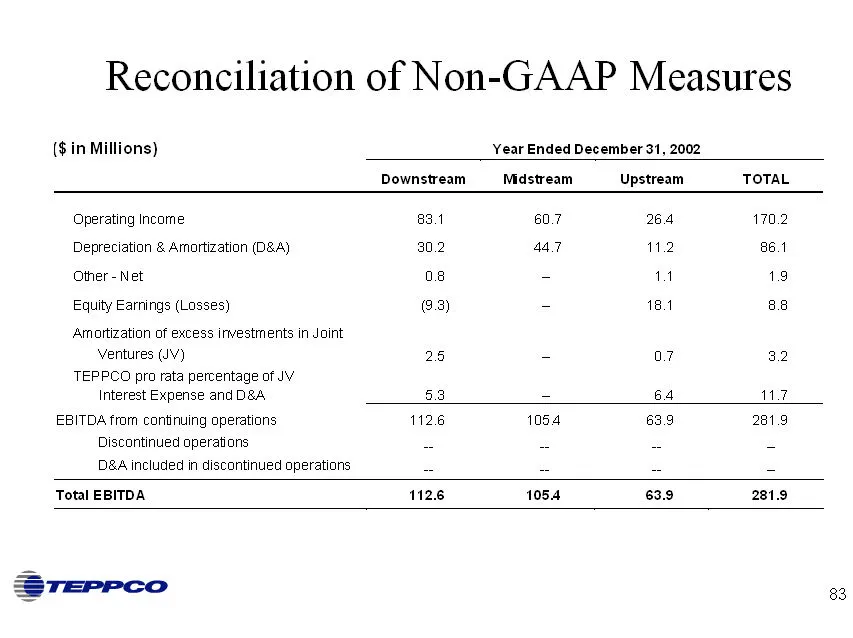
Reconciliation of Non-GAAP Measures
Slide 84: Proxy Matters
Proxy Matters TEPPCO plans to file with the SEC and mail to unitholders a definitive proxy statement in connection with the proposals described in TEPPCO’s Preliminary Proxy Statement on Schedule 14A, which was most recently filed with the SEC on August 4, 2006. Before making any voting decision wit
Source: SEC EDGAR · 8-K filed Aug 16, 2006
More decks from Teppco Partners LP
 Morgan Stanley MLP Reception (October 2009)26 slides · Oct 7, 2009
 Master Limited Partnerships Investor Conference (September 2009)27 slides · Sep 16, 2009
 Wells Fargo Retail Meeting (September 2009)27 slides · Sep 15, 2009
 Barclays Capital CEO Energy/Power Conference 200929 slides · Sep 9, 2009
 Merger or Acquisition (August 2009)29 slides · Aug 26, 2009
 Wachovia Securities Investor Presentation (June 2007)51 slides · Jun 1, 2007