Hyprop Investments Limited · JSE:HYP
Hyprop Investments — Corporate Update (December 2024)
22 slides from Hyprop Investments's corporate update, Dec 4, 2024
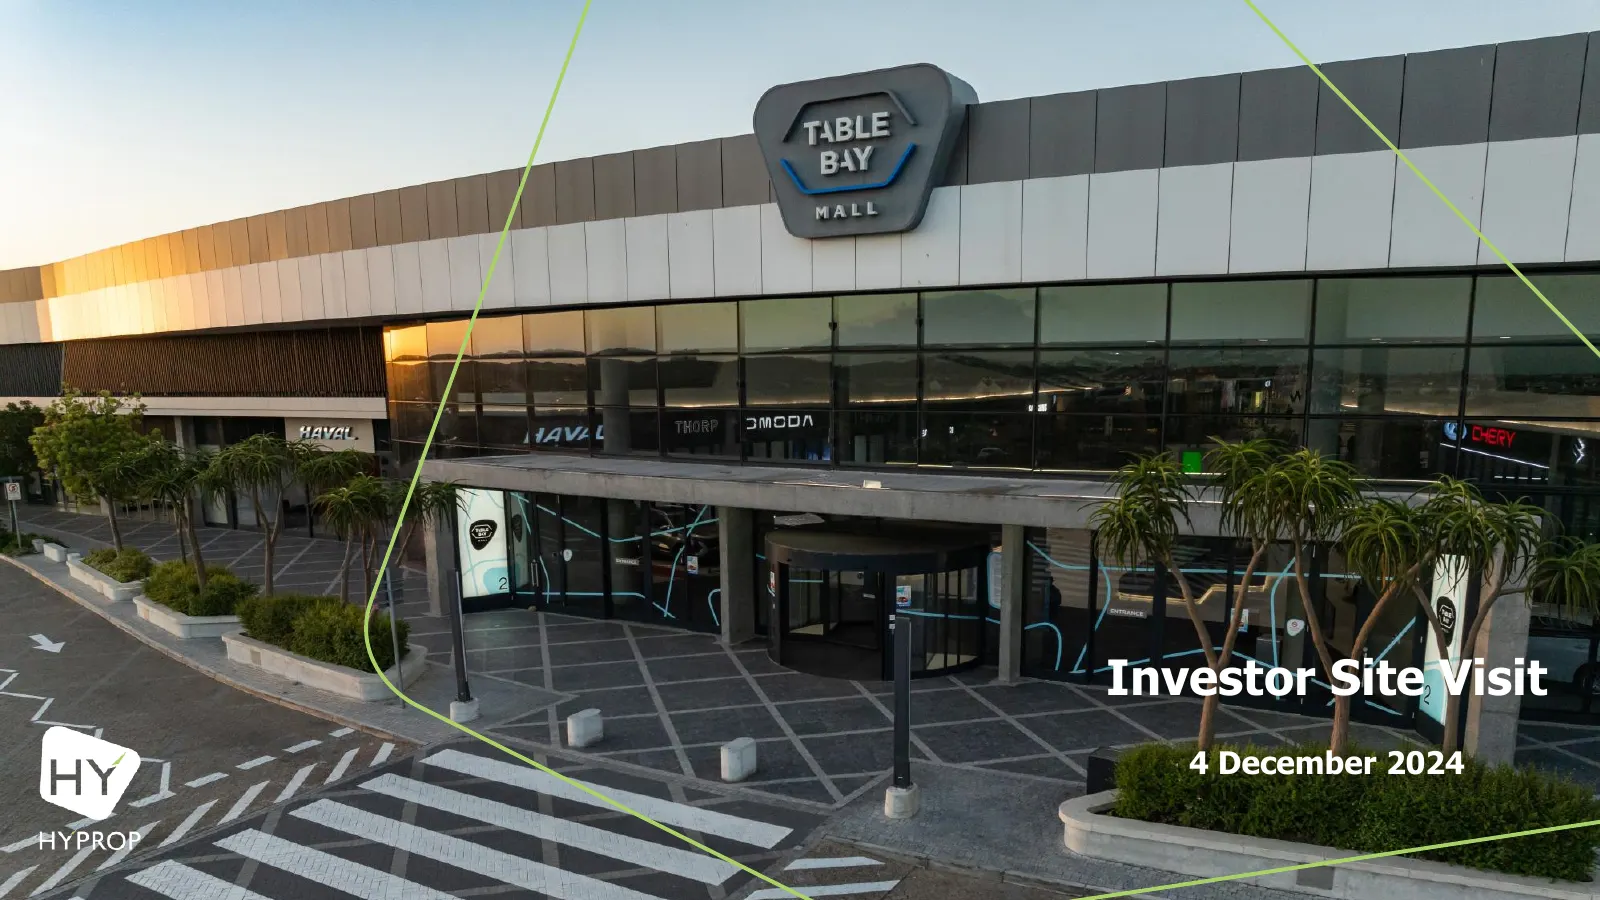
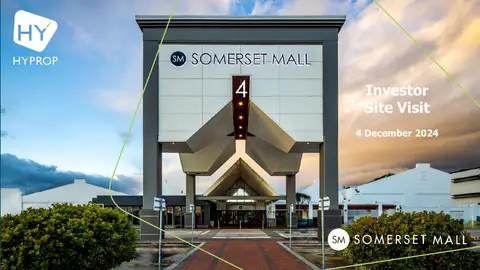
Slide 1: Investor Site Visit
Investor Site Visit 4 December 2024
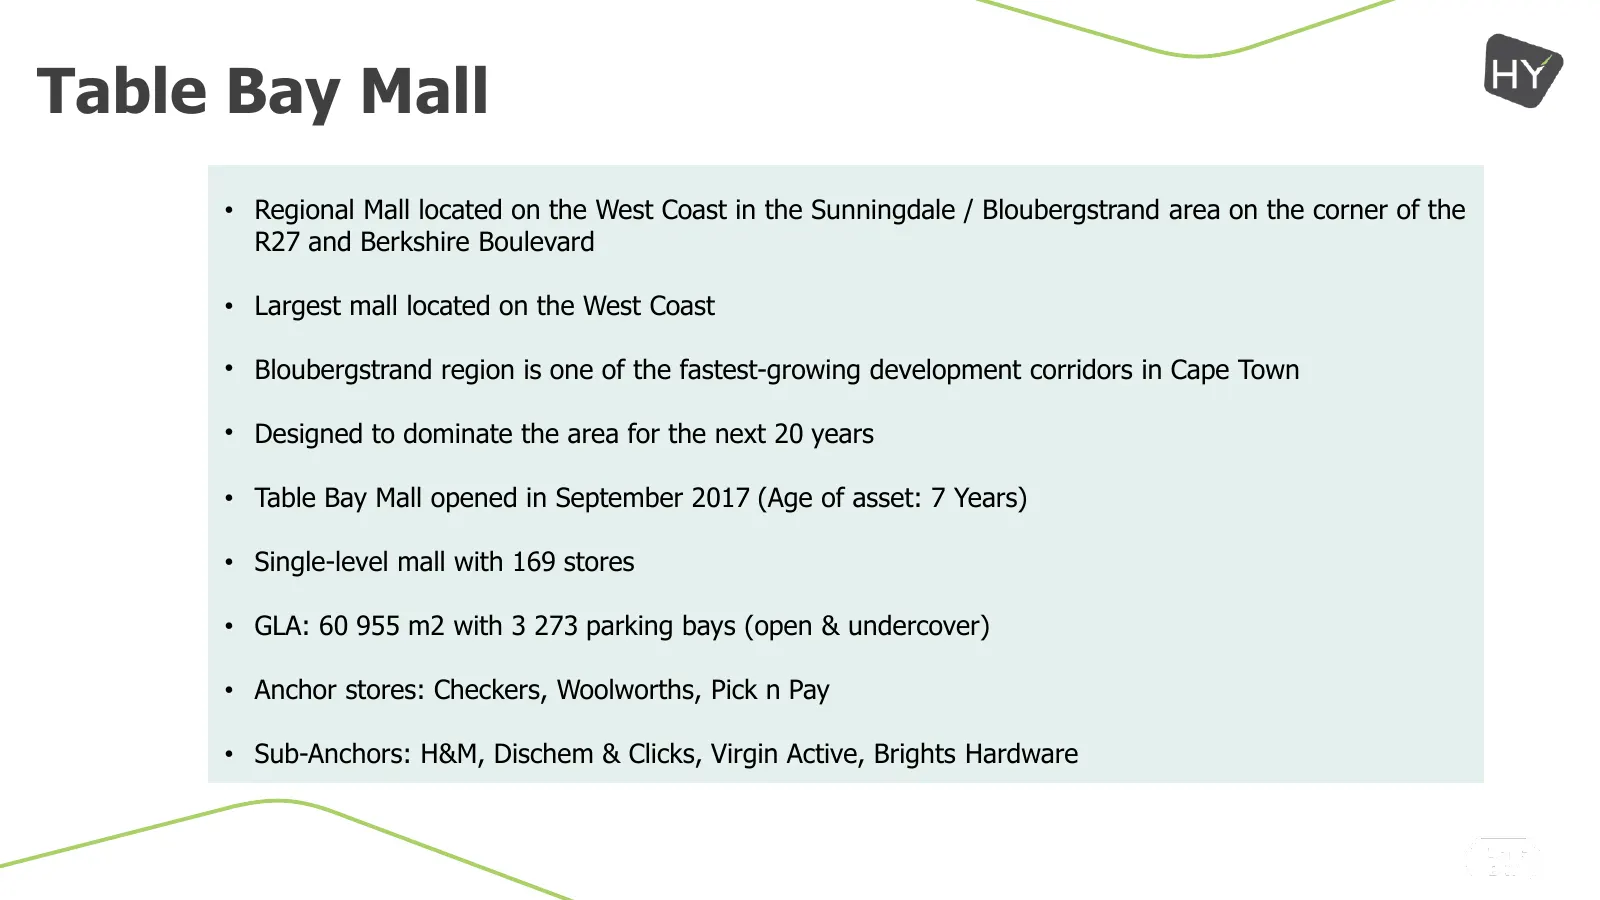
Slide 2: Table Bay Mall
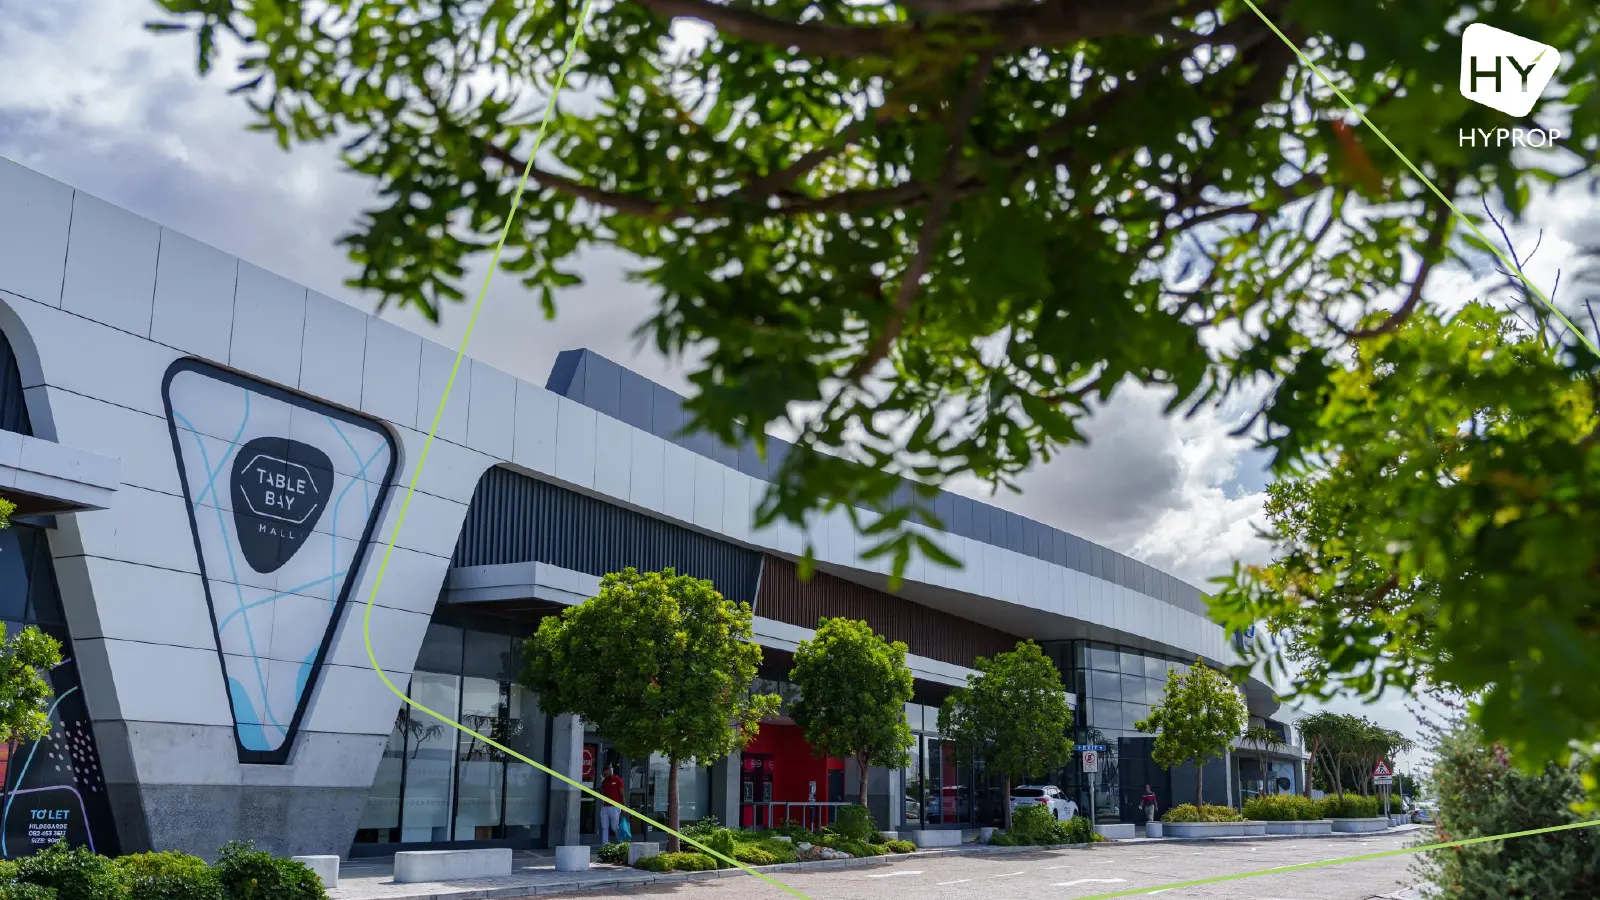
Table Bay Mall • Regional Mall located on the West Coast in the Sunningdale / Bloubergstrand area on the corner of the R27 and Berkshire Boulevard • Largest mall located on the West Coast • Bloubergstrand region is one of the fastest-growing development corridors in Cape Town • Designed to dominate
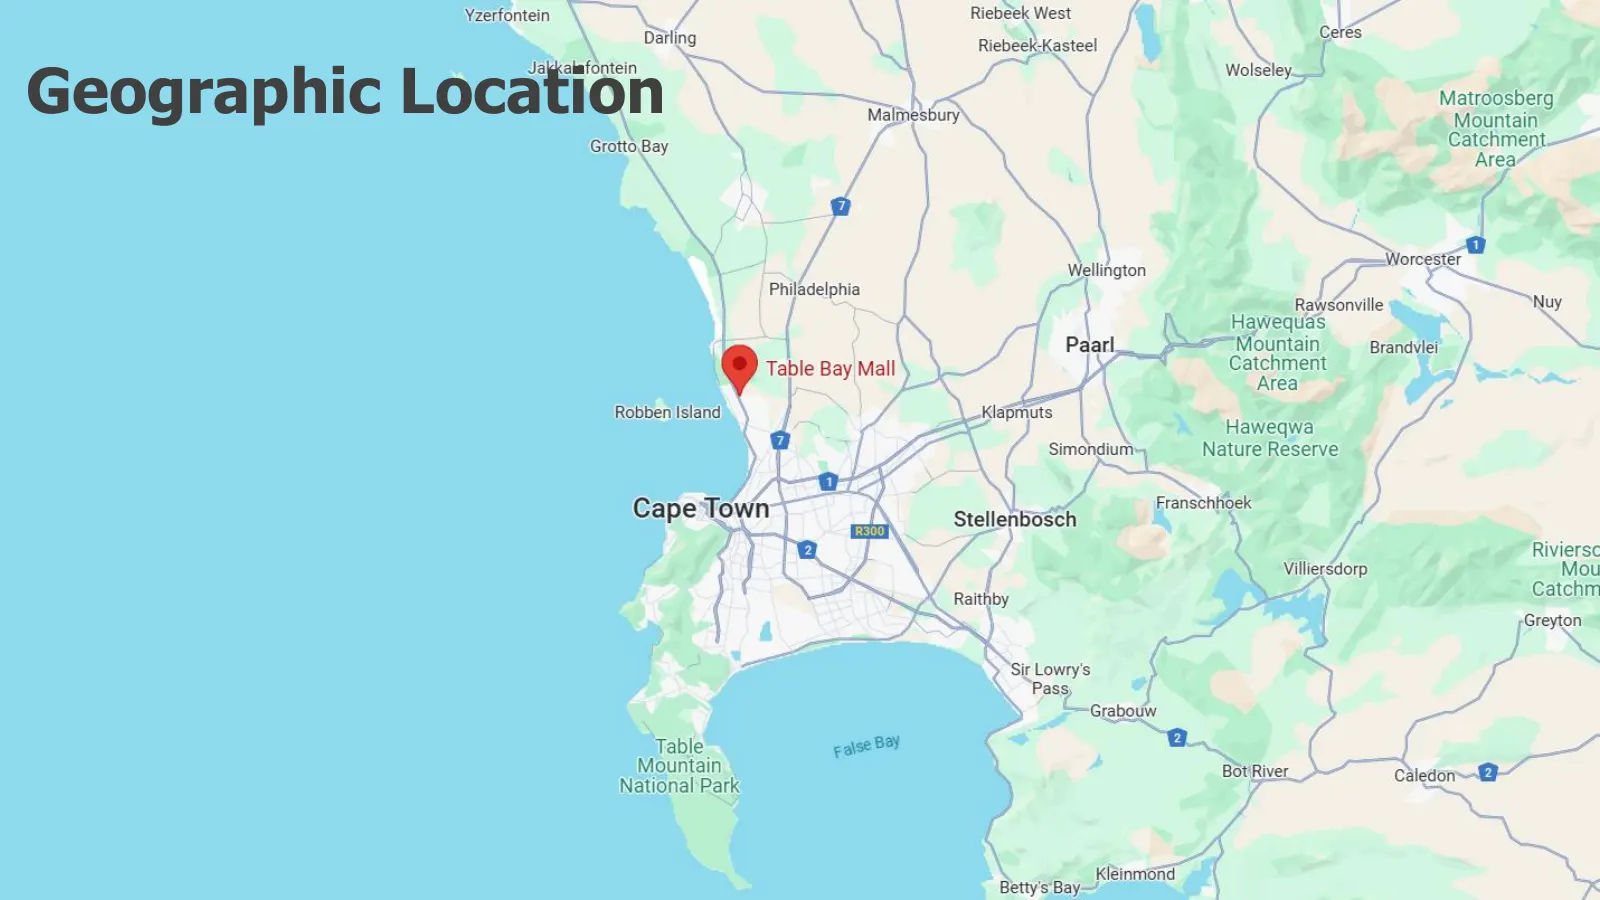
Slide 3: Geographic Location
Yzerfontein Riebeek West Datling Cerés Riebeek-Kasteel Geographic Location : ‘-— “aude Malmesbury Mountain Grotto Bay | Catchment | | Area: d | Wellington Worcester Philadelphia Rawsonville Nuy Hawequas Paarl__ = Mountain Brandvlei @ Table Bay Mall | Dy Catchment i A Area Robben Island Klapmuts Hawe
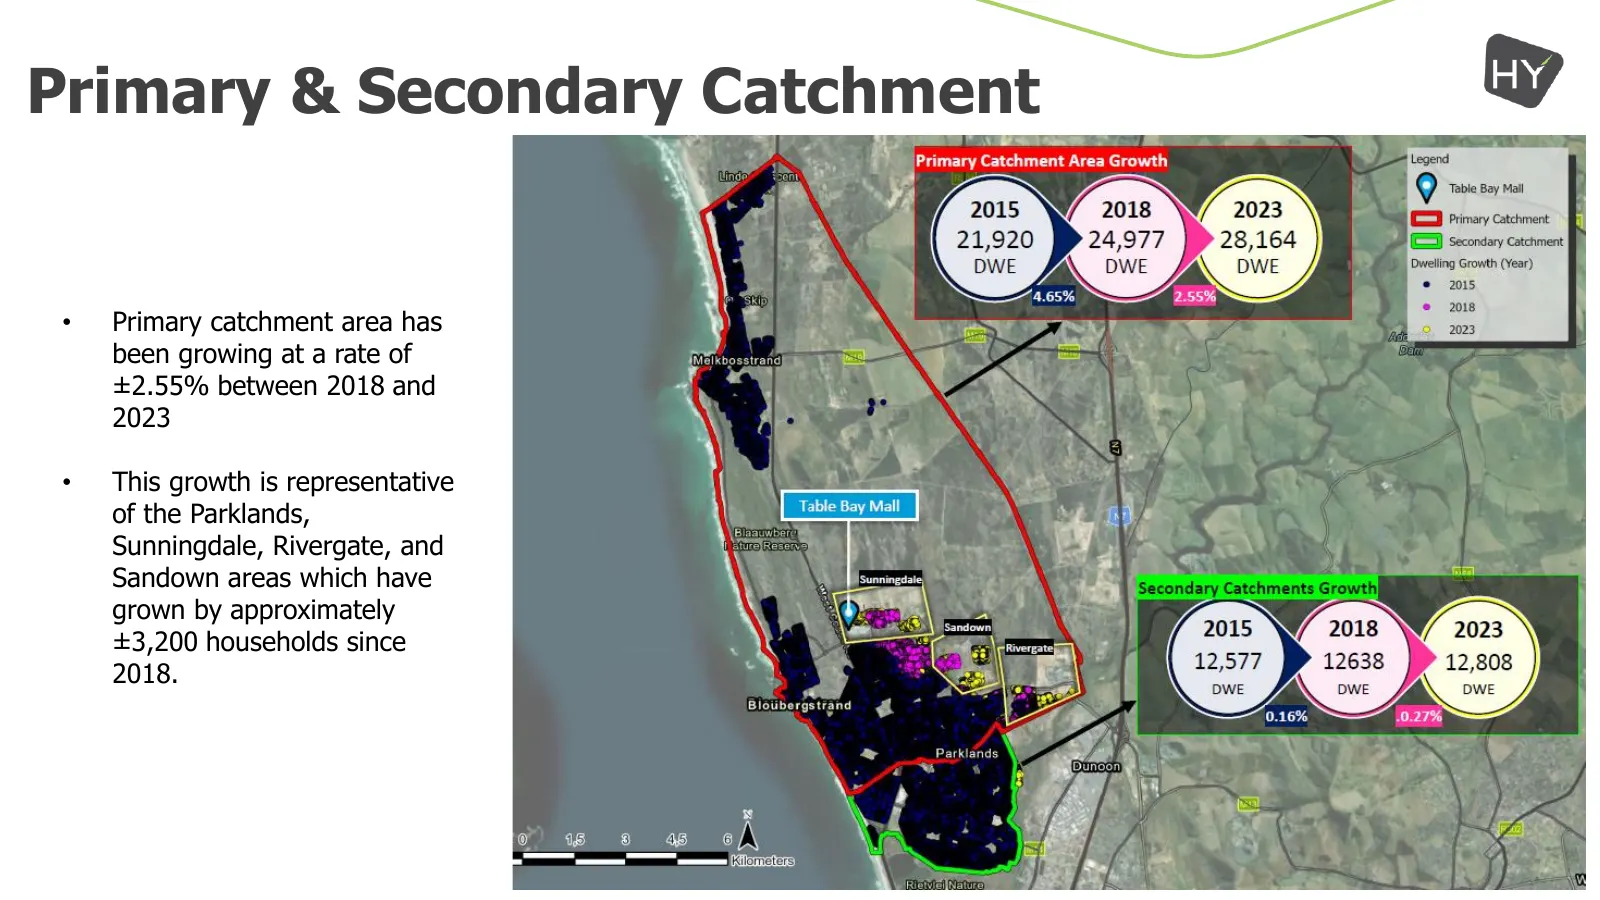
Slide 4: Primary & Secondary Catchment
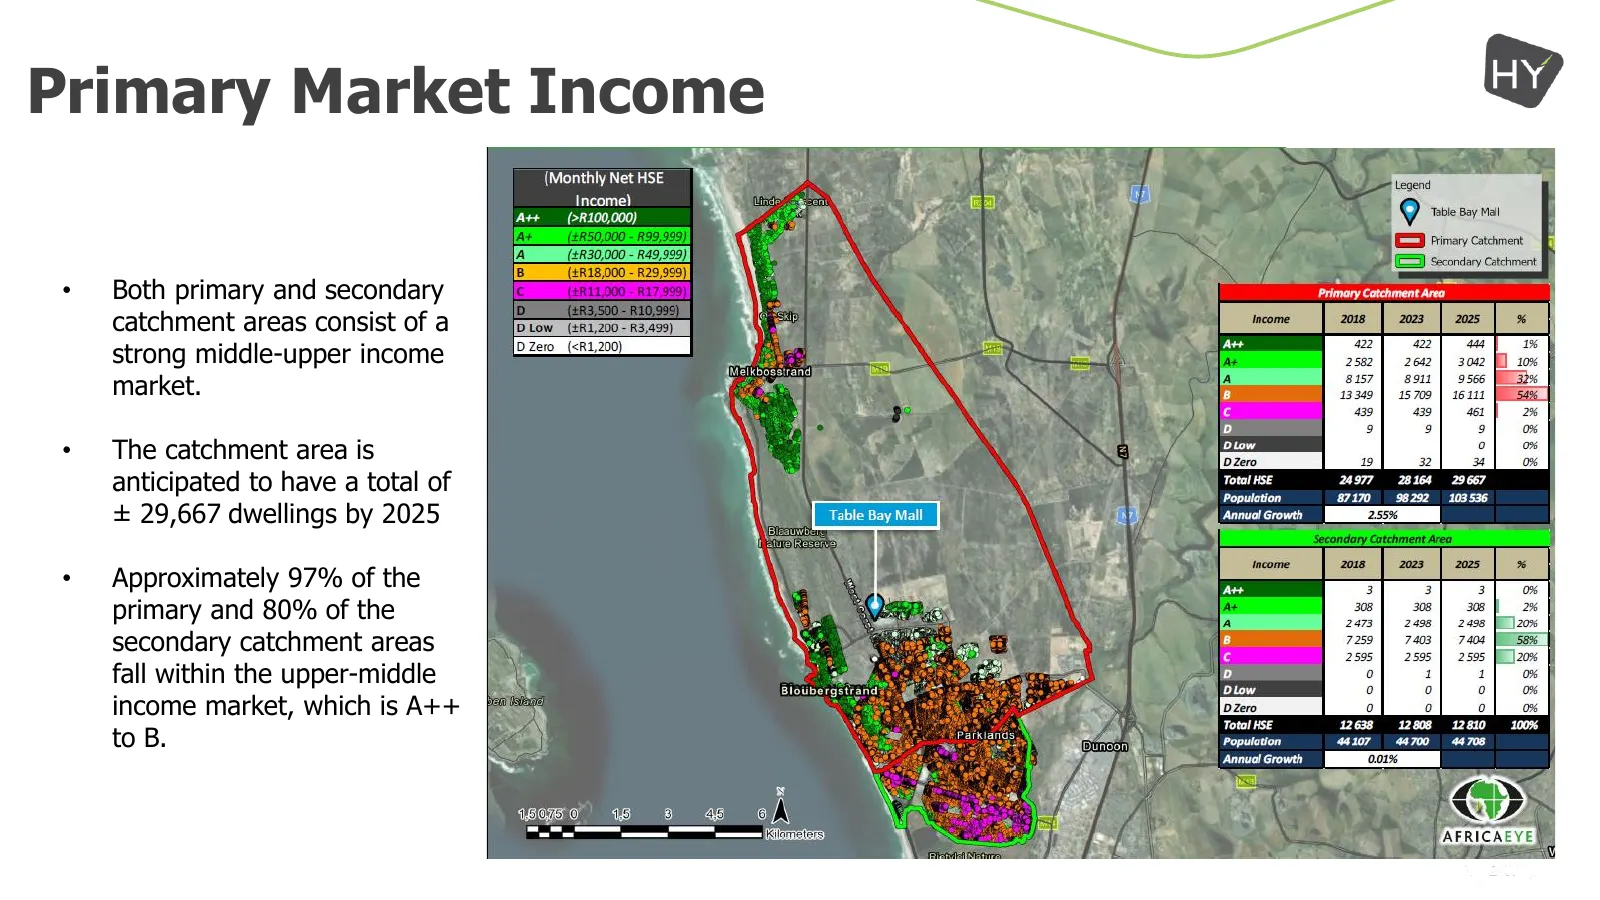
Primary & Secondary Catchment • Primary catchment area has been growing at a rate of ±2.55% between 2018 and 2023 • This growth is representative of the Parklands, Sunningdale, Rivergate, and Sandown areas which have grown by approximately ±3,200 households since 2018.
Slide 5: Primary Market Income
Primary Market Income • Both primary and secondary catchment areas consist of a strong middle-upper income market. • The catchment area is anticipated to have a total of ± 29,667 dwellings by 2025 • Approximately 97% of the primary and 80% of the secondary catchment areas fall within the upper-middl
Slide 6: Centre Layout
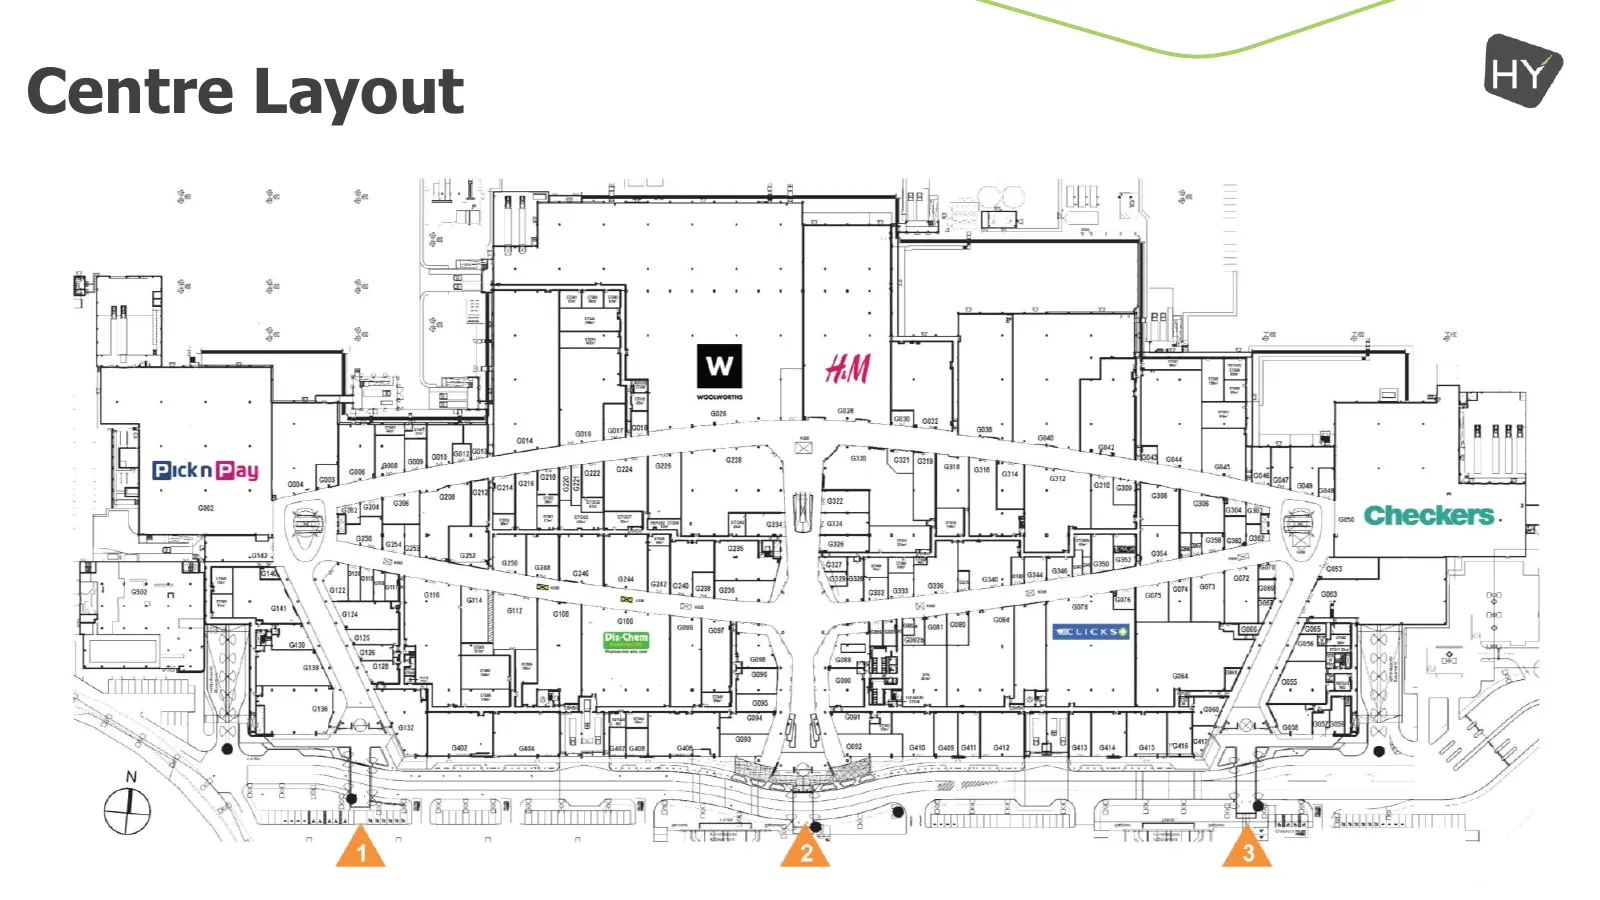
Centre Layout lis fill Ley mm
Slide 7: Market Share
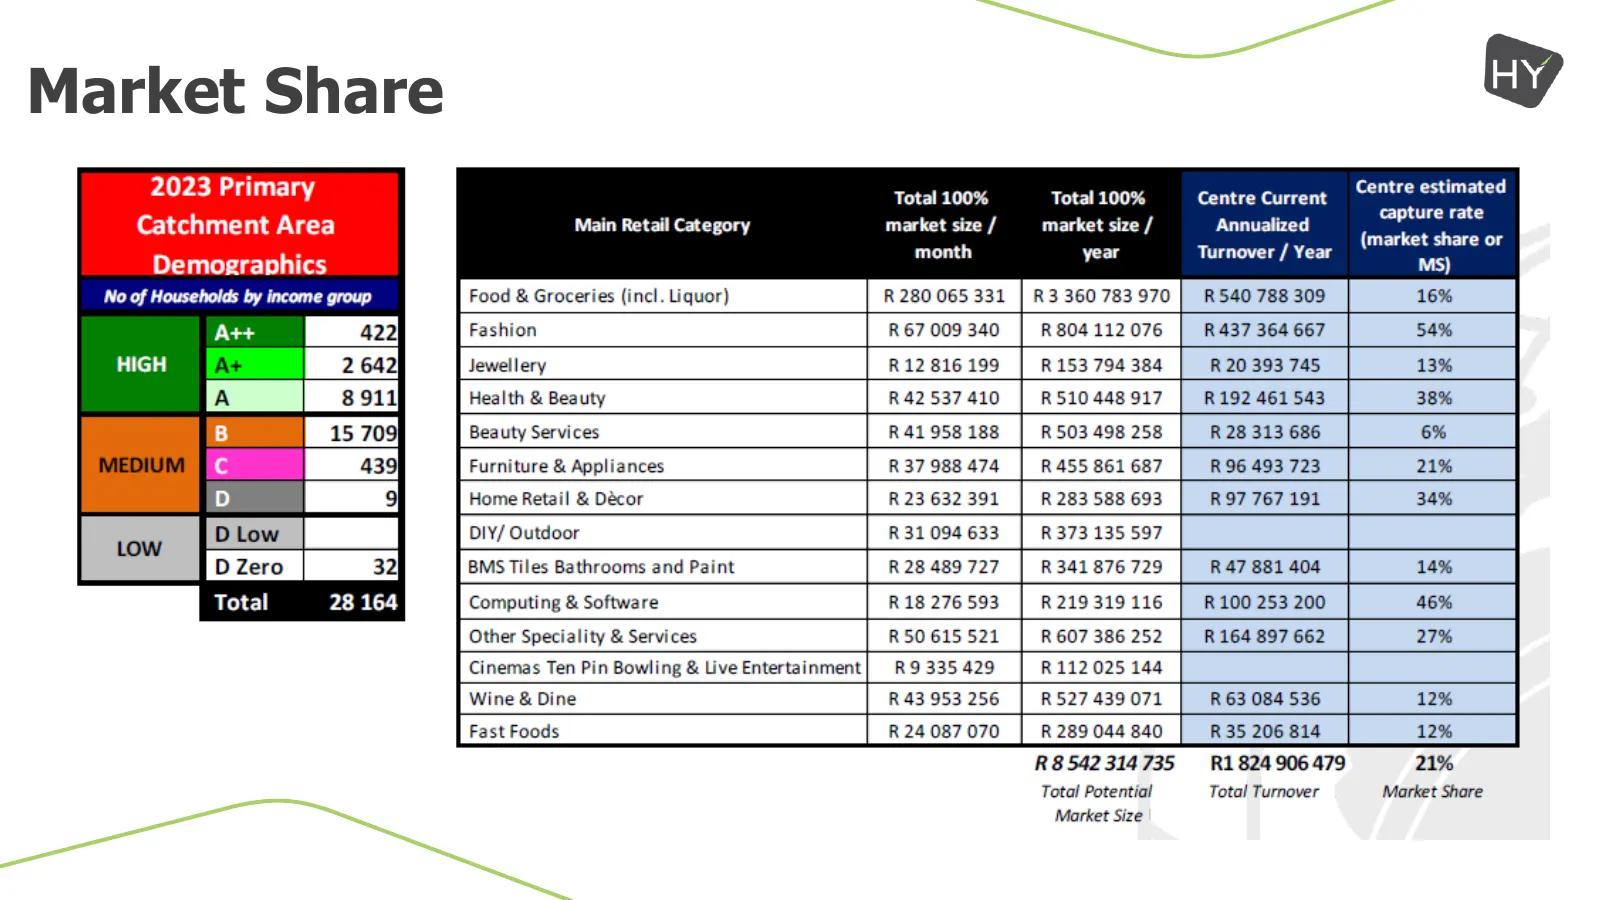
Market Share 2023 Primary Centre estimated Total 100% Total 100% Centre Current Catchment Area Main Retail Category market size / market size / Annualized a Demographics month year Turnover / Year Ms) No of Households by income group Food & Groceries (incl. Liquor) R 280 065 331 | R3 360783970 R540
Slide 8: Demographics
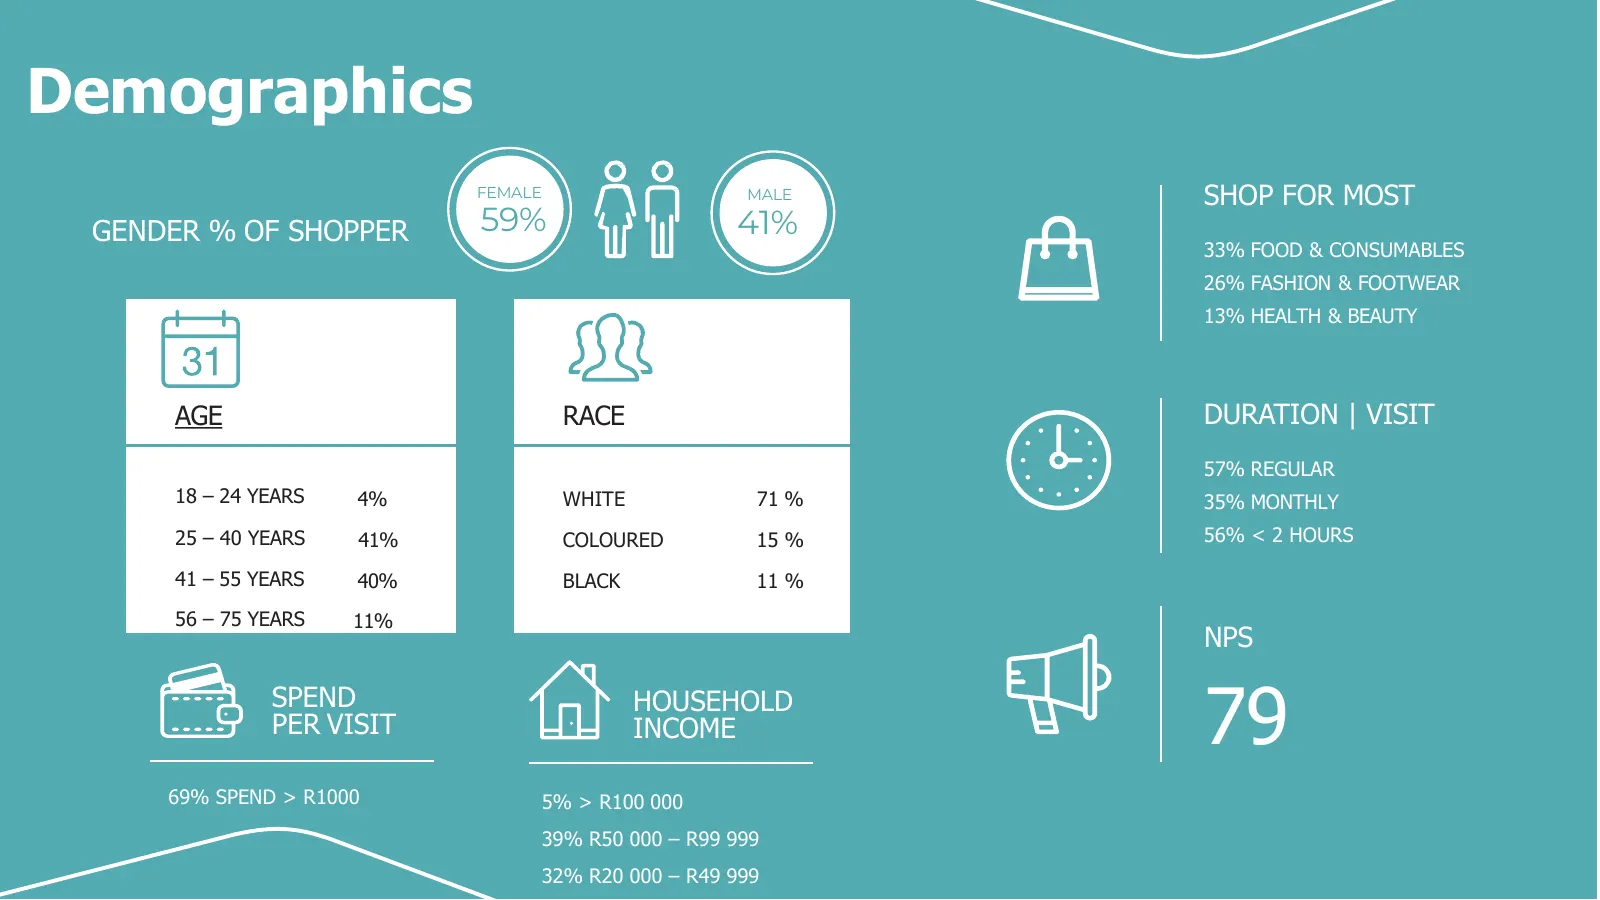
Demographics FEMALE MALE SHOP FOR MOST GENDER % OF SHOPPER 59% 41% 33% FOOD & CONSUMABLES 26% FASHION & FOOTWEAR 13% HEALTH & BEAUTY AGE RACE DURATION | VISIT 57% REGULAR 18 – 24 YEARS 4% WHITE 71 % 35% MONTHLY 25 – 40 YEARS 41% COLOURED 15 % 56% < 2 HOURS 41 – 55 YEARS 40% BLACK 11 % 56 – 75 YEARS
Slide 9: Looking Back
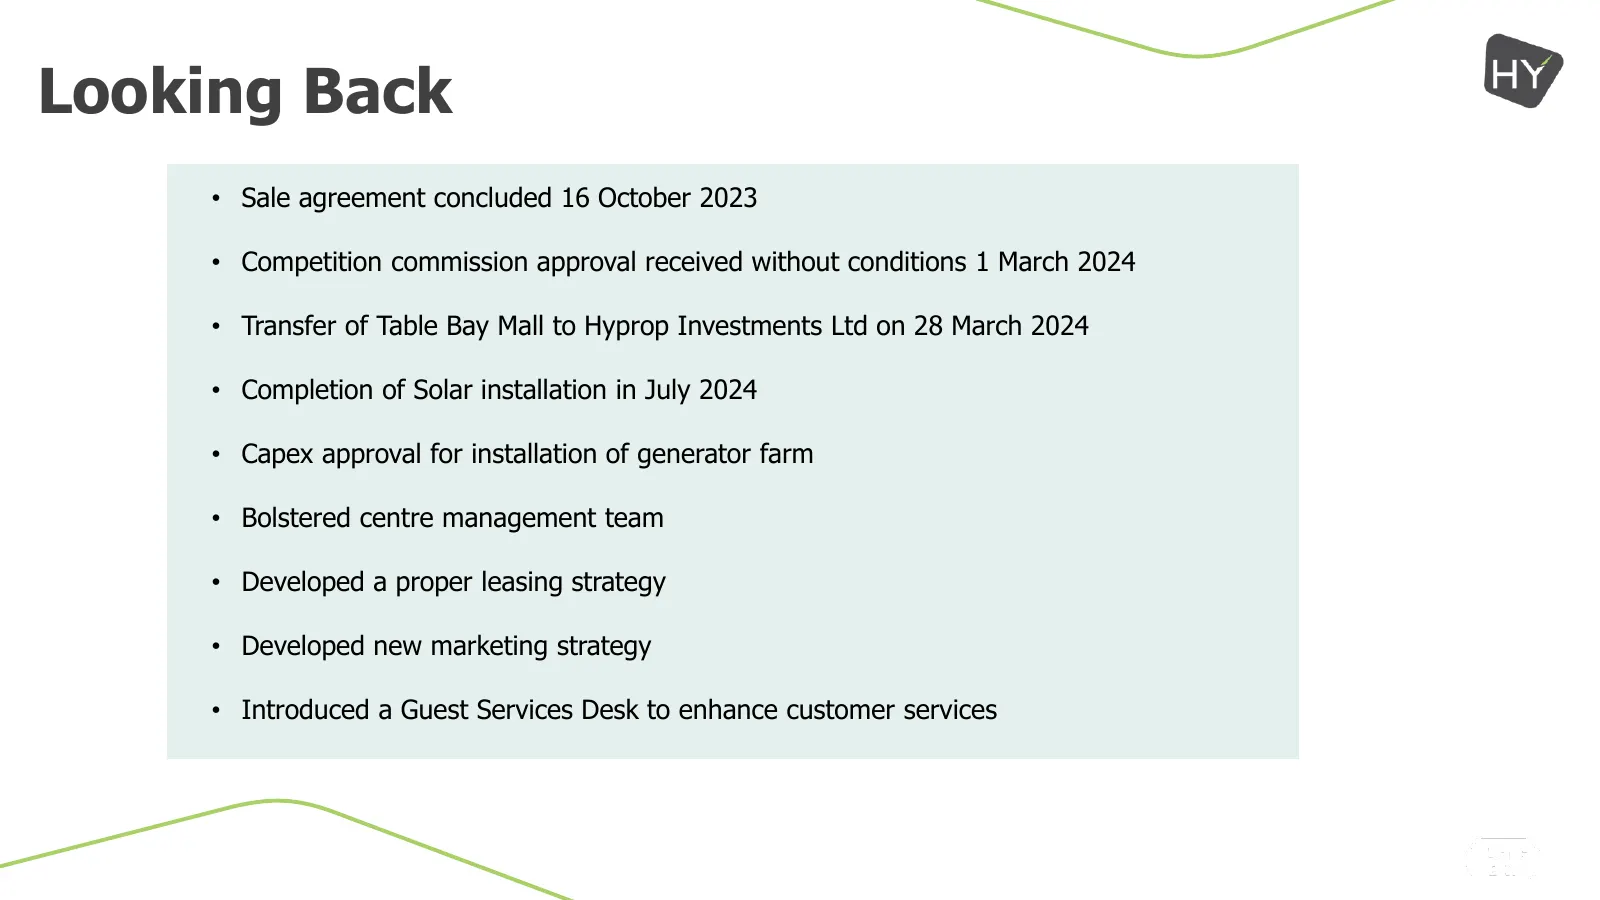
Looking Back • Sale agreement concluded 16 October 2023 • Competition commission approval received without conditions 1 March 2024 • Transfer of Table Bay Mall to Hyprop Investments Ltd on 28 March 2024 • Completion of Solar installation in July 2024 • Capex approval for installation of generator fa
Slide 10: September 2019
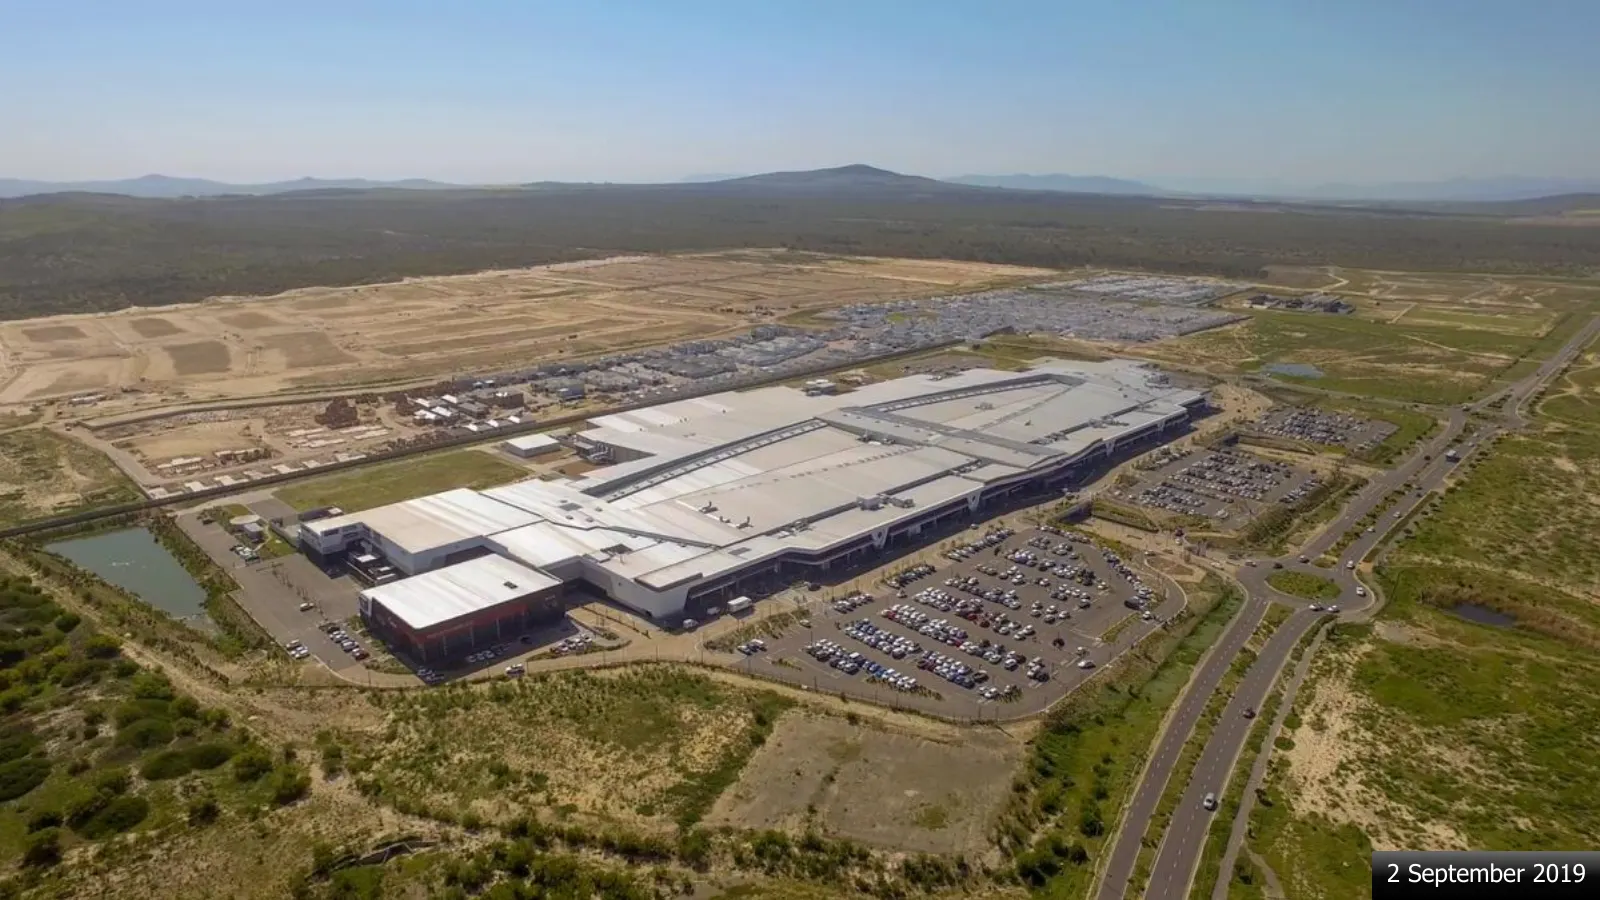
2 September 2019
Slide 11: September 2024
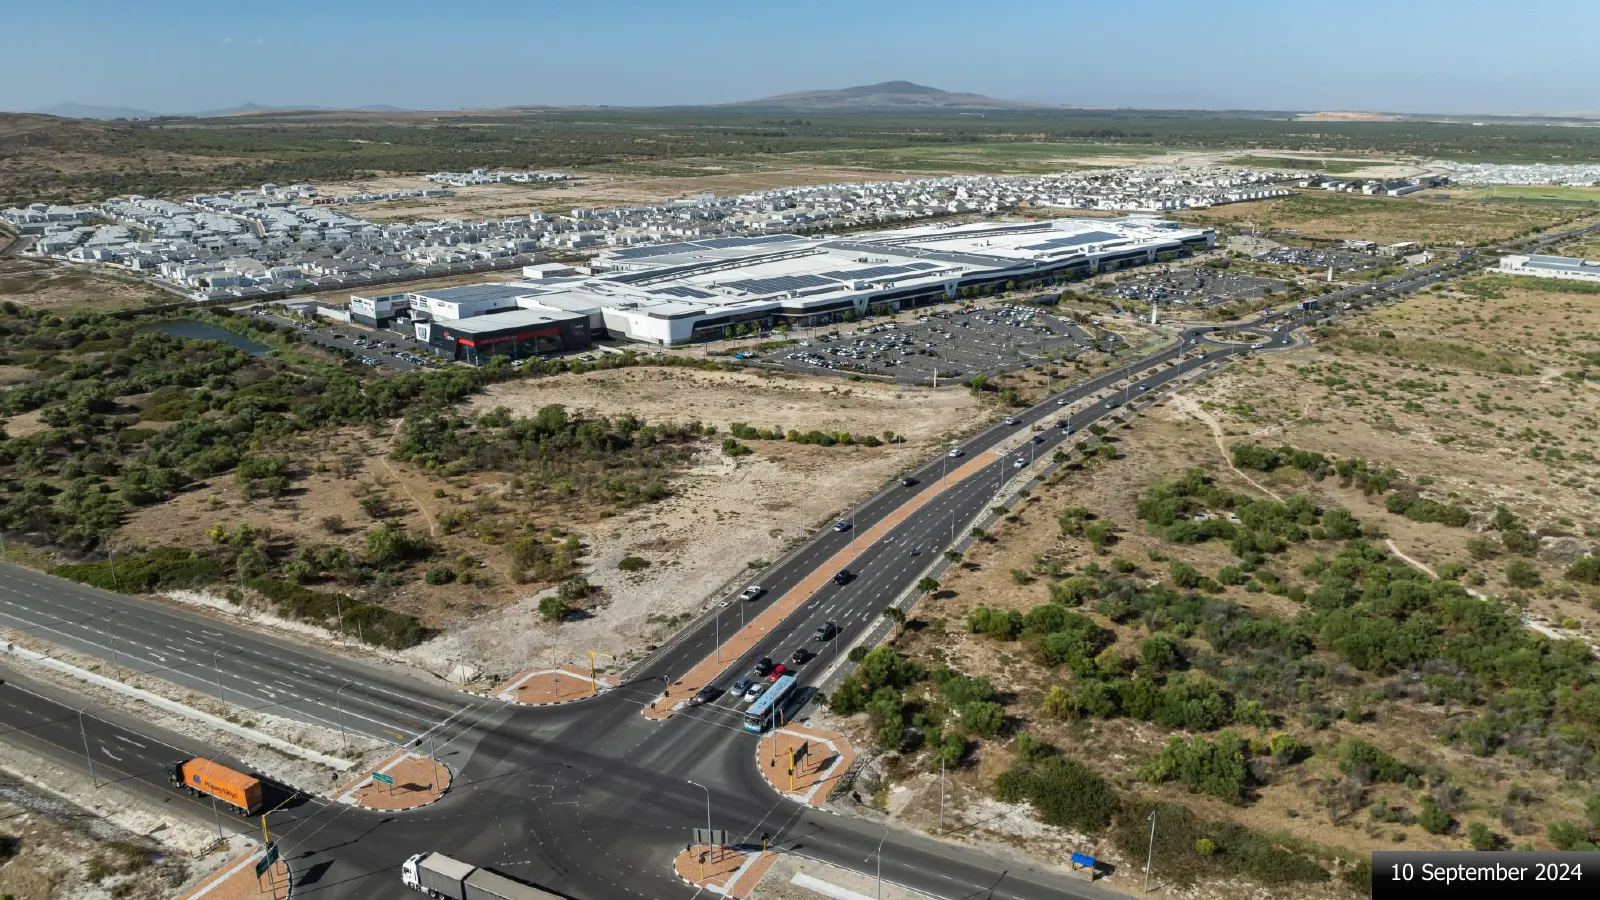
10 September 2024
Slide 12: September 2024
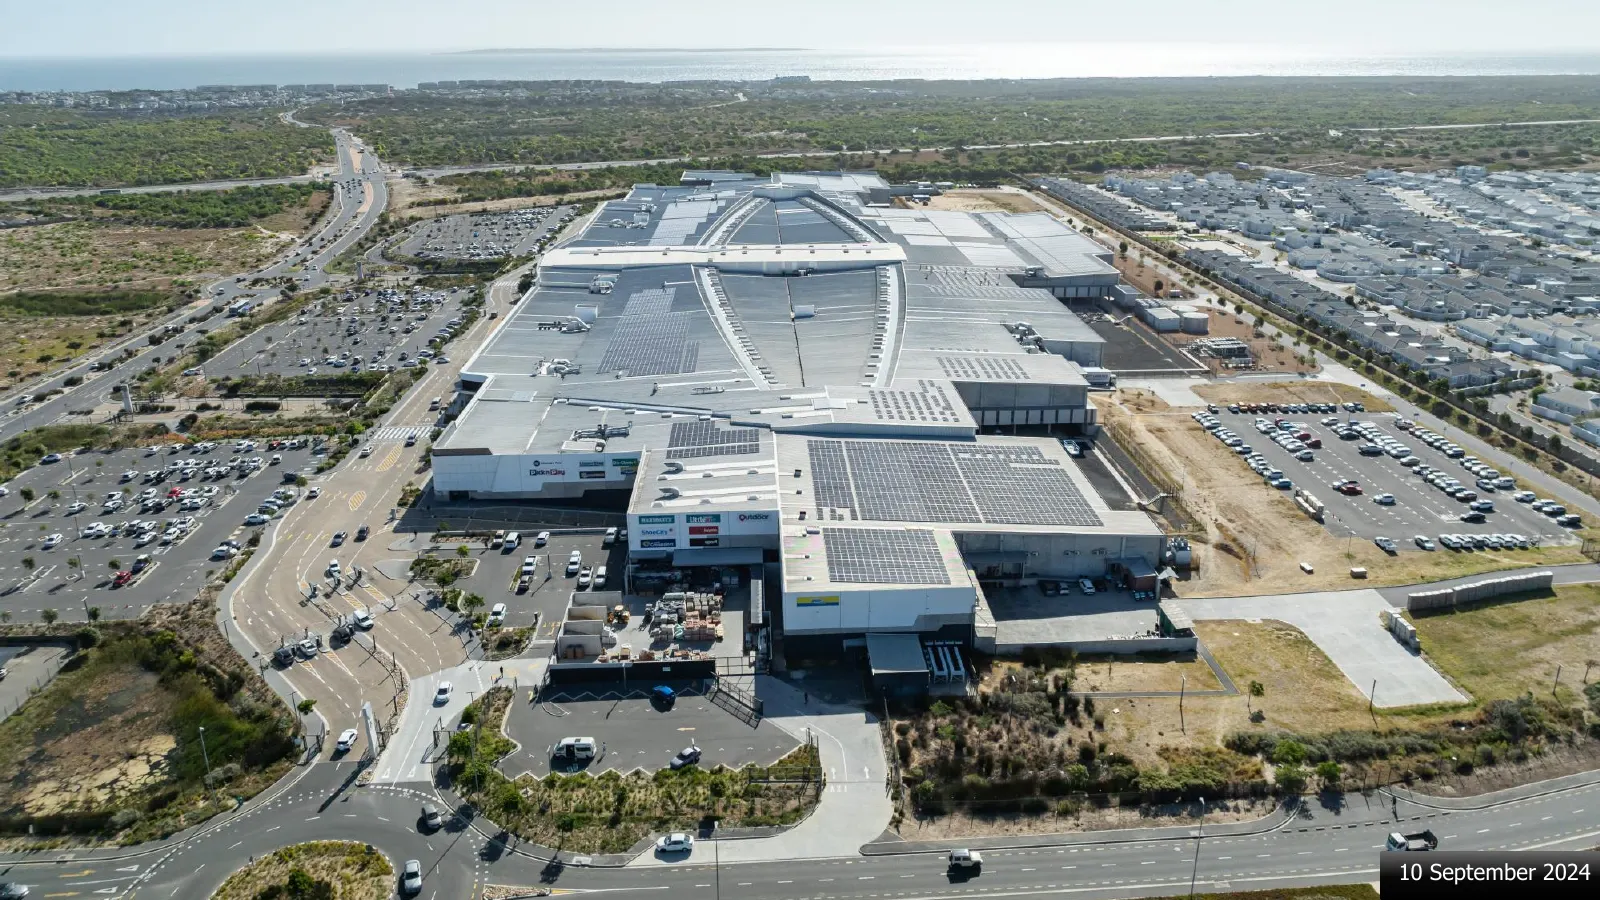
10 September 2024
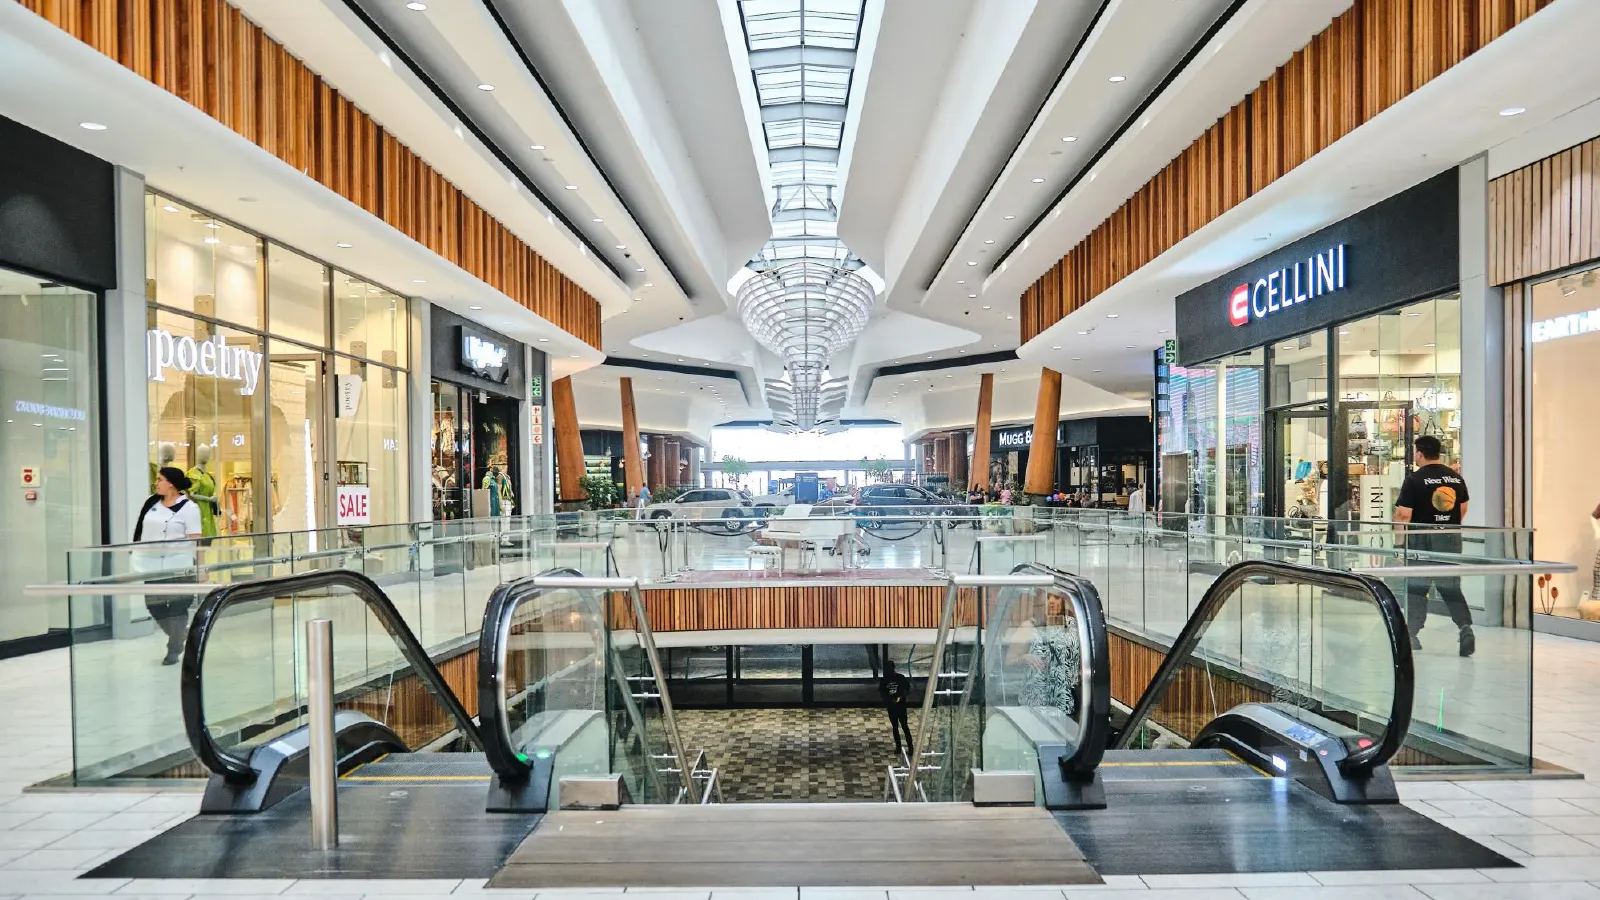
Slide 13
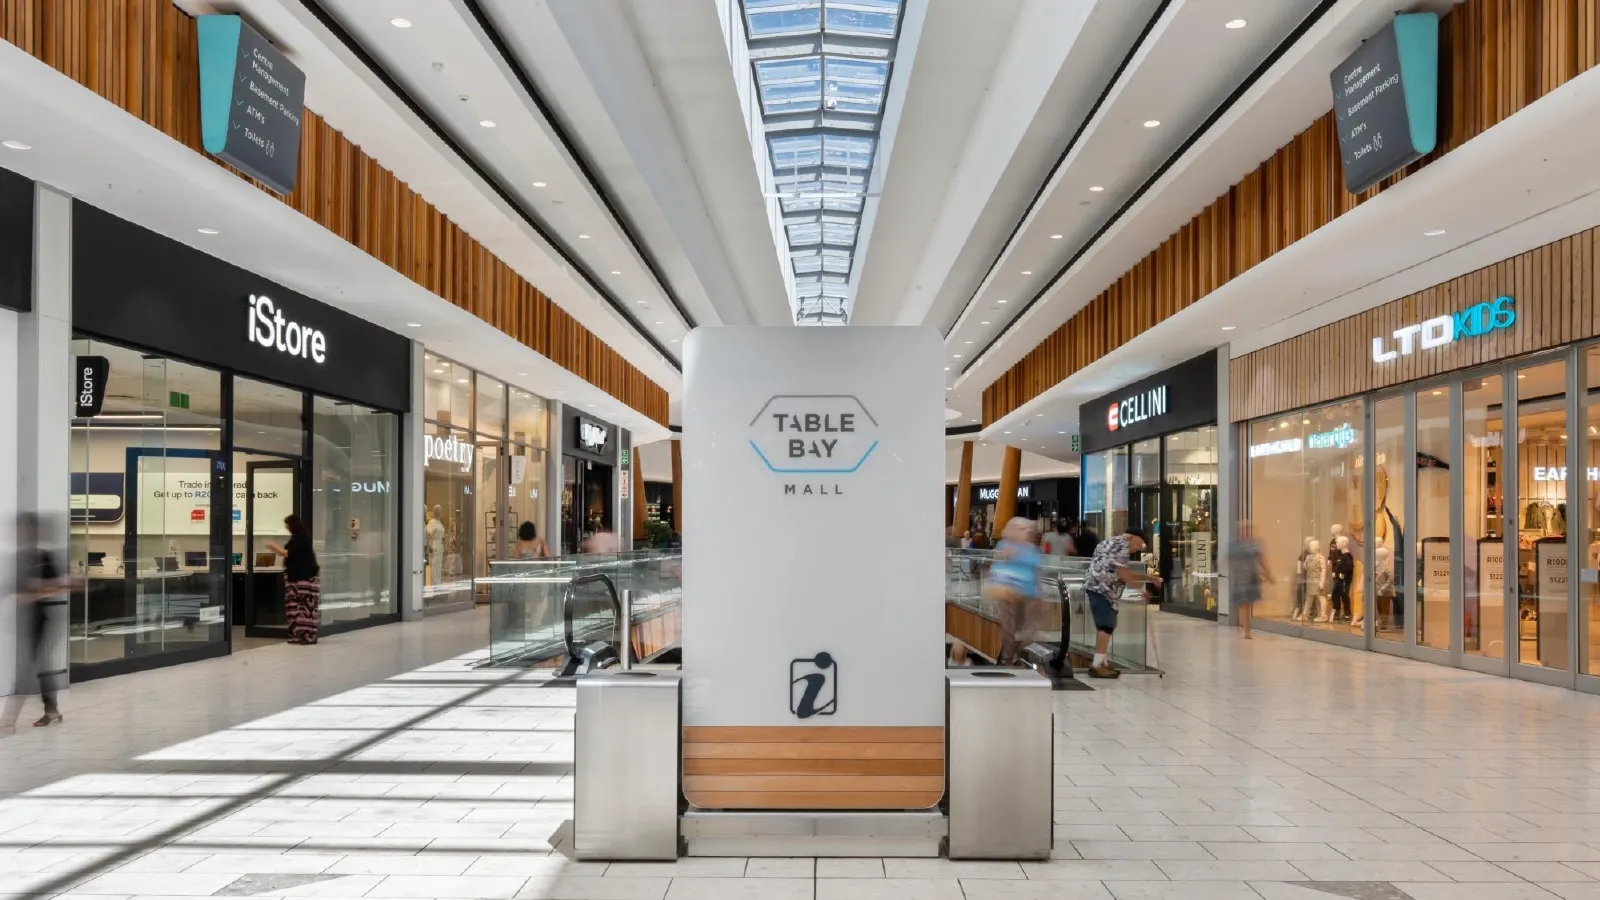
Slide 14
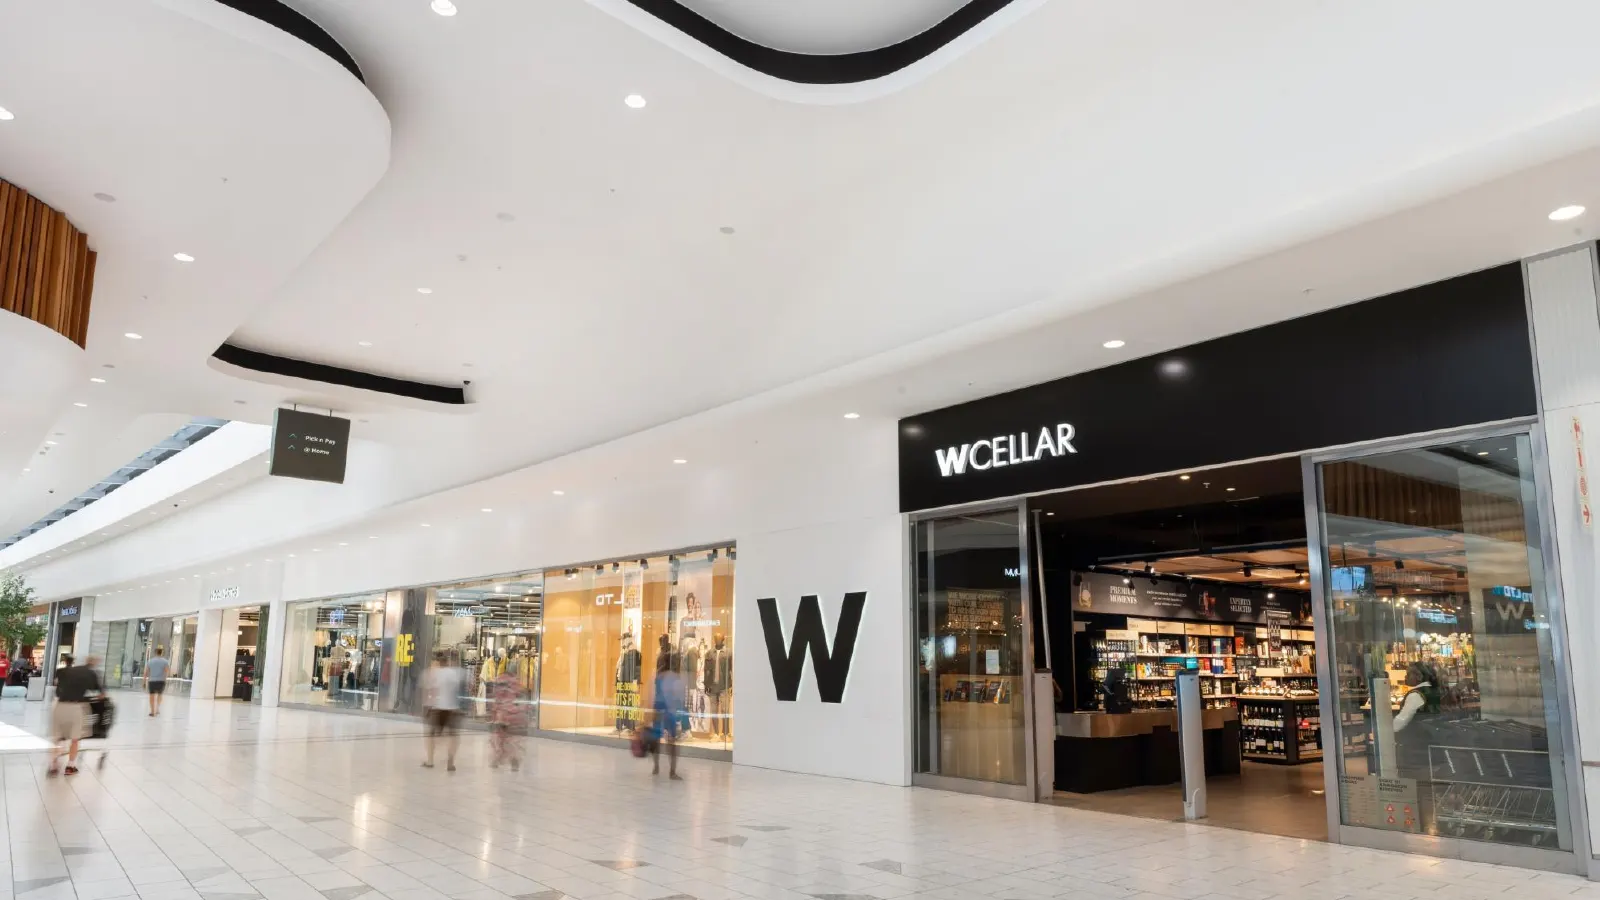
Slide 15
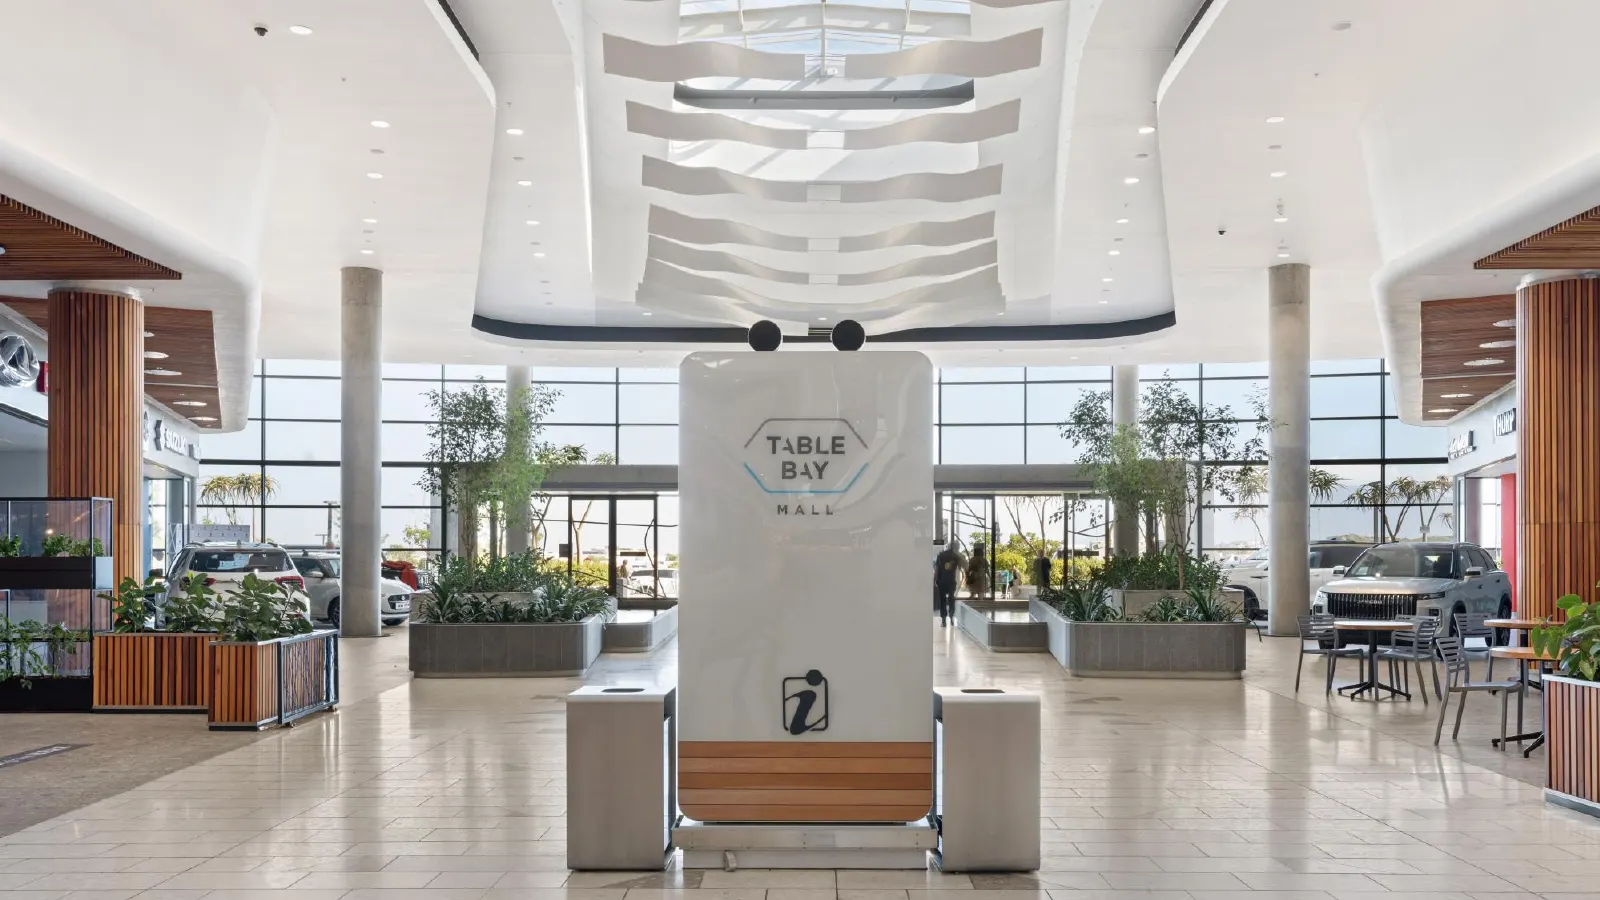
Slide 16
Slide 17
Slide 18: New Stores
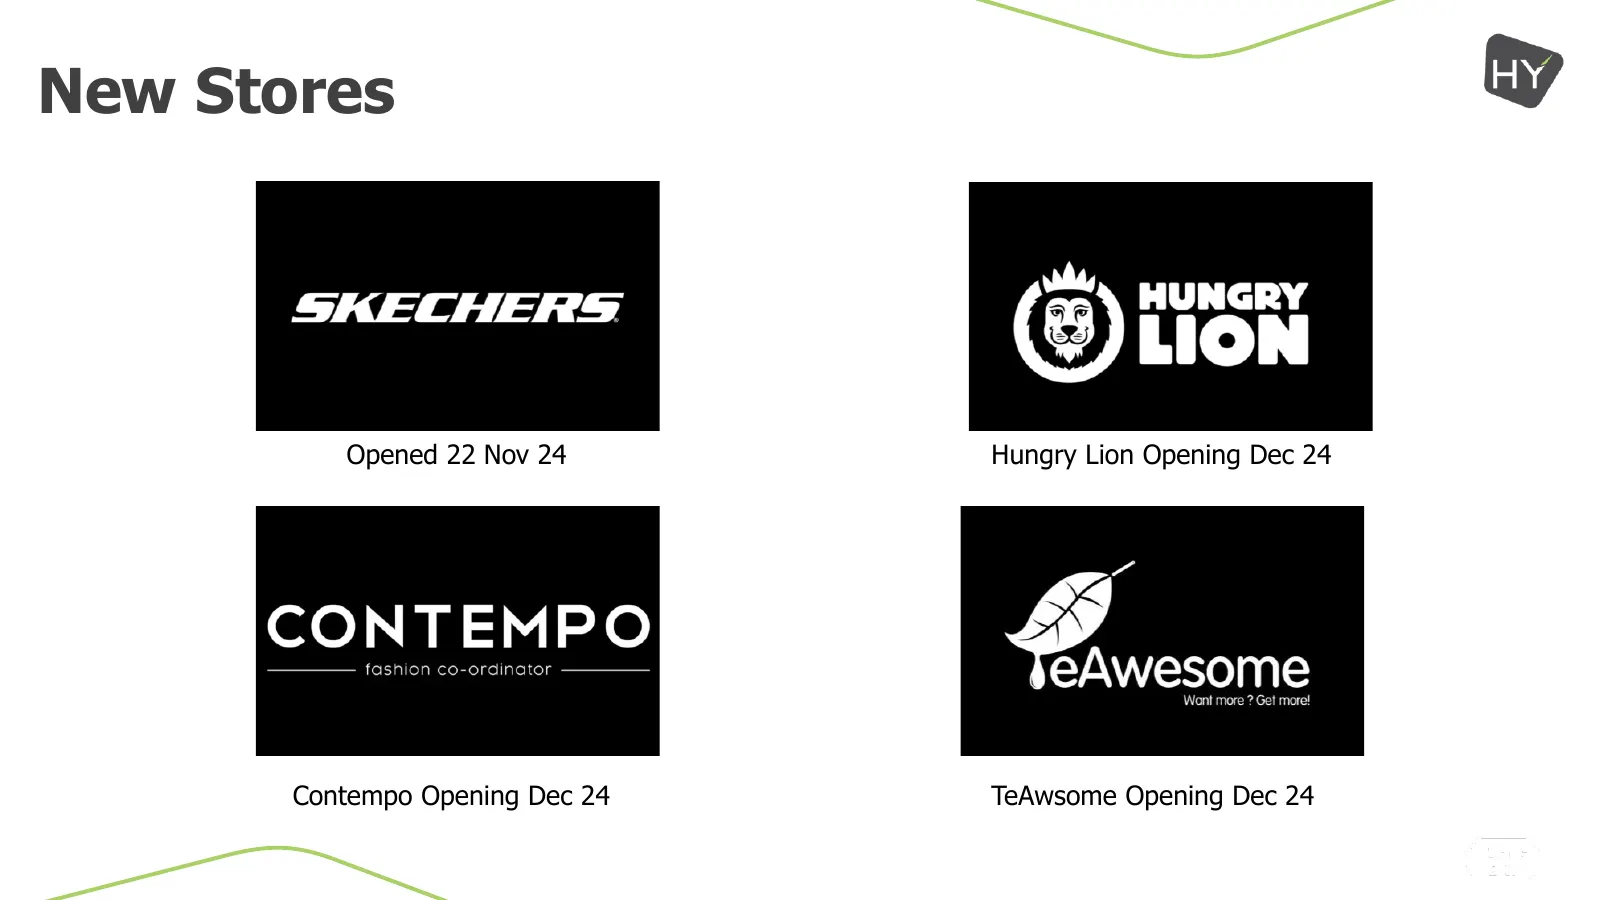
New Stores Opened 22 Nov 24 Hungry Lion Opening Dec 24 Contempo Opening Dec 24 TeAwsome Opening Dec 24
Slide 19: Current Market Condition
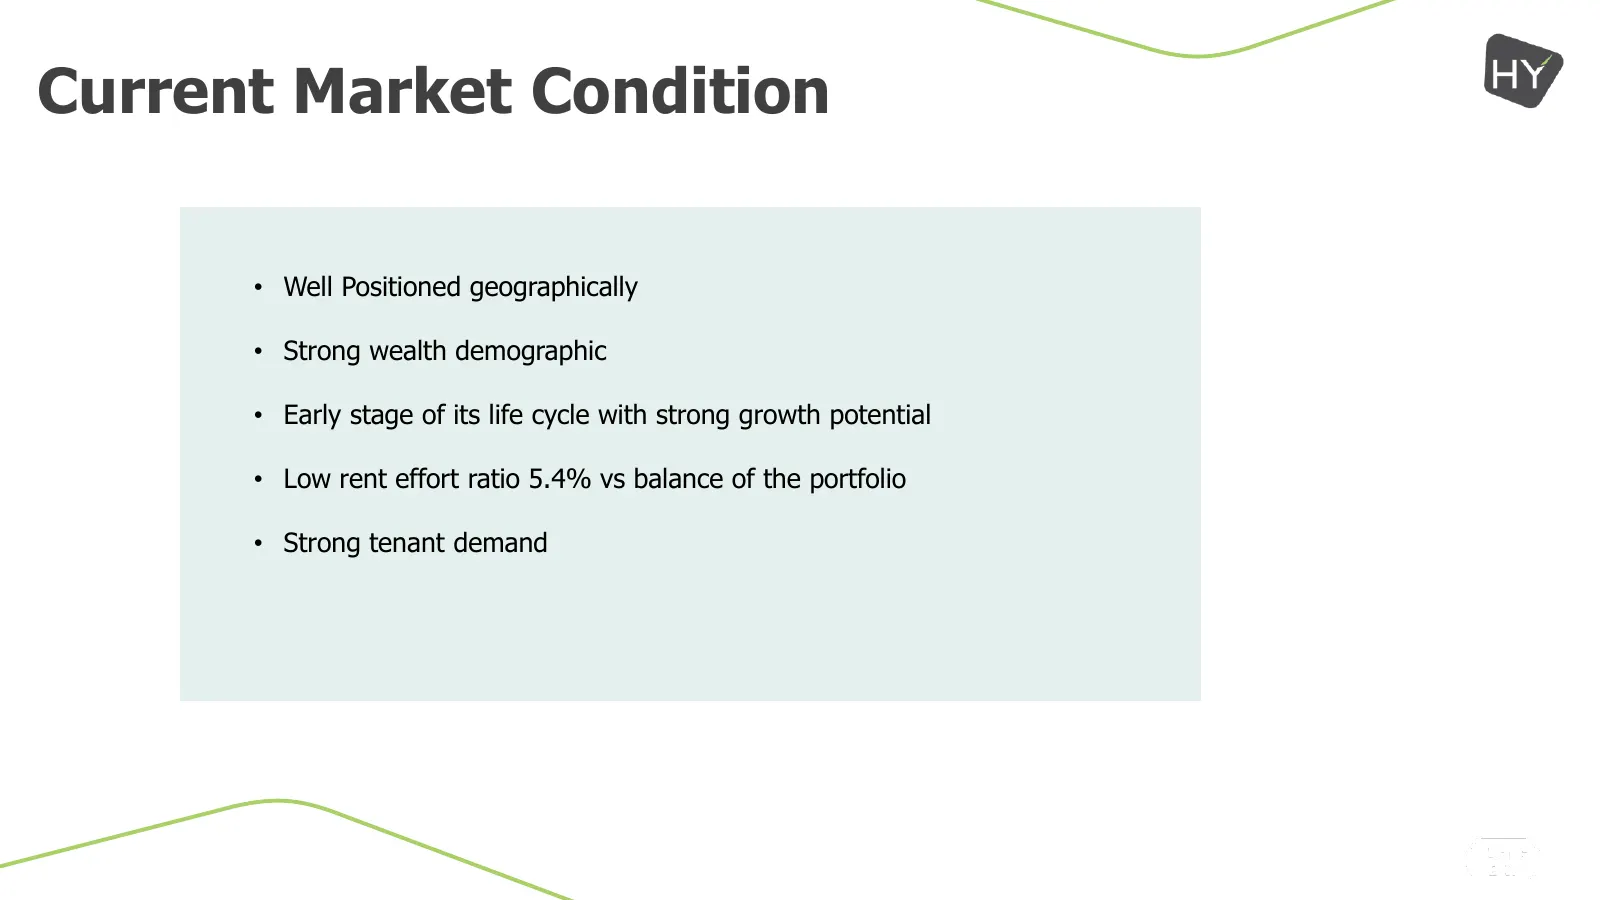
Current Market Condition • Well Positioned geographically • Strong wealth demographic • Early stage of its life cycle with strong growth potential • Low rent effort ratio 5.4% vs balance of the portfolio • Strong tenant demand
Slide 20: Key Operational Performance Metrics
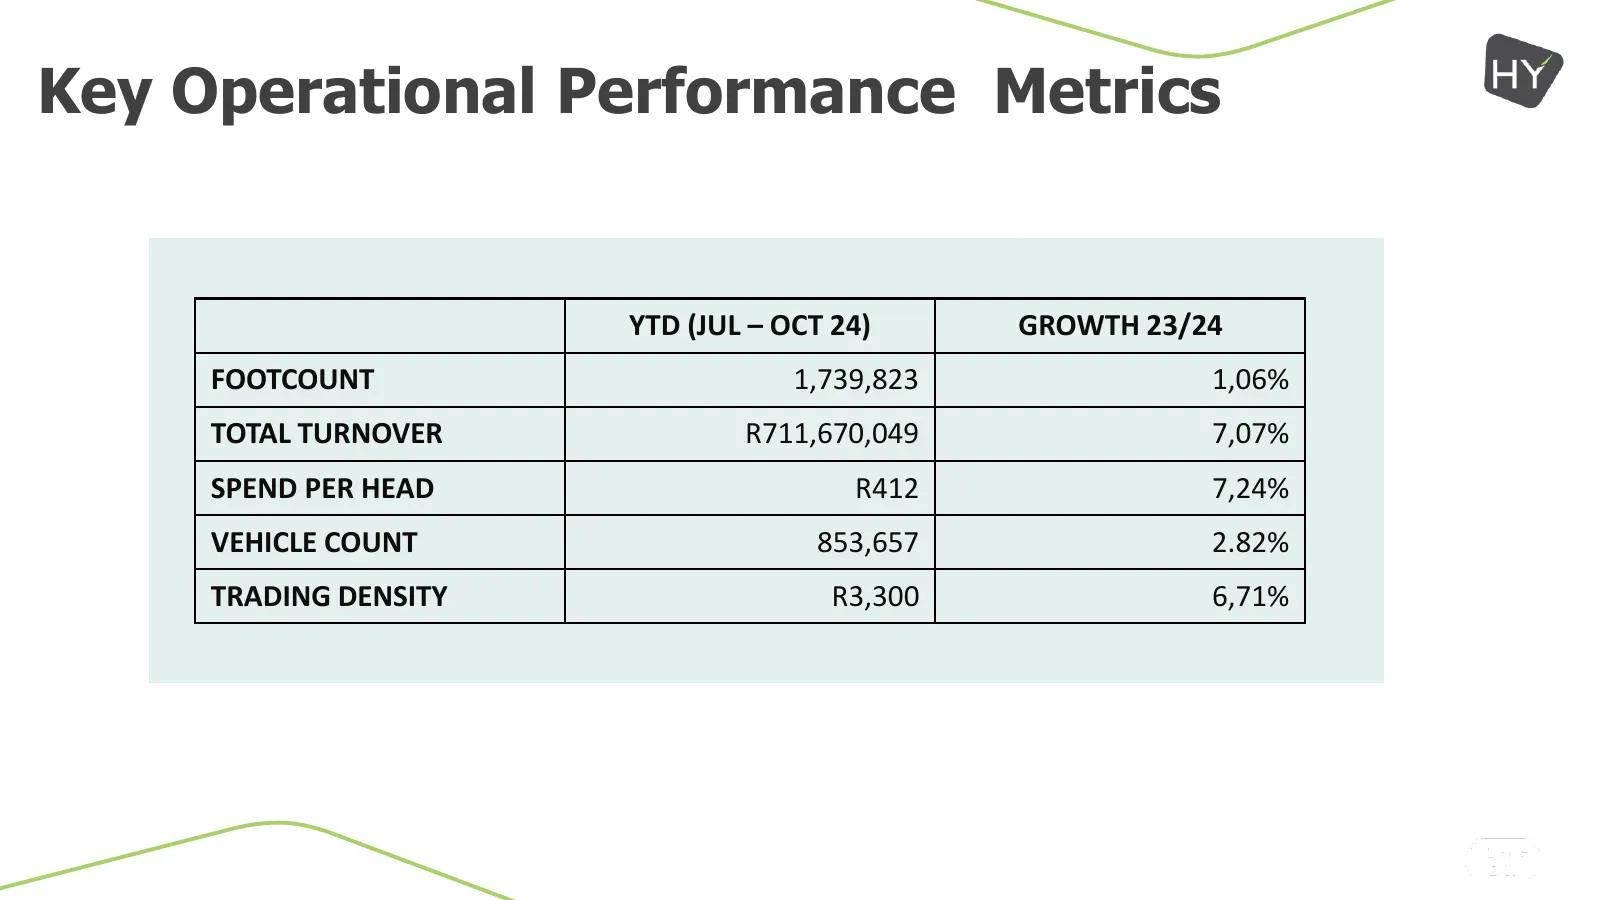
Key Operational Performance Metrics YTD (JUL – OCT 24) GROWTH 23/24 FOOTCOUNT 1,739,823 1,06% TOTAL TURNOVER R711,670,049 7,07% SPEND PER HEAD R412 7,24% VEHICLE COUNT 853,657 2.82% TRADING DENSITY R3,300 6,71%
Slide 21: Key Focus Areas
Key Focus Areas • Generator farm installation ensuring centre can trade fully during power outages • Growing Non-GLA income • Implementation of leasing strategy focusing on: • Entertainment Offering • Enhancing the food journey • Letting of remaining vacant space • Right sizing tenants & enhancing o
Slide 22
Source: company website
More decks from Hyprop Investments Limited
 Corporate Update (June 2026)29 slides · June 2026
 Corporate Update (October 2025)29 slides · October 2025
 Corporate Update (June 2025)29 slides · June 2025
 Corporate Update (December 2024)26 slides · Dec 4, 2024
 Corporate Update (October 2024)84 slides · October 2024
 Corporate Update (October 2024)36 slides · October 2024