Franklin Financial Network Inc
Franklin Financial Network — Q2 2017 Earnings Presentation
16 slides from Franklin Financial Network's earnings presentation, Jul 26, 2017
Slide 1: Second Quarter 2017 Investor Call
Franklin Financial Network, Inc. (NYSE:FSB) Second Quarter 2017 Investor Call July 27, 2017
Slide 2: Forward-Looking Statements
2 Forward - Looking Statements Except for the historical information contained herein, this presentation contains forward - looking statements within the meaning of Section 27A of the Securities Act of 1933, as amended, and Section 21E of the Securities Exchange Act of 1934, as amended. The forward
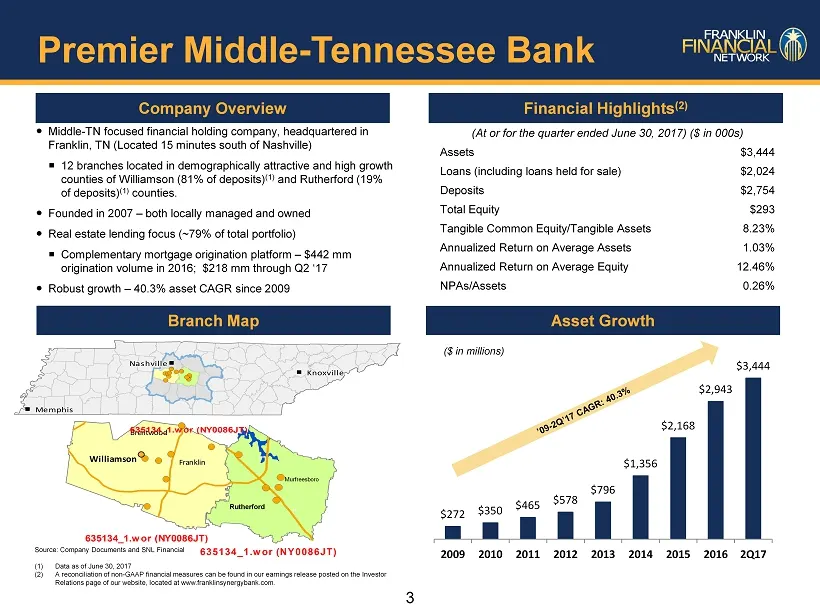
Slide 3: Company Overview and Financial Highlights
3 Company Overview Financial Highlights (2) Source: Company Documents and SNL Financial (1) Data as of June 30, 2017 (2) A reconciliation of non - GAAP financial measures can be found in our earnings release posted on the Investor Relations page of our website, located at www.franklinsynergybank.com
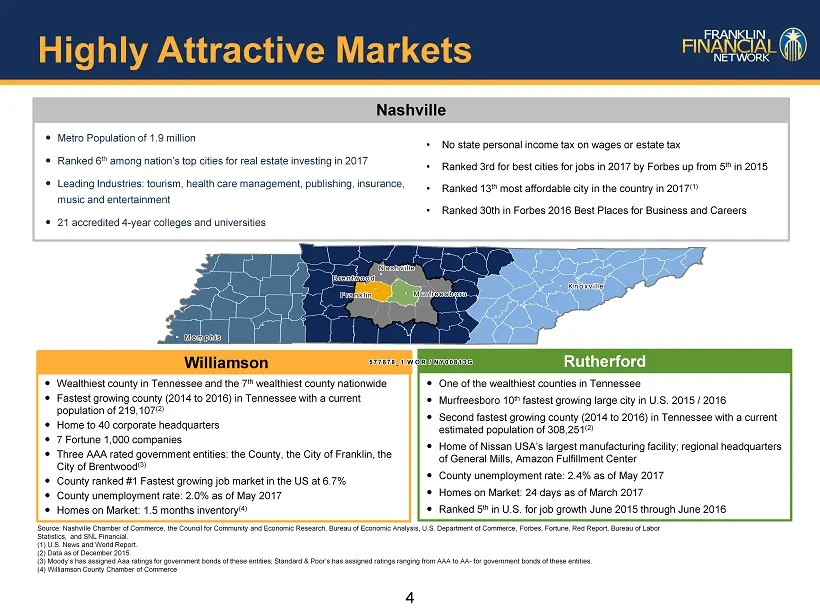
Slide 4: Nashville market overview
4 Ranked 30 th in Forbes 2016 Best Places for Business and Careers Metro Population of 1.9 million Ranked 6 th among nation’s top cities for real estate investing in 2017 Leading Industries: tourism, health care management, publishing, insurance, music and entertainment 21 accredited 4 - yea
Slide 5: Second Quarter Highlights
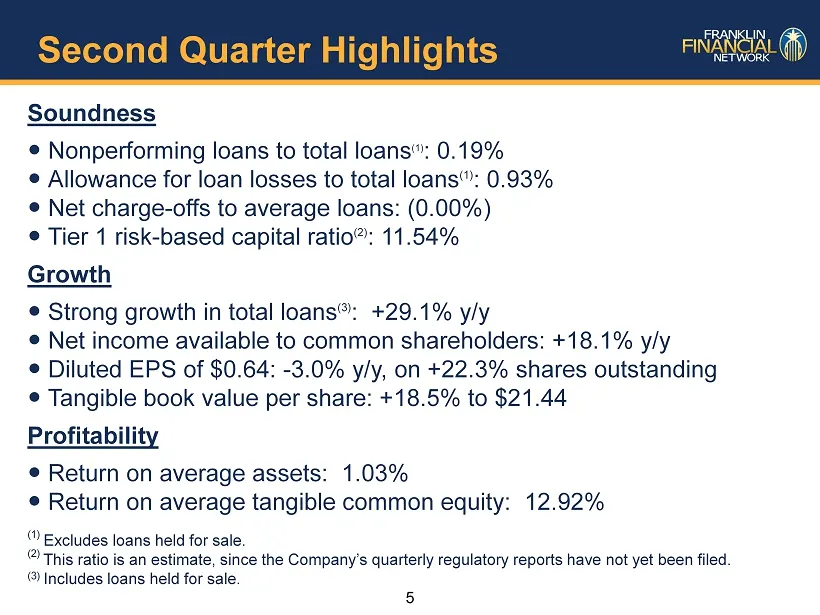
5 Second Quarter Highlights Soundness Nonperforming loans to total loans (1) : 0.19% Allowance for loan losses to total loans (1) : 0.93% Net charge - offs to average loans: (0.00%) Tier 1 risk - based capital ratio (2 ) : 11.54% Growth Strong growth in total loans (3) : +29.1% y/y Net i
Slide 6: Second Quarter Financial Summary
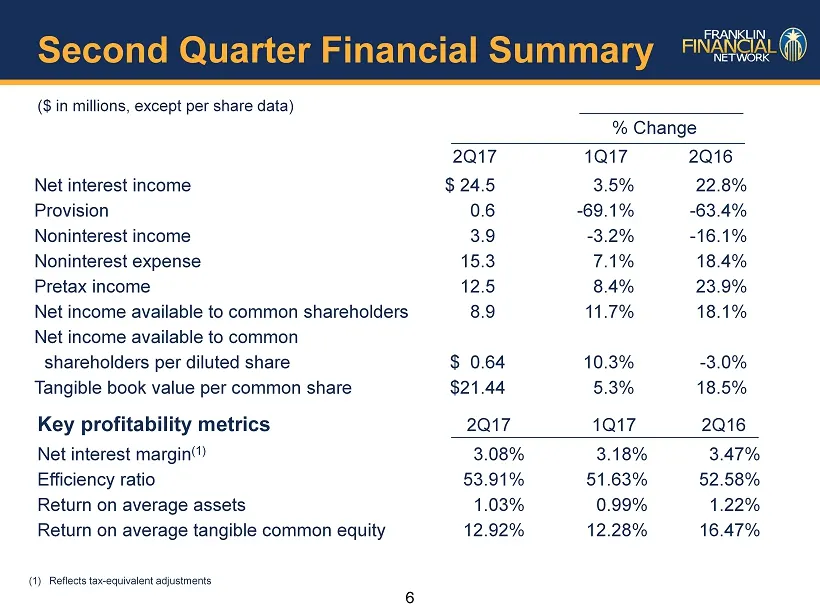
6 Second Quarter Financial Summary ($ in millions, except per share data) % Change 2Q17 1Q17 2Q16 Net interest income $ 24.5 3.5% 22.8% Provision 0.6 - 69.1% - 63.4% Noninterest income 3.9 - 3.2% - 16.1% Noninterest expense 15.3 7.1% 18.4% Pretax income 12.5 8.4% 23.9% Net income available to common
Slide 7: Key Metric – Asset Quality: NPLs to Total Loans and Texas Ratio
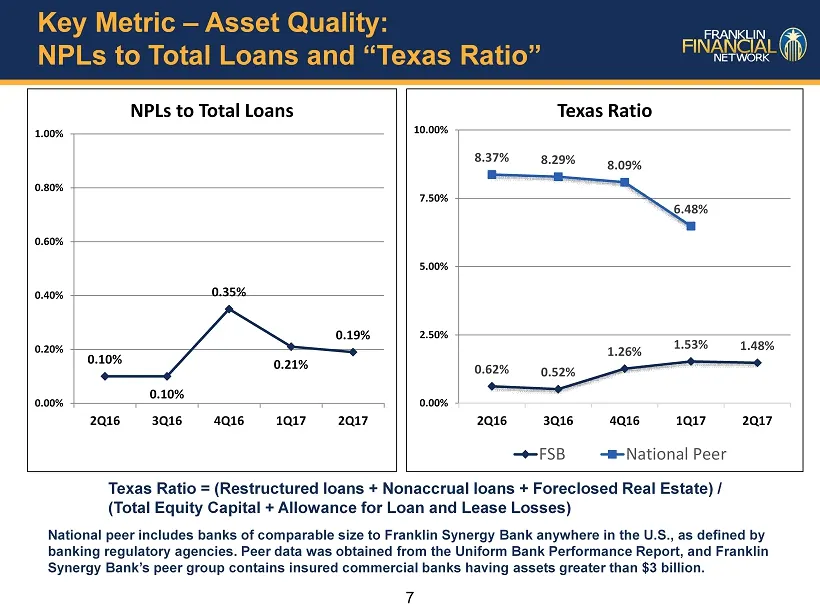
7 Key Metric – Asset Quality: NPLs to Total Loans and “Texas Ratio” 0.10% 0.10% 0.35% 0.21% 0.19% 0.00% 0.20% 0.40% 0.60% 0.80% 1.00% 2Q16 3Q16 4Q16 1Q17 2Q17 NPLs to Total Loans Texas Ratio = (Restructured loans + Nonaccrual loans + Foreclosed Real Estate) / (Total Equity Capital + Allowance for Lo
Slide 8: Key Metric - Asset Quality: Primary Measures
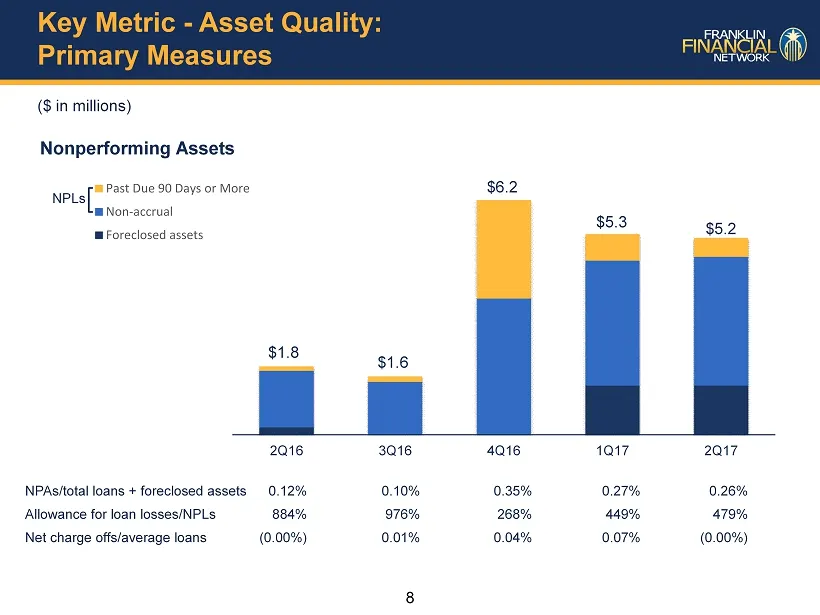
8 Key Metric - Asset Quality: Primary Measures ($ in millions) Nonperforming Assets NPAs/total loans + foreclosed assets 0.12% 0.10% 0.35% 0.27% 0.26% Allowance for loan losses/NPLs 884 % 976% 268% 449% 479 % Net charge offs/average loans (0.00%) 0.01% 0.04% 0.07% (0.00%) 2Q16 3Q16 4Q16 1Q17 2Q17 Pa
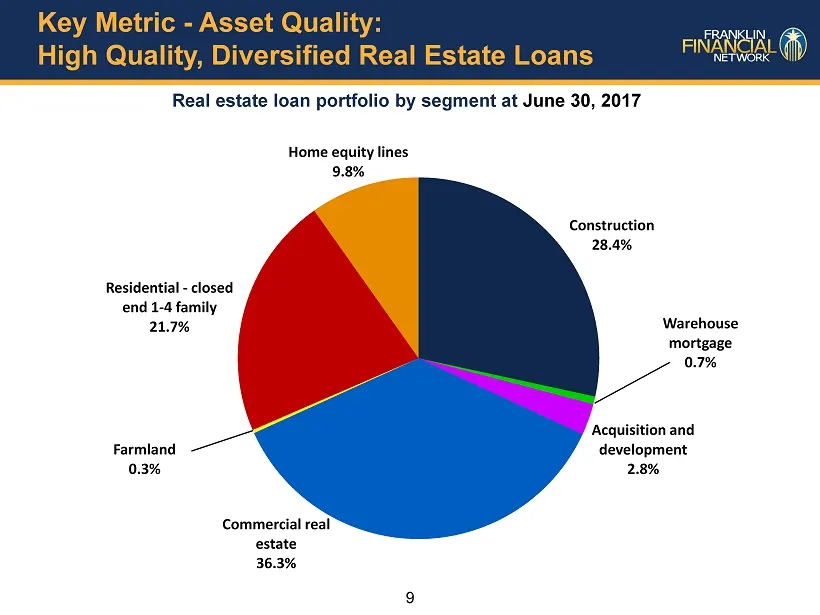
Slide 9: Key Metric - Asset Quality: High Quality, Diversified Real Estate Loans
9 Key Metric - Asset Quality: High Quality, Diversified Real Estate Loans Real estate loan portfolio by segment at June 30, 2017 Construction 28.4% Warehouse mortgage 0.7% Acquisition and development 2.8% Commercial real estate 36.3% Farmland 0.3% Residential - closed end 1 - 4 family 21.7% Home equ
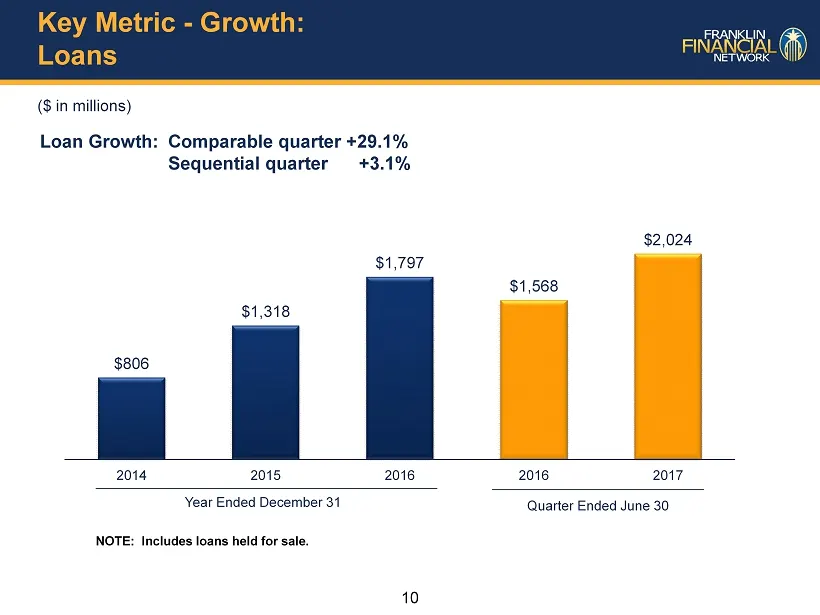
Slide 10: Key Metric - Growth: Loans
10 Key Metric - Growth: Loans ($ in millions) Loan Growth: Comparable quarter +29.1% Sequential quarter +3.1% $806 $1,318 $1,797 $1,568 $2,024 2014 2015 2016 2016 2017 Year Ended December 31 Quarter Ended June 30 NOTE: Includes loans held for sale.
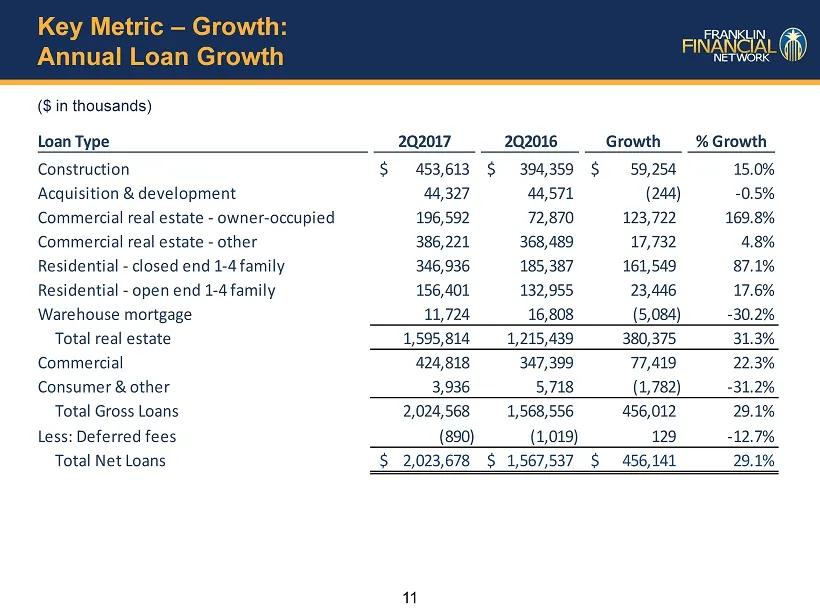
Slide 11: Key Metric – Growth: Annual Loan Growth
11 Key Metric – Growth: Annual Loan Growth Loan Type 2Q2017 2Q2016 Growth % Growth Construction 453,613$ 394,359$ 59,254$ 15.0% Acquisition & development 44,327 44,571 (244) -0.5% Commercial real estate - owner-occupied 196,592 72,870 123,722 169.8% Commercial real estate - other 386,221 368,489 17,
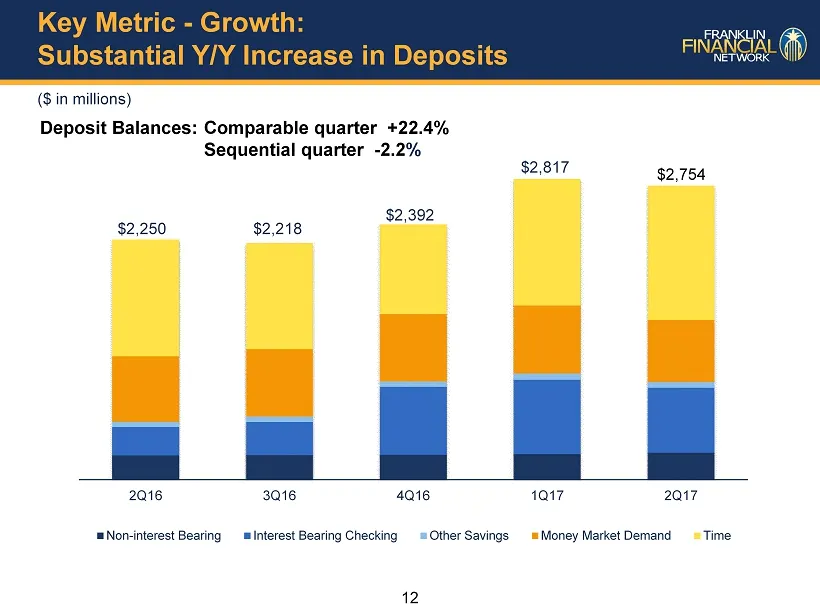
Slide 12: Key Metric - Growth: Substantial Y/Y Increase in Deposits
12 Key Metric - Growth: Substantial Y/Y Increase in Deposits ($ in millions) Deposit Balances: Comparable quarter +22.4% Sequential quarter - 2.2 % 2Q16 3Q16 4Q16 1Q17 2Q17 Non-interest Bearing Interest Bearing Checking Other Savings Money Market Demand Time $2,392 $2,250 $2,218 $2,817 $ 2,754
Slide 13: Key Metric – Profitability: Relatively Stable Net Interest Margin
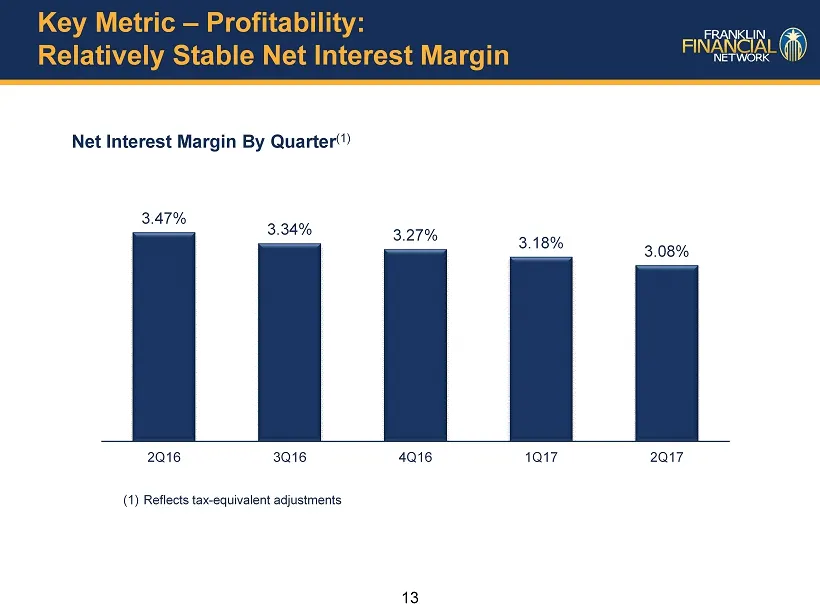
13 Key Metric – Profitability: Relatively Stable Net Interest Margin Net Interest Margin By Quarter (1) 3.47% 3.34% 3.27% 3.18% 3.08% 2Q16 3Q16 4Q16 1Q17 2Q17 (1) Reflects tax - equivalent adjustments
Slide 14: Key Metric – Profitability: Noninterest Income
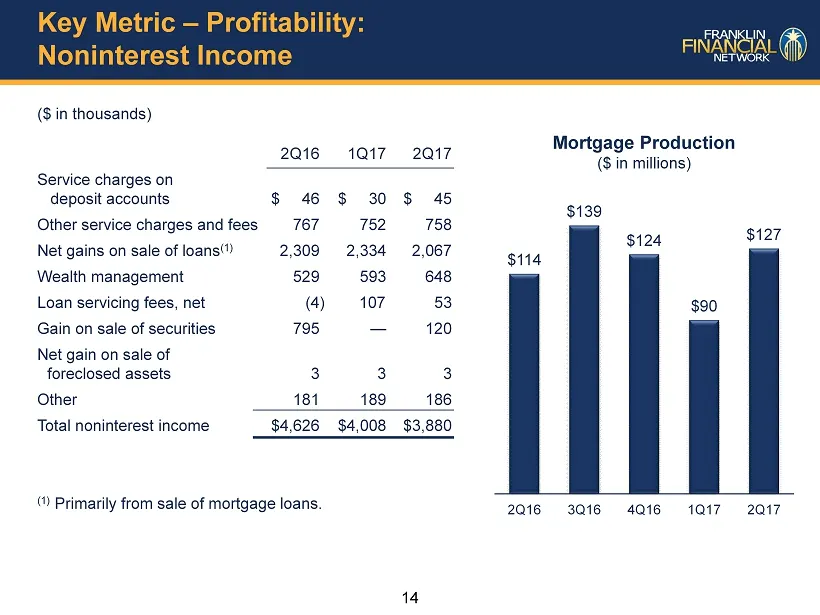
14 Key Metric – Profitability: Noninterest Income ($ in thousands) 2Q16 1Q17 2Q17 Service charges on deposit accounts $ 46 $ 30 $ 45 Other service charges and fees 767 752 758 Net gains on sale of loans (1) 2,309 2,334 2,067 Wealth management 529 593 648 Loan servicing fees, net (4 ) 107 53 Gain on
Slide 15: Key Metric – Profitability: Noninterest Expense and Economies of Scale
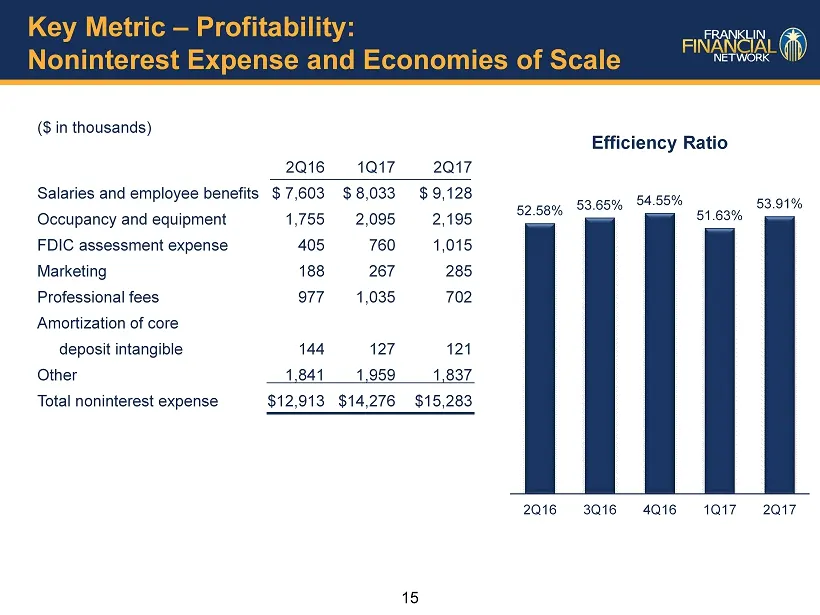
15 Key Metric – Profitability: Noninterest Expense and Economies of Scale ($ in thousands) 2Q16 1Q17 2Q17 Salaries and employee benefits $ 7,603 $ 8,033 $ 9,128 Occupancy and equipment 1,755 2,095 2,195 FDIC assessment expense 405 760 1,015 Marketing 188 267 285 Professional fees 977 1,035 702 Amort
Slide 16: Key Elements of FSB Performance
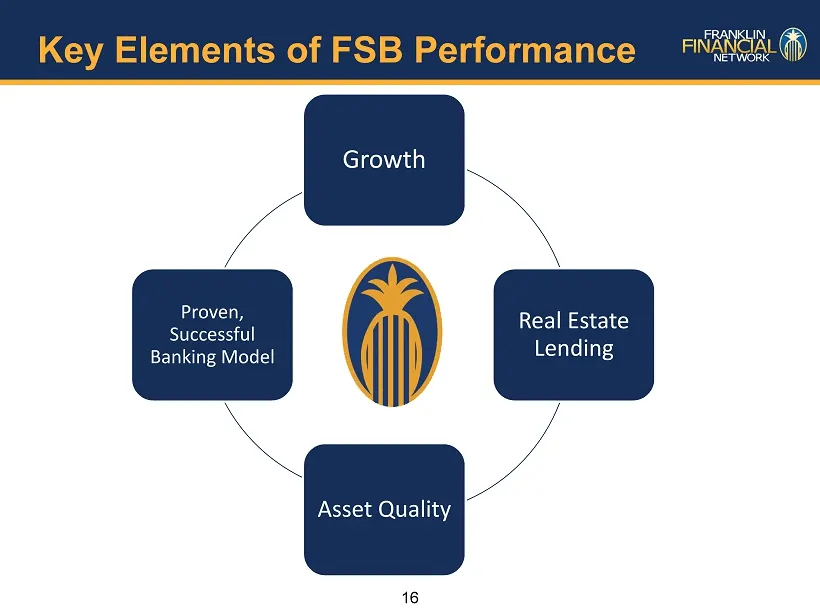
16 Key Elements of FSB Performance Growth Real Estate Lending Asset Quality Proven, Successful Banking Model
Source: SEC EDGAR · 8-K filed Jul 26, 2017
More decks from Franklin Financial Network Inc
 Merger or Acquisition (January 2020)17 slides · Jan 21, 2020
 Q3 2019 Earnings Presentation21 slides · Nov 1, 2019
 Q3 2019 Earnings Presentation15 slides · Oct 23, 2019
 Q2 2019 Earnings Presentation19 slides · Jul 26, 2019
 Q2 2019 Earnings Presentation15 slides · Jul 24, 2019
 Q1 2019 Earnings Presentation19 slides · May 10, 2019