EPIQ Systems — Q3 2013 Earnings Presentation
13 slides from EPIQ Systems's earnings presentation, Oct 28, 2013

Slide 1: Third Quarter 2013 Earnings Conference Call
EpIQ Third Quarter 2013 Earnings Conference Call October 28, 2013 NASDAQ: EPIQ waww.epiqsystems.com
Slide 2: Forward Looking and Cautionary Statements
Forward Looking and Cautionary Statements SYSTEMS This presentation contains forward-looking statements within the meaning of Section 27A of the Securities a ce i ended, and Section 21E of the Securities Exchange Act of ie as amended, which include, but are lie limited to, any ectation of ni F other
Slide 3: Use of non-GAAP Measures
Use of non-GAAP Measures ec SYSTEMS & amortization of acquisition intangibles, share-based compensation, acquisition and related expense, one-time eau roto ogy expense, loan fee amortization, litigation expense, timing of recognition of expense, toluariaeon tay), (ii) Aw GAAP 2 adjusted EBITDA (net
Slide 4: Q3 Highlights
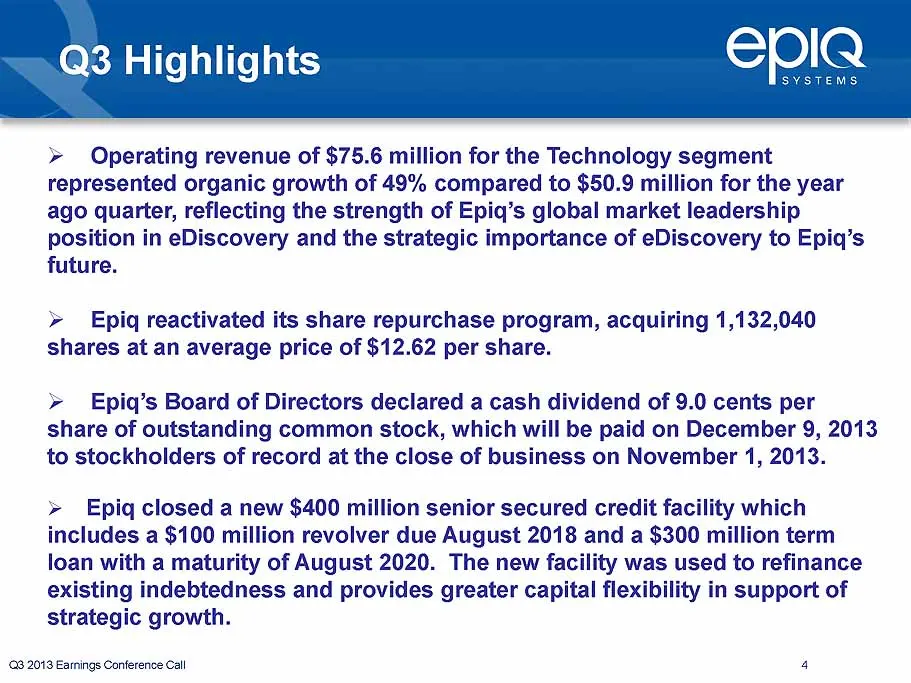
Q3 Highlights EplQ $ illion for the Technology ‘segment th of 499 p anes reflecting the erati of E poston in eDiscovery and the strategic importance of eDiscovery to Epiq’s fut for the e year Epiq reactivated its sh acquiring 1,132,040 shares at an average price of $12. 62 per share. > Epiq’s Board
Slide 5: Financial Results
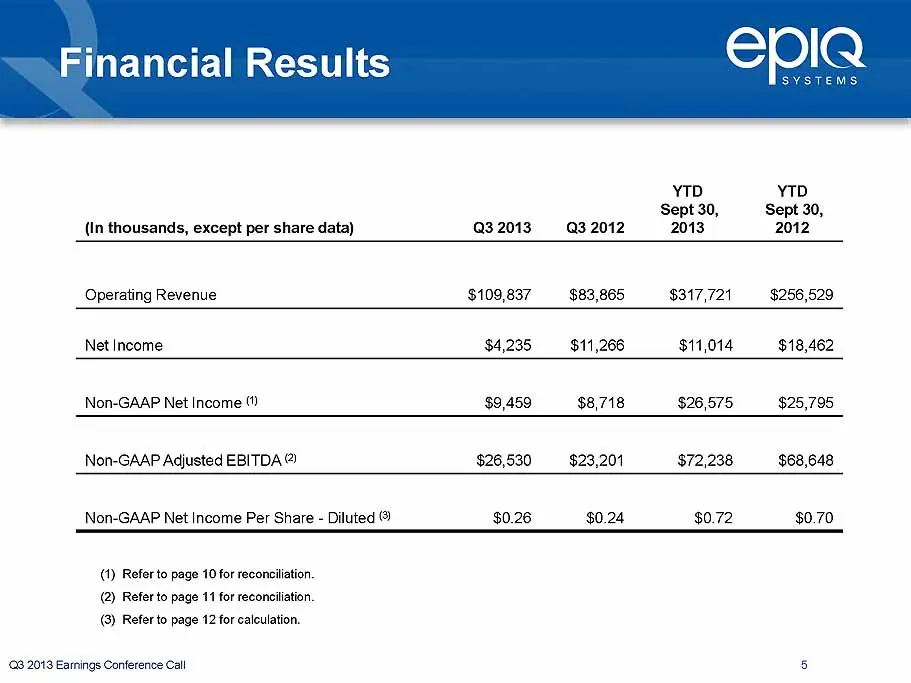
Financial Results EpPIQ YTD YTD Sept30, Sept 30, (In thousand: Q3 2013 Q3 2012 2013 2012 Operating Revenue $109,837 $83,865 $317,721 $256,529 Net Income $4,235 $11,266 $11,014 $18,462 Non-GAAP Net income (1 $9,459 $8,718 $26,575 $25,795 Non-GAAP Adjusted EBITDA ® $26,530 $23,201 $72,238 $68,648 N Di
Slide 6: Selected Balance Sheet Data
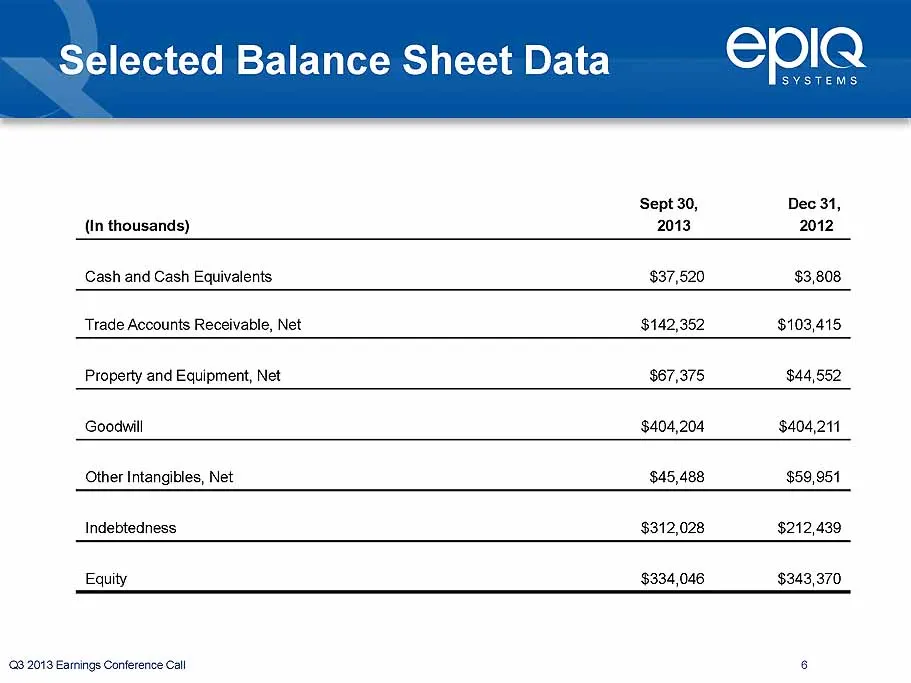
Selected Balance Sheet Data Epla Sept 30, Dec 31, (in thousands) 2013 2012 $37,520 $3,808 Ne $142,352 $103,415 $67,375 $44,552 Goodwill $404,204 $404,211 Other Intangibles, Net $45,488 $59,951 Indebtedness $312,028 $212,439 Equity $334,046 $343,370 (28 2018 Earnings Conference Call 6
Slide 7: Cash from Operating Activities
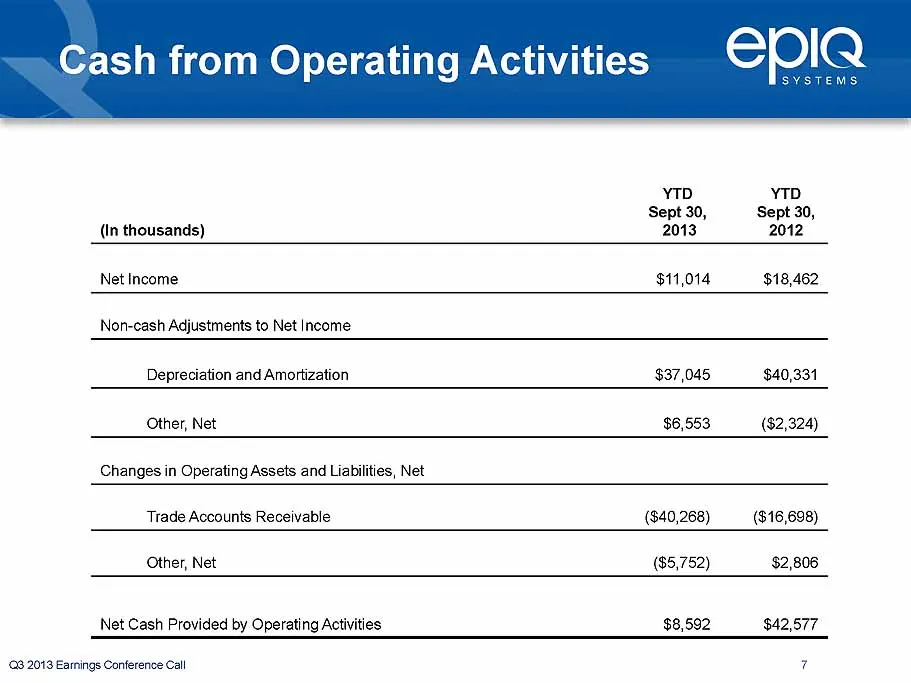
Cash from Operating Activities Epla YTD YTD Sept 30, Sept 30, (In thousands) 2013 2012 Net Income $11,014 $18,462 $37,045 $40,331 Other, Net $6,553 (82,324) N ($40,268) ($16,698) Other, Net (85,752) $2,806 $8,502 $42,577 (28 2018 Earnings Conference Call 7
Slide 8: Operating Revenue
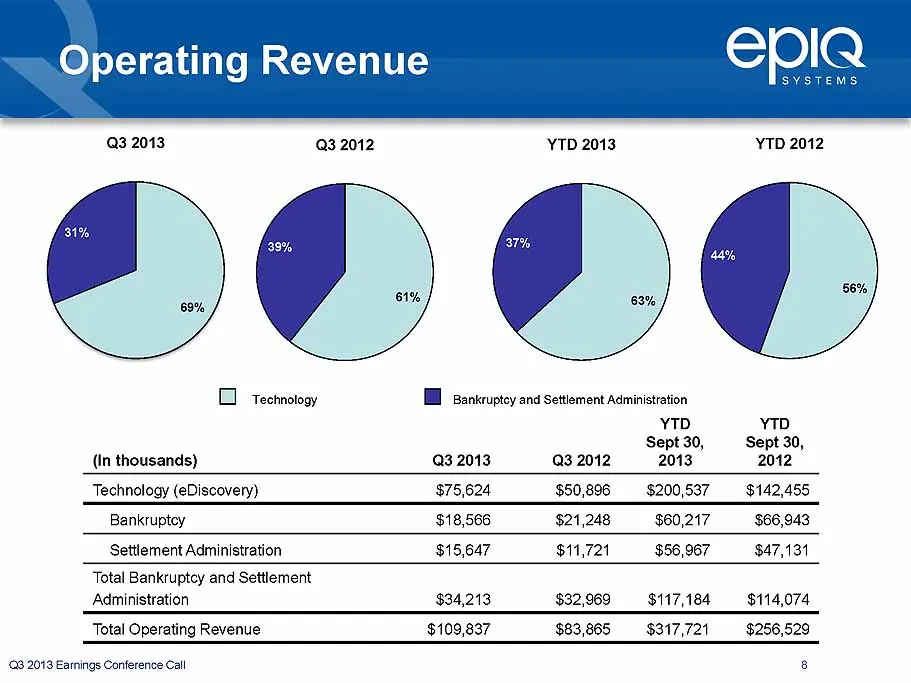
Operating Revenue Epla Q3 2013 Q3 2012 YTD 2013 YTD 2012 L. Technology Th Bankruptcy and Settiement Administration yTD Sept 30, Sept 30, (In thousands) Q3 2013 Q3 2012 2013 2012 Technology (eDiscovery) $75,624 $50,896 $200,537 __- $142,455 Bankruptoy $18,566 $21,248 $60,217 $66,943 $15,647 $11,721 $
Slide 9: Non-GAAP Adjusted EBITDA
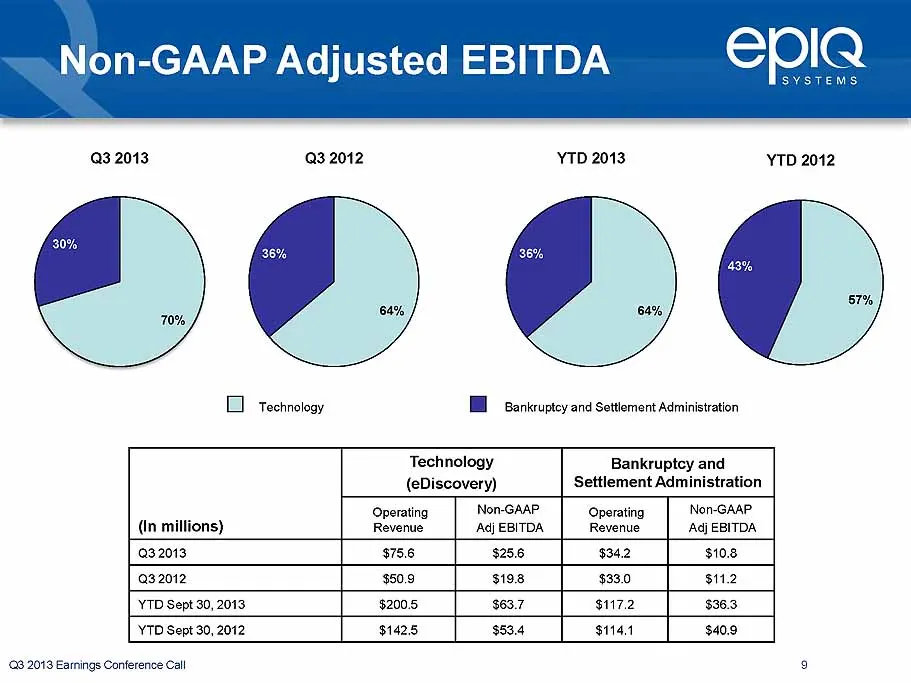
Non-GAAP Adjusted EBITDA Q3 2013 Q3 2012 D1 technotoay YTD 2013 TH Bankruptcy and Settlement Administration Technology Bankruptcy and (eDiscovery) Settlement Administration - Operating Non-GAAP Operating Non-GAAP (In millions) Revenue Adj EBITDA Revenue Adj EBITDA Q3 2013 $75.6 $25.6 $34.2 03.2012 3
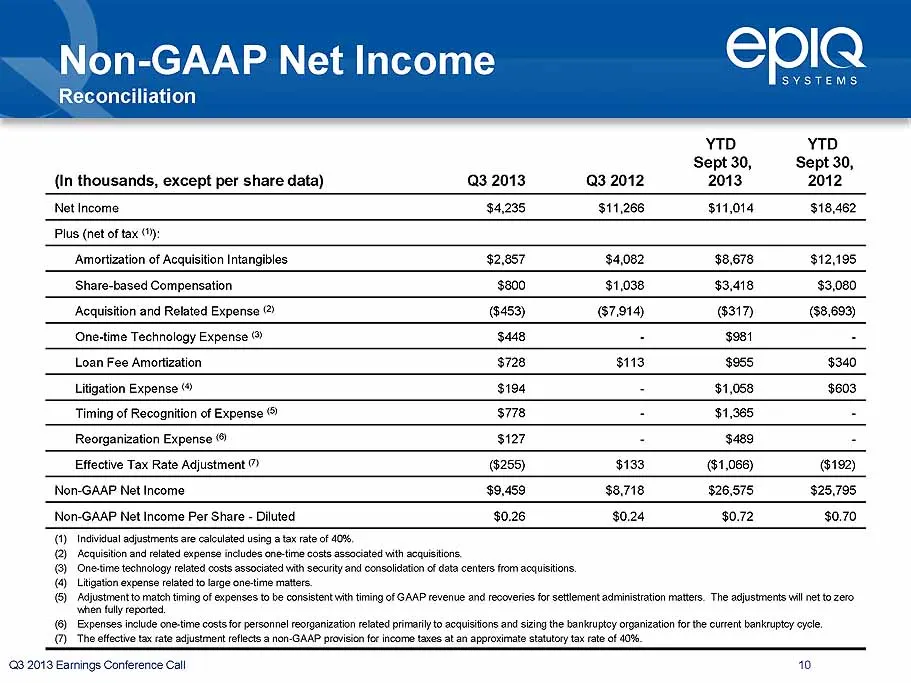
Slide 10: Non-GAAP Net Income
Non-GAAP Net Income SYSTEMS Reconcilia' YTD YTD Sept30, Sept 30, (In thousands, except per share data) Q3 2013 Q3 2012 2013 2012 Net Income $4,235 $11,266 $11,014 $16,462 Plus (net of tax () tizatic isit $2,857 $4,082 $8,678 $12,195 ‘Share-based Compensation $800 $1,038 $3,418 ‘ tion and Related Exp
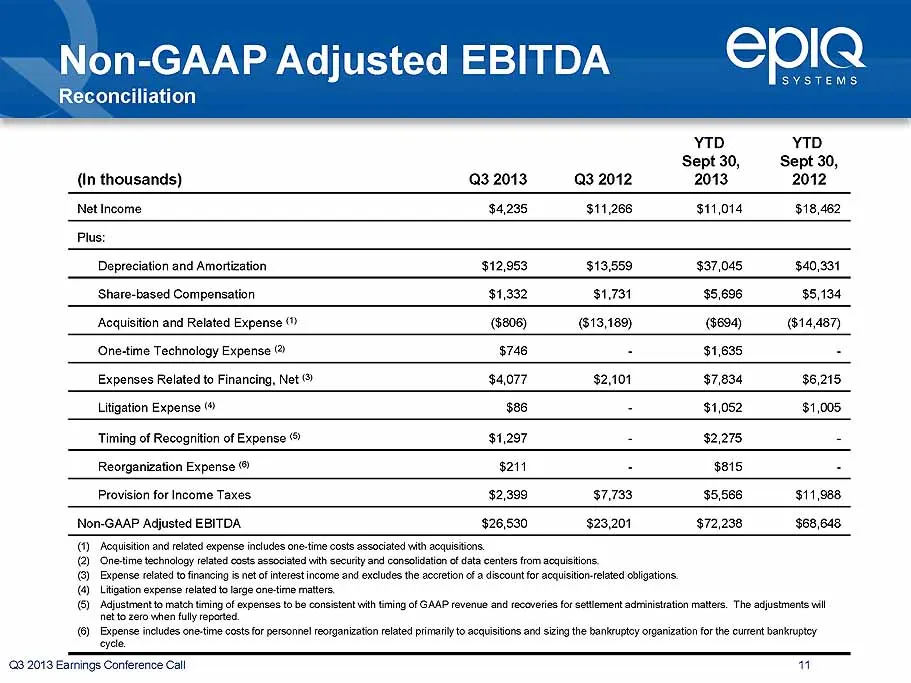
Slide 11: Non-GAAP Adjusted EBITDA
Non-GAAP Adjusted EBITDA EpIQ Reconcilia' YTD YTD Sept30, Sept 30, (In thousands) Q3 2013 Q3 2012 2013 2012 Net Income $4,235 $11,266 $11,014 $18,462 Plus: $12,953 $13,559 $37,045 $40,331 $1,332 $1,731 $5,696 $5,134 ($806) ($13,189) ) (614,487) $746 : $1,636 : $4,077 $2,101 $7,834 $6,215 Litigation
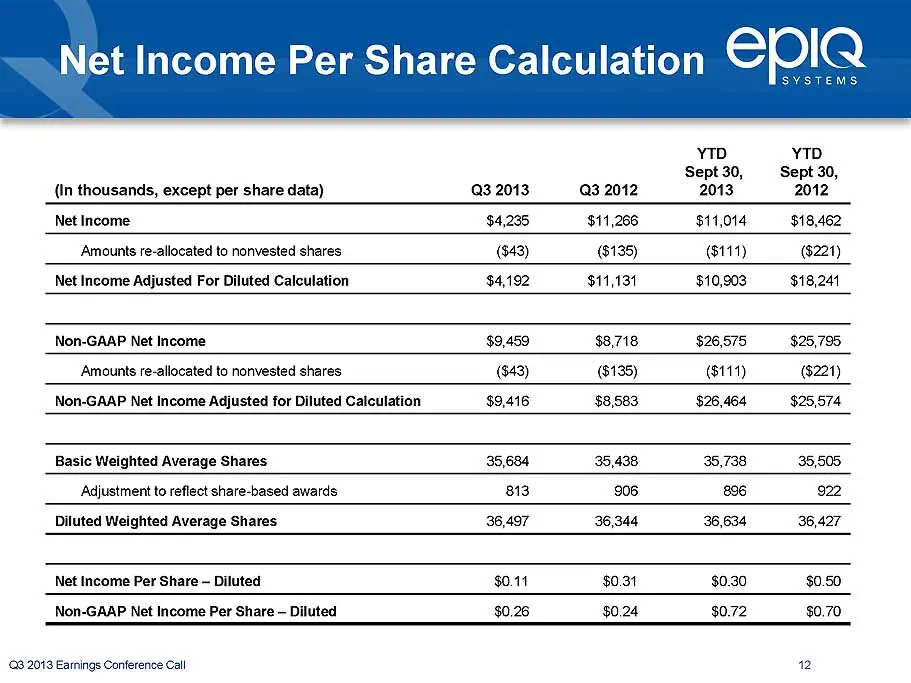
Slide 12: Net Income Per Share Calculation
Net Income Per Share Calculation EplaQ SYSTEMS yu YTD Sept30, Sept 30, {in th 3 2013 Q3 2012 2013 2012 Net Income $4,235 $11,266 $11,014 $18,462 (843) (8135) ($111) ($221) $4,192 $14,131 $10,903 $18,244 Non-GAAP Net Income $9,459 $8,718 $26; 25,7! (843) (6135) (ttt) (221) Non-G. $9,416 $8,583 464 $2

Slide 13: Investor Relations Contact
EpIQ Lew Schroeber Investor Relations (913) 621-9500 IR@epiqsystems.com NASDAQ: EPIQ www.epigsystems.com
Source: SEC EDGAR · 8-K filed Oct 28, 2013
More decks from EPIQ Systems Inc
 Q2 2016 Earnings Presentation12 slides · Aug 9, 2016
 Q1 2016 Earnings Presentation12 slides · May 3, 2016
 FY2015 Earnings Presentation13 slides · Mar 1, 2016
 Q3 2015 Earnings Presentation11 slides · Nov 3, 2015
 Q2 2015 Earnings Presentation11 slides · Aug 3, 2015
 Q1 2015 Earnings Presentation11 slides · Apr 28, 2015