Franklin Financial Network Inc
Franklin Financial Network — Q4 2017 Earnings Presentation
27 slides from Franklin Financial Network's earnings presentation, Jan 24, 2018
Slide 1: Fourth Quarter 2017 Investor Call
Franklin Financial Network, Inc. (NYSE:FSB) Fourth Quarter 2017 Investor Call January 25, 2018
Slide 2: Forward-Looking Statements
2 Forward - Looking Statements Except for the historical information contained herein, this presentation contains forward - looking statements within the meaning of Section 27A of the Securities Act of 1933, as amended, and Section 21E of the Securities Exchange Act of 1934, as amended. The forward
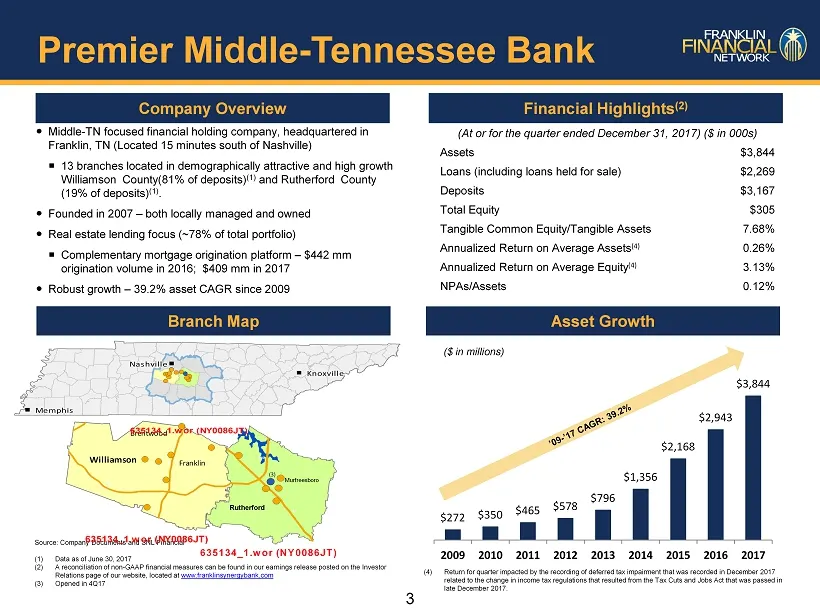
Slide 3: Company Overview and Financial Highlights
3 Company Overview Financial Highlights (2) Source: Company Documents and SNL Financial (1) Data as of June 30, 2017 (2) A reconciliation of non - GAAP financial measures can be found in our earnings release posted on the Investor Relations page of our website, located at www.franklinsynergybank.com
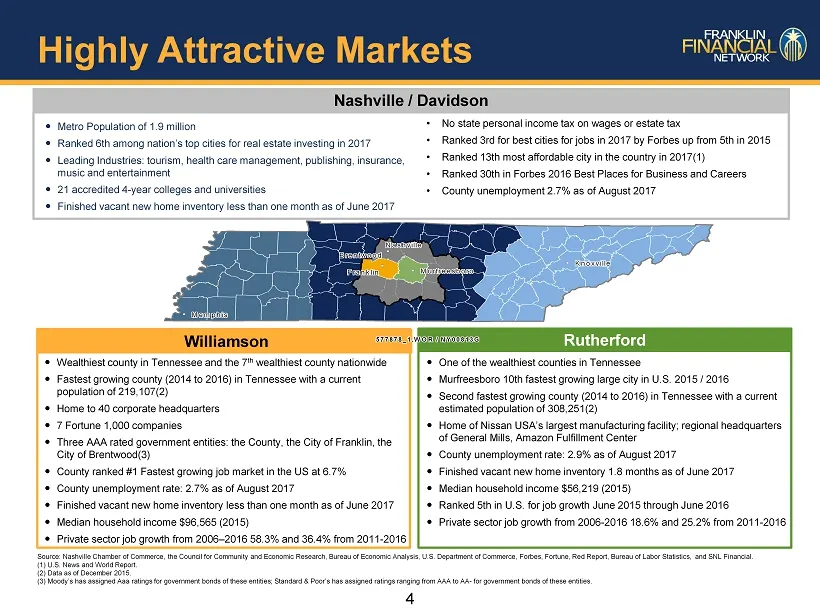
Slide 4: Nashville Market Overview
4 Ranked 30 th in Forbes 2016 Best Places for Business and Careers Metro Population of 1.9 million Ranked 6th among nation’s top cities for real estate investing in 2017 Leading Industries: tourism, health care management, publishing, insurance, music and entertainment 21 accredited 4 - year
Slide 5: Soundness
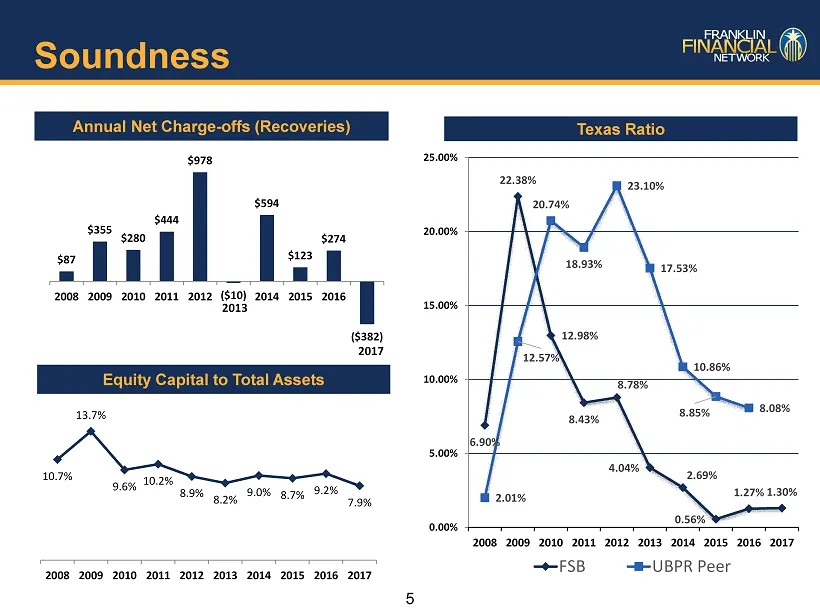
5 Soundness Annual Net Charge - offs (Recoveries) $87 $355 $280 $444 $978 ($10) $594 $123 $274 ($382) 2008 2009 2010 2011 2012 2014 2015 2016 2013 2017 6.90% 22.38% 12.98% 8.43% 8.78% 4.04% 2.69% 0.56% 1.27% 1.30% 2.01% 12.57% 20.74% 18.93% 23.10% 17.53% 10.86% 8.85% 8.08% 0.00% 5.00% 10.00% 15.00%
Slide 6: Growth – Loans, Deposits & Equity
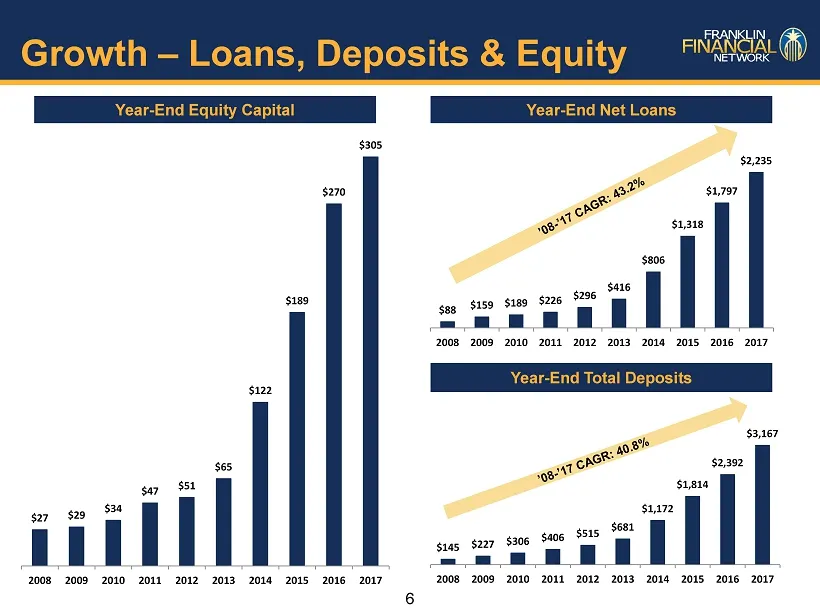
6 Growth – Loans, Deposits & Equity $88 $159 $189 $226 $296 $416 $806 $1,318 $1,797 $2,235 2008 2009 2010 2011 2012 2013 2014 2015 2016 2017 Year - End Total Deposits Year - End Equity Capital $145 $227 $306 $406 $515 $681 $1,172 $1,814 $2,392 $3,167 2008 2009 2010 2011 2012 2013 2014 2015 2016 2017
Slide 7: Market Share
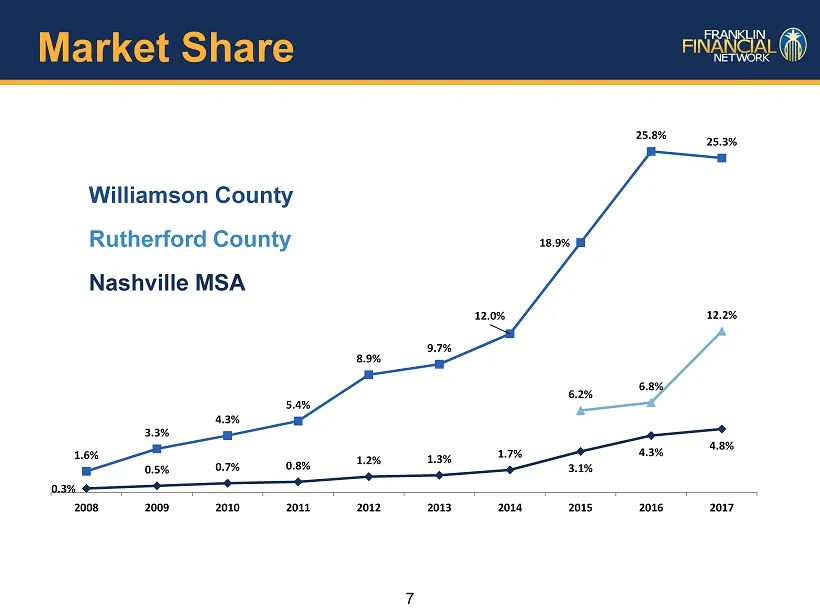
7 Market Share 0.3% 0.5% 0.7% 0.8% 1.2% 1.3% 1.7% 3.1% 4.3% 4.8% 1.6% 3.3% 4.3% 5.4% 8.9% 9.7% 12.0% 18.9% 25.8% 25.3% 6.2% 6.8% 12.2% 2008 2009 2010 2011 2012 2013 2014 2015 2016 2017 Williamson County Rutherford County Nashville MSA
Slide 8: Profitability
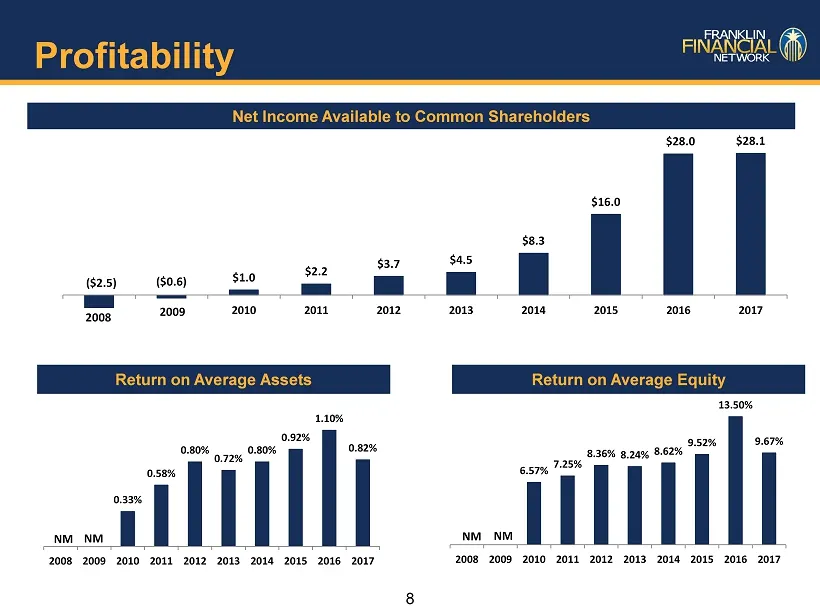
8 Profitability Net Income Available to Common Shareholders ($2.5) ($0.6) $1.0 $2.2 $3.7 $4.5 $8.3 $16.0 $28.0 $28.1 2010 2011 2012 2013 2014 2015 2016 2017 0.33% 0.58% 0.80% 0.72% 0.80% 0.92% 1.10% 0.82% 2008 2009 2010 2011 2012 2013 2014 2015 2016 2017 Return on Average Assets Return on Average Eq
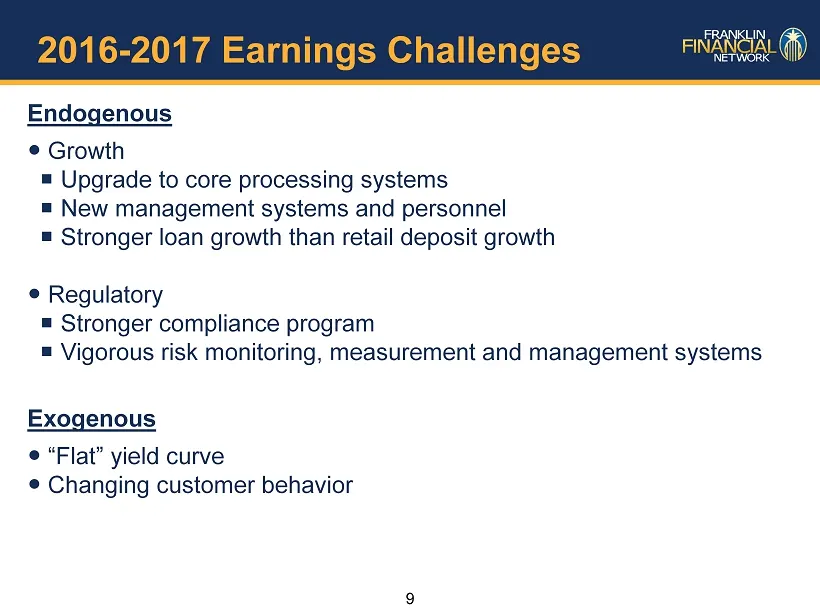
Slide 9: 2016-2017 Earnings Challenges
9 2016 - 2017 Earnings Challenges Endogenous Growth Upgrade to core processing systems New management systems and personnel Stronger loan growth than retail deposit growth Regulatory Stronger compliance program Vigorous risk monitoring, measurement and management systems Exogenous “F
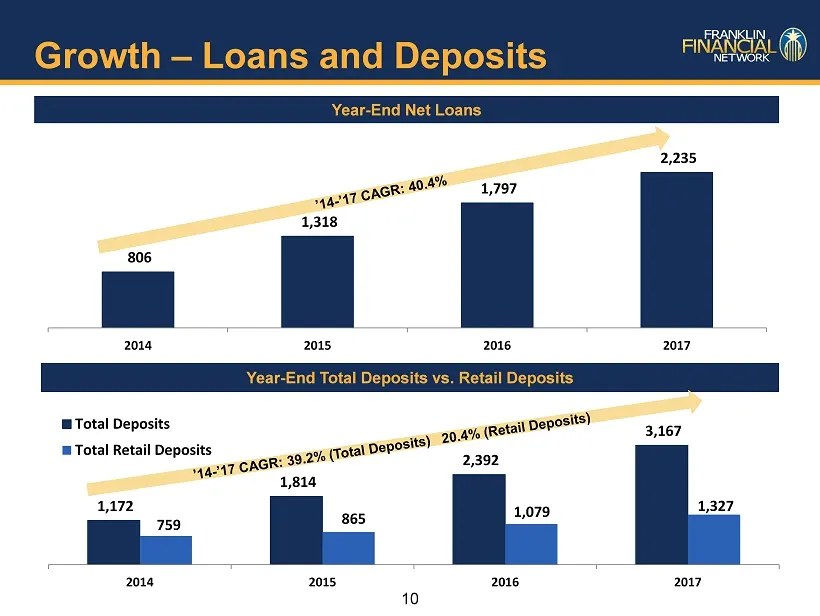
Slide 10: Growth – Loans and Deposits
10 Growth – Loans and Deposits 806 1,318 1,797 2,235 2014 2015 2016 2017 Year - End Total Deposits vs. Retail Deposits Year - End Net Loans 1,172 1,814 2,392 3,167 759 865 1,079 1,327 2014 2015 2016 2017 Total Deposits Total Retail Deposits
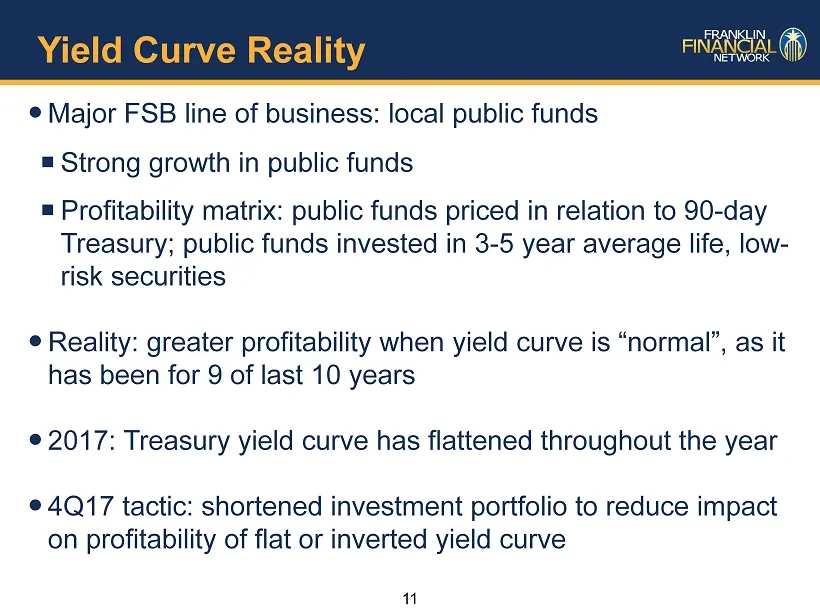
Slide 11: Yield Curve Reality
11 Yield Curve Reality Major FSB line of business: local public funds Strong growth in public funds Profitability matrix: public funds priced in relation to 90 - day Treasury; public funds invested in 3 - 5 year average life, low - risk securities Reality: greater profitability when yield cu
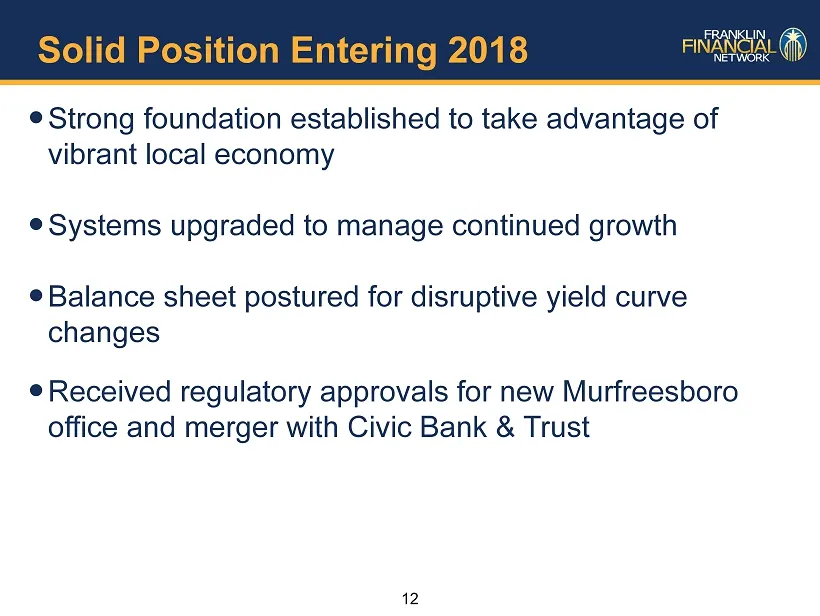
Slide 12: Solid Position Entering 2018
12 Solid Position Entering 2018 Strong foundation established to take advantage of vibrant local economy Systems upgraded to manage continued growth Balance sheet postured for disruptive yield curve changes Received regulatory approvals for new Murfreesboro office and merger with Civic Bank
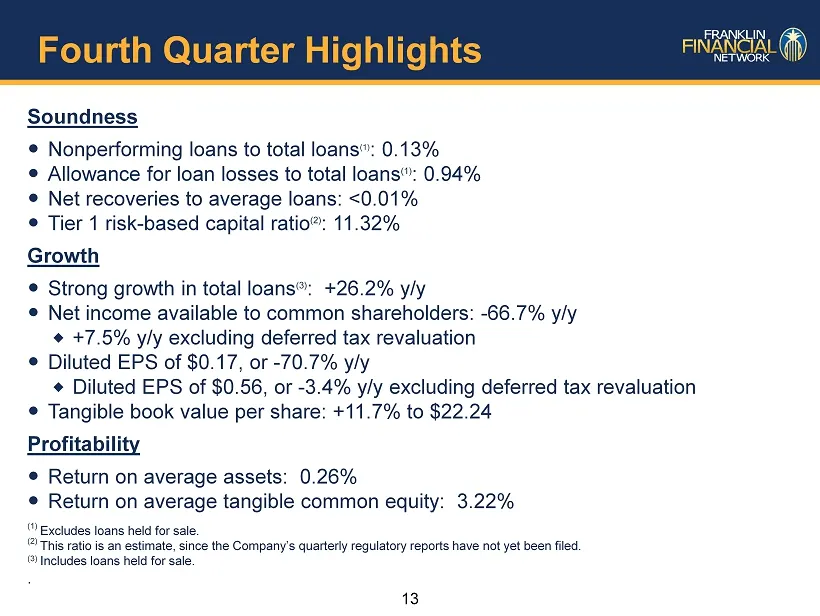
Slide 13: Fourth Quarter Highlights
13 Fourth Quarter Highlights Soundness Nonperforming loans to total loans (1) : 0.13% Allowance for loan losses to total loans (1) : 0.94% Net recoveries to average loans: <0.01% Tier 1 risk - based capital ratio (2 ) : 11.32% Growth Strong growth in total loans (3) : +26.2% y/y Net inco
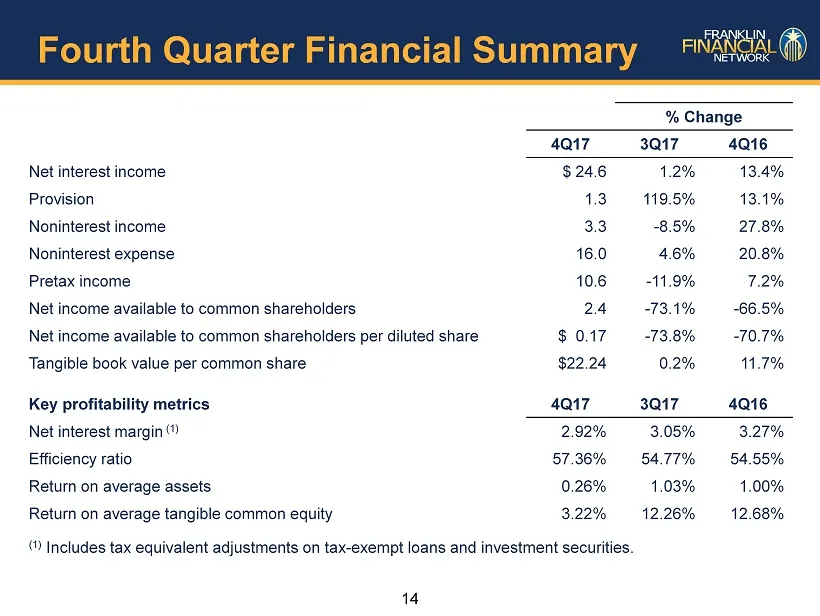
Slide 14: Fourth Quarter Financial Summary
14 Fourth Quarter Financial Summary % Change 4Q17 3Q17 4Q16 Net interest income $ 24.6 1.2% 13.4% Provision 1.3 119.5% 13.1% Noninterest income 3.3 - 8.5% 27.8% Noninterest expense 16.0 4.6% 20.8% Pretax income 10.6 - 11.9% 7.2% Net income available to common shareholders 2.4 - 73.1% - 66.5% Net inc
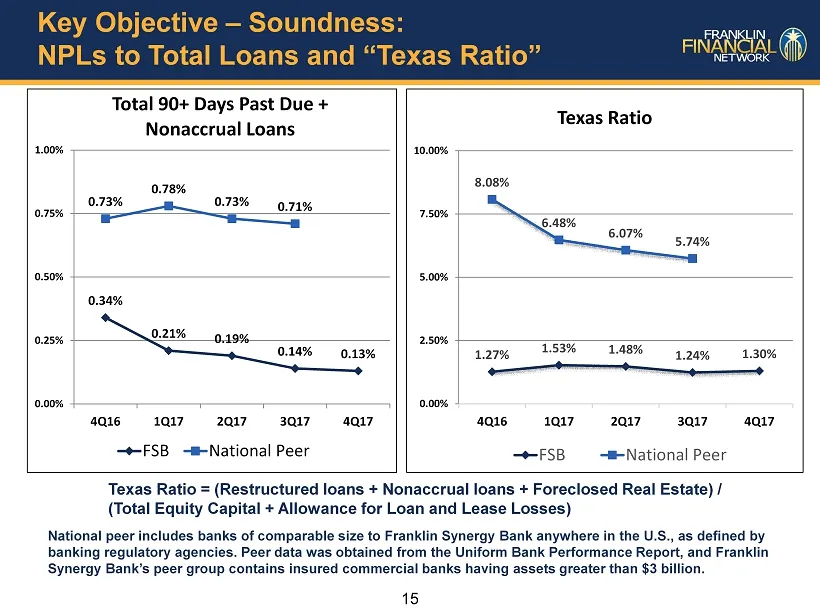
Slide 15: Soundness: NPLs to Total Loans and Texas Ratio
15 Key Objective – Soundness: NPLs to Total Loans and “Texas Ratio” 0.34% 0.21% 0.19% 0.14% 0.13% 0.73% 0.78% 0.73% 0.71% 0.00% 0.25% 0.50% 0.75% 1.00% 4Q16 1Q17 2Q17 3Q17 4Q17 Total 90+ Days Past Due + Nonaccrual Loans FSB National Peer Texas Ratio = (Restructured loans + Nonaccrual loans + Foreclo
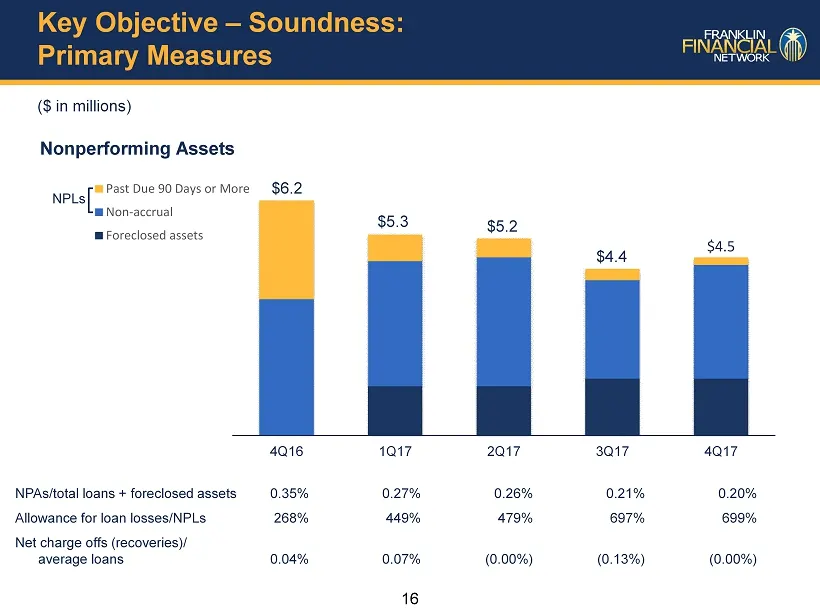
Slide 16: Soundness: Primary Measures
16 Key Objective – Soundness: Primary Measures ($ in millions) Nonperforming Assets 4Q16 1Q17 2Q17 3Q17 4Q17 Past Due 90 Days or More Non-accrual Foreclosed assets $4.5 $6.2 NPLs $4.4 $5.3 $ 5.2 NPAs/total loans + foreclosed assets 0.35% 0.27% 0.26% 0.21% 0.20% Allowance for loan losses/NPLs 268% 44
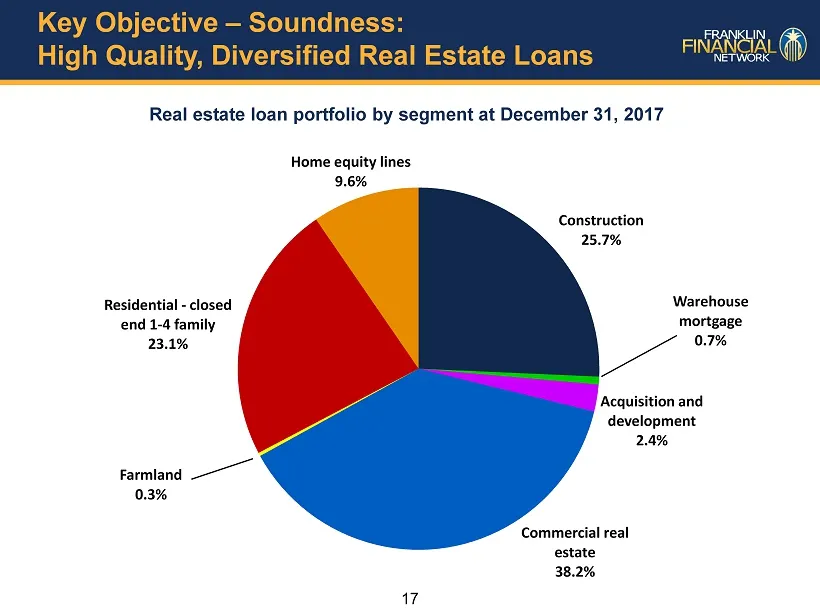
Slide 17: Soundness: High Quality, Diversified Real Estate Loans
17 Key Objective – Soundness: High Quality, Diversified Real Estate Loans Real estate loan portfolio by segment at December 31, 2017 Construction 25.7% Warehouse mortgage 0.7% Acquisition and development 2.4% Commercial real estate 38.2% Farmland 0.3% Residential - closed end 1 - 4 family 23.1% Home
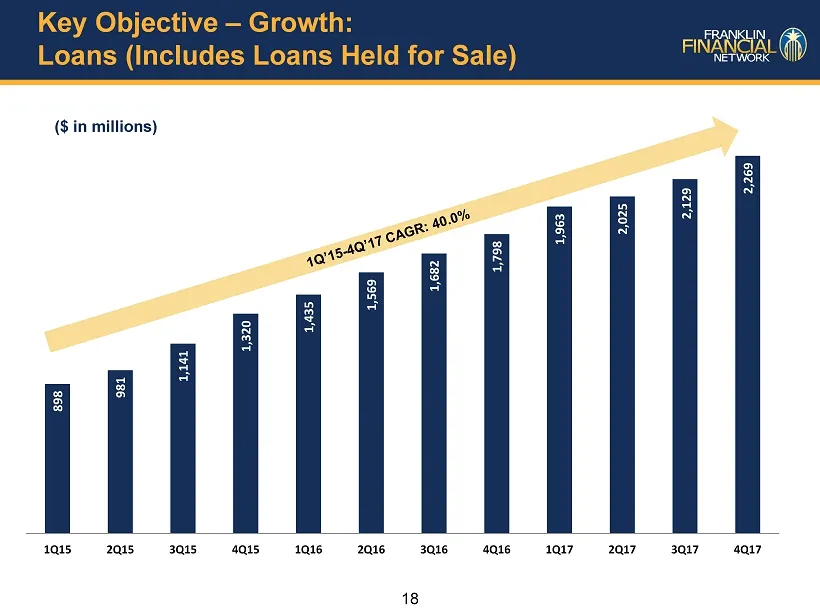
Slide 18: Growth: Loans (Includes Loans Held for Sale)
18 Key Objective – Growth: Loans (Includes Loans Held for Sale) 898 981 1,141 1,320 1,435 1,569 1,682 1,798 1,963 2,025 2,129 2,269 1Q15 2Q15 3Q15 4Q15 1Q16 2Q16 3Q16 4Q16 1Q17 2Q17 3Q17 4Q17 ($ in millions)
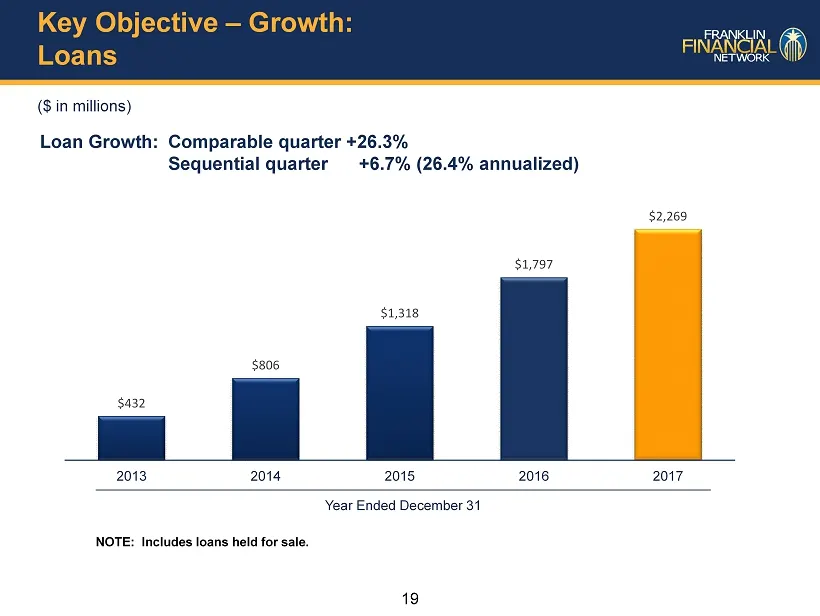
Slide 19: Growth: Loans
19 Key Objective – Growth: Loans ($ in millions) Loan Growth: Comparable quarter +26.3% Sequential quarter +6.7% (26.4% annualized) $432 $806 $1,318 $1,797 $2,269 2013 2014 2015 2016 2017 Year Ended December 31 NOTE: Includes loans held for sale.
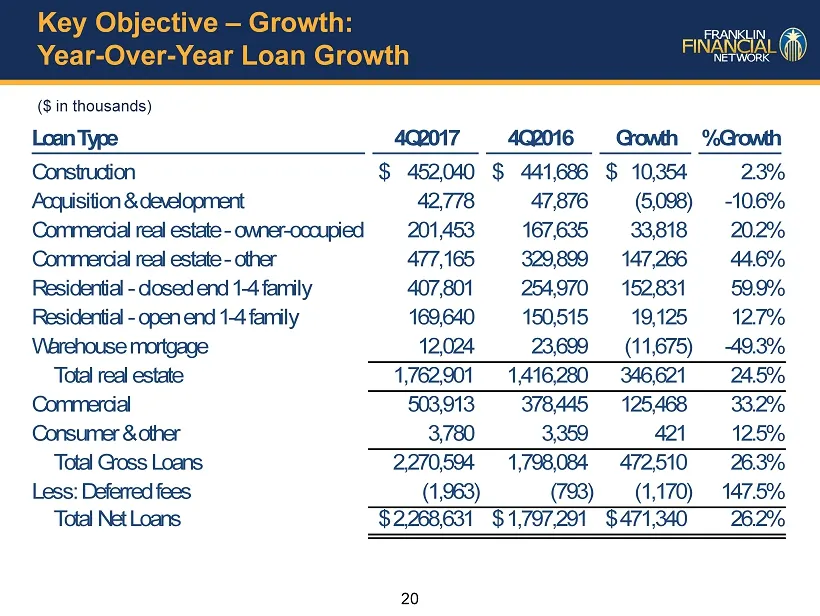
Slide 20: Growth: Year-Over-Year Loan Growth
20 Key Objective – Growth: Year - Over - Year Loan Growth Loan Type 4Q2017 4Q2016 Growth % Growth Construction 452,040$ 441,686$ 10,354$ 2.3% Acquisition & development 42,778 47,876 (5,098) -10.6% Commercial real estate - owner-occupied 201,453 167,635 33,818 20.2% Commercial real estate - other 477
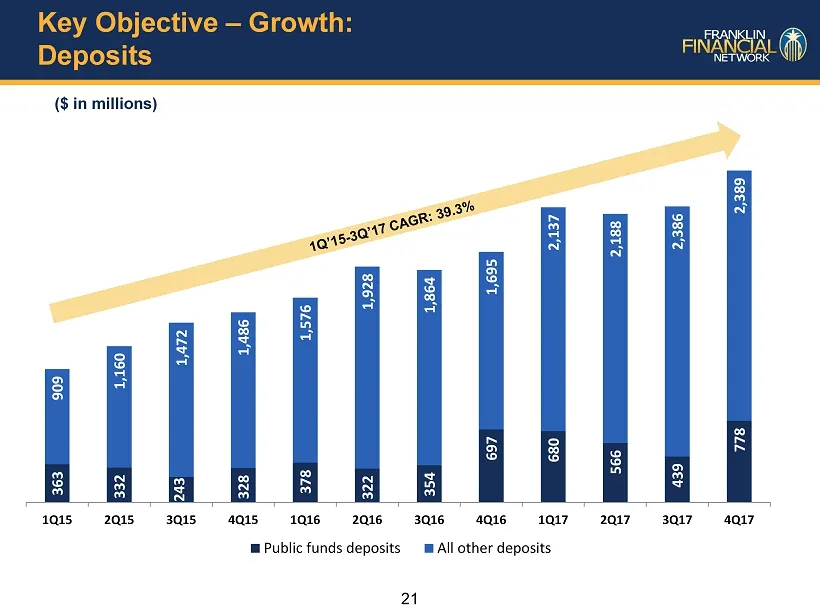
Slide 21: Growth: Deposits
21 Key Objective – Growth: Deposits 363 332 243 328 378 322 354 697 680 566 439 778 909 1,160 1,472 1,486 1,576 1,928 1,864 1,695 2,137 2,188 2,386 2,389 1Q15 2Q15 3Q15 4Q15 1Q16 2Q16 3Q16 4Q16 1Q17 2Q17 3Q17 4Q17 Public funds deposits All other deposits ($ in millions)
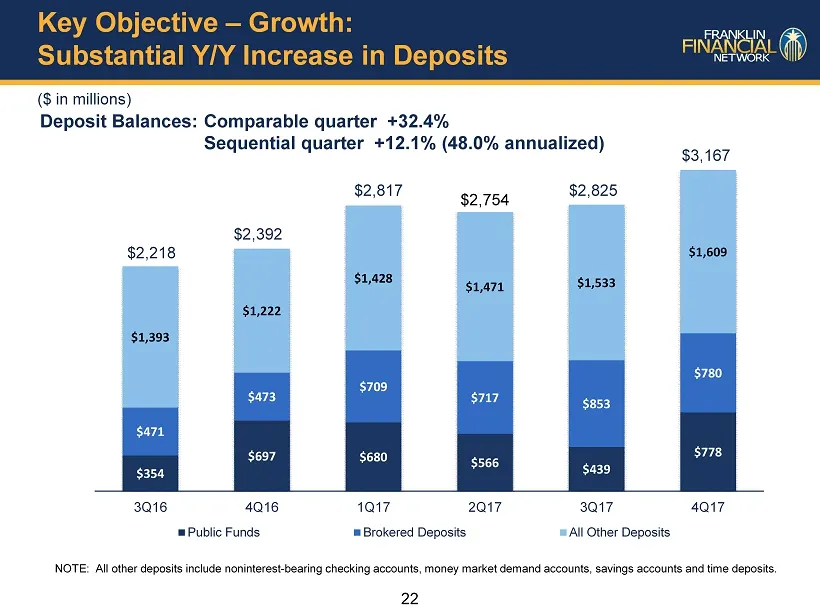
Slide 22: Growth: Substantial Y/Y Increase in Deposits
22 Key Objective – Growth: Substantial Y/Y Increase in Deposits ($ in millions) Deposit Balances: Comparable quarter +32.4% Sequential quarter +12.1% (48.0% annualized) $354 $697 $680 $566 $439 $778 $471 $473 $709 $717 $853 $780 $1,393 $1,222 $1,428 $1,471 $1,533 $1,609 3Q16 4Q16 1Q17 2Q17 3Q17 4Q17
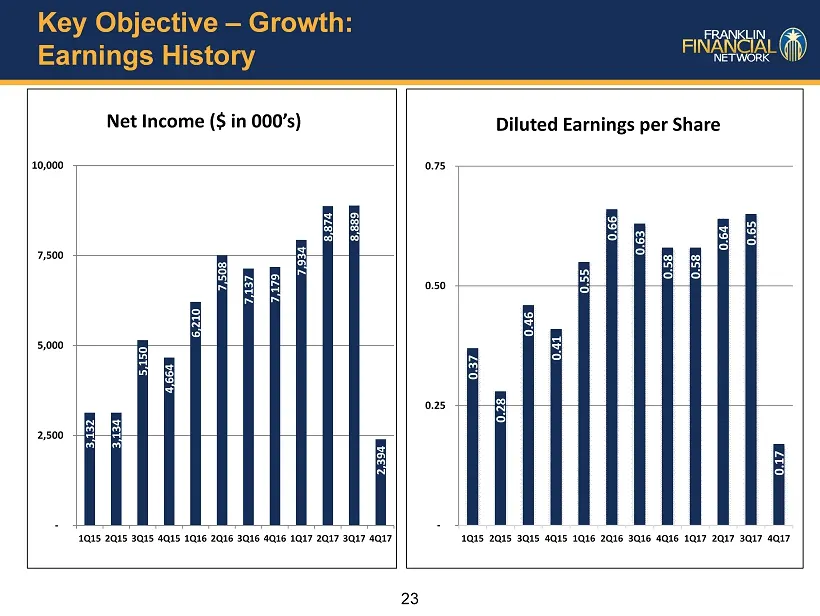
Slide 23: Growth: Earnings History
23 Key Objective – Growth: Earnings History 3,132 3,134 5,150 4,664 6,210 7,508 7,137 7,179 7,934 8,874 8,889 2,394 - 2,500 5,000 7,500 10,000 1Q15 2Q15 3Q15 4Q15 1Q16 2Q16 3Q16 4Q16 1Q17 2Q17 3Q17 4Q17 Net Income ($ in 000’s) 0.37 0.28 0.46 0.41 0.55 0.66 0.63 0.58 0.58 0.64 0.65 0.17 - 0.25 0.50 0
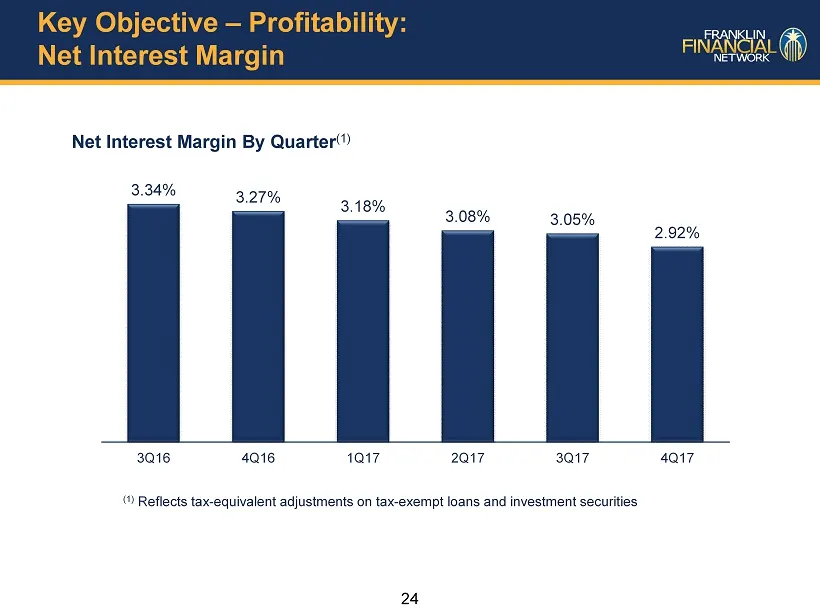
Slide 24: Profitability: Net Interest Margin
24 Key Objective – Profitability: Net Interest Margin Net Interest Margin By Quarter (1) 3.34% 3.27% 3.18% 3.08% 3.05% 2.92% 3Q16 4Q16 1Q17 2Q17 3Q17 4Q17 (1) Reflects tax - equivalent adjustments on tax - exempt loans and investment securities
Slide 25: Profitability: Noninterest Income
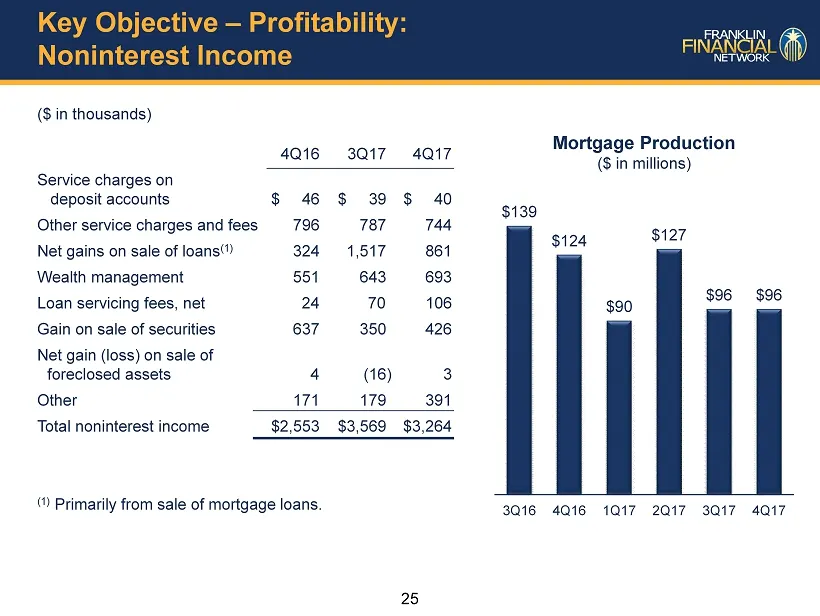
25 Key Objective – Profitability: Noninterest Income ($ in thousands) 4Q16 3Q17 4Q17 Service charges on deposit accounts $ 46 $ 39 $ 40 Other service charges and fees 796 787 744 Net gains on sale of loans (1) 324 1,517 861 Wealth management 551 643 693 Loan servicing fees, net 24 70 106 Gain on sal
Slide 26: Profitability: Noninterest Expense and Economies of Scale
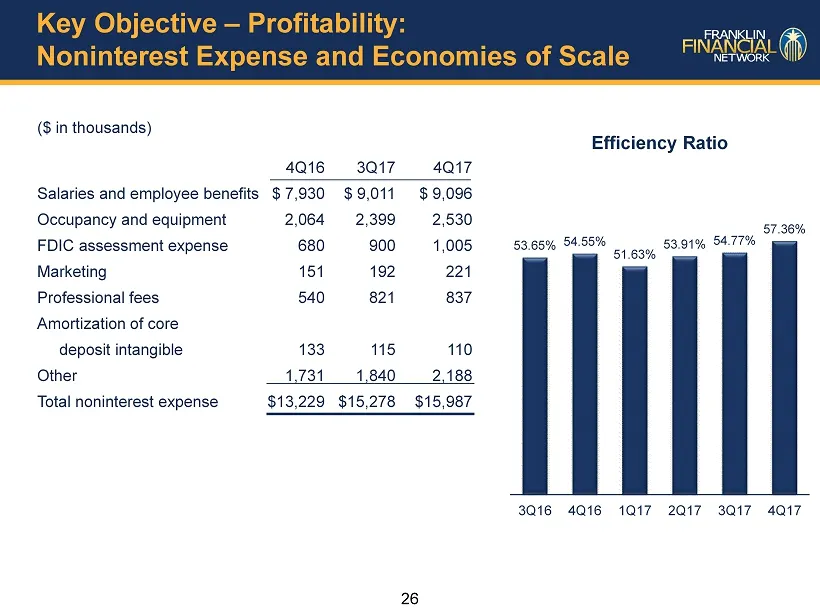
26 Key Objective – Profitability: Noninterest Expense and Economies of Scale ($ in thousands) 4Q16 3Q17 4Q17 Salaries and employee benefits $ 7,930 $ 9,011 $ 9,096 Occupancy and equipment 2,064 2,399 2,530 FDIC assessment expense 680 900 1,005 Marketing 151 192 221 Professional fees 540 821 837 Amor
Slide 27: Key Elements of FSB Performance
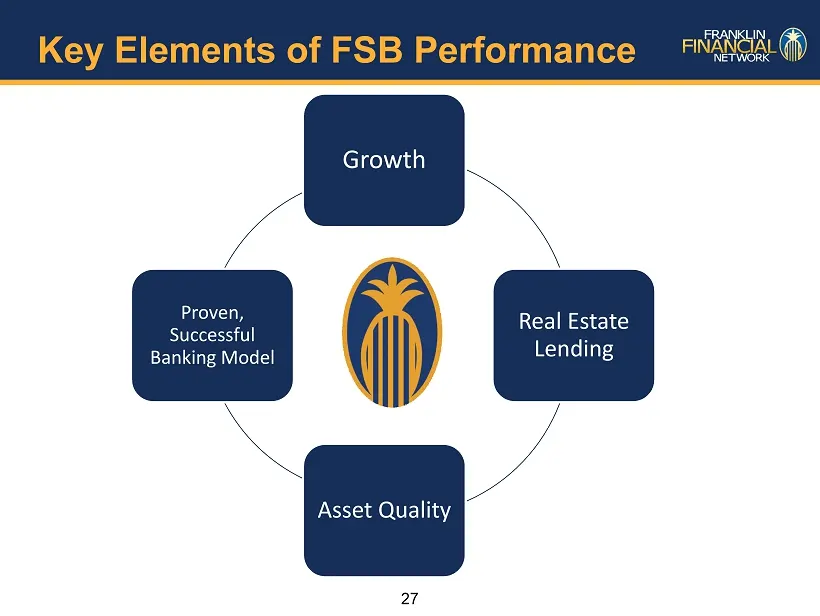
27 Key Elements of FSB Performance Growth Real Estate Lending Asset Quality Proven, Successful Banking Model
Source: SEC EDGAR · 8-K filed Jan 24, 2018
More decks from Franklin Financial Network Inc
 Merger or Acquisition (January 2020)17 slides · Jan 21, 2020
 Q3 2019 Earnings Presentation21 slides · Nov 1, 2019
 Q3 2019 Earnings Presentation15 slides · Oct 23, 2019
 Q2 2019 Earnings Presentation19 slides · Jul 26, 2019
 Q2 2019 Earnings Presentation15 slides · Jul 24, 2019
 Q1 2019 Earnings Presentation19 slides · May 10, 2019