Sysmex Corporation · TSE:6869
Sysmex — Q1 FY2012 Earnings Presentation
12 slides from Sysmex's earnings presentation, Aug 3, 2011
Slide 1: Financial Results for the 1st Quarter of the Fiscal Year Ending March 31, 2012
Financial Results for the 1st Quarter of the Fiscal Year Ending March 31, 2012 Forward-Looking Statements This material contains forward-looking statements about Sysmex Corporation and its group companies (the Sysmex Group). These forward- looking statements are based on the current judgments and as
Slide 2: 1st Quarter Financial Highlights
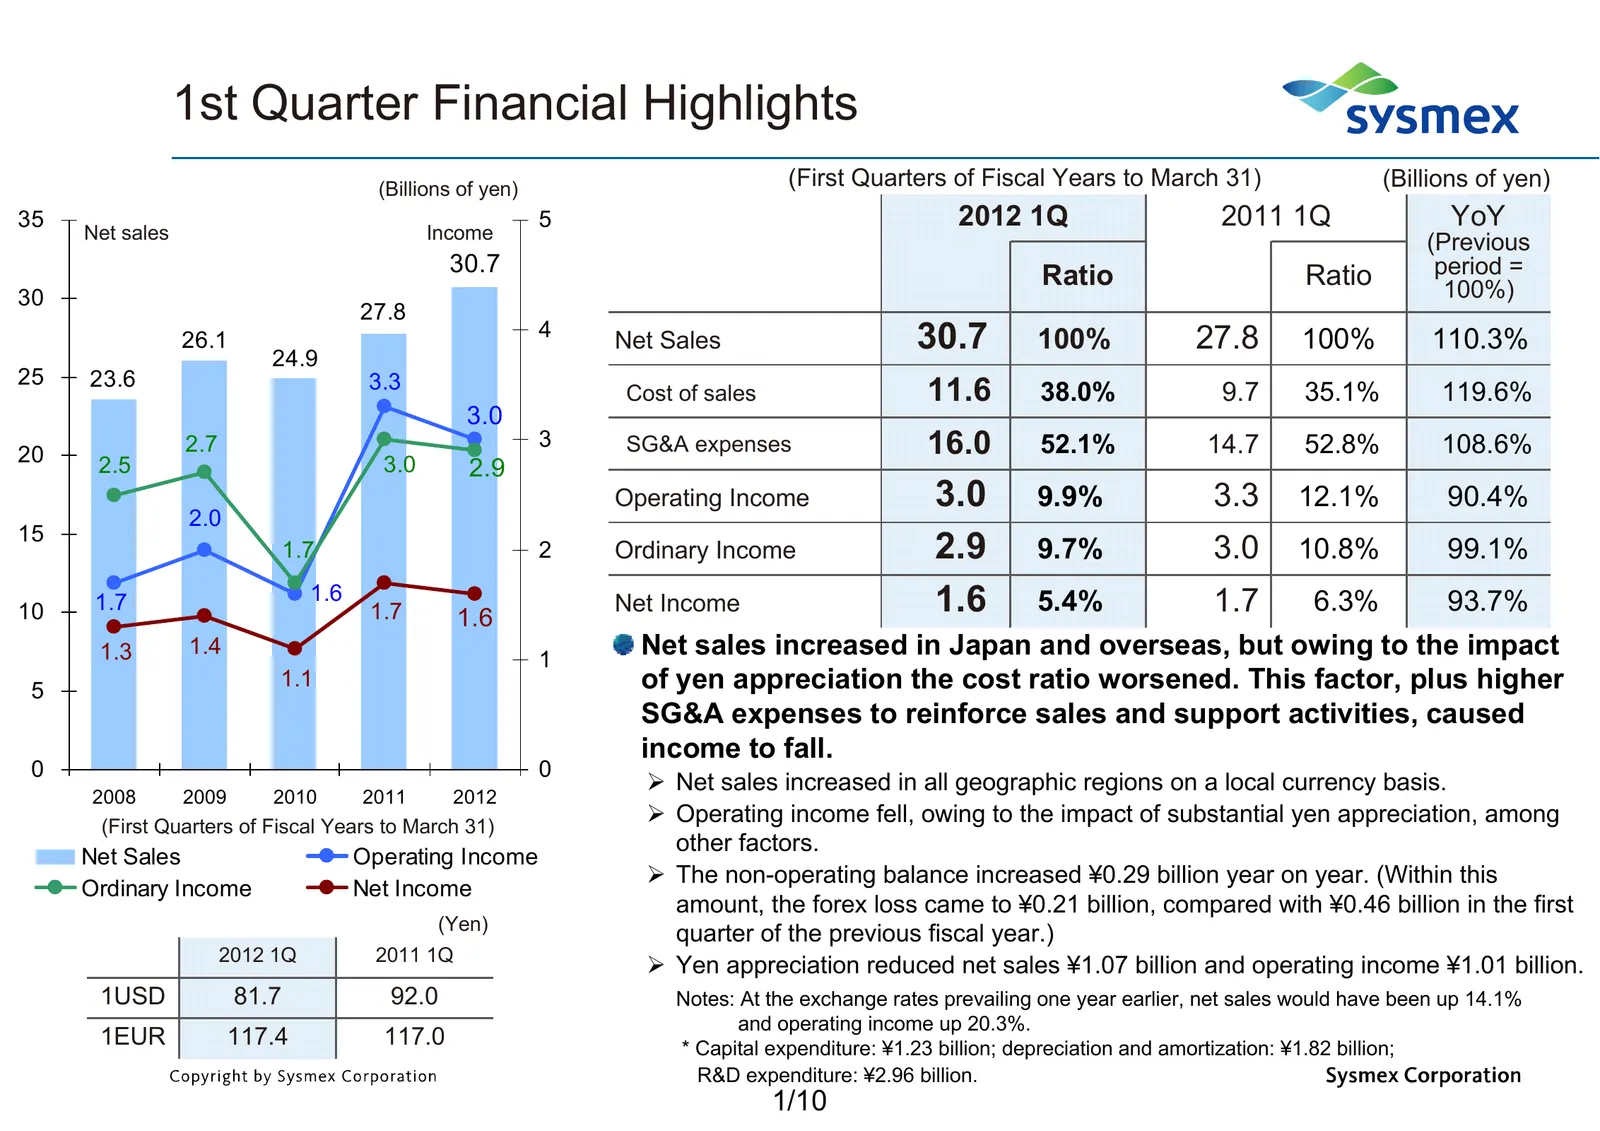
1st Quarter Financial Highlights (Billions of yen) (First Quarters of Fiscal Years to March 31) (Billions of yen) 35 Net sales Income 5 2012 1Q 2011 1Q YoY (Previous 30.7 Ratio Ratio period = 30 100%) 27.8 26.1 24.9 4 Net Sales 30.7 100% 27.8 100% 110.3% 25 23.6 3.3 Cost of sales 11.6 38.0% 9.7 35.1
Slide 3: Breakdown of Net Sales and Operating Income
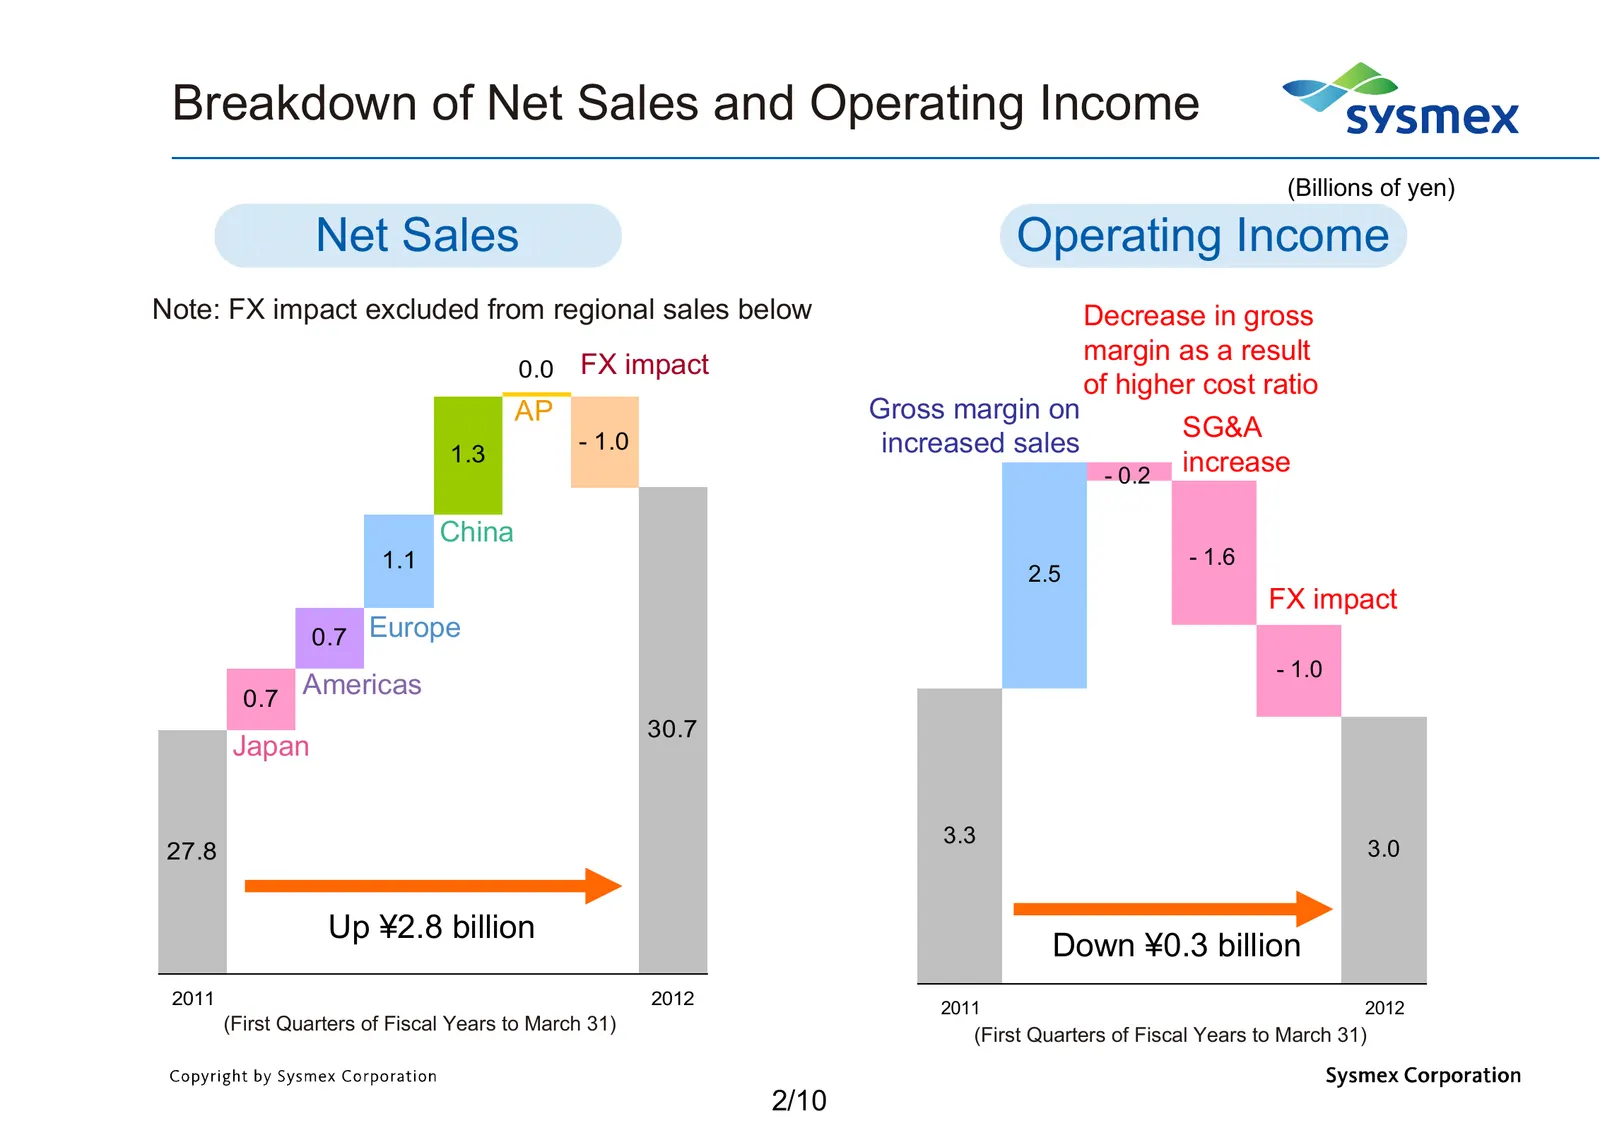
Breakdown of Net Sales and Operating Income (Billions of yen) Net Sales Operating Income Note: FX impact excluded from regional sales below Decrease in gross FX impact margin as a result 0.0 of higher cost ratio AP Gross margin on SG&A 1.3 - 1.0 increased sales - 0.2 increase China 1.1 - 1.6 2.5 FX
Slide 4: Topics
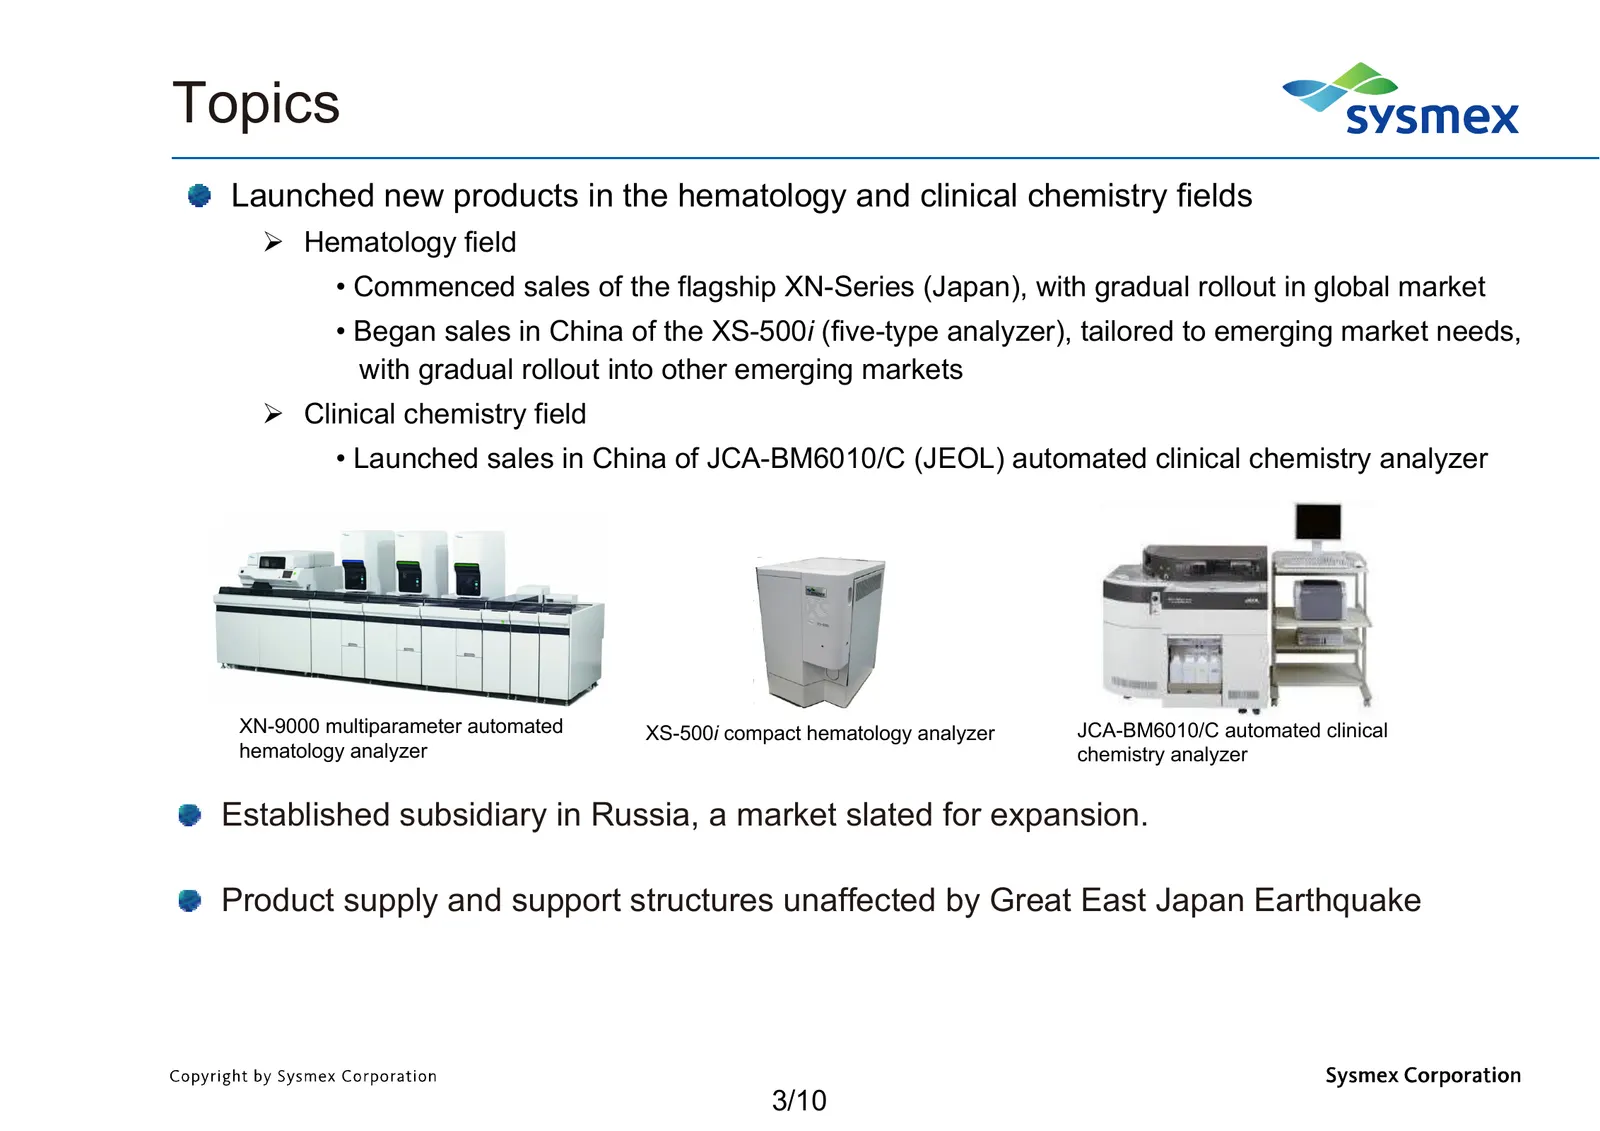
Topics Launched new products in the hematology and clinical chemistry fields Hematology field • Commenced sales of the flagship XN-Series (Japan), with gradual rollout in global market • Began sales in China of the XS-500i (five-type analyzer), tailored to emerging market needs, with gradual rollo
Slide 5: Net Sales by Geographic Region
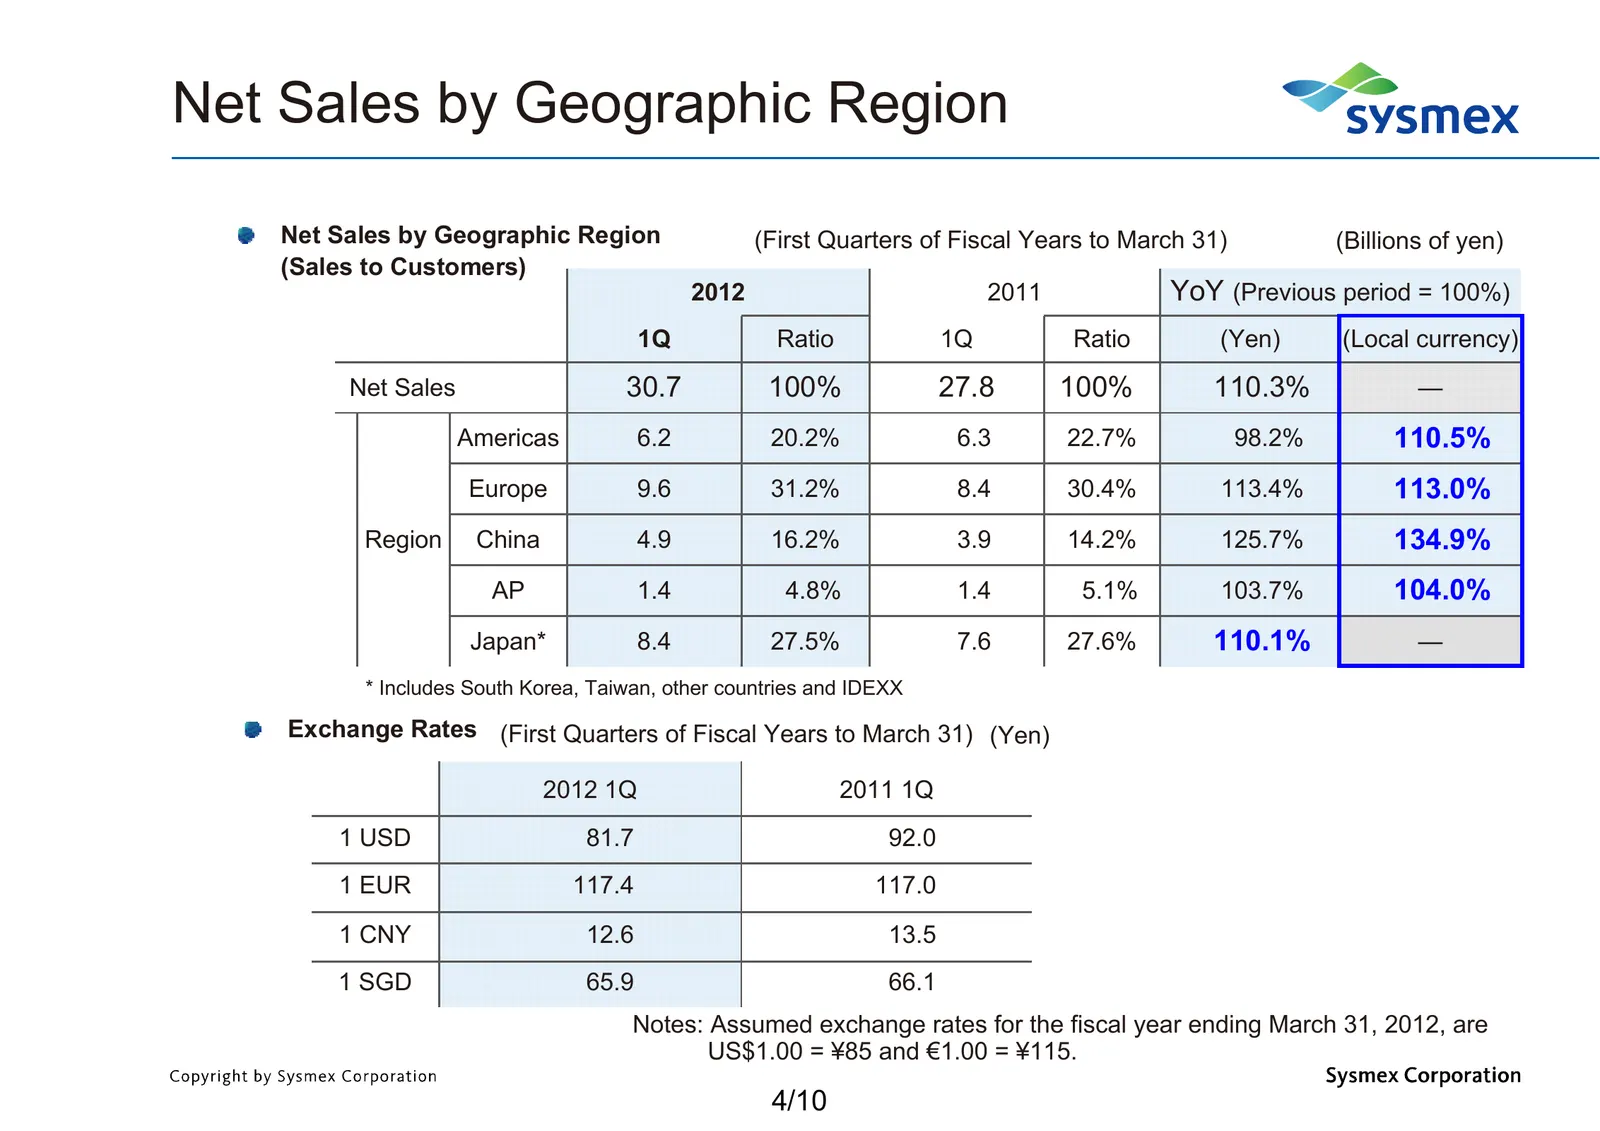
Net Sales by Geographic Region Net Sales by Geographic Region (First Quarters of Fiscal Years to March 31) (Billions of yen) (Sales to Customers) 2012 2011 YoY (Previous period = 100%) 1Q Ratio 1Q Ratio (Yen) (Local currency) Net Sales 30.7 100% 27.8 100% 110.3% — Americas 6.2 20.2% 6.3 22.7% 98.2%
Slide 6: Geographic Segment Information: Americas
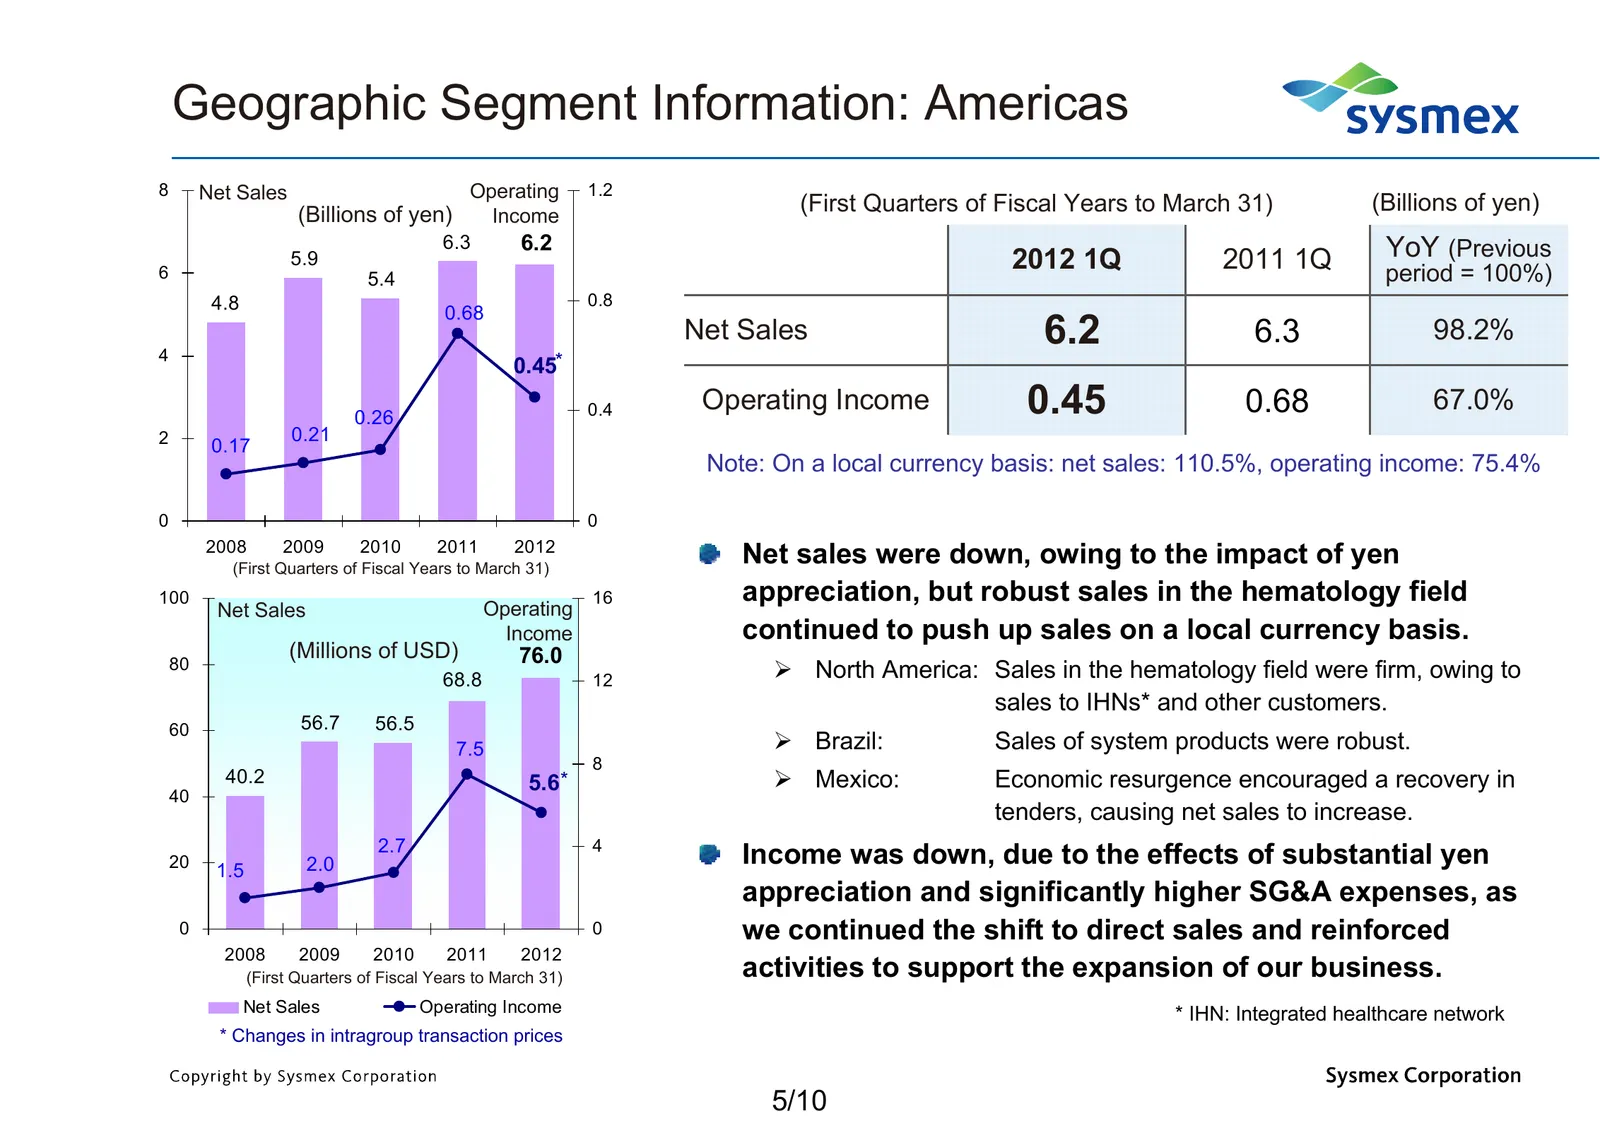
Geographic Segment Information: Americas 8 Net Sales Operating 1.2 (Billions of yen) Income (First Quarters of Fiscal Years to March 31) (Billions of yen) 6.3 6.2 YoY (Previous 6 5.9 2012 1Q 2011 1Q period = 100%) 5.4 4.8 0.8 0.68 4 Net Sales 6.2 6.3 98.2% 0.45* 0.26 0.4 Operating Income 0.45 0.68 6
Slide 7: Geographic Segment Information: Europe
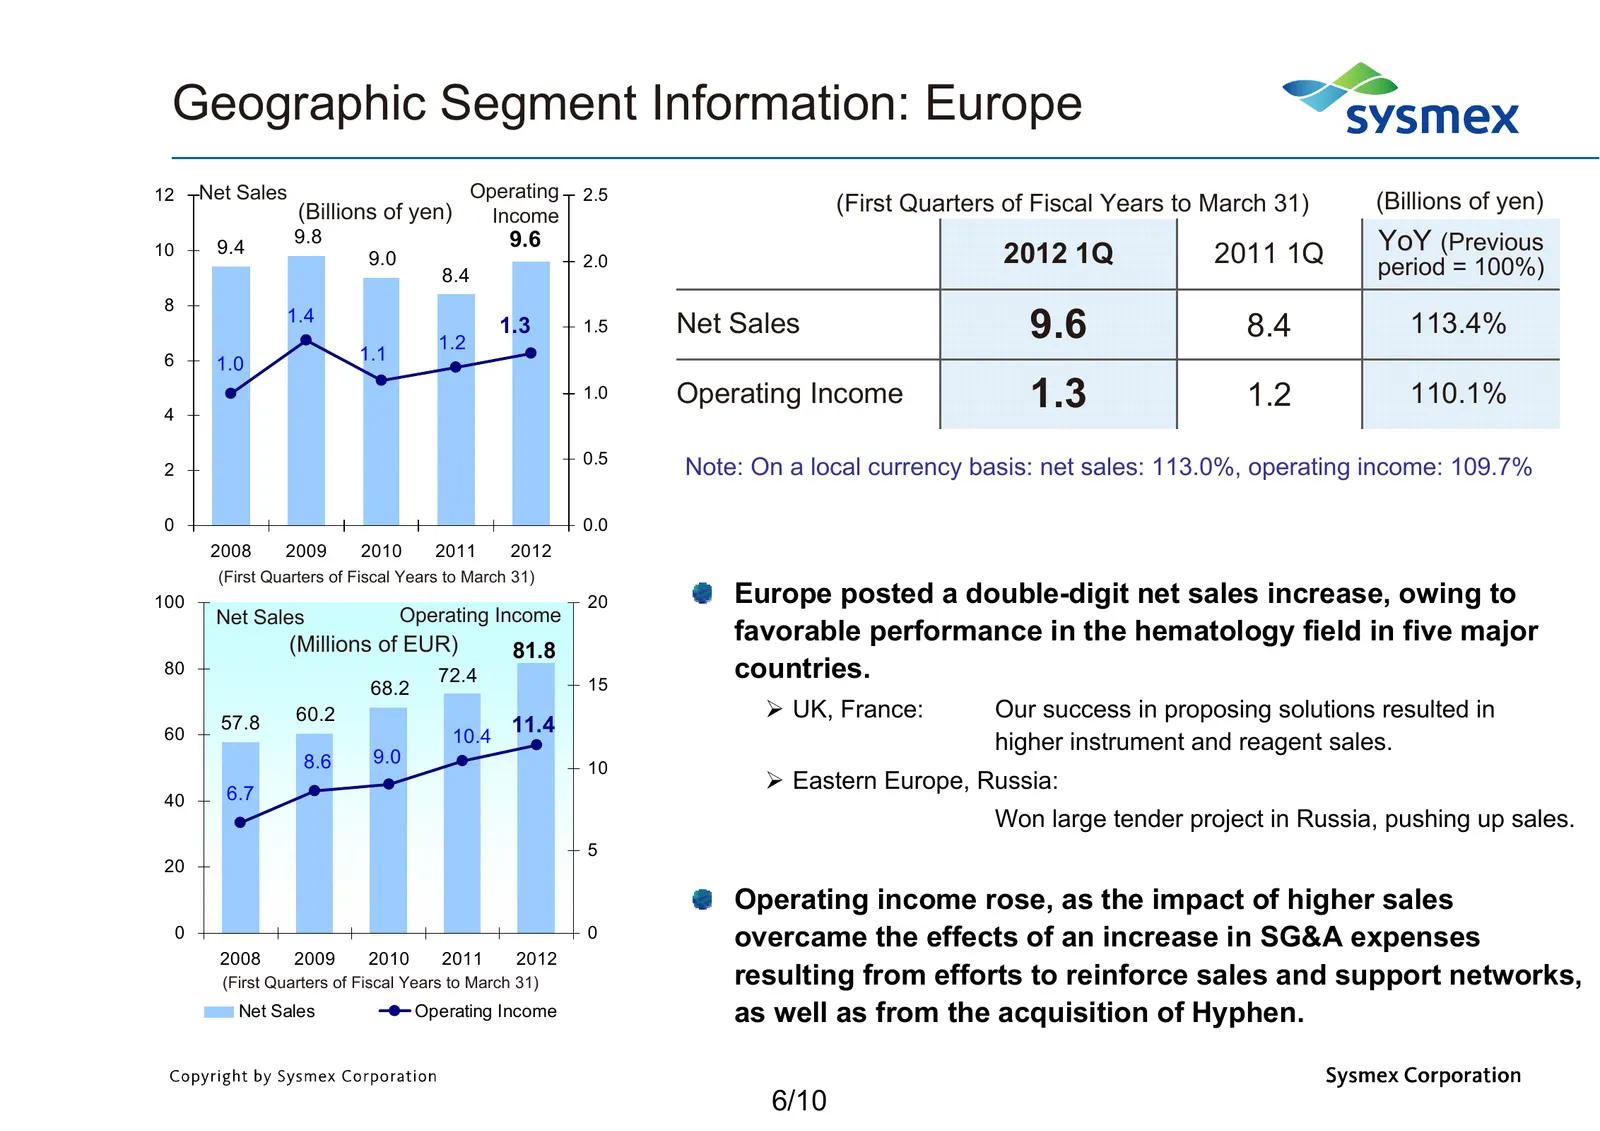
Geographic Segment Information: Europe 12 Net Sales Operating 2.5 (Billions of yen) (First Quarters of Fiscal Years to March 31) (Billions of yen) Income 10 9.4 9.8 9.6 2012 1Q 2011 1Q YoY (Previous 9.0 2.0 8.4 period = 100%) 8 1.4 1.2 1.3 1.5 Net Sales 9.6 8.4 113.4% 6 1.1 1.0 4 1.0 Operating Incom
Slide 8: Geographic Segment Information: China
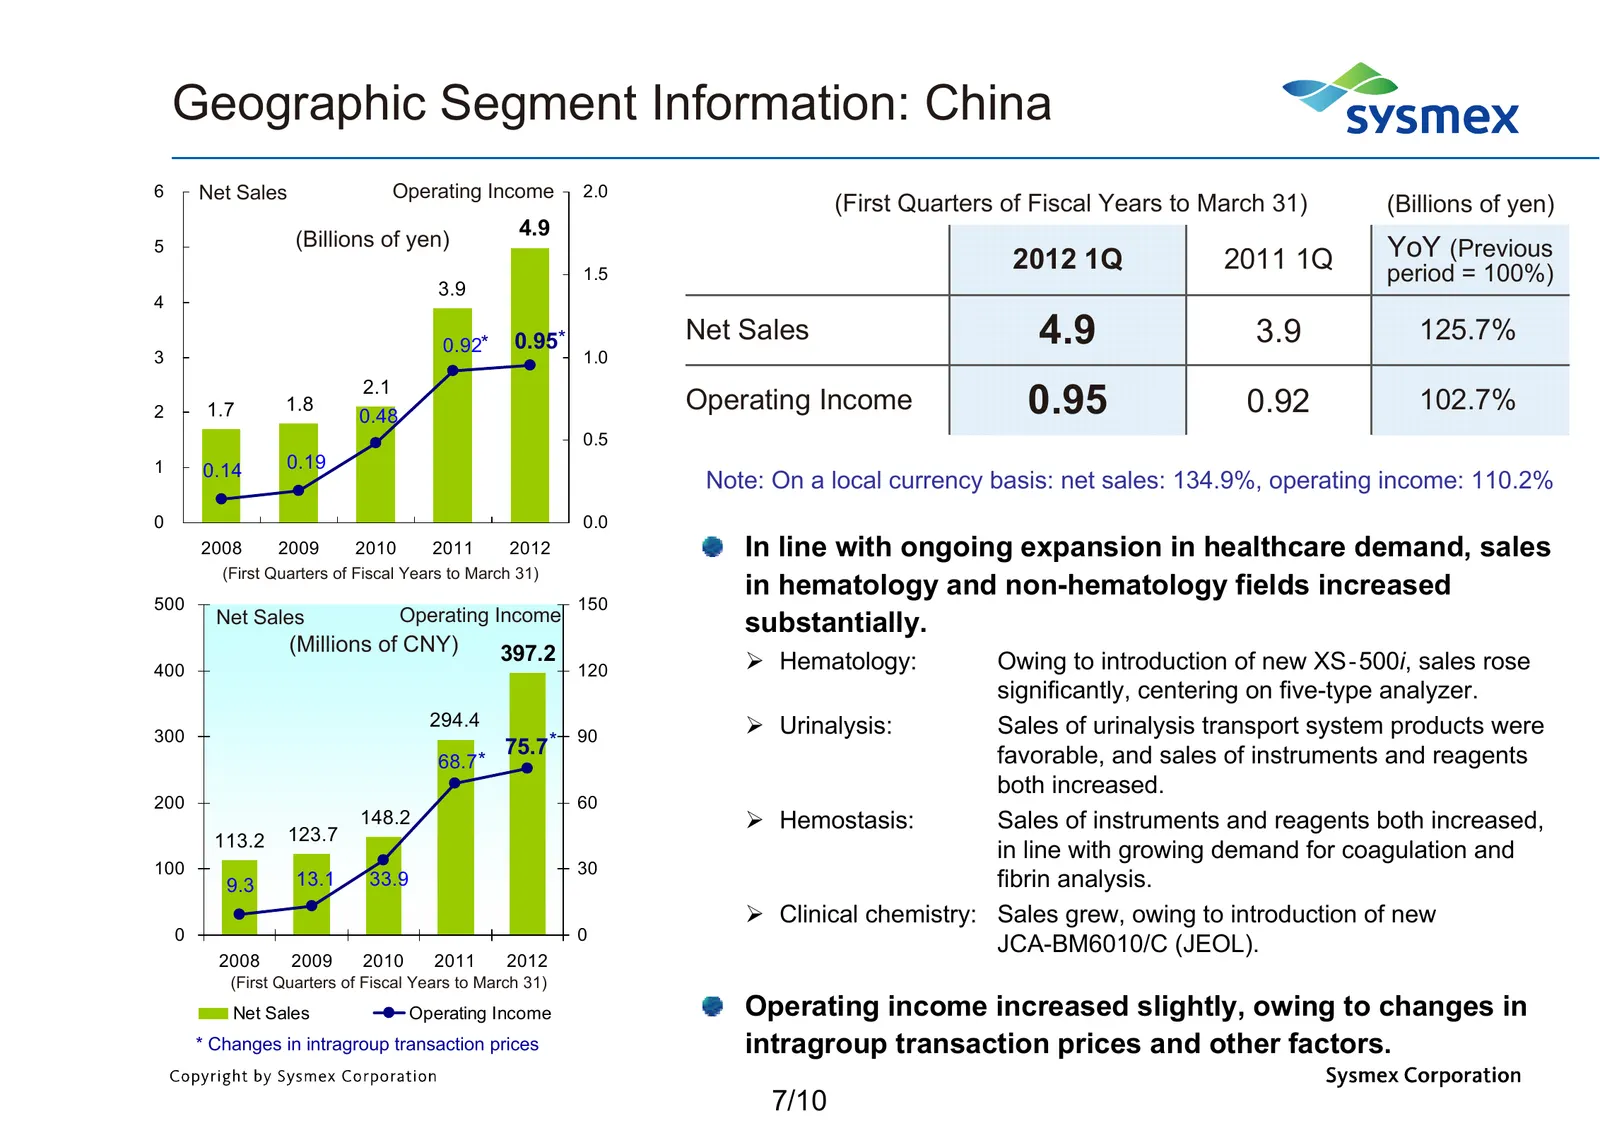
Geographic Segment Information: China 6 Net Sales Operating Income 2.0 (First Quarters of Fiscal Years to March 31) (Billions of yen) 4.9 5 (Billions of yen) YoY (Previous 1.5 2012 1Q 2011 1Q period = 100%) 3.9 4 3 0.92* 0.95* 1.0 Net Sales 4.9 3.9 125.7% 2.1 2 1.7 1.8 0.48 Operating Income 0.95 0.9
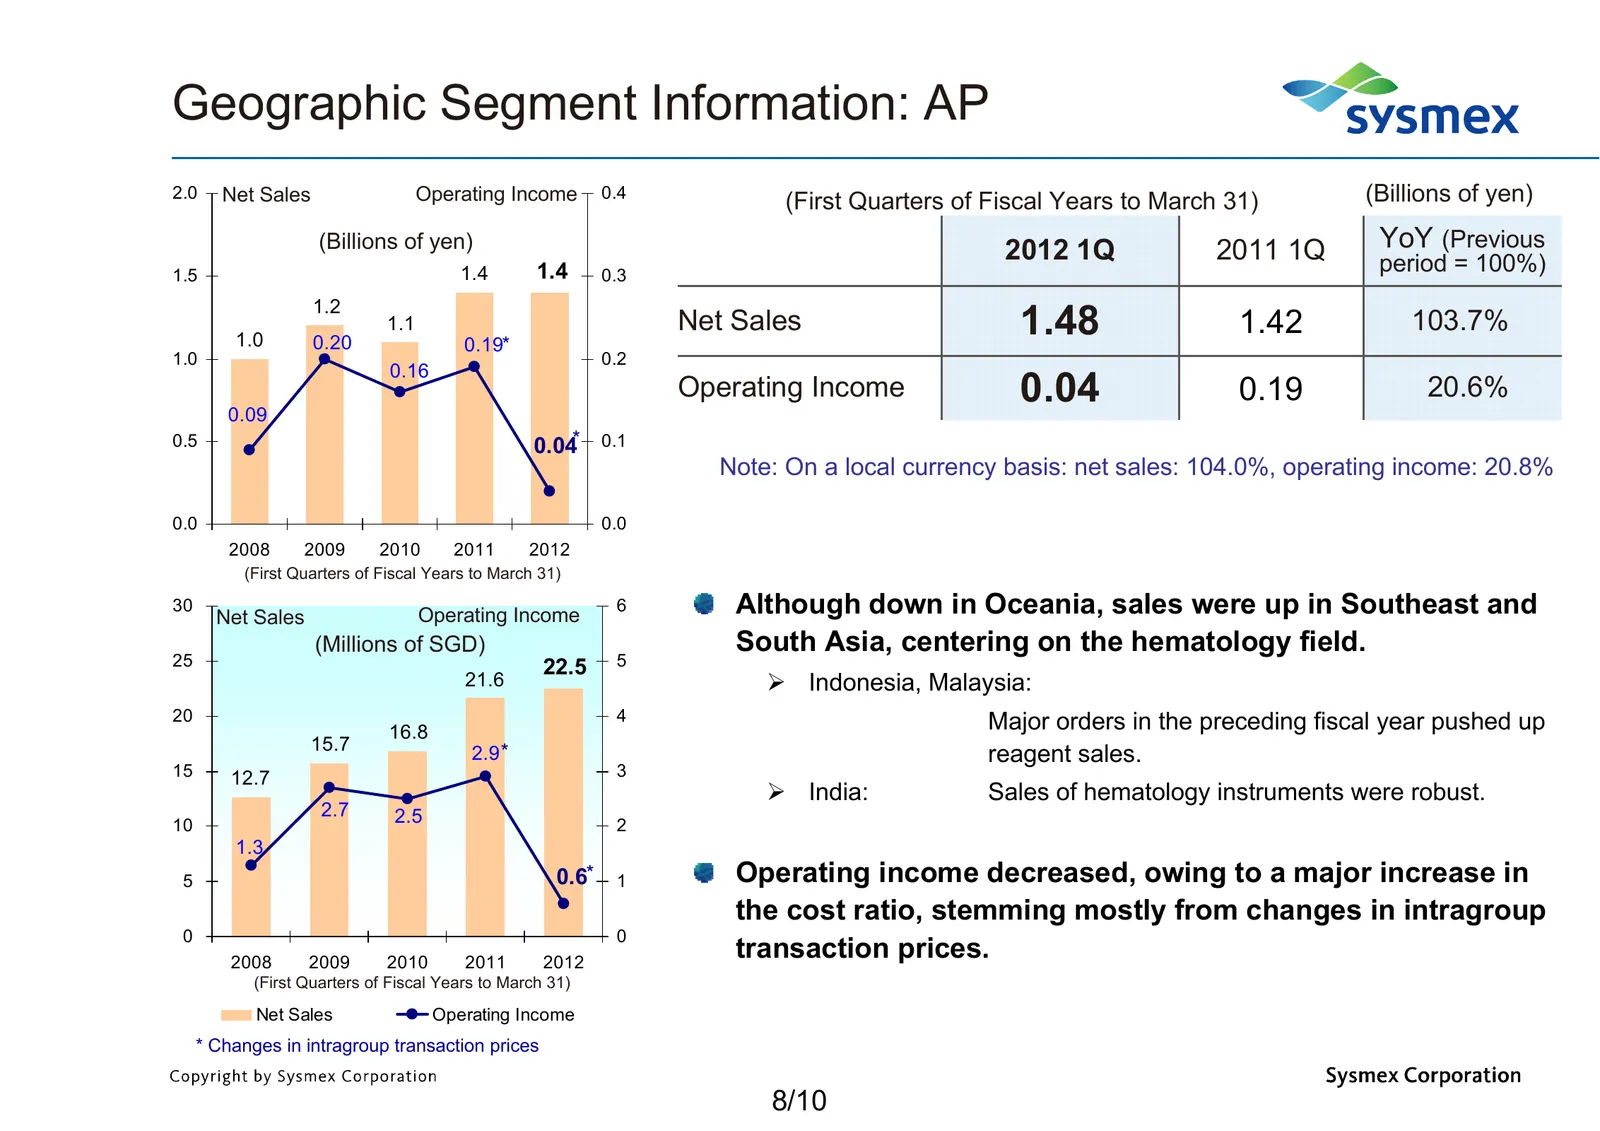
Slide 9: Geographic Segment Information: AP
Geographic Segment Information: AP 2.0 Net Sales Operating Income 0.4 (First Quarters of Fiscal Years to March 31) (Billions of yen) (Billions of yen) 2012 1Q 2011 1Q YoY (Previous 1.5 1.4 1.4 0.3 period = 100%) 1.2 1.0 0.20 1.1 0.19* Net Sales 1.48 1.42 103.7% 1.0 0.2 0.16 0.09 Operating Income 0.0
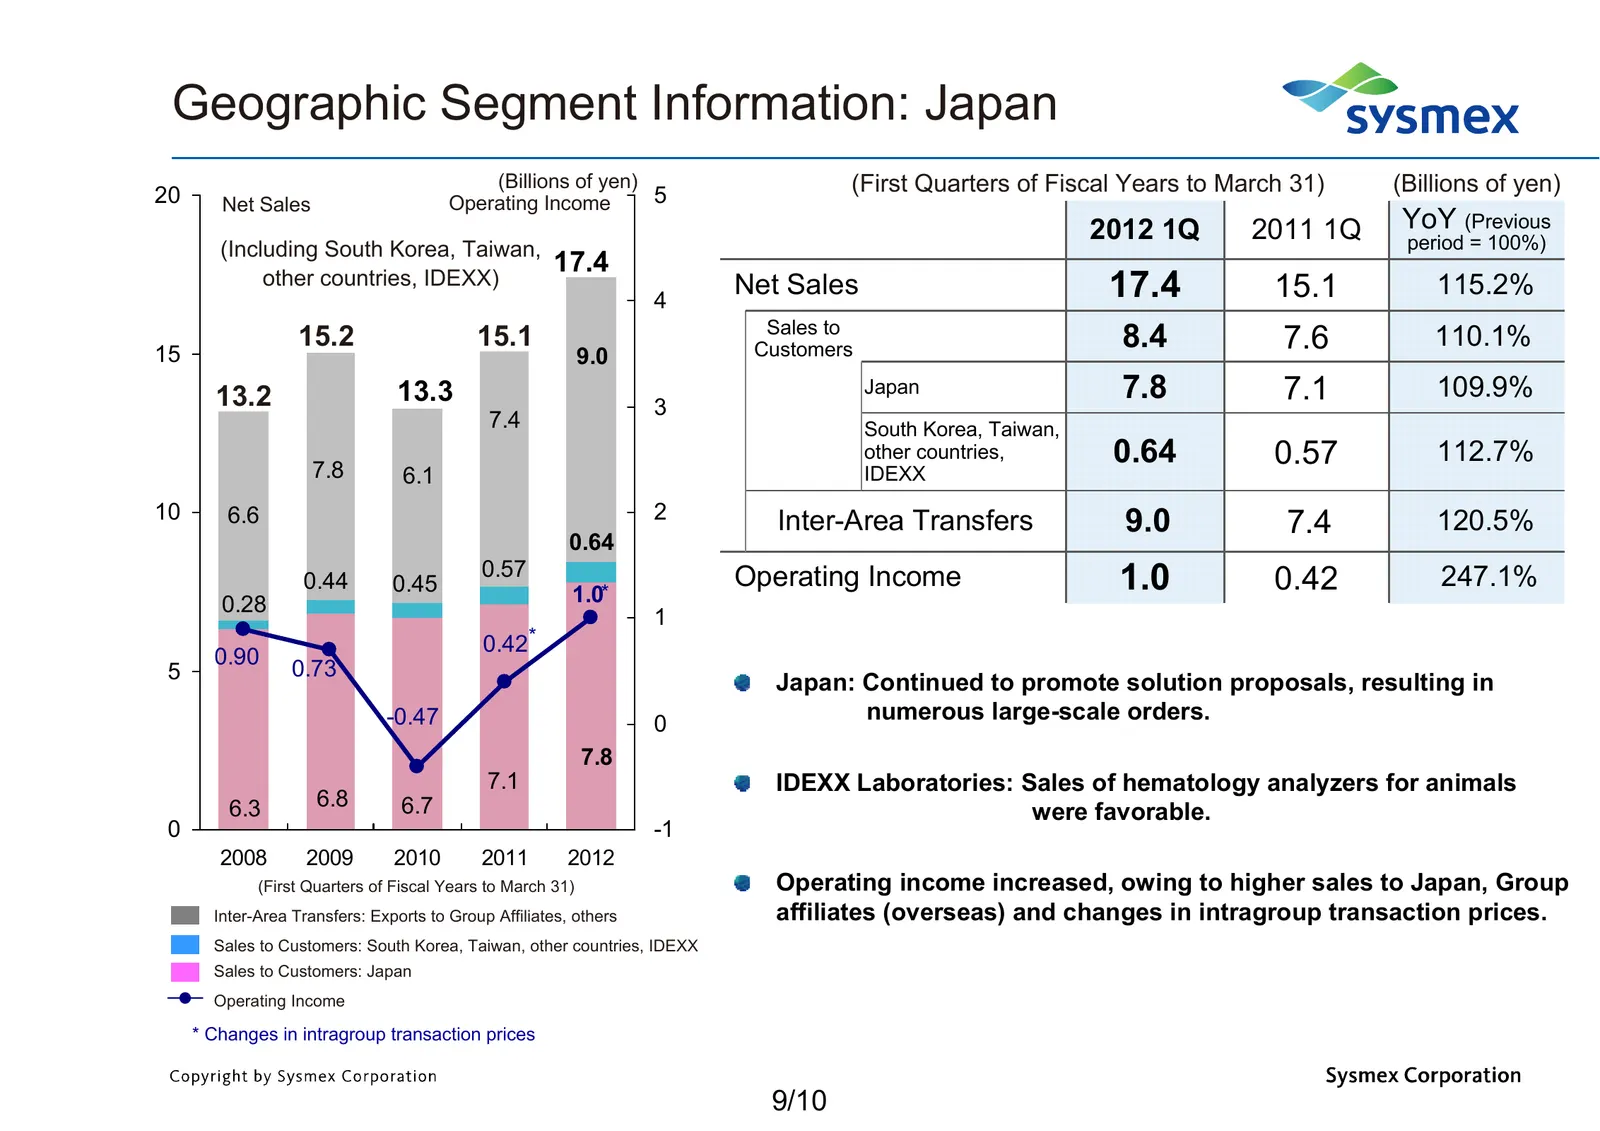
Slide 10: Geographic Segment Information: Japan
Geographic Segment Information: Japan (Billions of yen) (First Quarters of Fiscal Years to March 31) (Billions of yen) 20 Net Sales Operating Income 5 2012 1Q 2011 1Q YoY (Previous (Including South Korea, Taiwan, period = 100%) 17.4 other countries, IDEXX) 4 Net Sales 17.4 15.1 115.2% Sales to 15 15
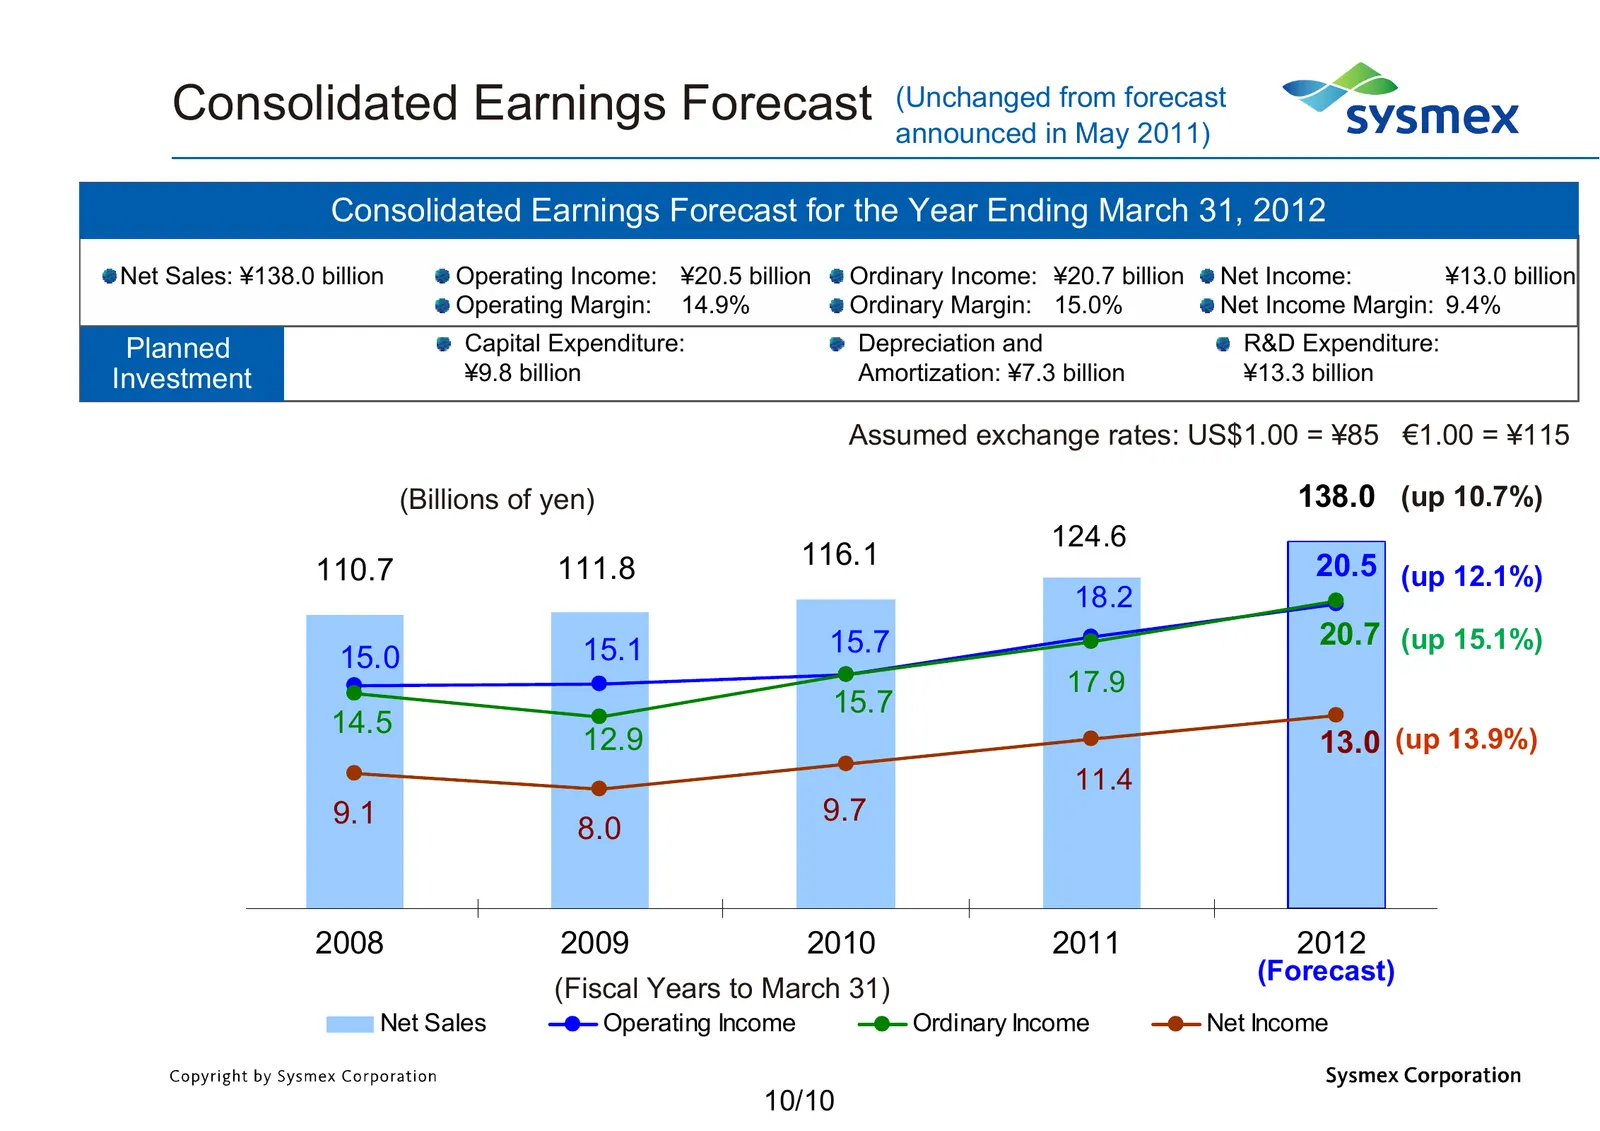
Slide 11: Consolidated Earnings Forecast (Unchanged from forecast announced in May 2011)
Consolidated Earnings Forecast (Unchanged from forecast announced in May 2011) Consolidated Earnings Forecast for the Year Ending March 31, 2012 Net Sales: ¥138.0 billion Operating Income: ¥20.5 billion Ordinary Income: ¥20.7 billion Net Income: ¥13.0 billion Operating Margin: 14.9% Ordinary Margin:
Slide 12: Chapter 3
Chapter 3 Contact: IR & Corporate Communication Dept. Phone +81-78-265-0500 Email info@sysmex.co.jp
Source: Internet Archive copy of sysmex.co.jp
More decks from Sysmex Corporation
 Investor Presentation (November 2026)43 slides · Nov 10, 2026
 Q1 FY2027 Earnings Presentation33 slides · Aug 7, 2026
 Investor Presentation (2025)43 slides · 2025
 FY2011 Earnings Presentation23 slides · May 10, 2012
 FY2012 Earnings Presentation23 slides · May 10, 2012
 9M FY2012 Earnings Presentation12 slides · Feb 3, 2012