Sysmex Corporation · TSE:6869
Sysmex — H1 FY2011 Earnings Presentation
19 slides from Sysmex's earnings presentation, Nov 5, 2010
Slide 1: Business Results for the First Six Months of FY2011
Business Results for the First Six Months of the Fiscal Year Ending March 31, 2011 (FY2011) Sysmex Corporation Hisashi Ietsugu, President and CEO November 5, 2010
Slide 2: Contents
Contents Chapter 1 Financial Highlights for the First Six Months of the Fiscal Year Ending March 31, 2011 Chapter 2 Consolidated Earnings Forecast for the Fiscal Year Ending March 31, 2011 Forward-Looking Statements This material contains forward-looking statements about Sysmex Corporation and its G
Slide 3: Chapter 1 Financial Highlights for the First Six Months
Chapter 1 Financial Highlights for the First Six Months of the Fiscal Year Ending March 31, 2011
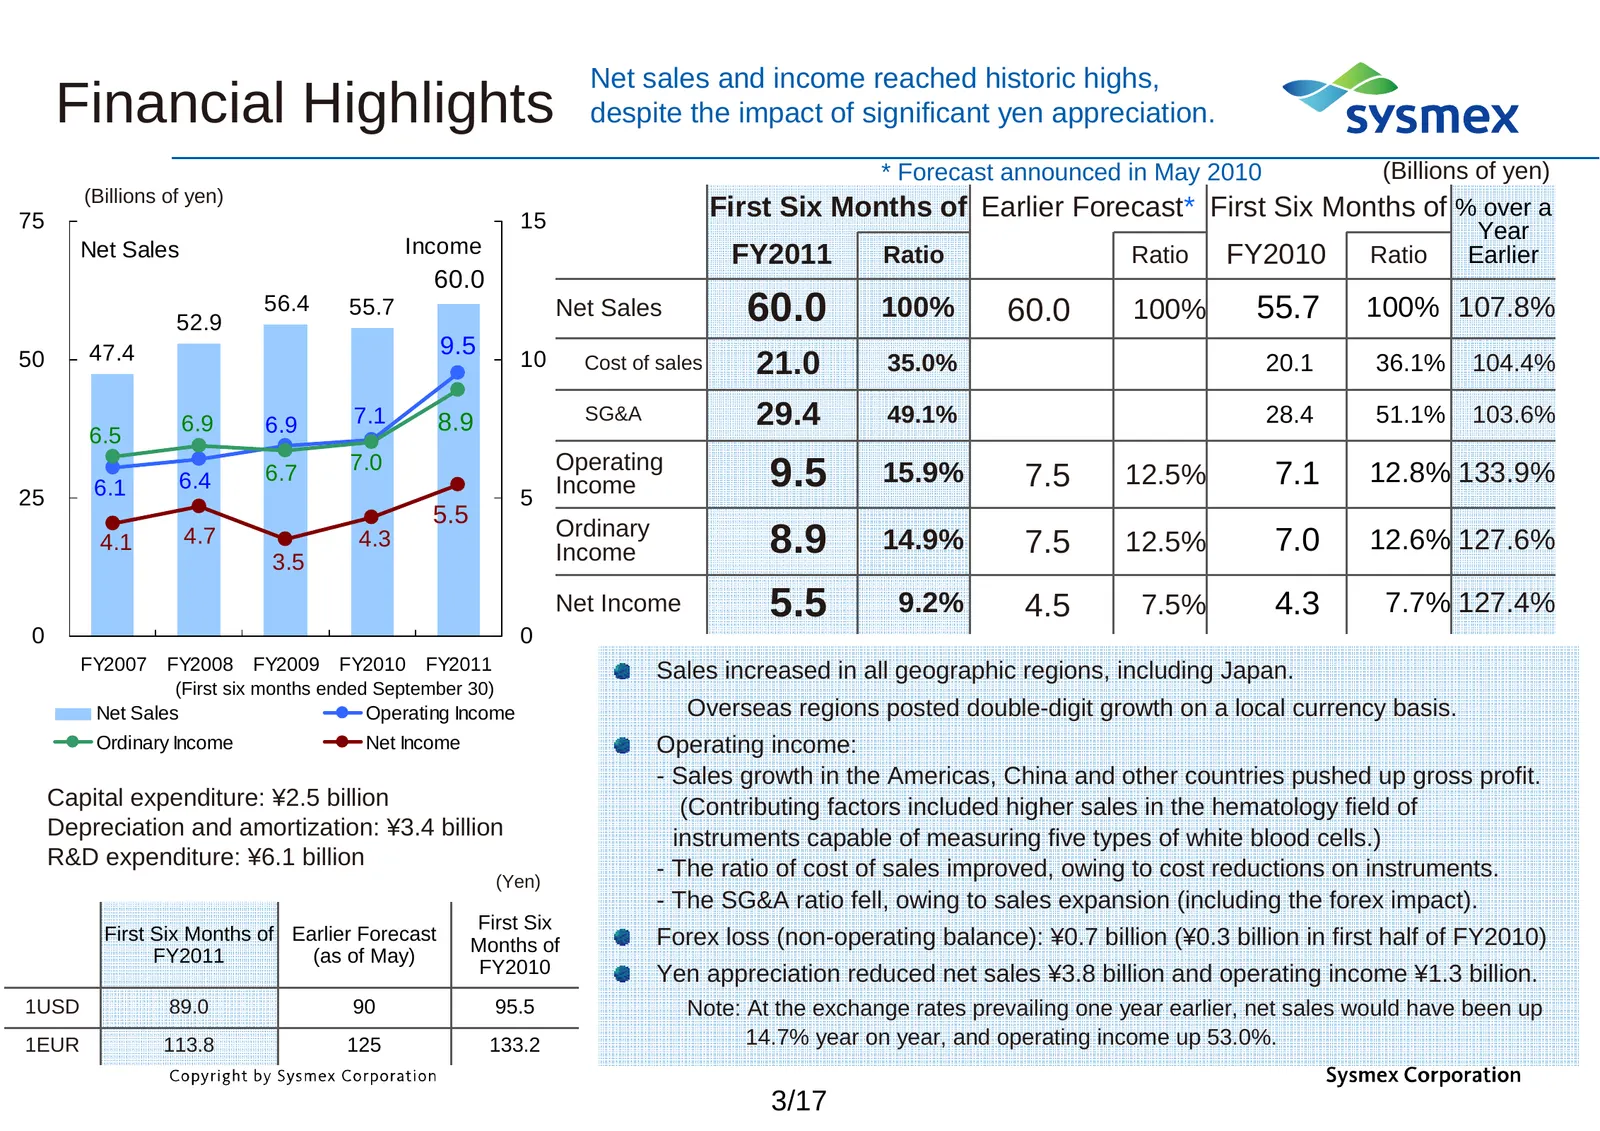
Slide 4: Financial Highlights
Net sales and income reached historic highs, Financial Highlights despite the impact of significant yen appreciation. * Forecast announced in May 2010 (Billions of yen) (Billions of yen) 75 15 First Six Months of Earlier Forecast* First Six Months of % over a Year Net Sales Income FY2011 Ratio Ratio
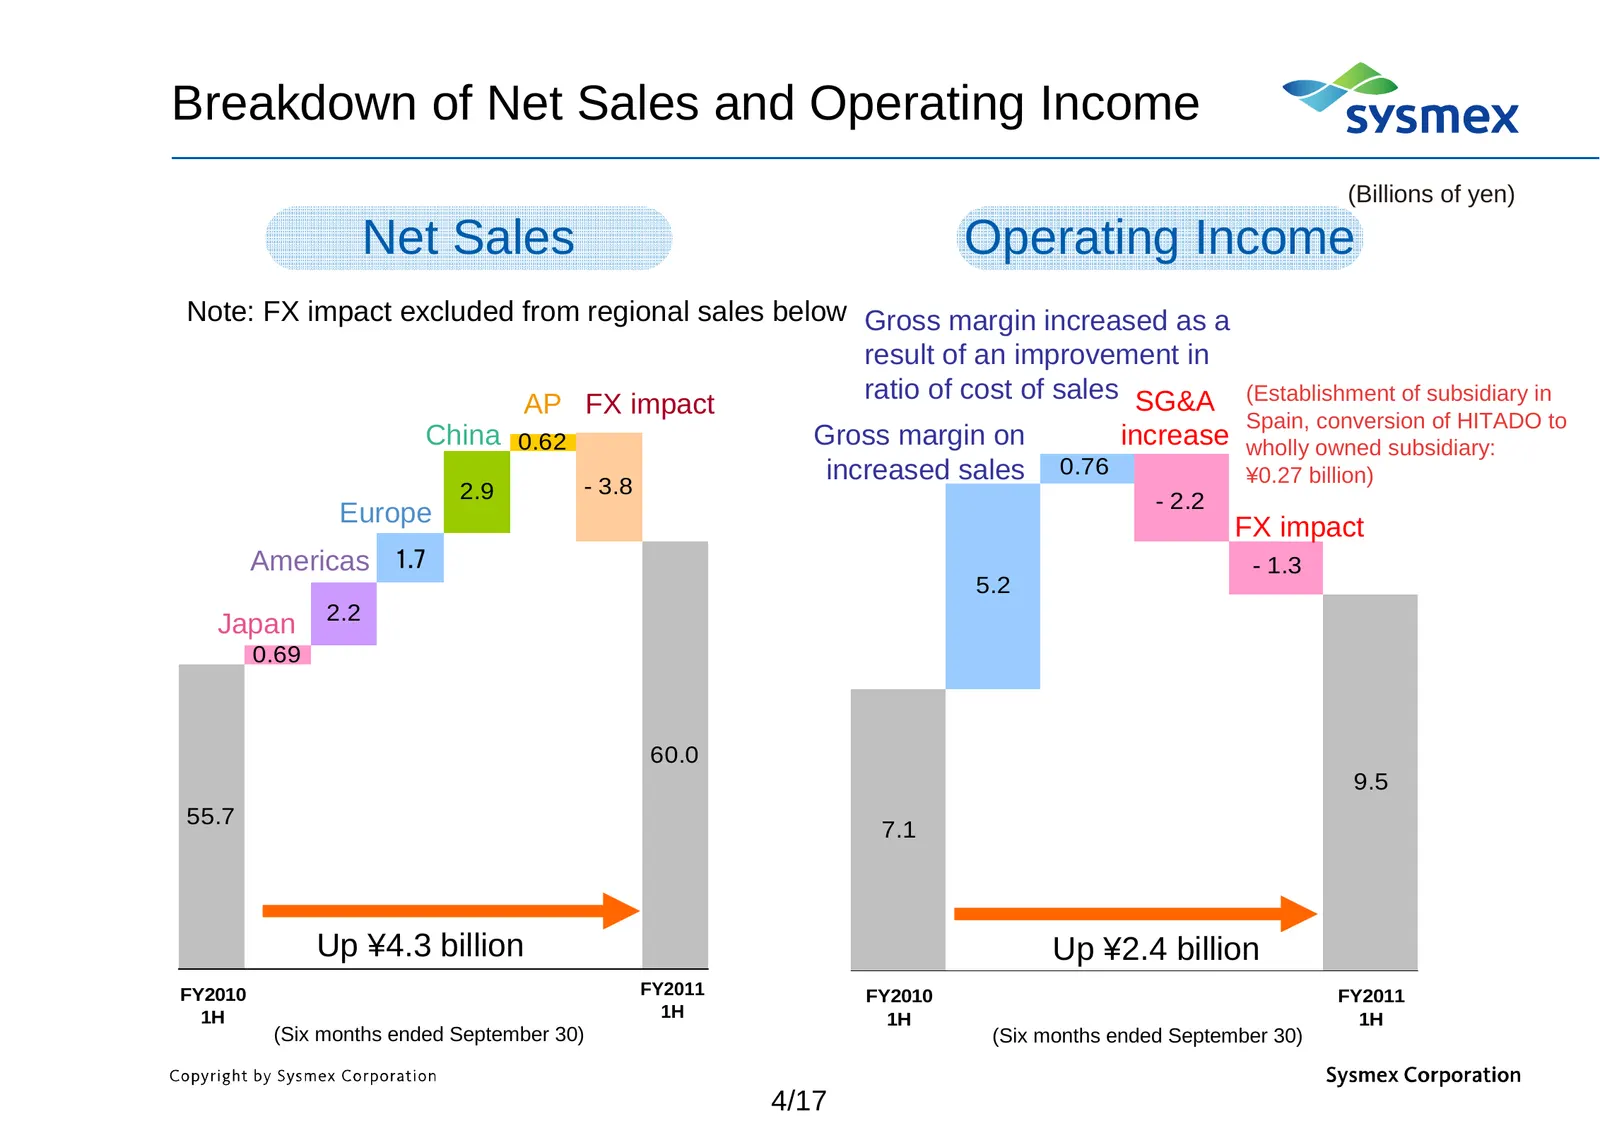
Slide 5: Breakdown of Net Sales and Operating Income
Breakdown of Net Sales and Operating Income (Billions of yen) Net Sales Operating Income Note: FX impact excluded from regional sales below Gross margin increased as a result of an improvement in ratio of cost of sales SG&A (Establishment of subsidiary in AP FX impact Spain, conversion of HITADO to
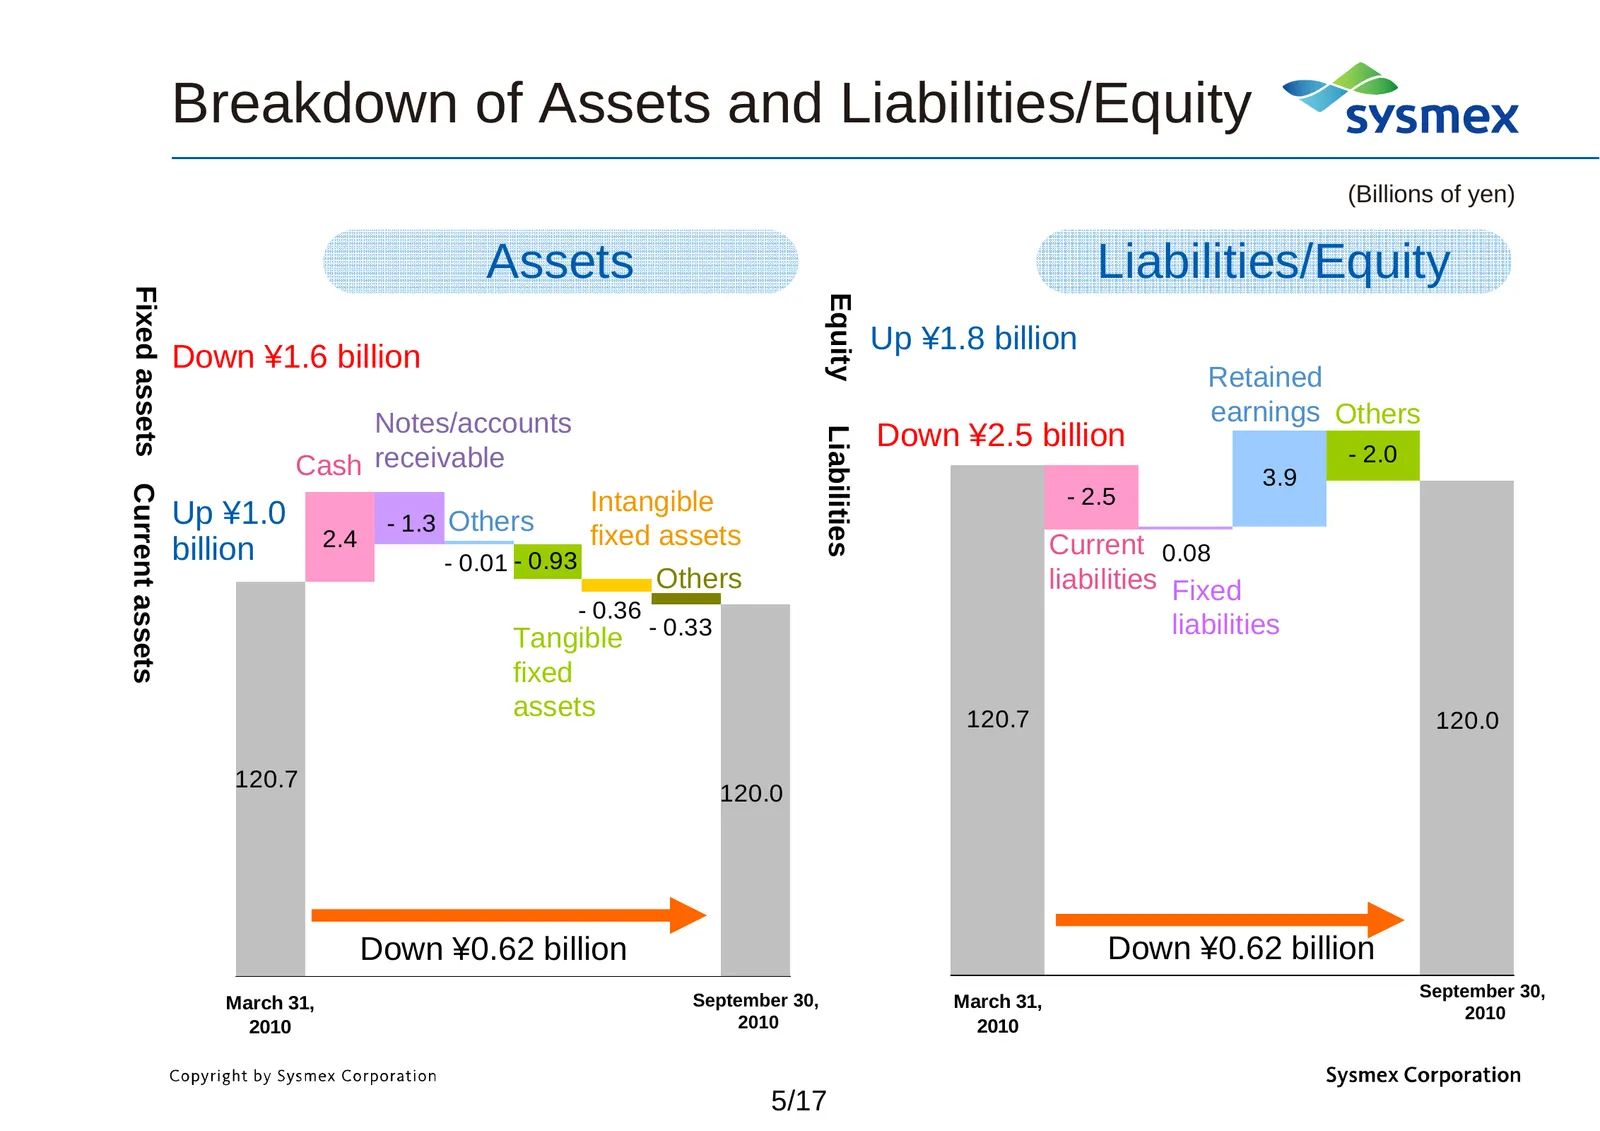
Slide 6: Breakdown of Assets and Liabilities/Equity
Breakdown of Assets and Liabilities/Equity (Billions of yen) Assets Liabilities/Equity Fixed assets Current assets Equity Up ¥1.8 billion Down ¥1.6 billion Retained Notes/accounts earnings Others Down ¥2.5 billion Liabilities - 2.0 Cash receivable 3.9 Intangible - 2.5 Up ¥1.0 - 1.3 Others billion 2.
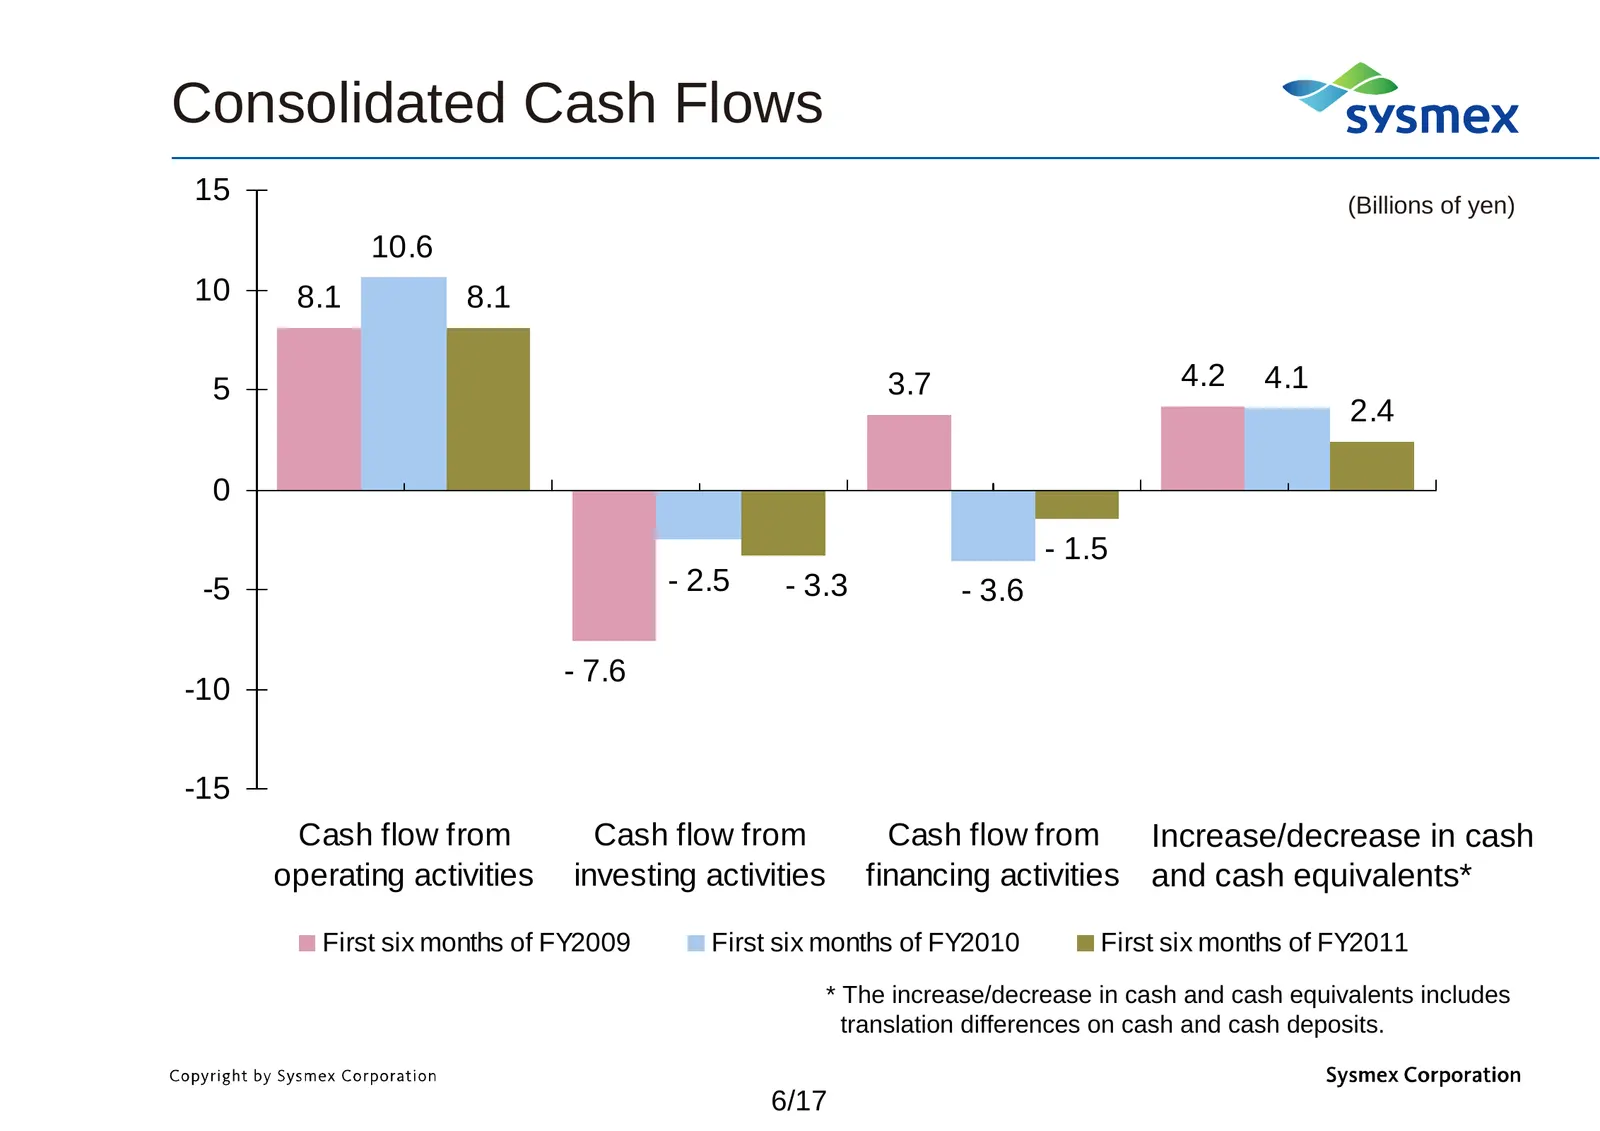
Slide 7: Consolidated Cash Flows
Consolidated Cash Flows 15 (Billions of yen) 10.6 10 8.1 8.1 5 3.7 4.2 4.1 2.4 0 - 1.5 -5 - 2.5 - 3.3 - 3.6 - 7.6 -10 -15 Cash flow from Cash flow from Cash flow from Increase/decrease in cash operating activities investing activities financing activities and cash equivalents* First six months of FY
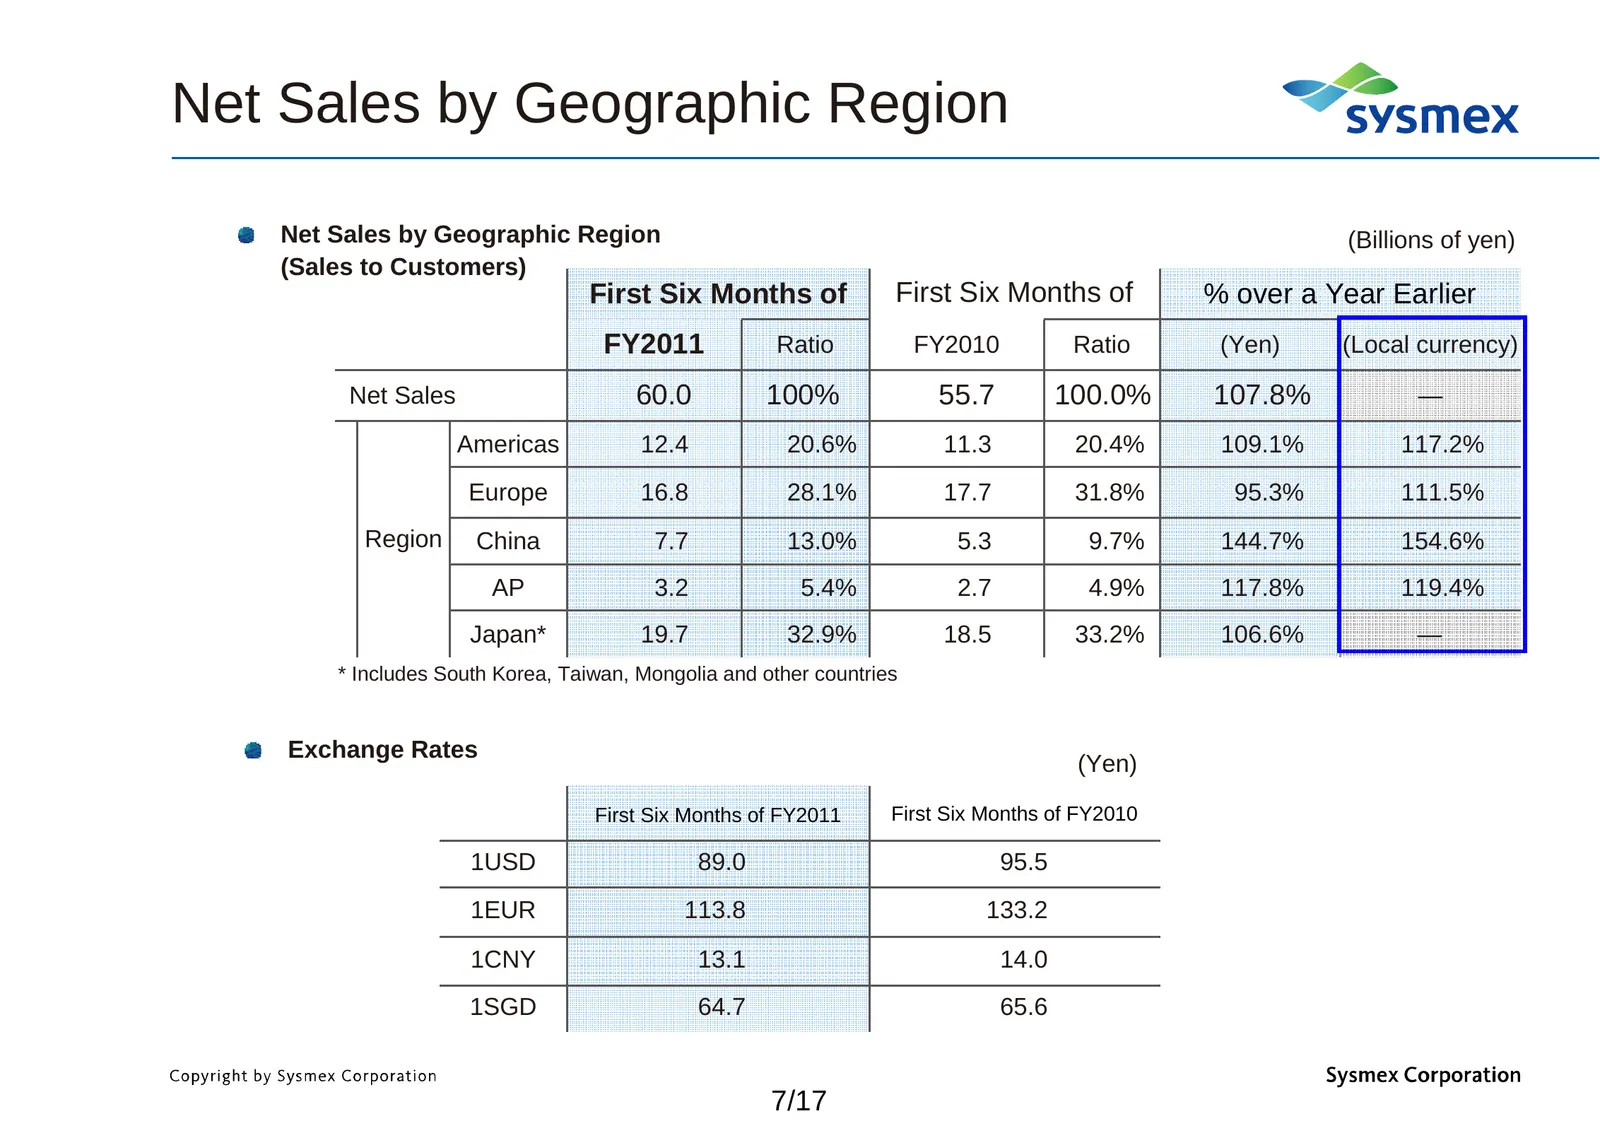
Slide 8: Net Sales by Geographic Region
Net Sales by Geographic Region Net Sales by Geographic Region (Billions of yen) (Sales to Customers) First Six Months of First Six Months of % over a Year Earlier FY2011 Ratio FY2010 Ratio (Yen) (Local currency) Net Sales 60.0 100% 55.7 100.0% 107.8% — Americas 12.4 20.6% 11.3 20.4% 109.1% 117.2% Eu
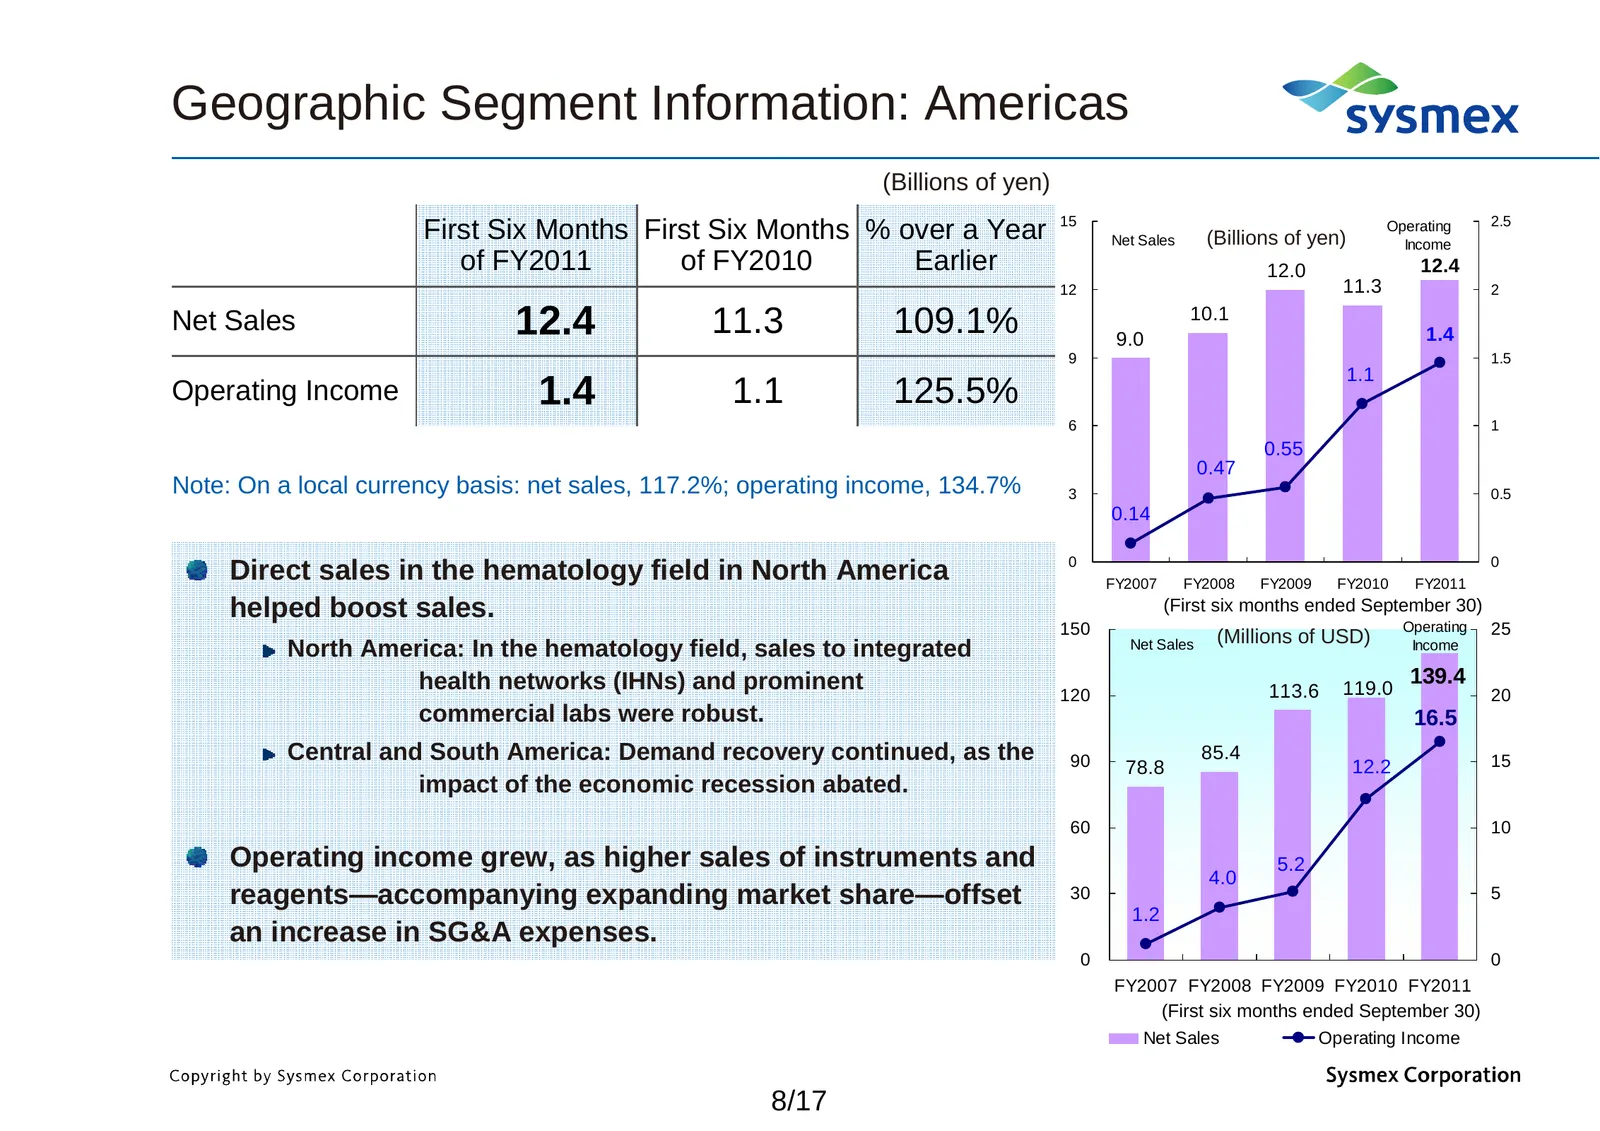
Slide 9: Geographic Segment Information: Americas
Geographic Segment Information: Americas (Billions of yen) First Six Months First Six Months % over a Year 15 Net Sales (Billions of yen) Operating Income 2.5 of FY2011 of FY2010 Earlier 12.0 12.4 12 11.3 2 Net Sales 12.4 11.3 109.1% 9.0 10.1 1.4 9 1.5 1.1 Operating Income 1.4 1.1 125.5% 6 1 0.55 0.
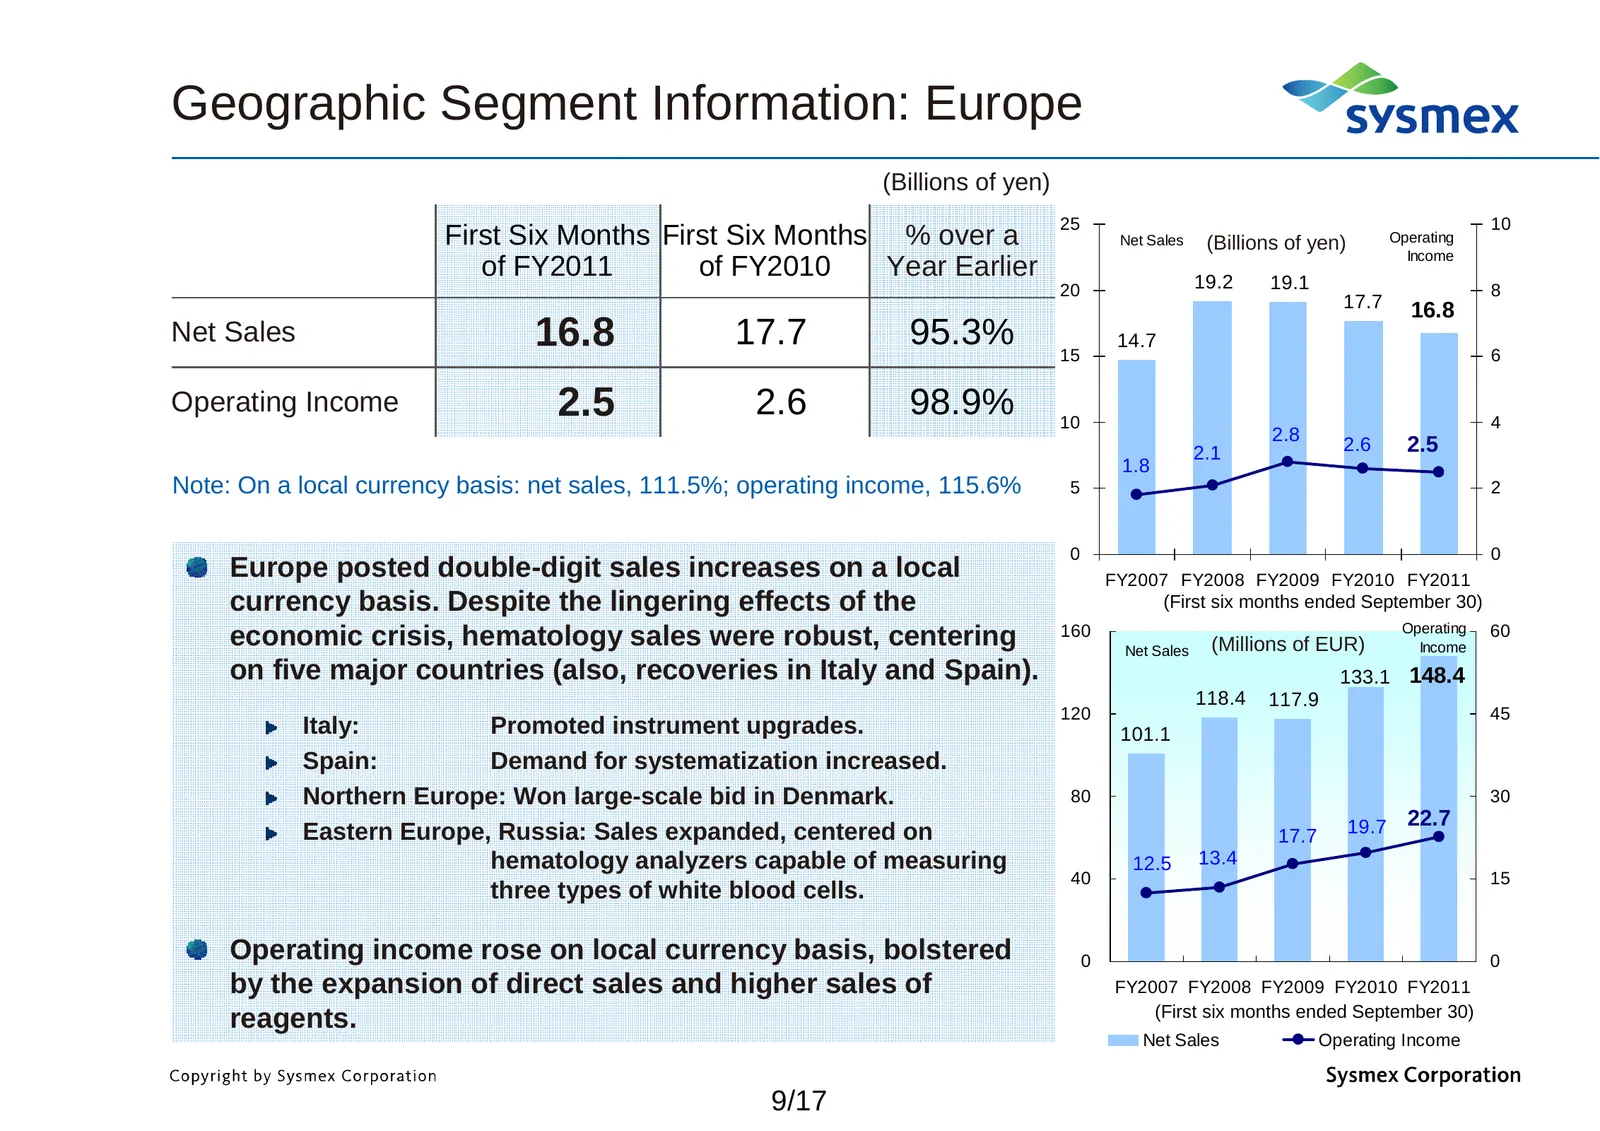
Slide 10: Geographic Segment Information: Europe
Geographic Segment Information: Europe (Billions of yen) 25 10 First Six Months First Six Months % over a Net Sales (Billions of yen) Operating Income of FY2011 of FY2010 Year Earlier 19.2 19.1 20 8 17.7 16.8 Net Sales 16.8 17.7 95.3% 15 14.7 6 Operating Income 2.5 2.6 98.9% 10 4 2.8 2.1 2.6 2.5 1.8
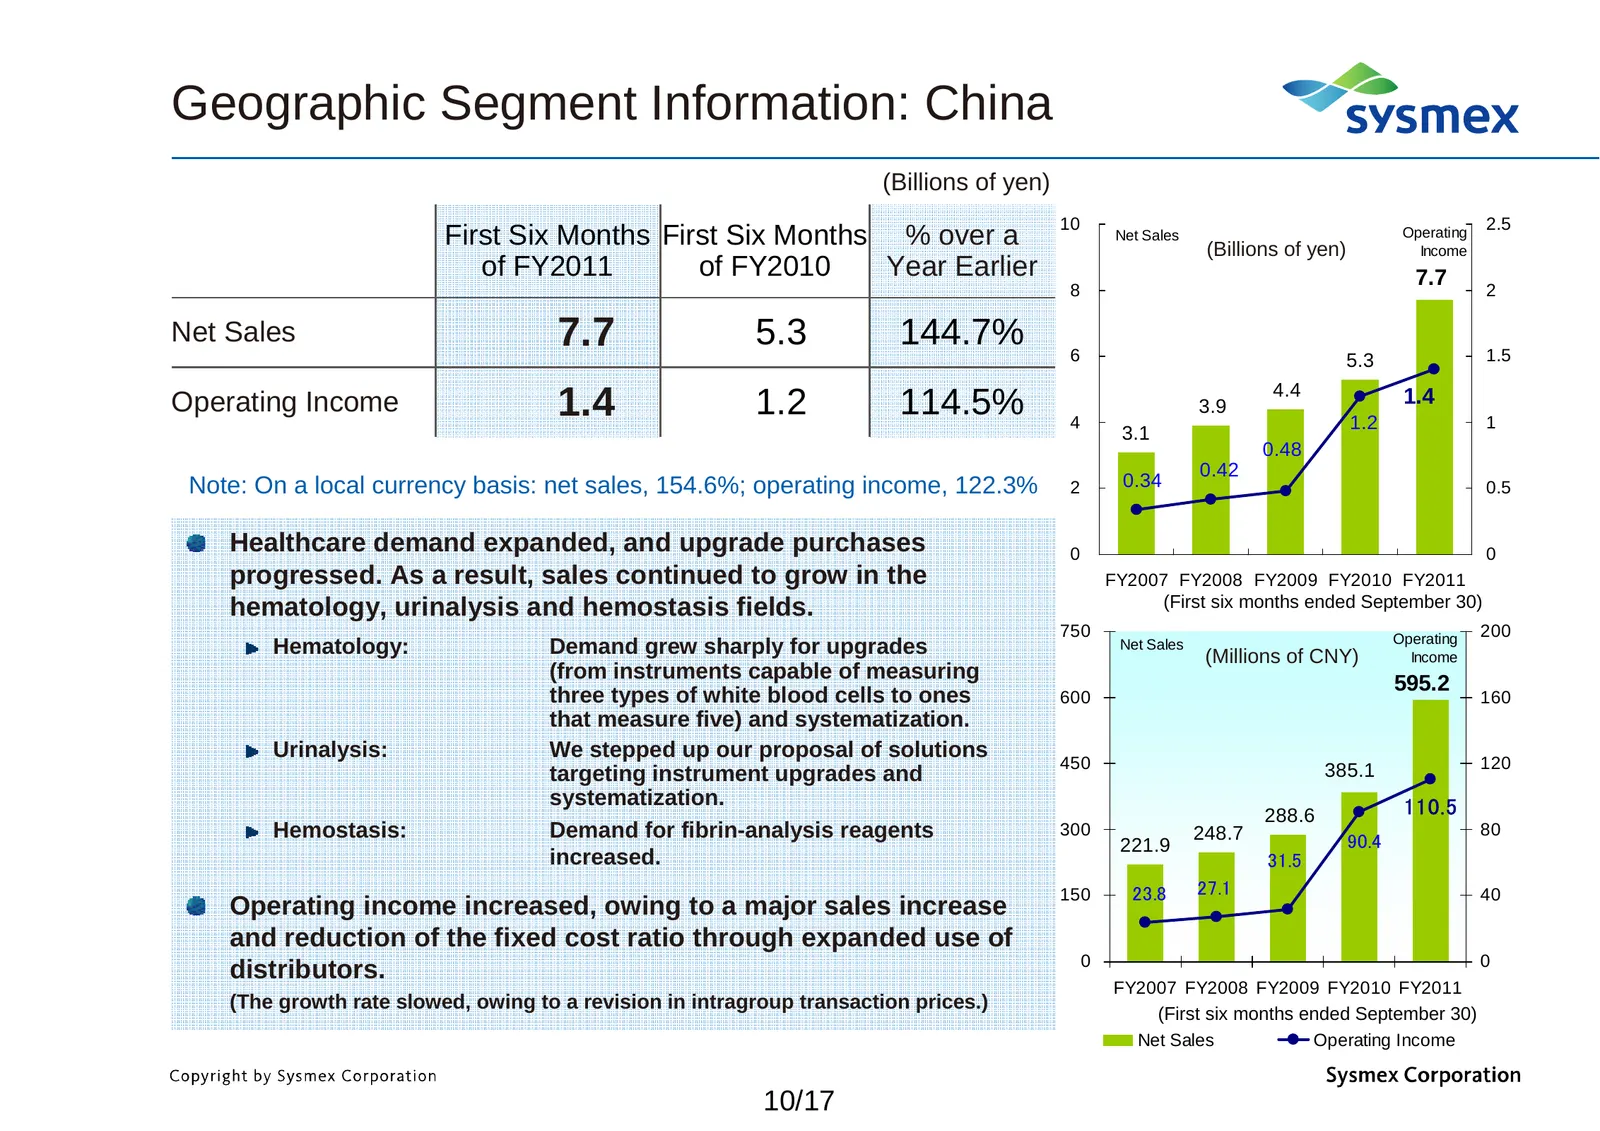
Slide 11: Geographic Segment Information: China
Geographic Segment Information: China (Billions of yen) 10 2.5 First Six Months First Six Months % over a Net Sales (Billions of yen) Operating Income of FY2011 of FY2010 Year Earlier 7.7 8 2 Net Sales 7.7 5.3 144.7% 6 1.5 5.3 4.4 Operating Income 1.4 1.2 114.5% 4 3.9 1.2 1.4 1 3.1 0.48 0.42 Note: O
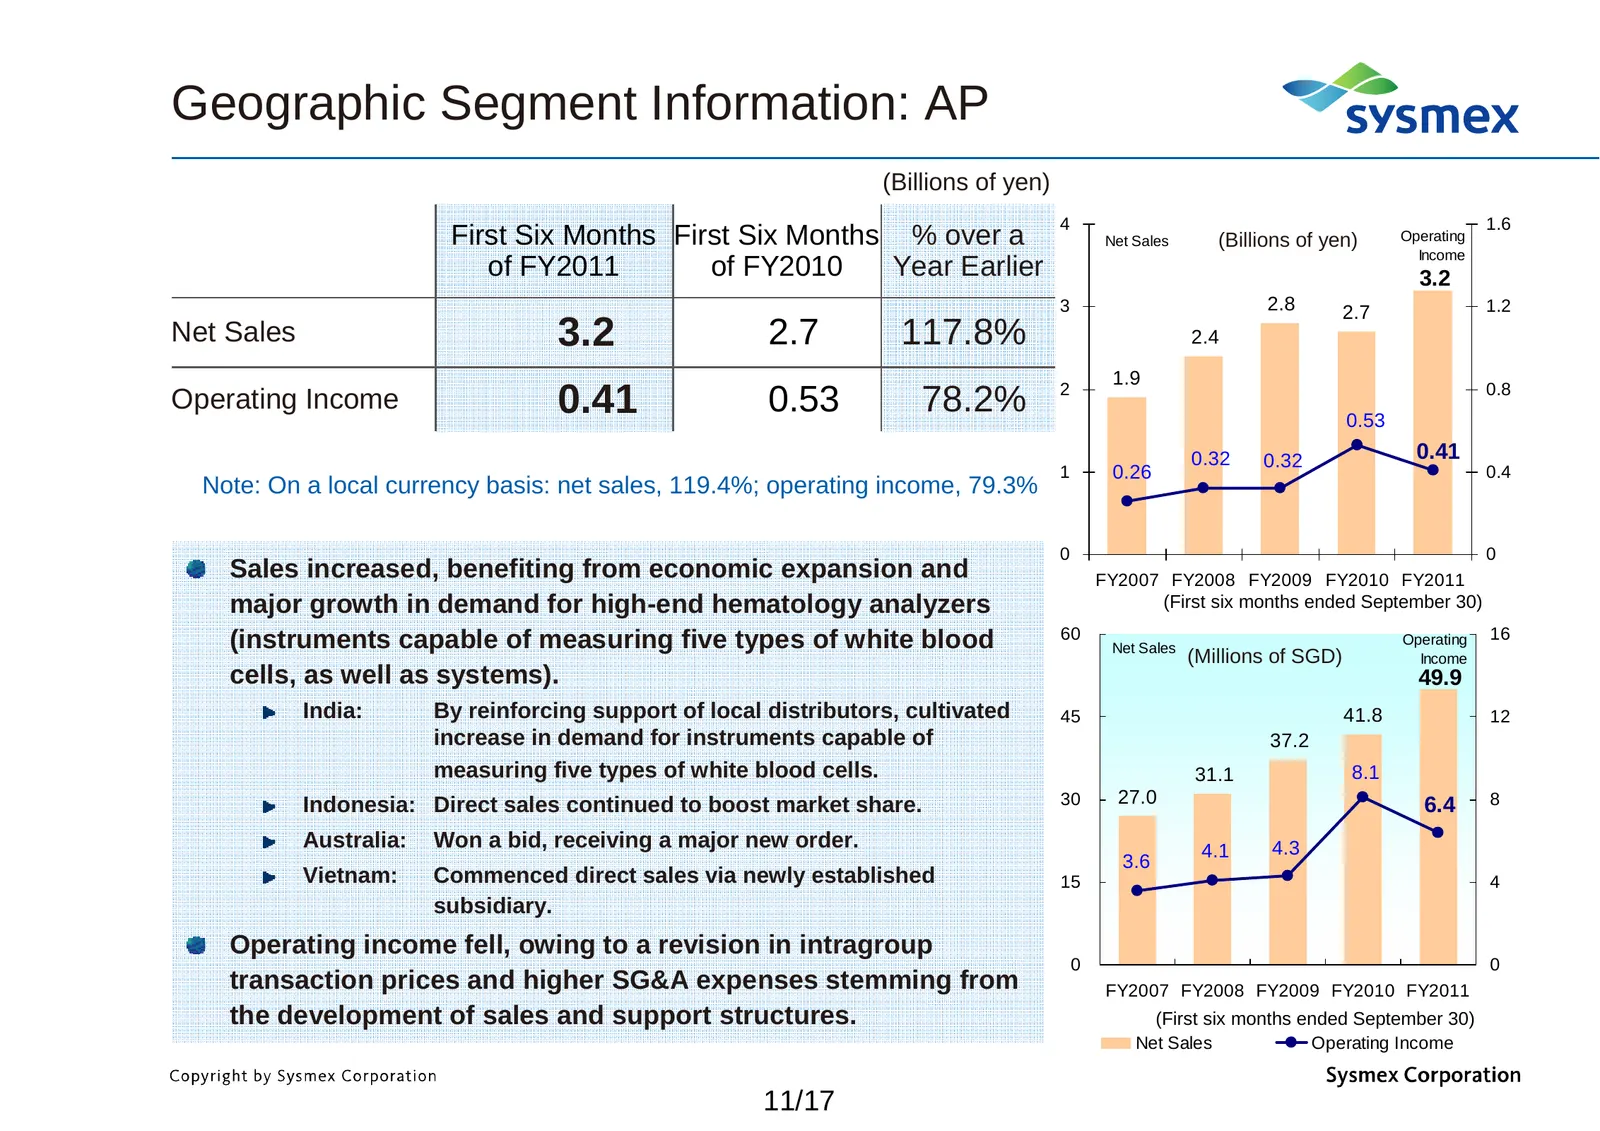
Slide 12: Geographic Segment Information: AP
Geographic Segment Information: AP (Billions of yen) 4 1.6 First Six Months First Six Months % over a Net Sales (Billions of yen) Operating Income of FY2011 of FY2010 Year Earlier 3.2 3 2.8 2.7 1.2 Net Sales 3.2 2.7 117.8% 2.4 1.9 2 0.8 Operating Income 0.41 0.53 78.2% 0.53 0.32 0.32 0.41 1 0.26 0.4
Slide 13: Geographic Segment Information: Japan
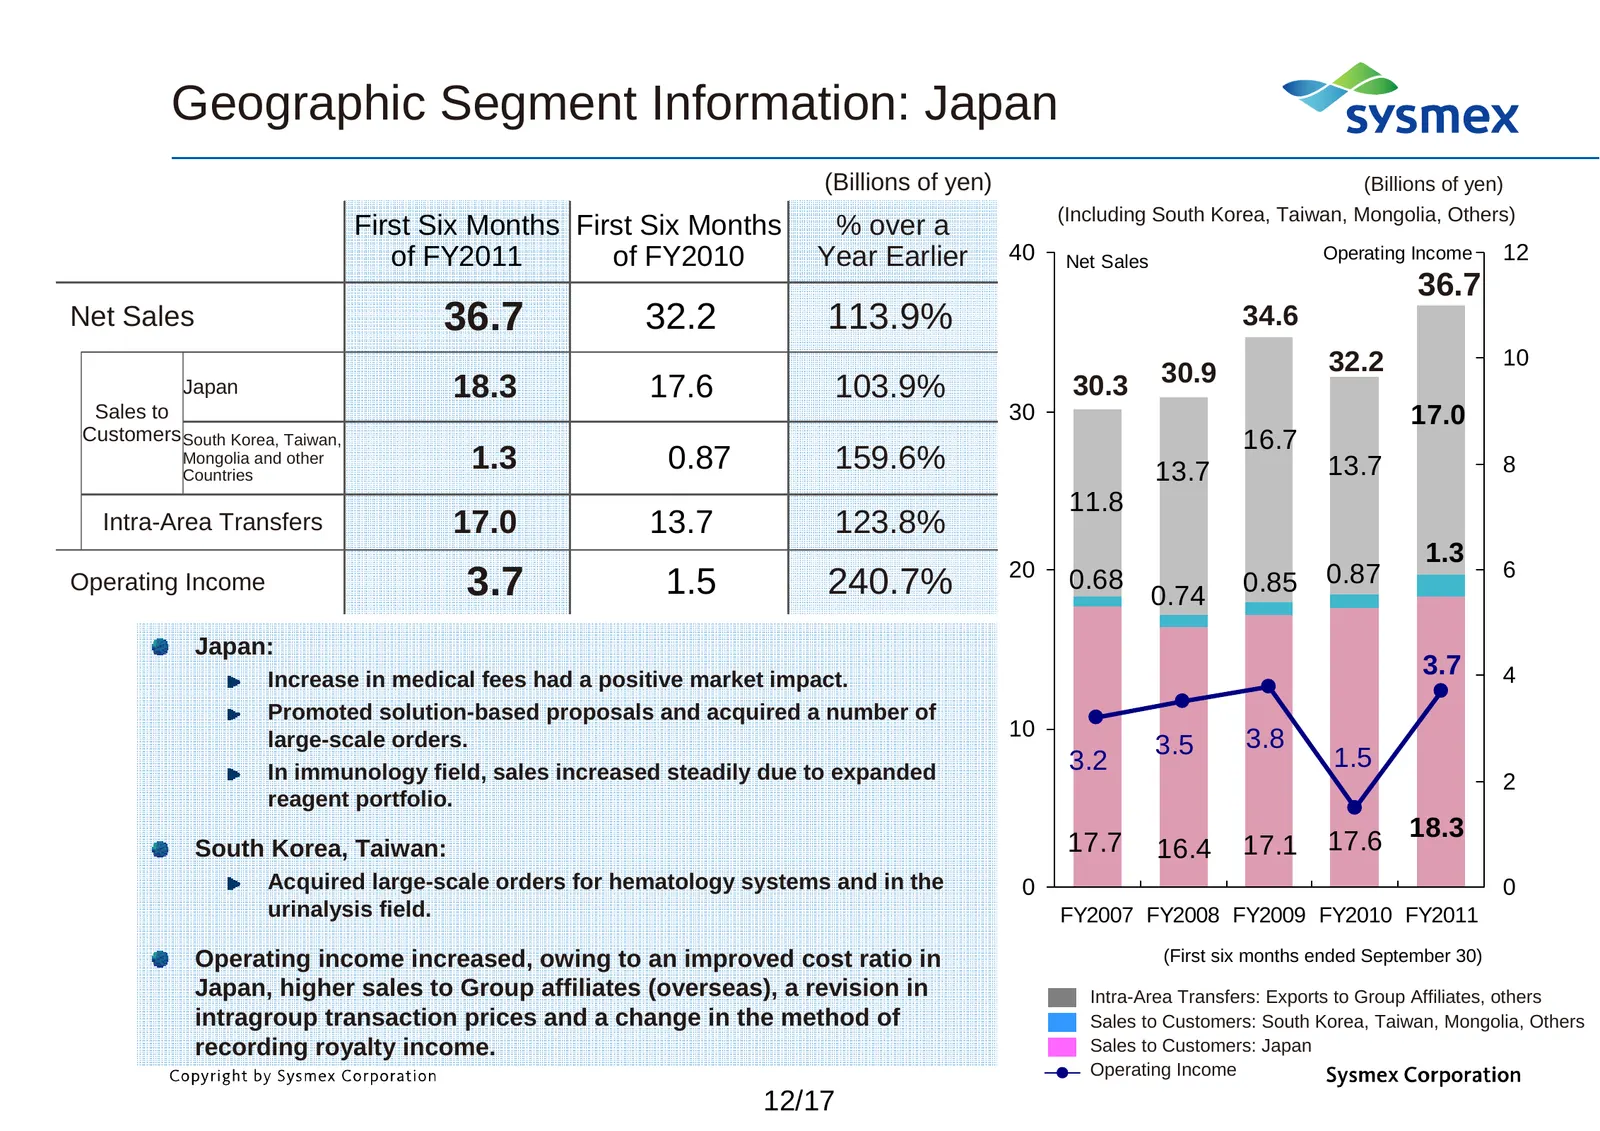
Geographic Segment Information: Japan (Billions of yen) (Billions of yen) (Including South Korea, Taiwan, Mongolia, Others) First Six Months First Six Months % over a of FY2011 of FY2010 Year Earlier 40 Net Sales Operating Income 12 36.7 Net Sales 36.7 32.2 113.9% 34.6 32.2 10 30.9 Japan 18.3 17.6 1
Slide 14: Chapter 2 Consolidated Earnings Forecast for FY2011
Chapter 2 Consolidated Earnings Forecast for the Fiscal Year Ending March 31, 2011
Slide 15: Operating Environment
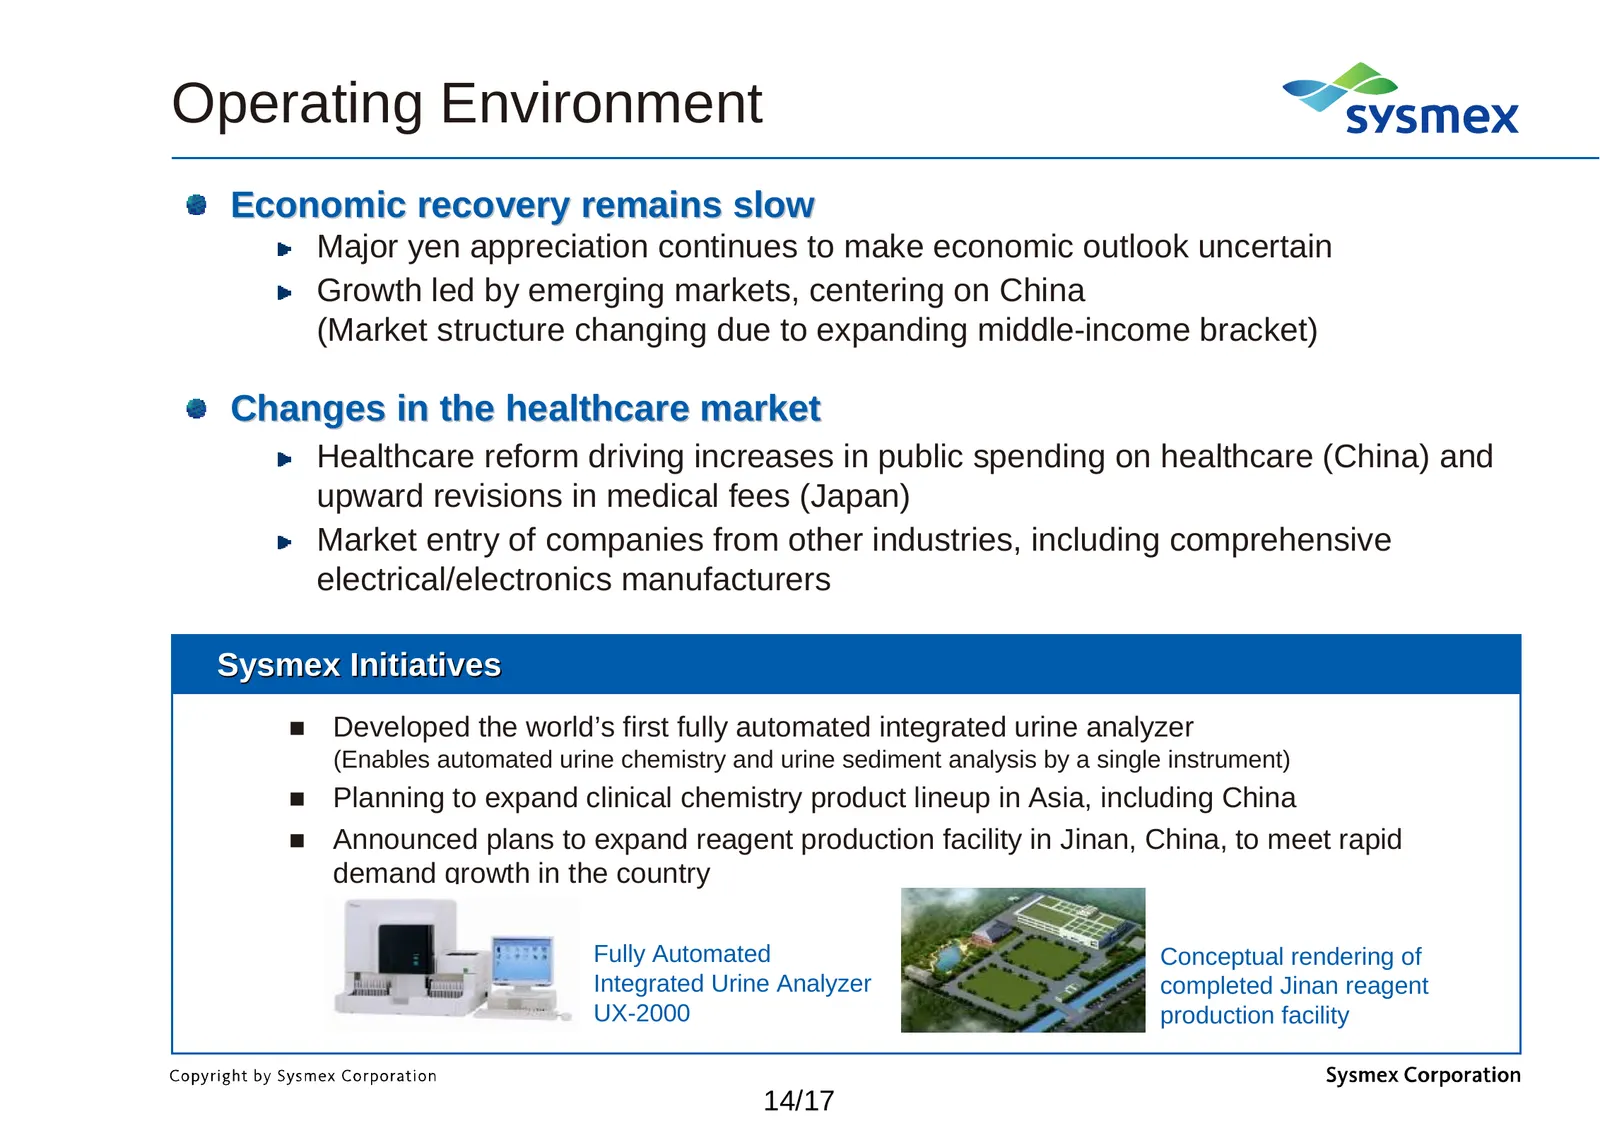
Operating Environment Economic recovery remains slow Major yen appreciation continues to make economic outlook uncertain Growth led by emerging markets, centering on China (Market structure changing due to expanding middle-income bracket) Changes in the healthcare market Healthcare reform driving in
Slide 16: Consolidated Earnings Forecast
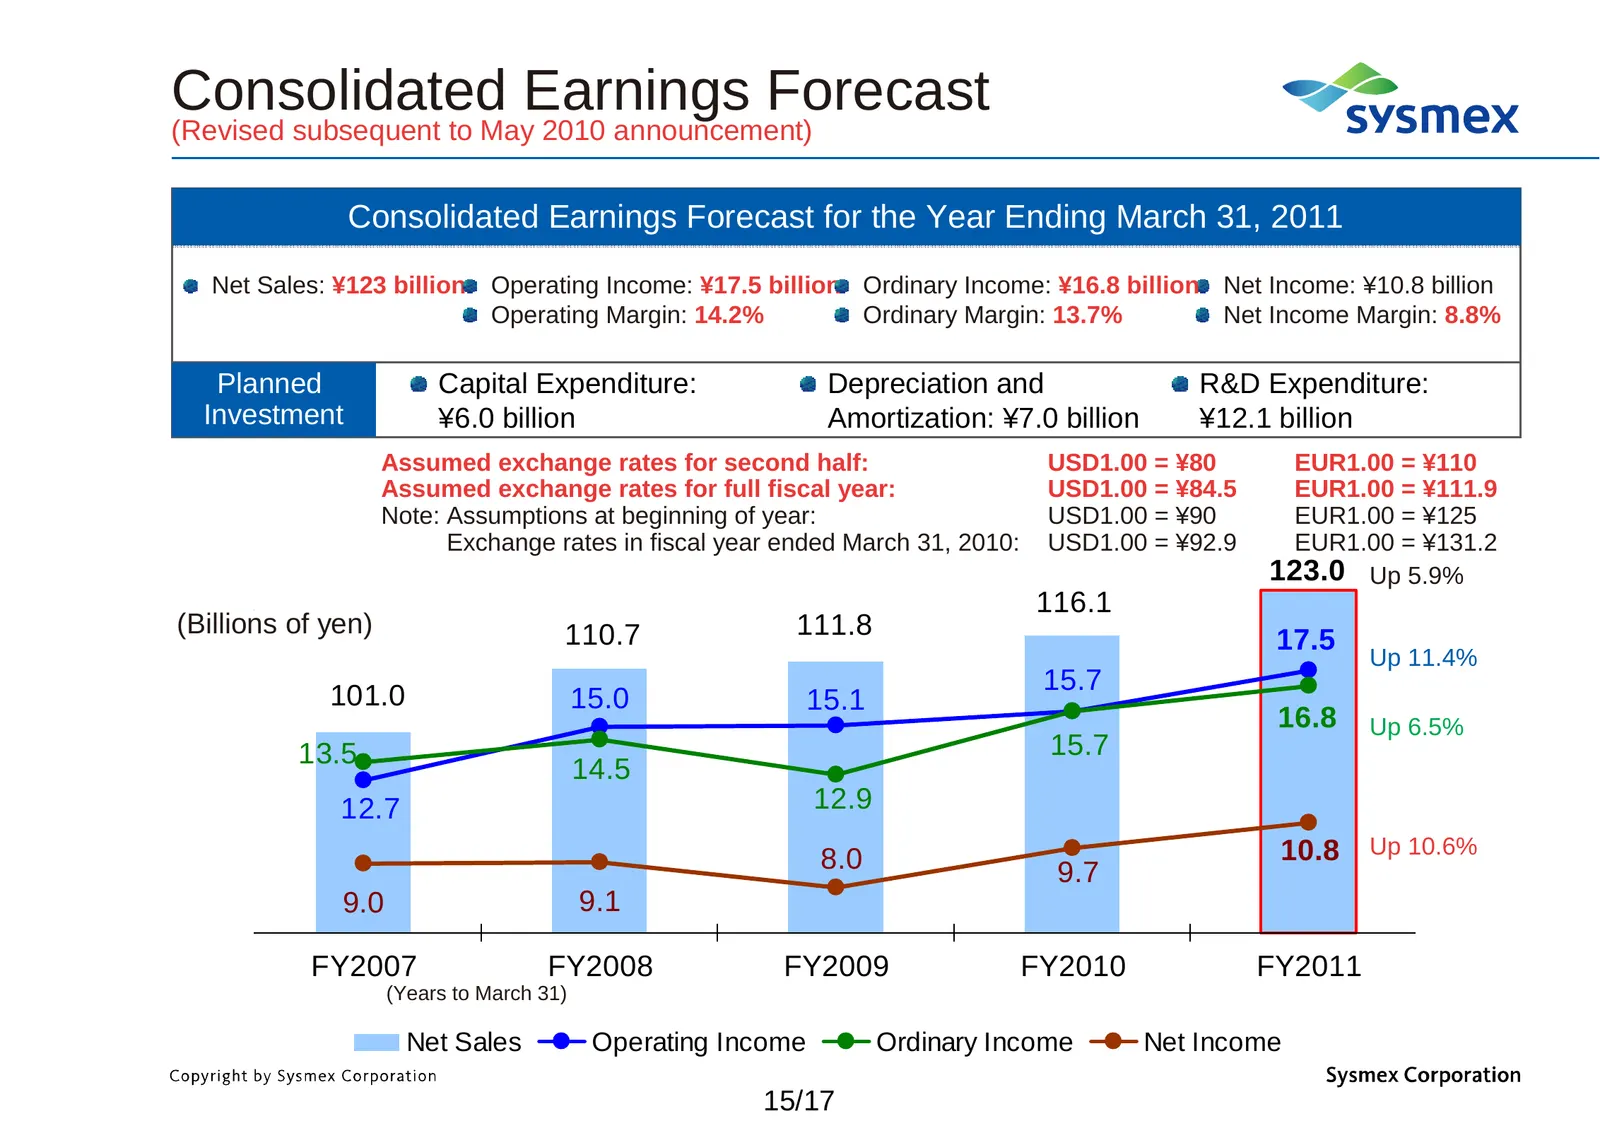
Consolidated Earnings Forecast (Revised subsequent to May 2010 announcement) Consolidated Earnings Forecast for the Year Ending March 31, 2011 Net Sales: ¥123 billion Operating Income: ¥17.5 billion Ordinary Income: ¥16.8 billion Net Income: ¥10.8 billion Operating Margin: 14.2% Ordinary Margin: 13.
Slide 17: Financial Targets: Sales and Operating Income by Region
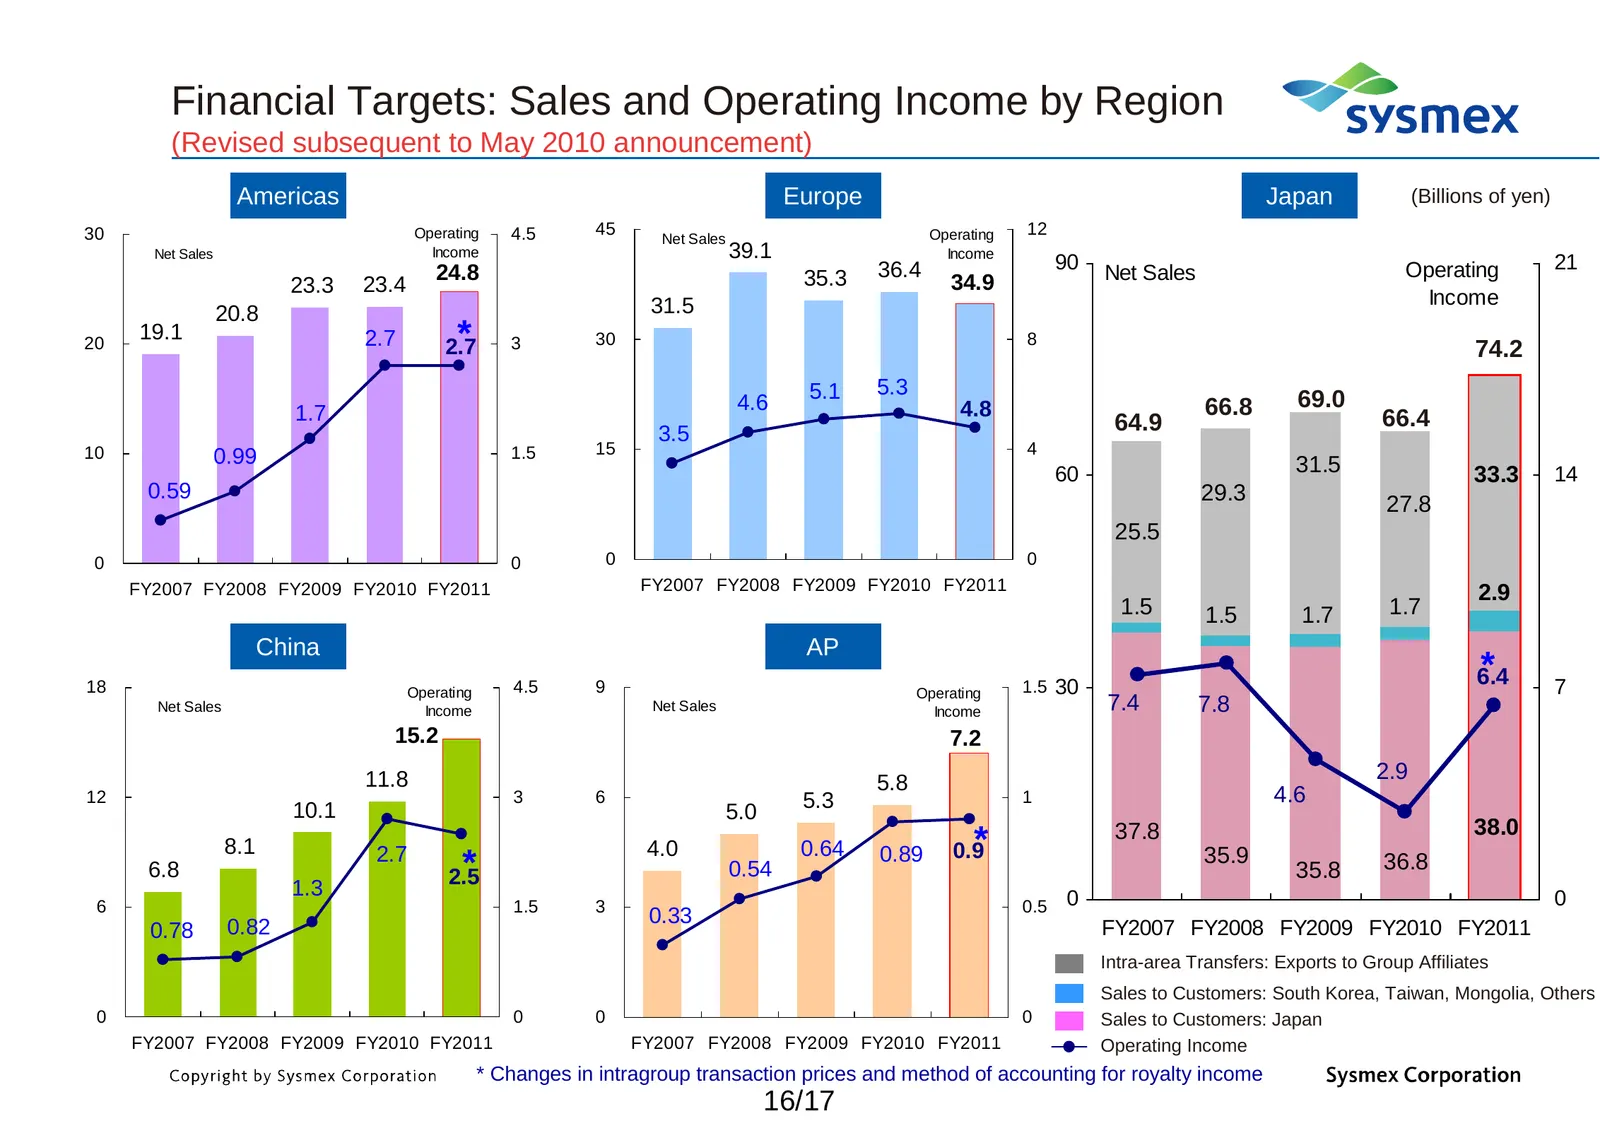
Financial Targets: Sales and Operating Income by Region (Revised subsequent to May 2010 announcement) Americas Europe Japan (Billions of yen) 30 Operating 4.5 45 Operating 12 Net Sales Net Sales Income 39.1 Income 24.8 36.4 90 Net Sales Operating 21 23.3 23.4 35.3 34.9 31.5 Income 20.8 20 19.1 2.7 *
Slide 18: Projected Dividend
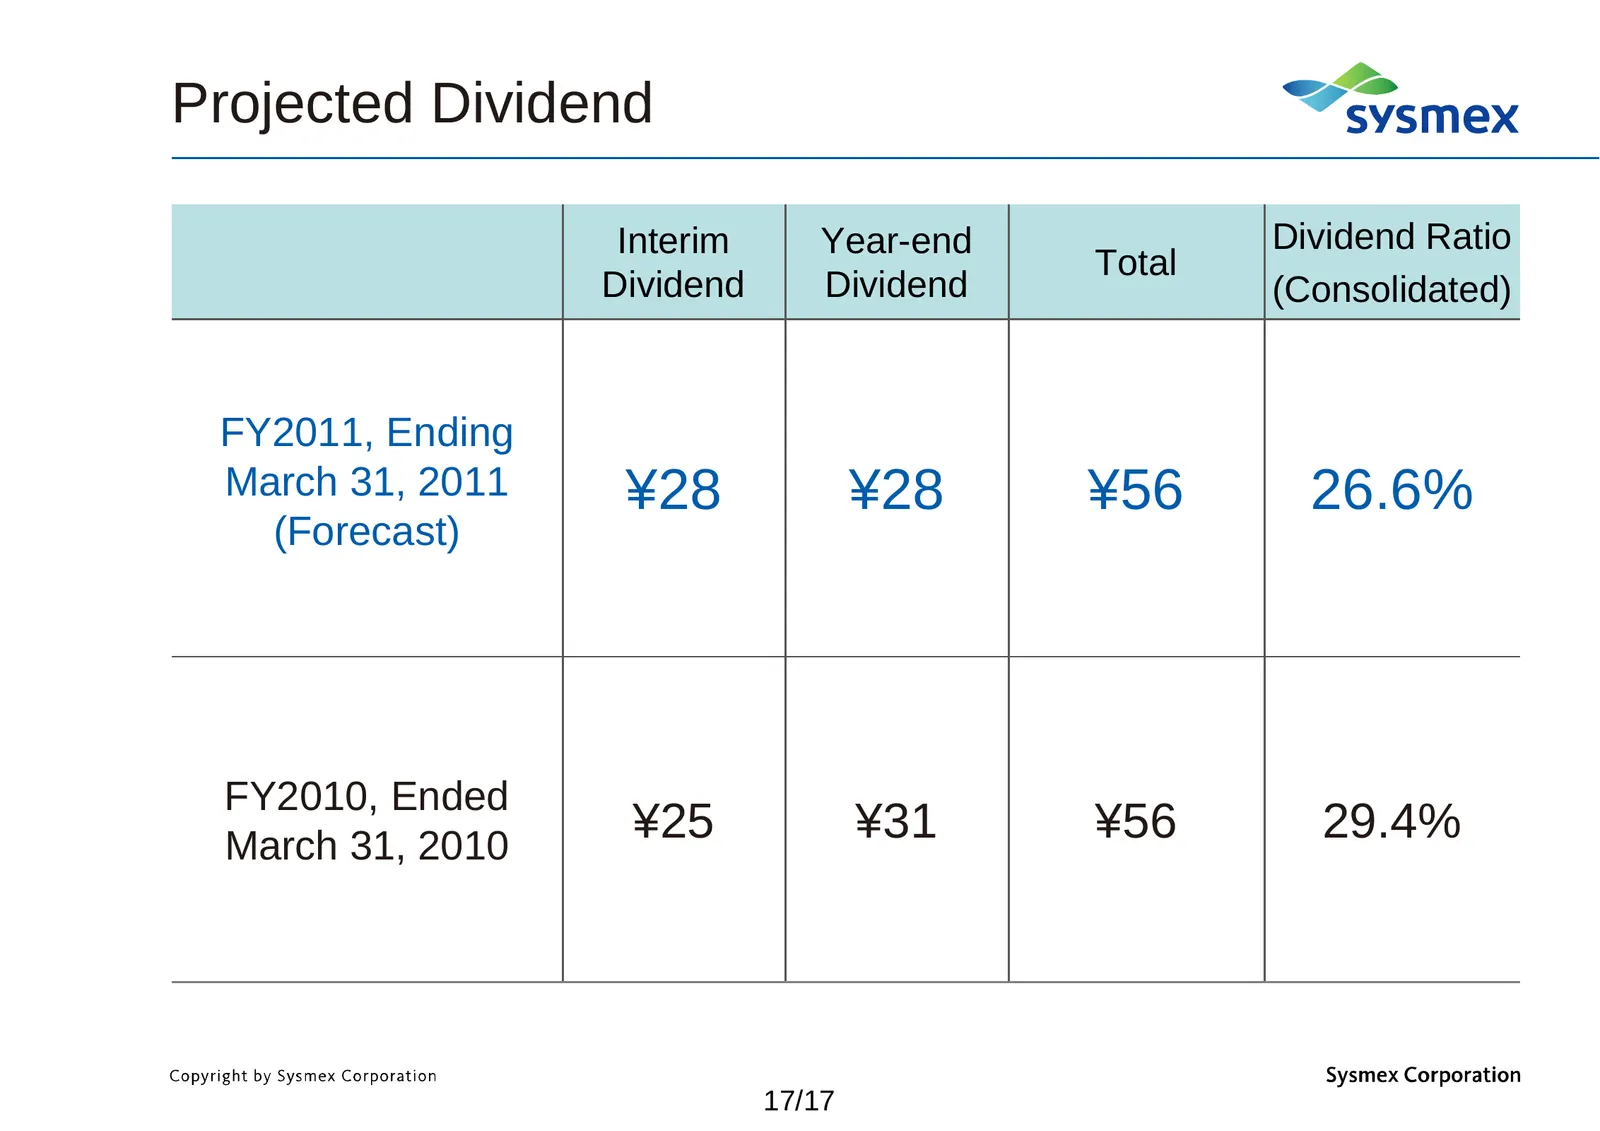
Projected Dividend Interim Year-end Dividend Ratio Total Dividend Dividend (Consolidated) FY2011, Ending March 31, 2011 ¥28 ¥28 ¥56 26.6% (Forecast) FY2010, Ended March 31, 2010 ¥25 ¥31 ¥56 29.4% 17/17
Slide 19: Contact
Chapter 3 Contact: IR & Corporate Communication Div. Phone: +81-7878-265-0500 Email: info@sysmex.co.jp URL:
Source: Internet Archive copy of sysmex.co.jp
More decks from Sysmex Corporation
 Investor Presentation (November 2026)43 slides · Nov 10, 2026
 Q1 FY2027 Earnings Presentation33 slides · Aug 7, 2026
 Investor Presentation (2025)43 slides · 2025
 FY2011 Earnings Presentation23 slides · May 10, 2012
 FY2012 Earnings Presentation23 slides · May 10, 2012
 9M FY2012 Earnings Presentation12 slides · Feb 3, 2012