EPIQ Systems — Q2 2012 Earnings Presentation
14 slides from EPIQ Systems's earnings presentation, Jul 31, 2012
Slide 1: Second Quarter 2012 Earnings Conference Call
NASDAQ: EPIQ www.epiqsystems.com Secon Quarter 2012 Earnings Conference Call July 31, 2012
Slide 2: Cautionary Statements
Cautionary Statements This presentation contains forward-looking statements within the meaning of Section 27A of the Securities Act of 1933, as amended, and Section 21E of the Securities Exchange Act of 1934, as amended, which include, but are not limited to, any projection or expectation of earning
Slide 3: Non-GAAP Measures
AAP Measures This presentation includes the following non-GAAP financial measures: (i) non-GAAP net income (net income adjusted for amortization of acquisition intangibles, share-based compensation, acquisition-related expense, capitalized loan fee amortization, litigation expense/settlement, and th
Slide 4: Key Events
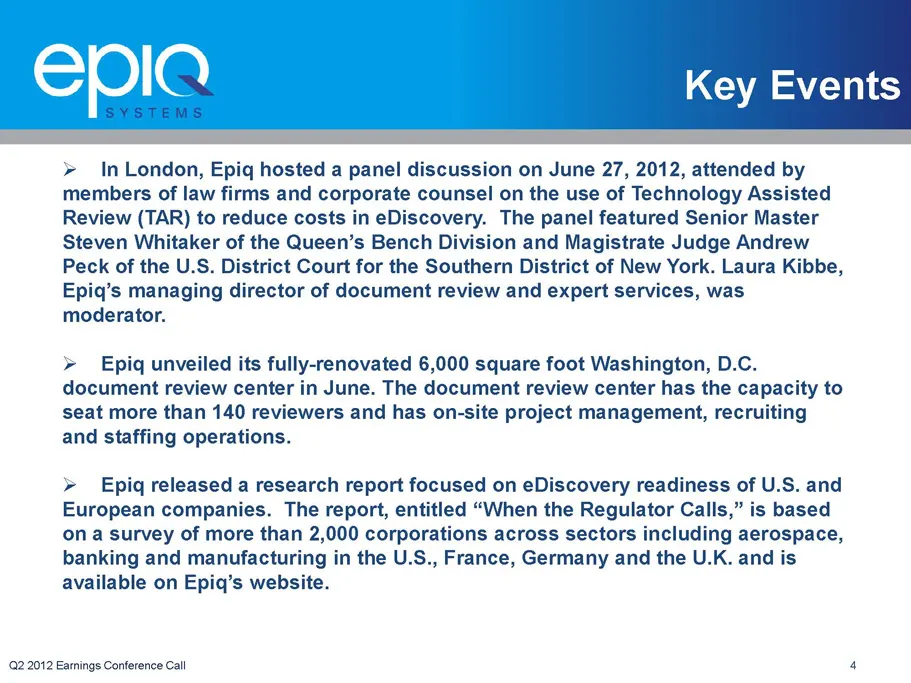
~ SYSTEMS > InLondon, Epiq hosted a panel discussion on June 27, 2012, attended by members of law firms and corporate counsel on the use of Technology Assisted Review (TAR) to reduce costs in eDiscovery. The panel featured Senior Master Steven Whitaker of the Queen’s Bench Division and Magistrate Ju
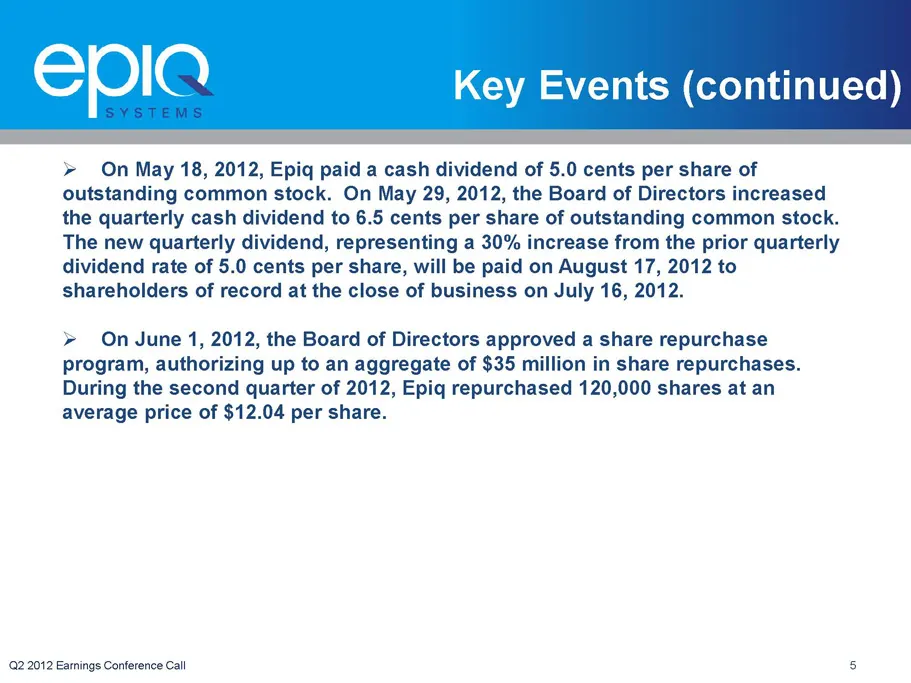
Slide 5: Key Events (continued)
Epla Key Events (continued) > On May 18, 2012, Epiq paid a cash dividend of 5.0 cents per share of outstanding common stock. On May 29, 2012, the Board of Directors increased the quarterly cash dividend to 6.5 cents per share of outstanding common stock. The new quarterly dividend, representing a 30
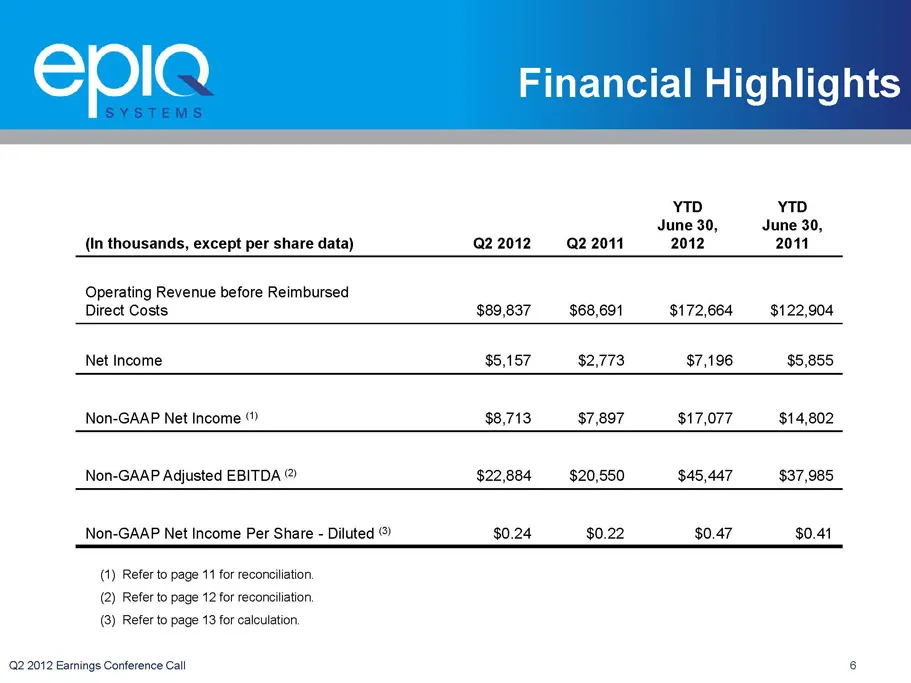
Slide 6: Financial Highlights
Financial Highlights YTD YTD June 30, June 30, (in thousands, except per share data) 22012 Q22011 2012 2011 Operating Revenue before Reimbursed Direct Costs $89,837 $68,691_——«$172,664 $122,904 Net Income $5,157 $2,773 $7,196 $5,855 Non-GAAP Net Income (? $8,713 $7,897 $17,077 $14,802 Non-GAAP Adjus
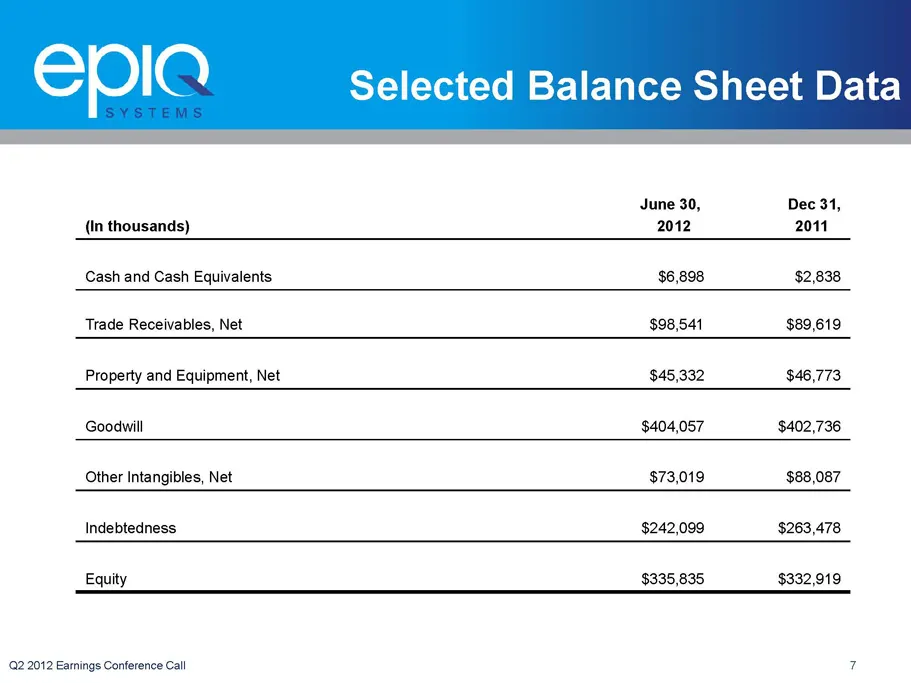
Slide 7: Selected Balance Sheet Data
Selected Balance Sheet Data June 30, Dec 31, (in thousands) 2012 2011 Cash and Cash Equivalents $6,898 $2,838 Trade Receivables, Net $98,541 $89,619 Property and Equipment, Net $45,332 $46,773 Goodwill $404,057 $402,736 Other Intangibles, Net $73,019 $88,087 Indebtedness $242,099 $263,478 Equity $33
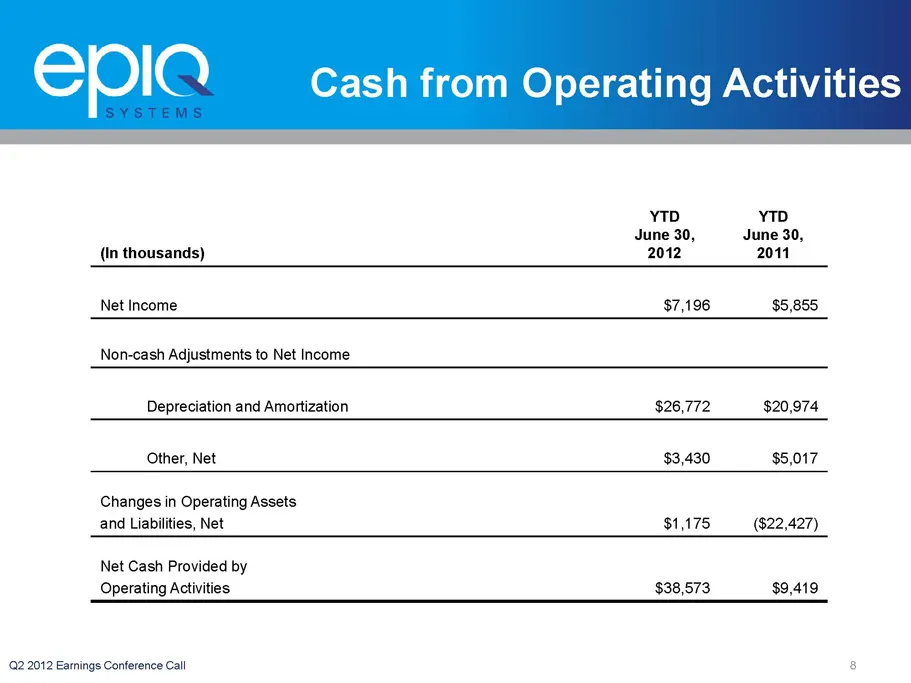
Slide 8: Cash Flow
Epla Cash YTD YTD June 30, June 30, (in thousands) 2012 2011 Net Income $7,196 $5,855 Non-cash Adjustments to Net Income Depreciation and Amortization $26,772 $20,974 Other, Net $3,430 $5,017 Changes in Operating Assets and Liabilities, Net $1,175 ($22,427) Net Cash Provided by Operating Activities,
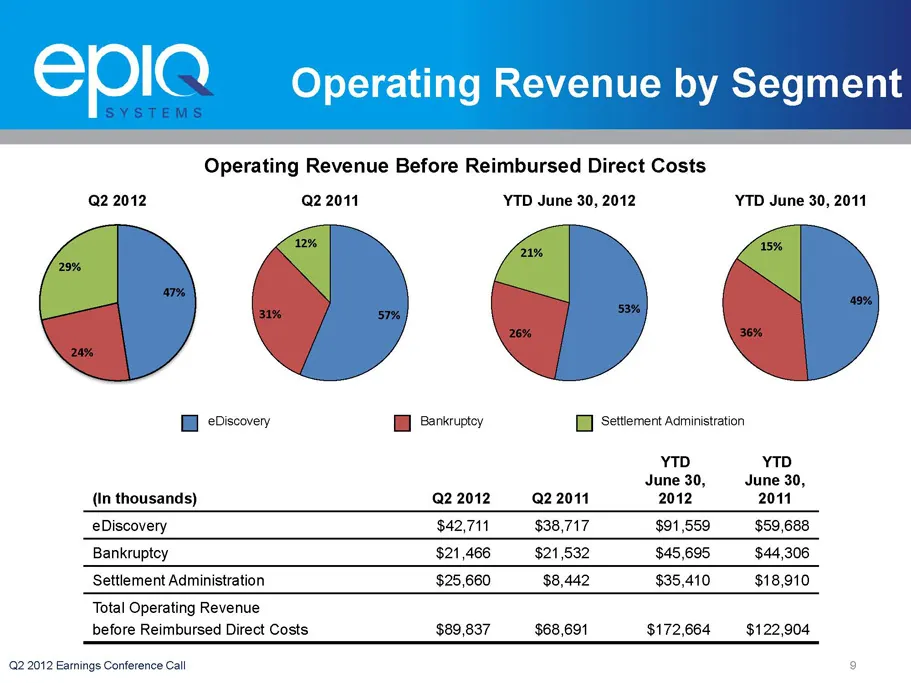
Slide 9: Operating Revenue Before Reimbursed Direct Costs
™~ SYSTEMS Operating Revenue Before Reimbursed Direct Costs Q2 2012 Q22011 YTD June 30, 2012 YTD June 30, 2011 im} eDiscovery B Bankruptcy i | Settlement Administration YTD YTD June 30, June 30, (in thousands) Q22012 _@22011 2012 2011 eDiscovery $42,711 $38,717 $91,559 $59,688 Bankruptcy $21,466 $21
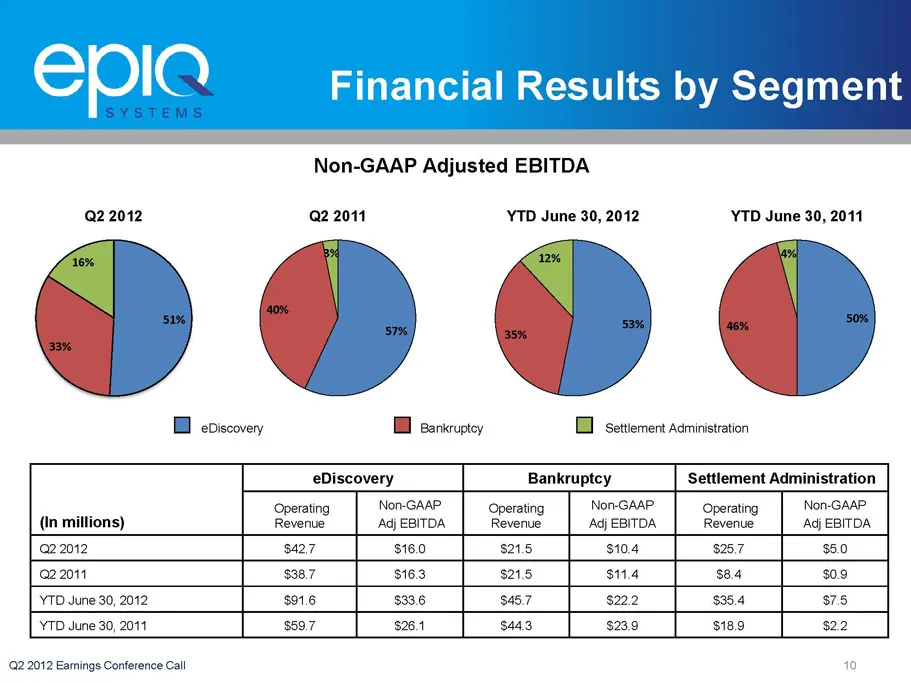
Slide 10: Non-GAAP Adjusted EBITDA
Non-GAAP Adjusted EBITDA Q2 2012 Q2 2011 YTD June 30, 2012 YTD June 30, 2011 BB eviscovery BB eankruptoy DD settiement administration eDiscovery Bankruptcy Settlement Administration Operating Non-GAAP | Operating | Non-GAAP | Operating | Non-GAAP (In millions) Revenue AGJEBITDA | Revenue | AdjesiToA
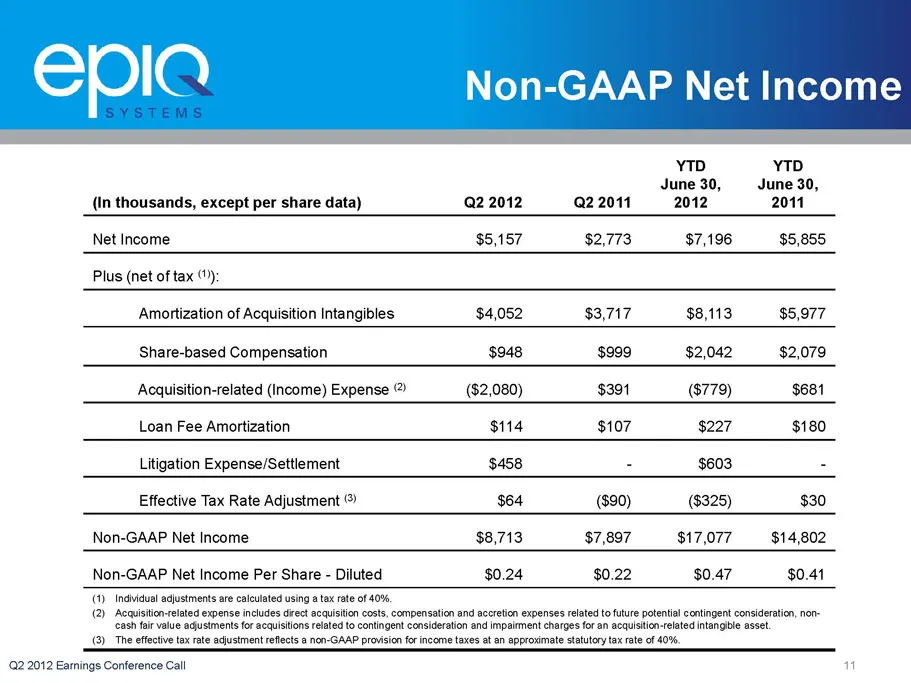
Slide 11: Non-GAAP Net Income
Non-GAAP Net Income YTD YTD June 30, June 30, (in thousands, except per share data) Q2 2012 22011 2012 2011 Net Income $5,157 $2,773 $7,196 $5,855 Plus (net of tax () Amortization of Acquisition Intangibles $4,052 $3,717 $8,113 $5,977 Share-based Compensation $948 $999 $2,042 $2,079 Acquisition-rela
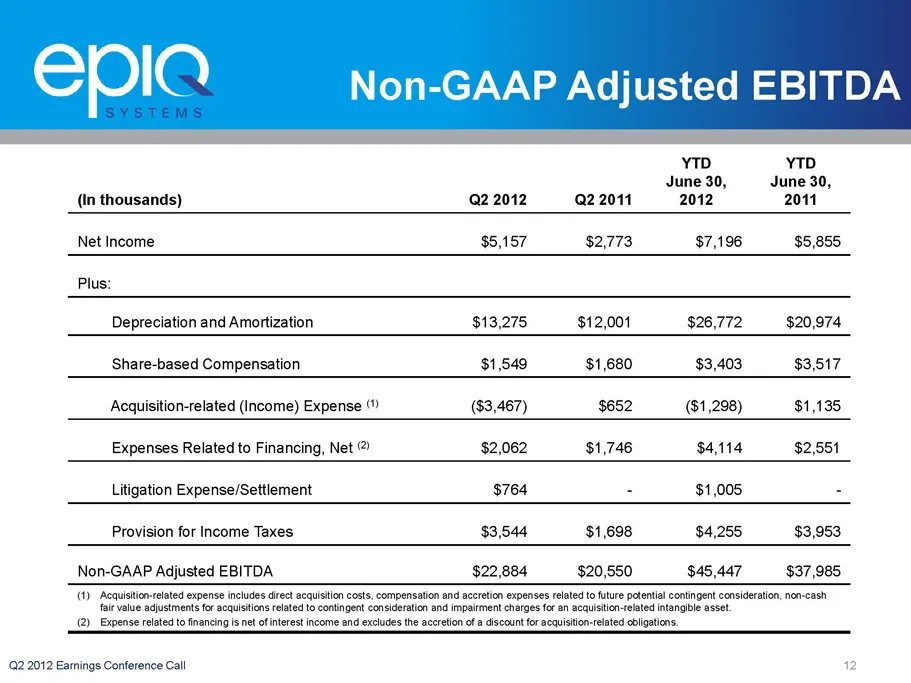
Slide 12: Non-GAAP Adjusted EBITDA
Epla Non-GAAP Adjusted EBITDA YTD YTD June 30, June 30, (in thousands) Q2 2012 Q2 2011 2012 2011 Net Income $5,157 $2,773 $7,196 $5,855 Plus: Depreciation and Amortization $13,275 $12,001 $26,772 $20,974 Share-based Compensation $1,549 $1,680 $3,403 $3,517 Acquisition-related (Income) Expense (?) ($
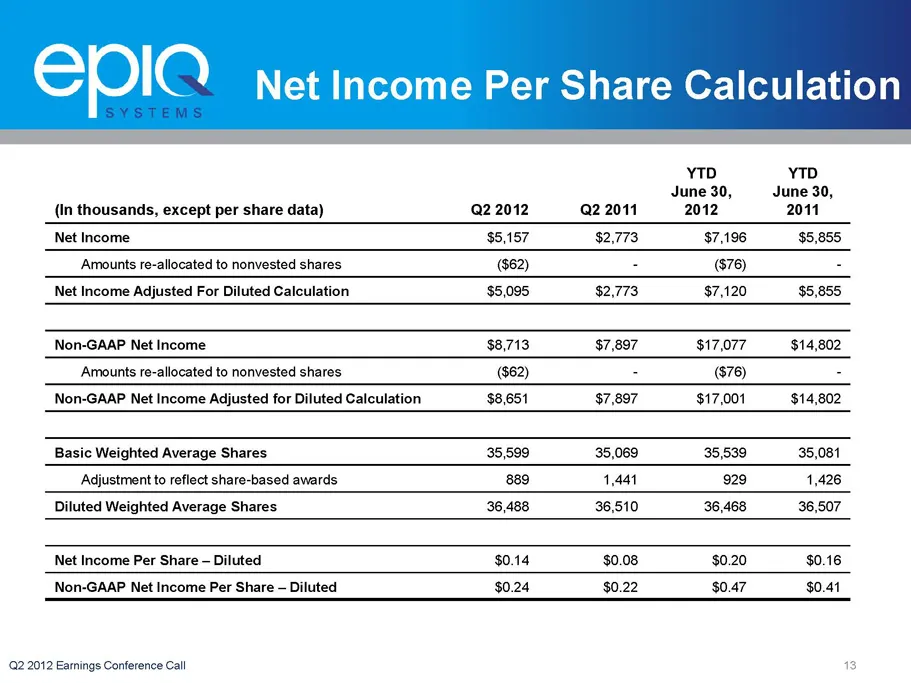
Slide 13: Net Income Per Share Calculation
Epla Net Income Per Share Calculation YTD YTD June 30, June 30, (in thousands, except per share data) Q2 2012 Q2 2011 2012 2011 Net Income $5,157 $2,773 $7,196 $5,855 Amounts re-allocated to nonvested shares ($62) : ($76) : Net Income Adjusted For Diluted Calculation $5,095 $2,773 $7,120 $5,855 Non-

Slide 14: Lew Schroeber, Investor Relations
NASDAQ: EPIQ www.epiqsystems.com Lew Schroeber, Investor Relations (913) 621-9500 IR@epiqsystems.com
Source: SEC EDGAR · 8-K filed Jul 31, 2012
More decks from EPIQ Systems Inc
 Q2 2016 Earnings Presentation12 slides · Aug 9, 2016
 Q1 2016 Earnings Presentation12 slides · May 3, 2016
 FY2015 Earnings Presentation13 slides · Mar 1, 2016
 Q3 2015 Earnings Presentation11 slides · Nov 3, 2015
 Q2 2015 Earnings Presentation11 slides · Aug 3, 2015
 Q1 2015 Earnings Presentation11 slides · Apr 28, 2015