Franklin Financial Network Inc
Franklin Financial Network — Q4 2016 Earnings Presentation
17 slides from Franklin Financial Network's earnings presentation, Jan 25, 2017
Slide 1: Fourth Quarter 2016 Investor Call
Franklin Financial Network, Inc. (NYSE:FSB) Fourth Quarter 2016 Investor Call January 25, 2017
Slide 2: Forward-Looking Statements
2 Forward - Looking Statements Except for the historical information contained herein, this presentation contains forward - looking statements within the meaning of Section 27A of the Securities Act of 1933, as amended, and Section 21E of the Securities Exchange Act of 1934, as amended. The forward
Slide 3: Fourth Quarter Highlights
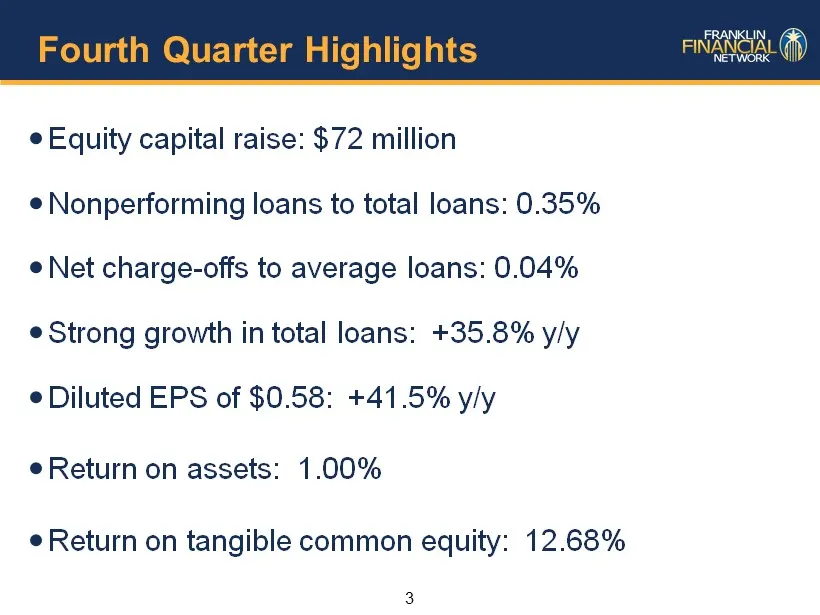
3 Fourth Quarter Highlights Equity capital raise: $72 million Nonperforming loans to total loans: 0.35% Net charge - offs to average loans: 0.04% Strong growth in total loans: +35.8% y/y Diluted EPS of $0.58: +41.5% y/y Return on assets: 1.00% Return on tangible common equity: 12.68%
Slide 4: Annual Growth in Earnings
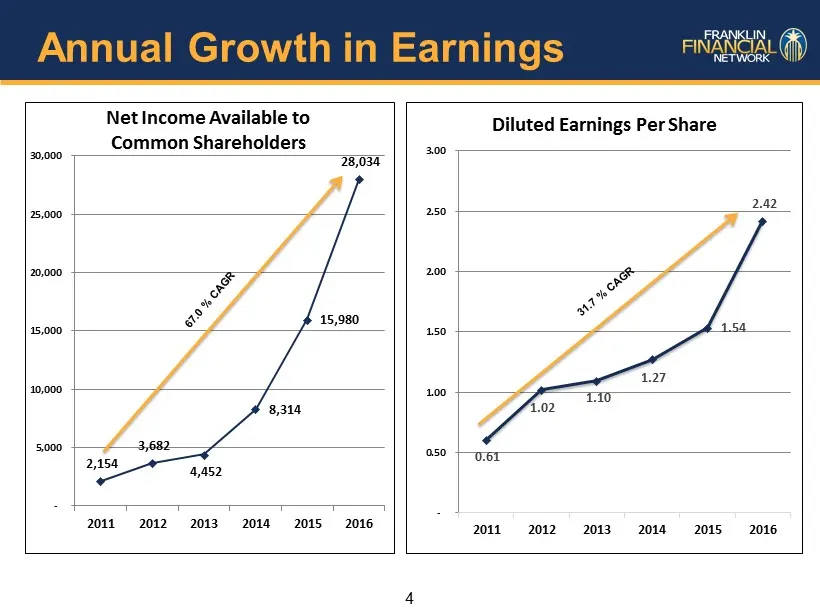
4 Annual Growth in Earnings 2,154 3,682 4,452 8,314 15,980 28,034 - 5,000 10,000 15,000 20,000 25,000 30,000 2011 2012 2013 2014 2015 2016 Net Income Available to Common Shareholders 0.61 1.02 1.10 1.27 1.54 2.42 - 0.50 1.00 1.50 2.00 2.50 3.00 2011 2012 2013 2014 2015 2016 Diluted Earnings Per Shar
Slide 5: Fourth Quarter Headwinds
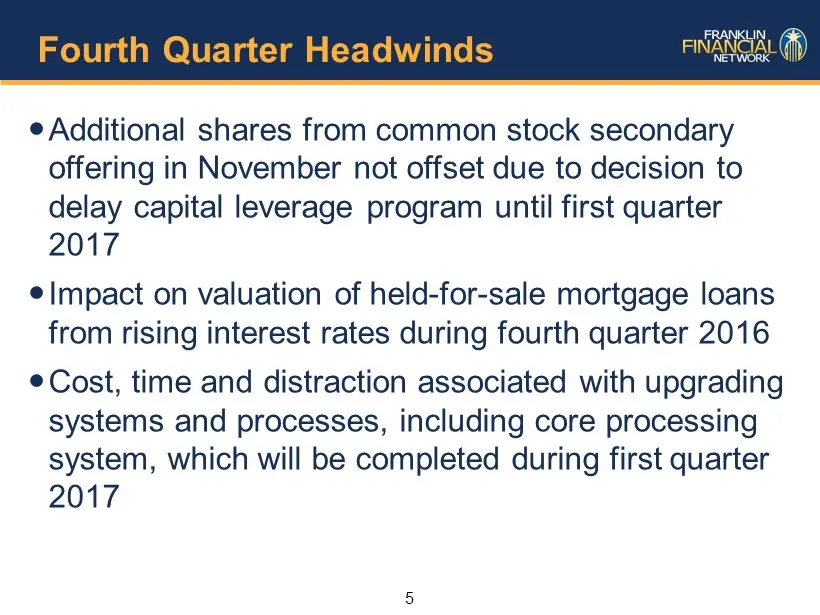
5 Fourth Quarter Headwinds Additional shares from common stock secondary offering in November not offset due to decision to delay capital leverage program until first quarter 2017 Impact on valuation of held - for - sale mortgage loans from rising interest rates during fourth quarter 2016 Cost, time
Slide 6: Fourth Quarter Financial Summary
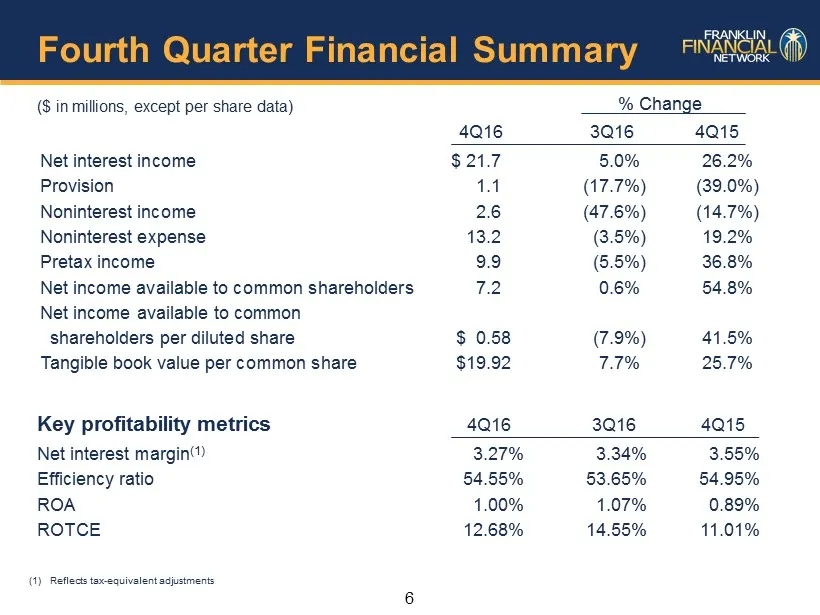
6 Fourth Quarter Financial Summary ($ in millions, except per share data) % Change 4Q16 3Q16 4Q15 Net interest income $ 21.7 5.0% 26.2% Provision 1.1 (17.7%) (39.0%) Noninterest income 2.6 (47.6%) (14.7%) Noninterest expense 13.2 (3.5%) 19.2% Pretax income 9.9 (5.5%) 36.8% Net income available to co
Slide 7: Loan Segment Concentration
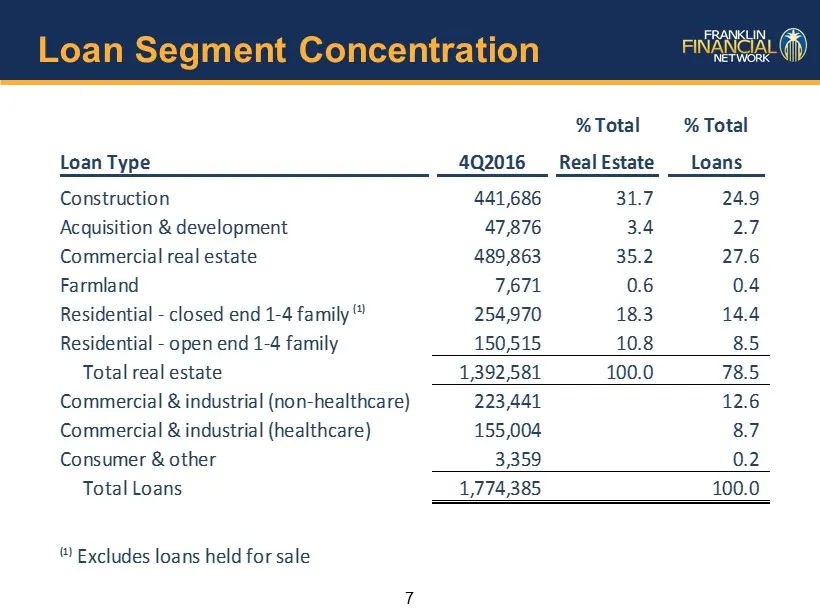
7 Loan Segment Concentration Loan Type 4Q2016 % Total Real Estate % Total Loans Construction 441,686 31.7 24.9 Acquisition & development 47,876 3.4 2.7 Commercial real estate 489,863 35.2 27.6 Farmland 7,671 0.6 0.4 Residential - closed end 1-4 family (1) 254,970 18.3 14.4 Residential - open end 1-4
Slide 8: Asset Quality: NPLs to Total Loans and Texas Ratio
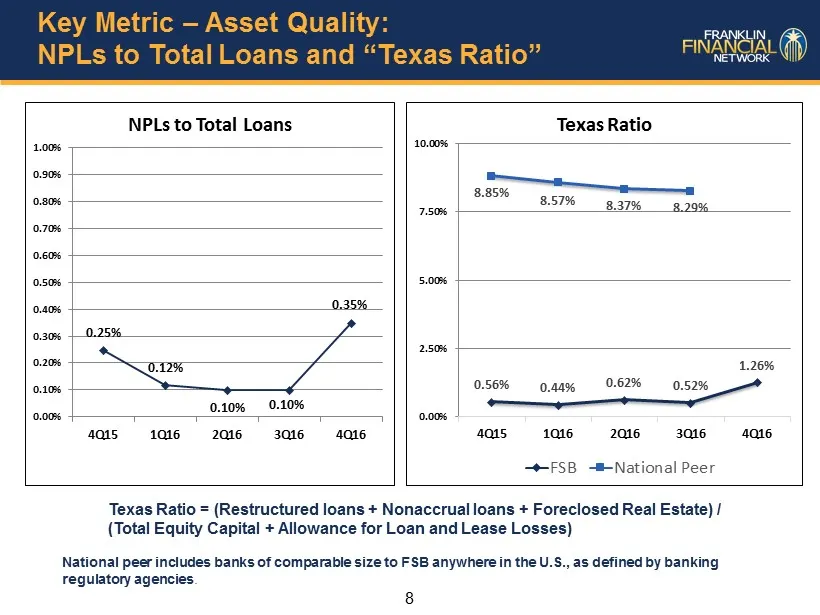
8 Key Metric – Asset Quality: NPLs to Total Loans and “Texas Ratio” 0.25% 0.12% 0.10% 0.10% 0.35% 0.00% 0.10% 0.20% 0.30% 0.40% 0.50% 0.60% 0.70% 0.80% 0.90% 1.00% 4Q15 1Q16 2Q16 3Q16 4Q16 NPLs to Total Loans Texas Ratio = (Restructured loans + Nonaccrual loans + Foreclosed Real Estate) / (Total Equ
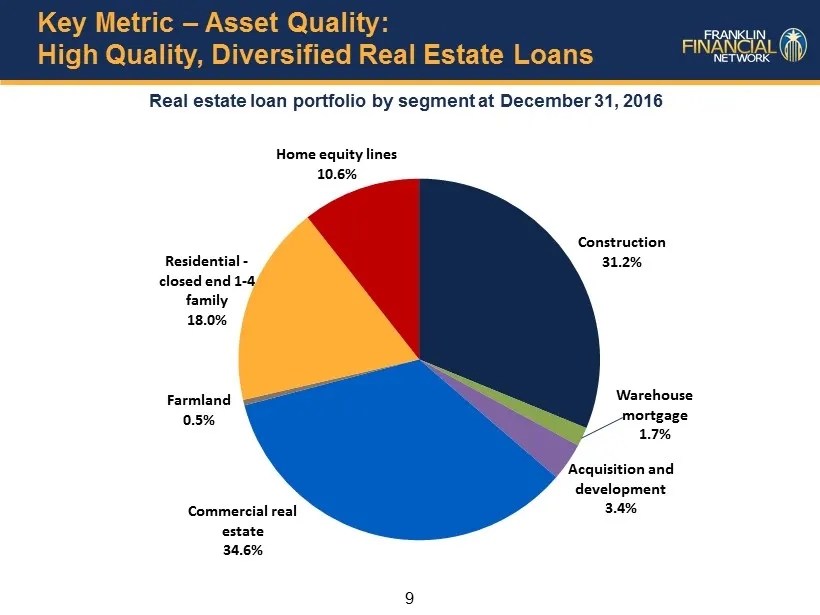
Slide 9: Asset Quality: High Quality, Diversified Real Estate Loans
9 Key Metric – Asset Quality: High Quality, Diversified Real Estate Loans Real estate loan portfolio by segment at December 31, 2016 Construction 31.2% Warehouse mortgage 1.7% Acquisition and development 3.4% Commercial real estate 34.6% Farmland 0.5% Residential - closed end 1 - 4 family 18.0% Home
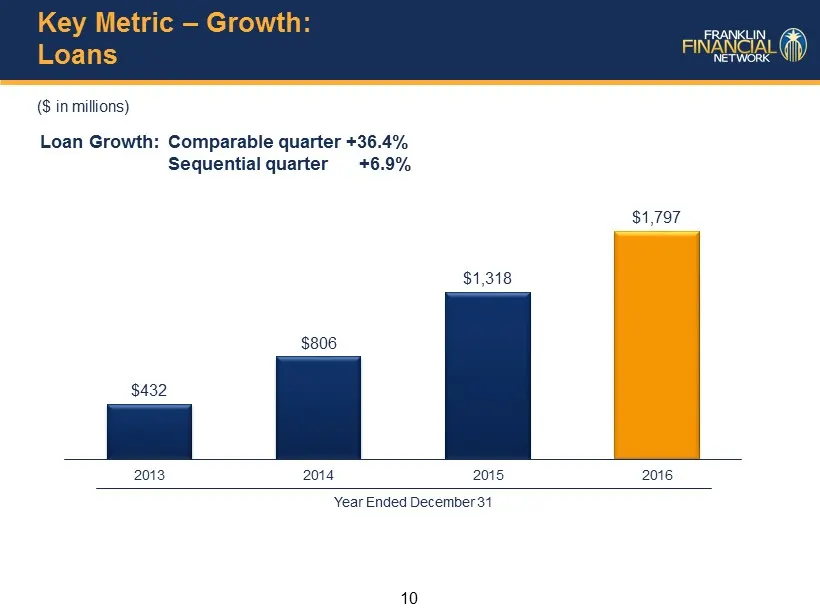
Slide 10: Growth: Loans
10 Key Metric – Growth: Loans ($ in millions) Loan Growth: Comparable quarter +36.4% Sequential quarter +6.9% $432 $806 $1,318 $1,797 2013 2014 2015 2016 Year Ended December 31
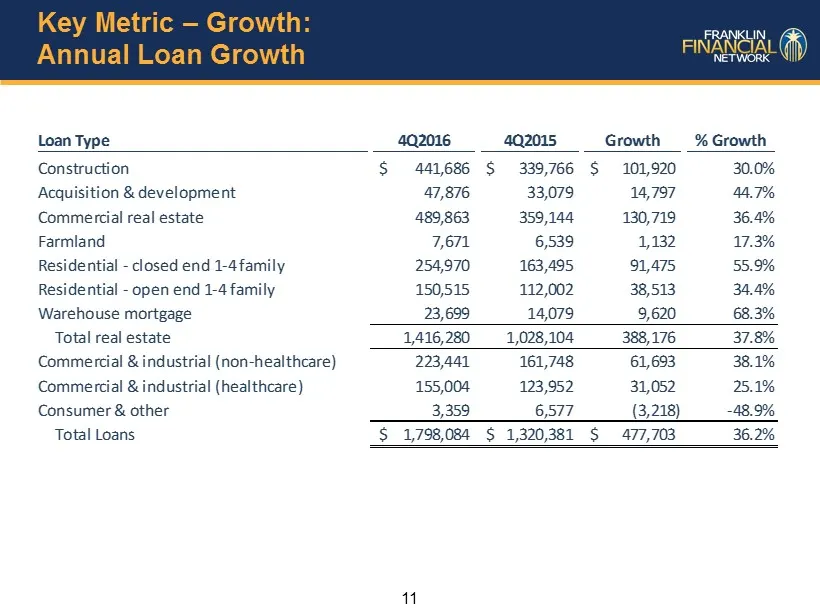
Slide 11: Growth: Annual Loan Growth
11 Key Metric – Growth: Annual Loan Growth Loan Type 4Q2016 4Q2015 Growth % Growth Construction 441,686$ 339,766$ 101,920$ 30.0% Acquisition & development 47,876 33,079 14,797 44.7% Commercial real estate 489,863 359,144 130,719 36.4% Farmland 7,671 6,539 1,132 17.3% Residential - closed end 1-4 fam
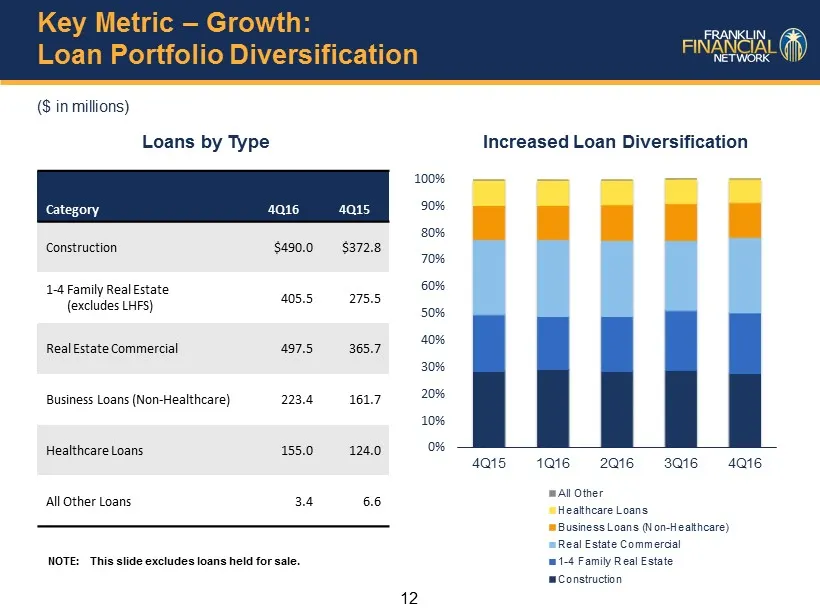
Slide 12: Growth: Loan Portfolio Diversification
12 Key Metric – Growth: Loan Portfolio Diversification Category 4Q16 4Q15 Construction $490.0 $372.8 1 - 4 Family Real Estate (excludes LHFS) 405.5 275.5 Real Estate Commercial 497.5 365.7 Business Loans (Non - Healthcare) 223.4 161.7 Healthcare Loans 155.0 124.0 All Other Loans 3.4 6.6 ($ in millio
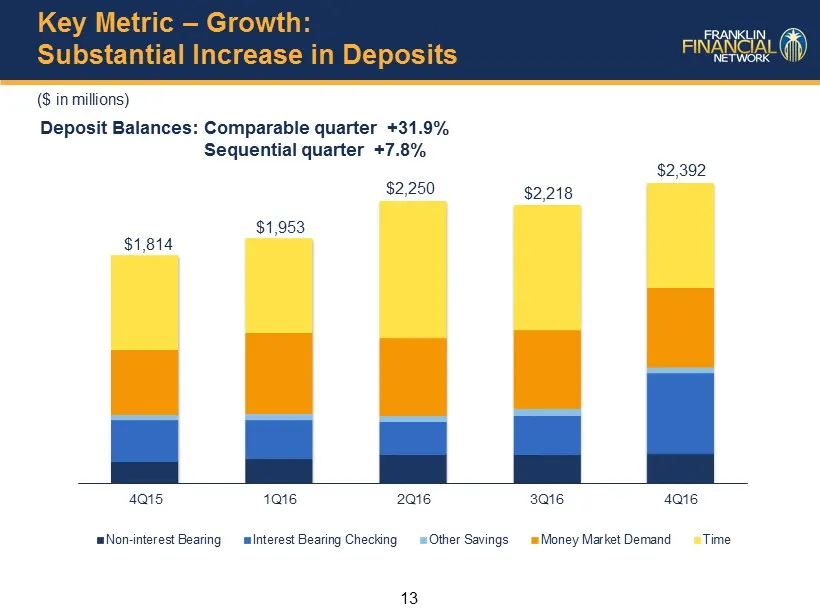
Slide 13: Growth: Substantial Increase in Deposits
13 Key Metric – Growth: Substantial Increase in Deposits ($ in millions) Deposit Balances: Comparable quarter +31.9% Sequential quarter +7.8% 4Q15 1Q16 2Q16 3Q16 4Q16 Non-interest Bearing Interest Bearing Checking Other Savings Money Market Demand Time $2,392 $1,814 $1,953 $2,250 $2,218
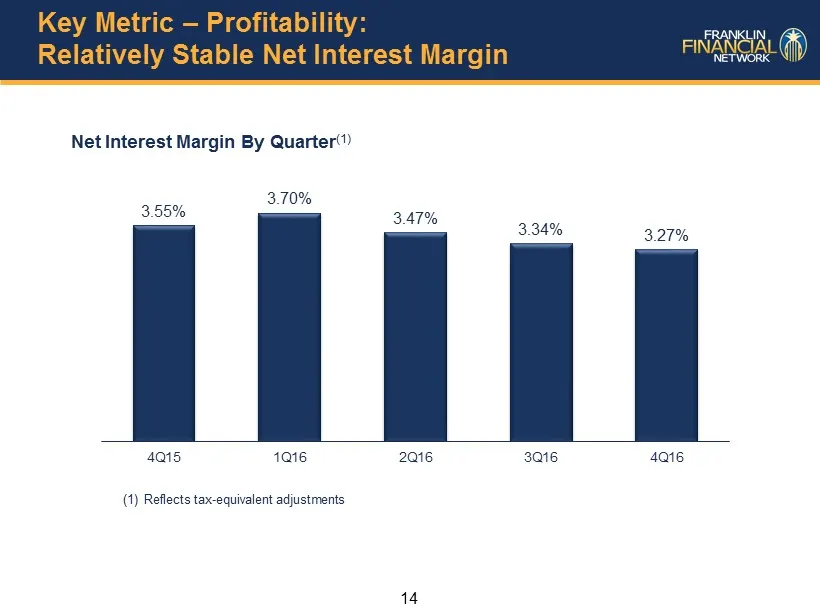
Slide 14: Profitability: Relatively Stable Net Interest Margin
14 Key Metric – Profitability: Relatively Stable Net Interest Margin Net Interest Margin By Quarter (1) 3.55% 3.70% 3.47% 3.34% 3.27% 4Q15 1Q16 2Q16 3Q16 4Q16 (1) Reflects tax - equivalent adjustments
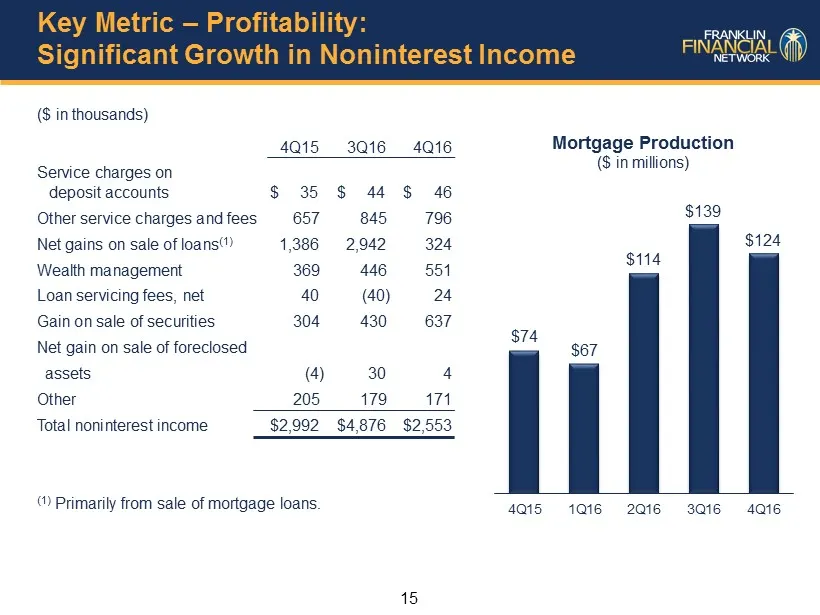
Slide 15: Profitability: Significant Growth in Noninterest Income
15 Key Metric – Profitability: Significant Growth in Noninterest Income ($ in thousands) 4Q15 3Q16 4Q16 Service charges on deposit accounts $ 35 $ 44 $ 46 Other service charges and fees 657 845 796 Net gains on sale of loans (1) 1,386 2,942 324 Wealth management 369 446 551 Loan servicing fees, net
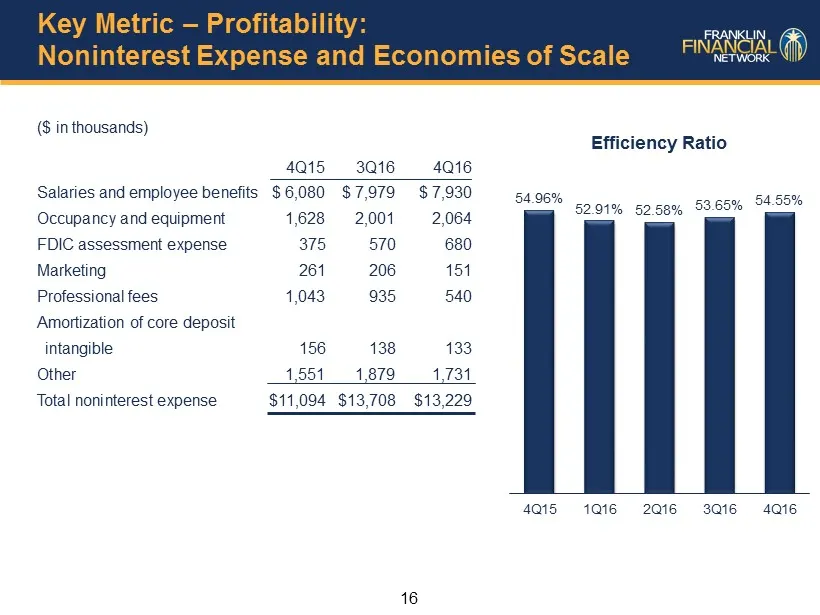
Slide 16: Profitability: Noninterest Expense and Economies of Scale
16 Key Metric – Profitability: Noninterest Expense and Economies of Scale ($ in thousands) 4Q15 3Q16 4Q16 Salaries and employee benefits $ 6,080 $ 7,979 $ 7,930 Occupancy and equipment 1,628 2,001 2,064 FDIC assessment expense 375 570 680 Marketing 261 206 151 Professional fees 1,043 935 540 Amortiz
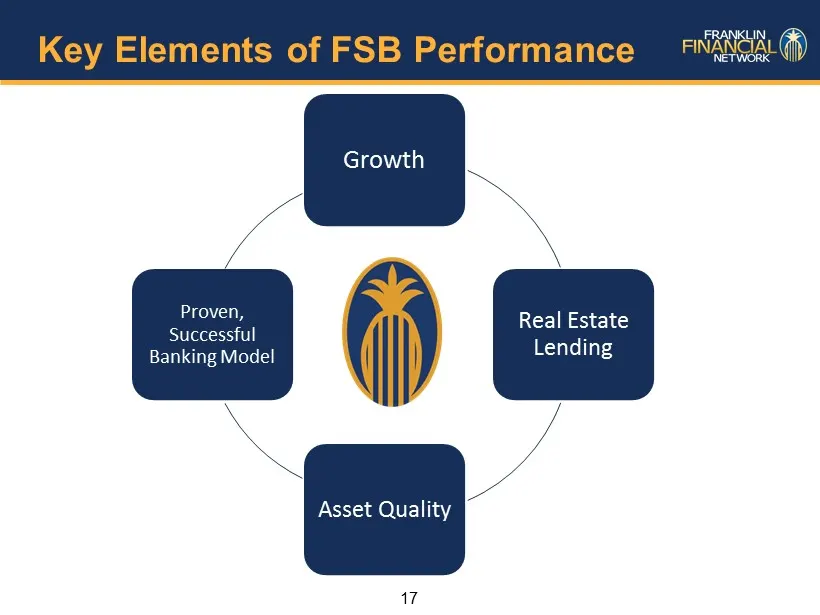
Slide 17: Key Elements of FSB Performance
17 Key Elements of FSB Performance Growth Real Estate Lending Asset Quality Proven, Successful Banking Model
Source: SEC EDGAR · 8-K filed Jan 25, 2017
More decks from Franklin Financial Network Inc
 Merger or Acquisition (January 2020)17 slides · Jan 21, 2020
 Q3 2019 Earnings Presentation21 slides · Nov 1, 2019
 Q3 2019 Earnings Presentation15 slides · Oct 23, 2019
 Q2 2019 Earnings Presentation19 slides · Jul 26, 2019
 Q2 2019 Earnings Presentation15 slides · Jul 24, 2019
 Q1 2019 Earnings Presentation19 slides · May 10, 2019