Masan Group Corporation · HOSE:MSN
Masan — Shareholder Meeting (April 2012)
60 slides from Masan's shareholder meeting presentation, April 2012
Slide 1: Masan Group CEO Presentation
Masan Group CEO Presentation April 2012
Slide 2: Strong performance since listing
Strong performance since listing 2

Slide 3: Charles Barkley quote
“I always laugh when people ask me about rebounding techniques. I’ve got a technique. It’s called just go get the damn ball.” Charles Barkley Former NBA basketball player 3
Slide 4: Market cap up ~250-350% vs market return of 23% since listing
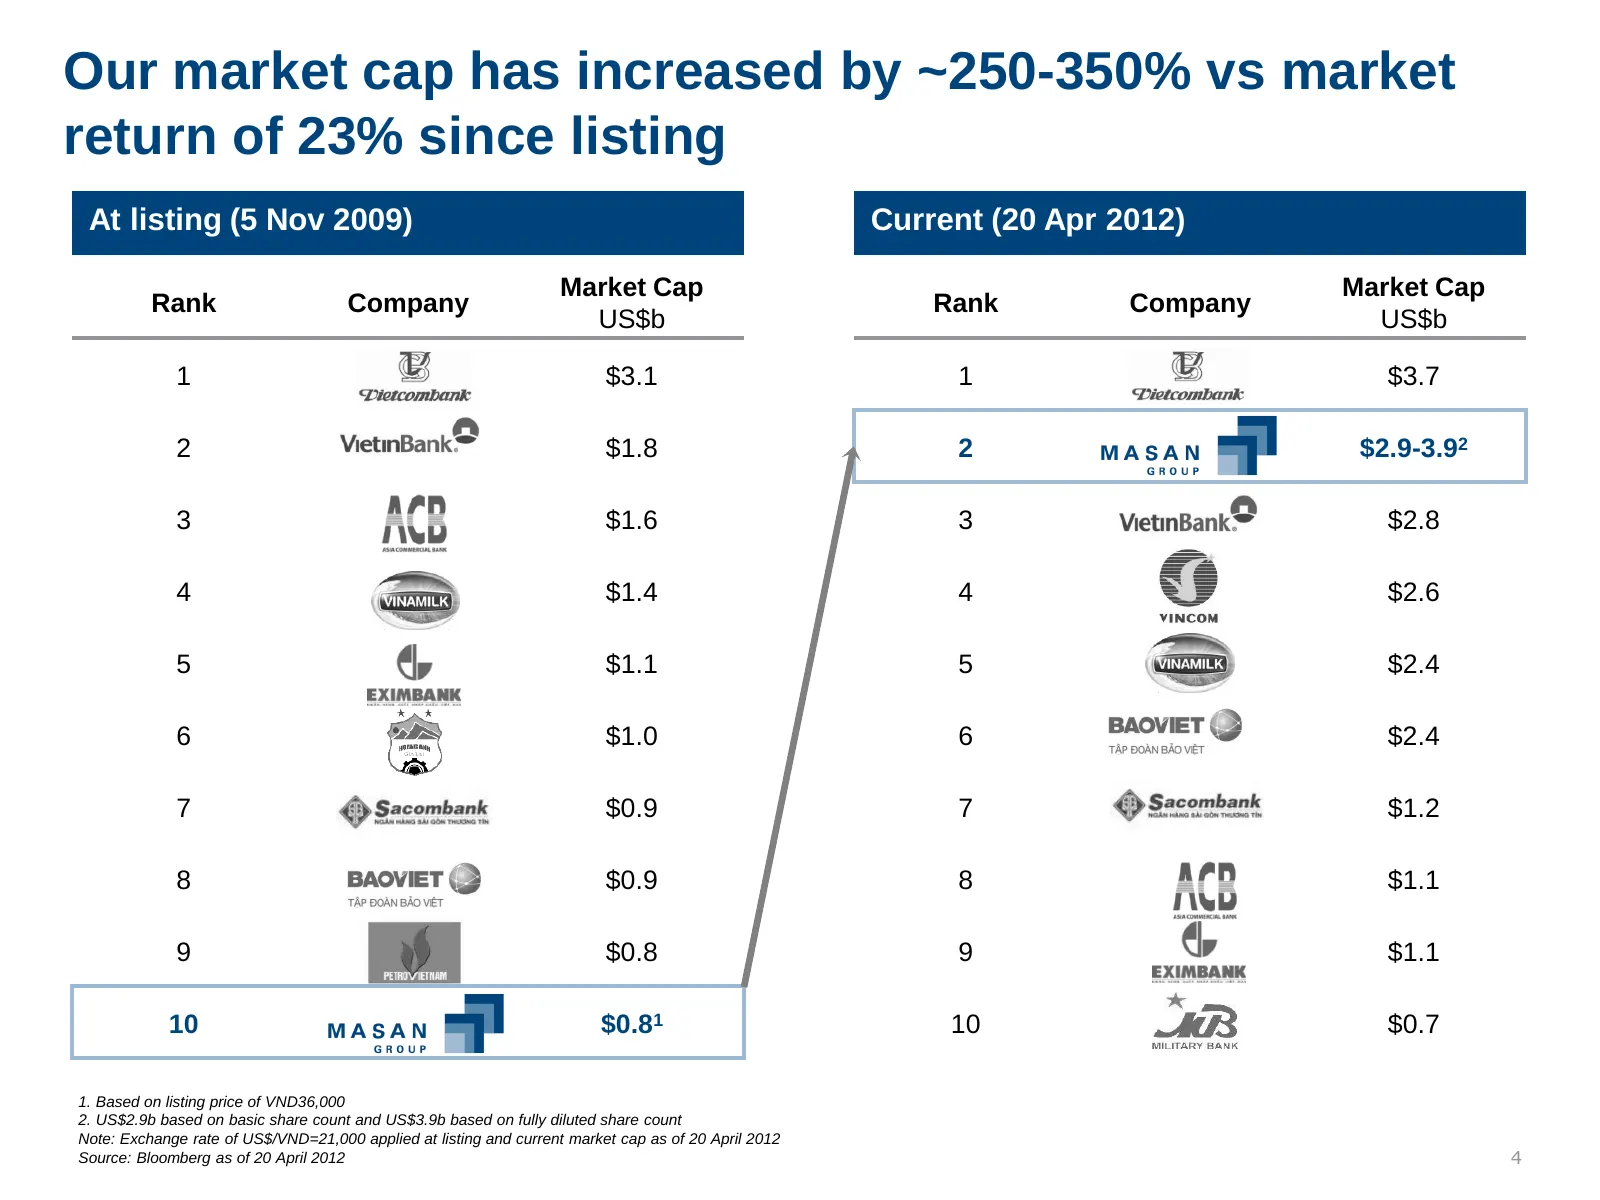
Our market cap has increased by ~250-350% vs market return of 23% since listing At listing (5 Nov 2009) Current (20 Apr 2012) Market Cap Market Cap Rank Company Rank Company US$b US$b 1 $3.1 1 $3.7 2 $1.8 2 $2.9-3.92 3 $1.6 3 $2.8 4 $1.4 4 $2.6 5 $1.1 5 $2.4 6 $1.0 6 $2.4 7 $0.9 7 $1.2 8 $0.9 8 $1.1
Slide 5: Masan Consumer has increased market share consistently
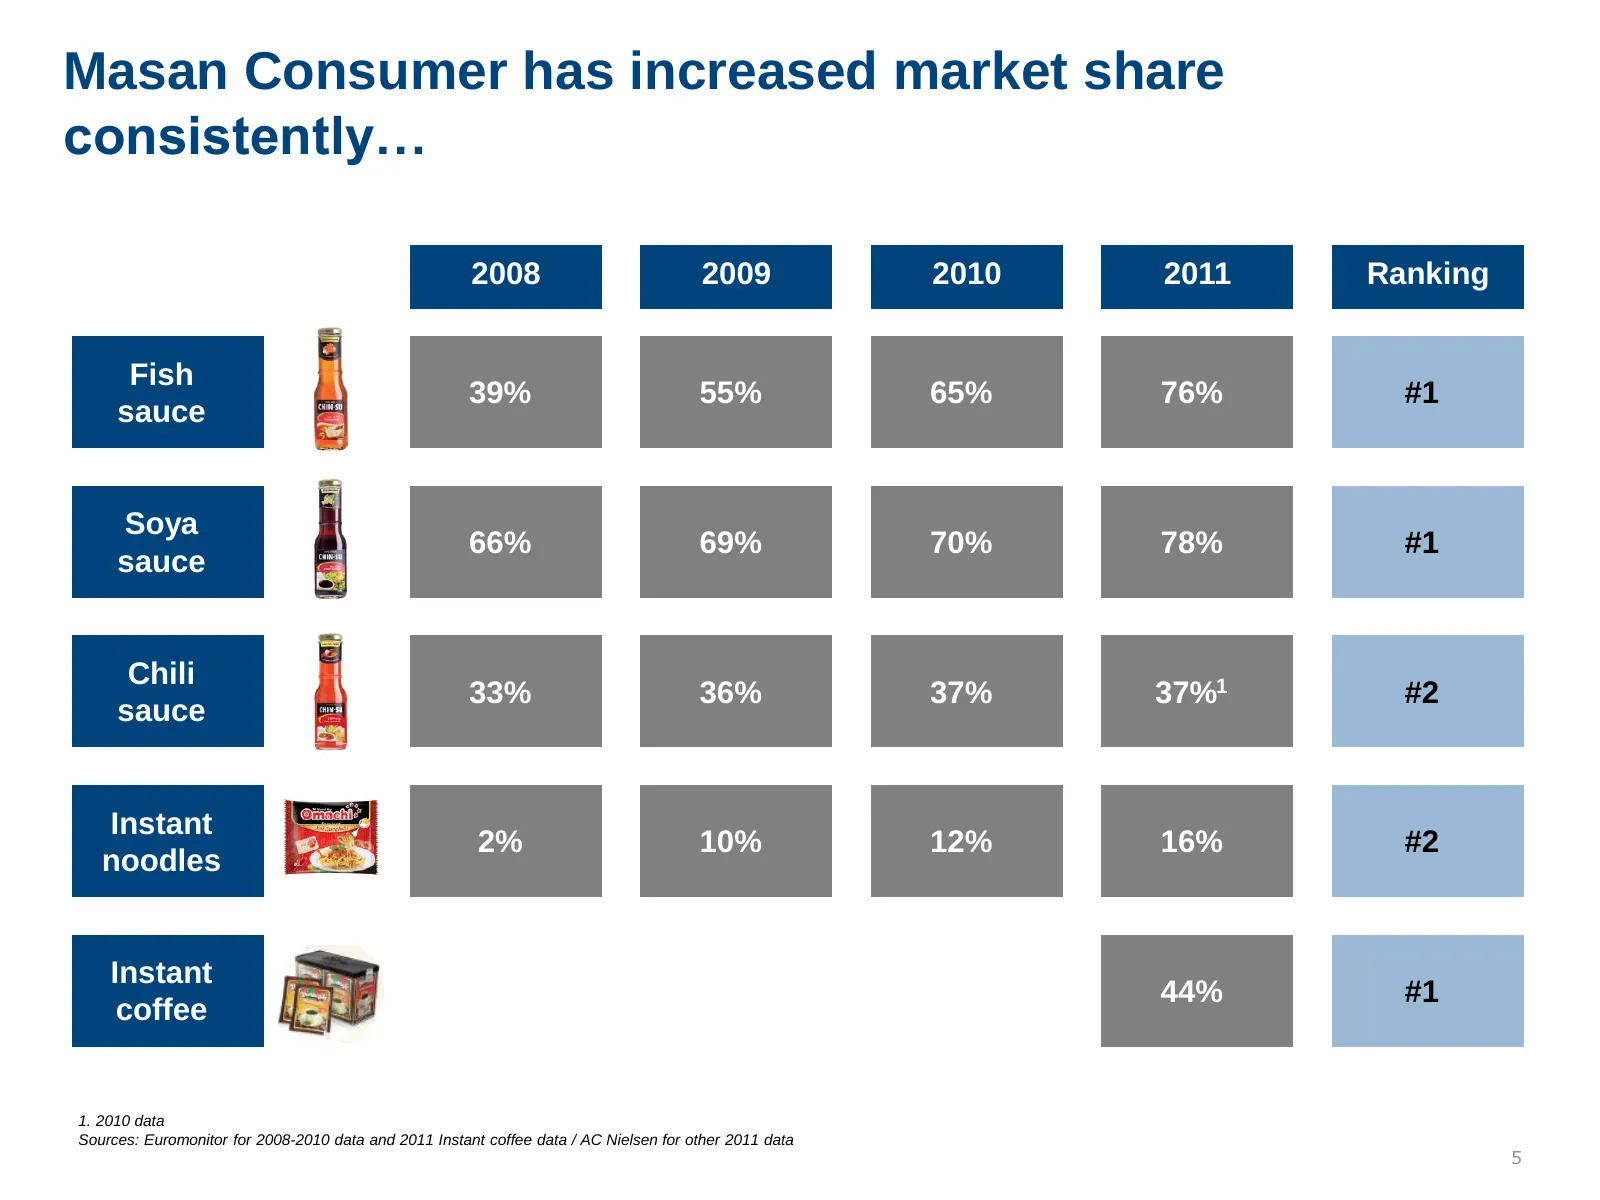
Masan Consumer has increased market share consistently… 2008 2009 2010 2011 Ranking Fish 39% 55% 65% 76% #1 sauce Soya 66% 69% 70% 78% #1 sauce Chili 33% 36% 37% 37%1 #2 sauce Instant 2% 10% 12% 16% #2 noodles Instant 44% #1 coffee 1. 2010 data Sources: Euromonitor for 2008-2010 data and 2011 Instan
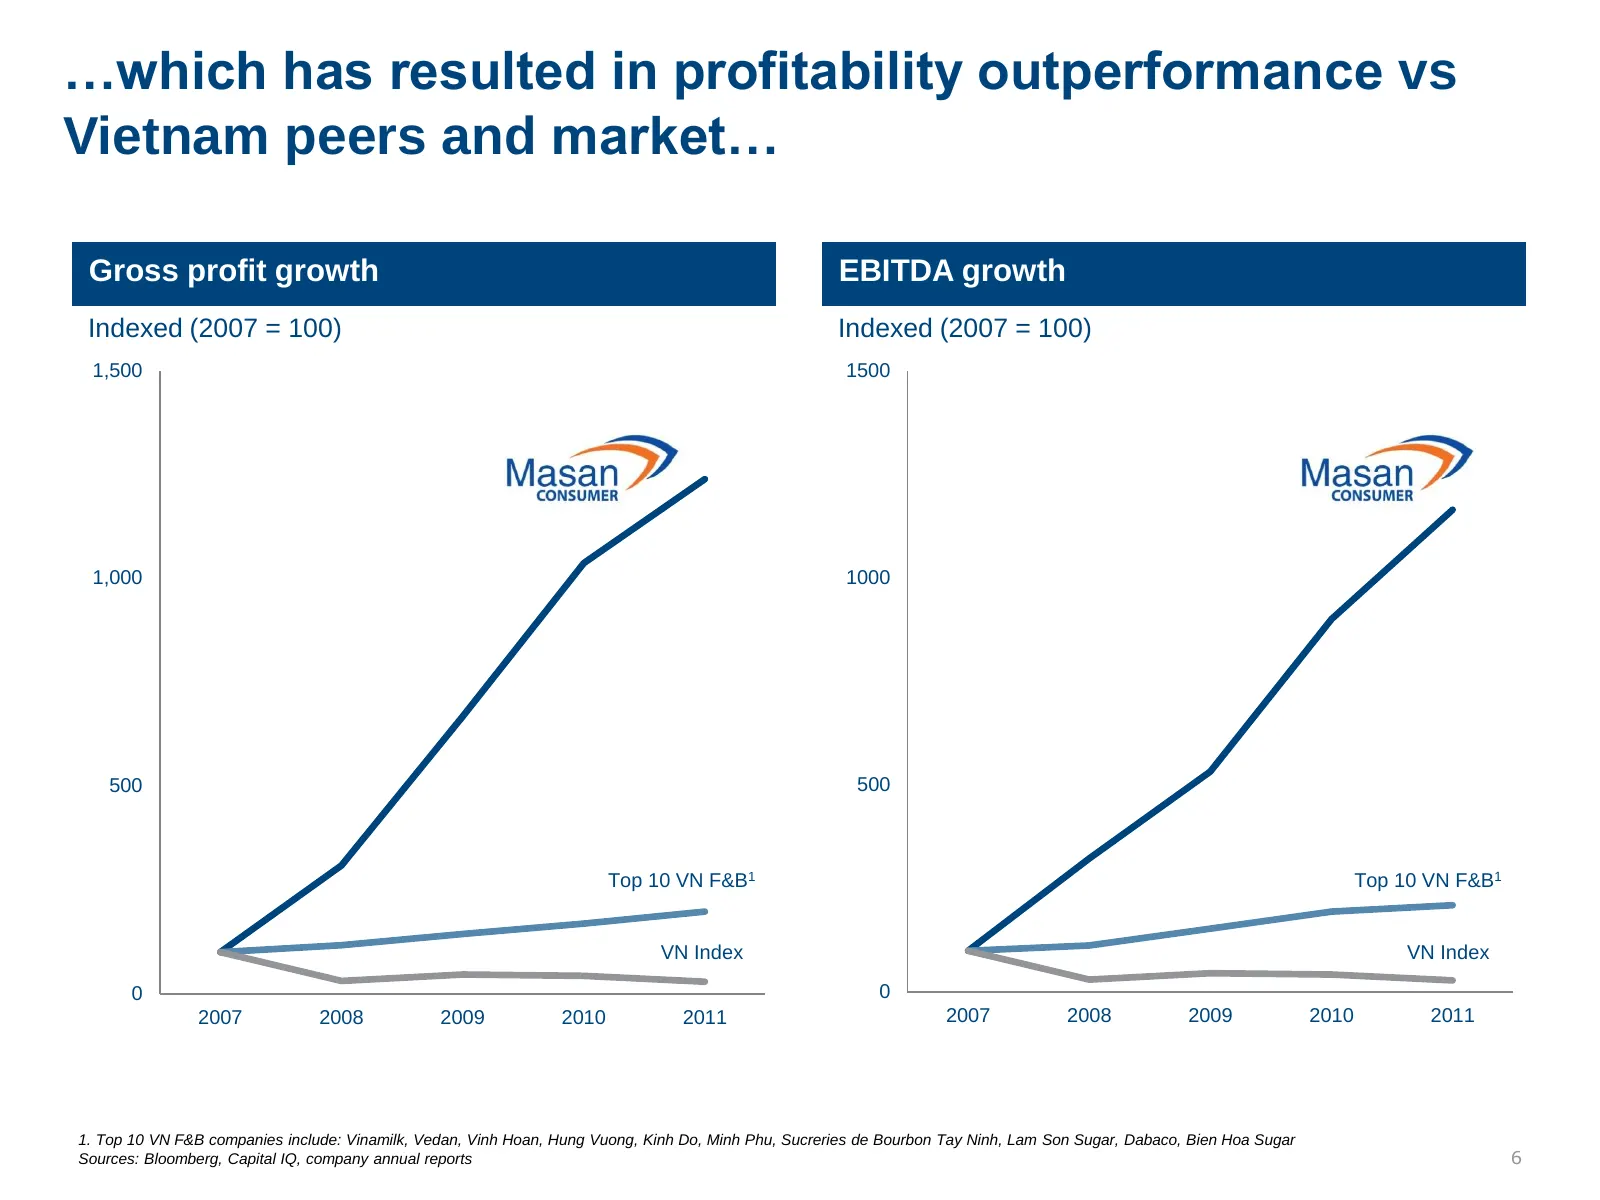
Slide 6: Profitability outperformance vs Vietnam peers and market
…which has resulted in profitability outperformance vs Vietnam peers and market… Gross profit growth EBITDA growth Indexed (2007 = 100) Indexed (2007 = 100) 1,500 1500 1,000 1000 500 500 Top 10 VN F&B1 Top 10 VN F&B1 VN Index VN Index 0 0 2007 2008 2009 2010 2011 2007 2008 2009 2010 2011 1. Top 10 V
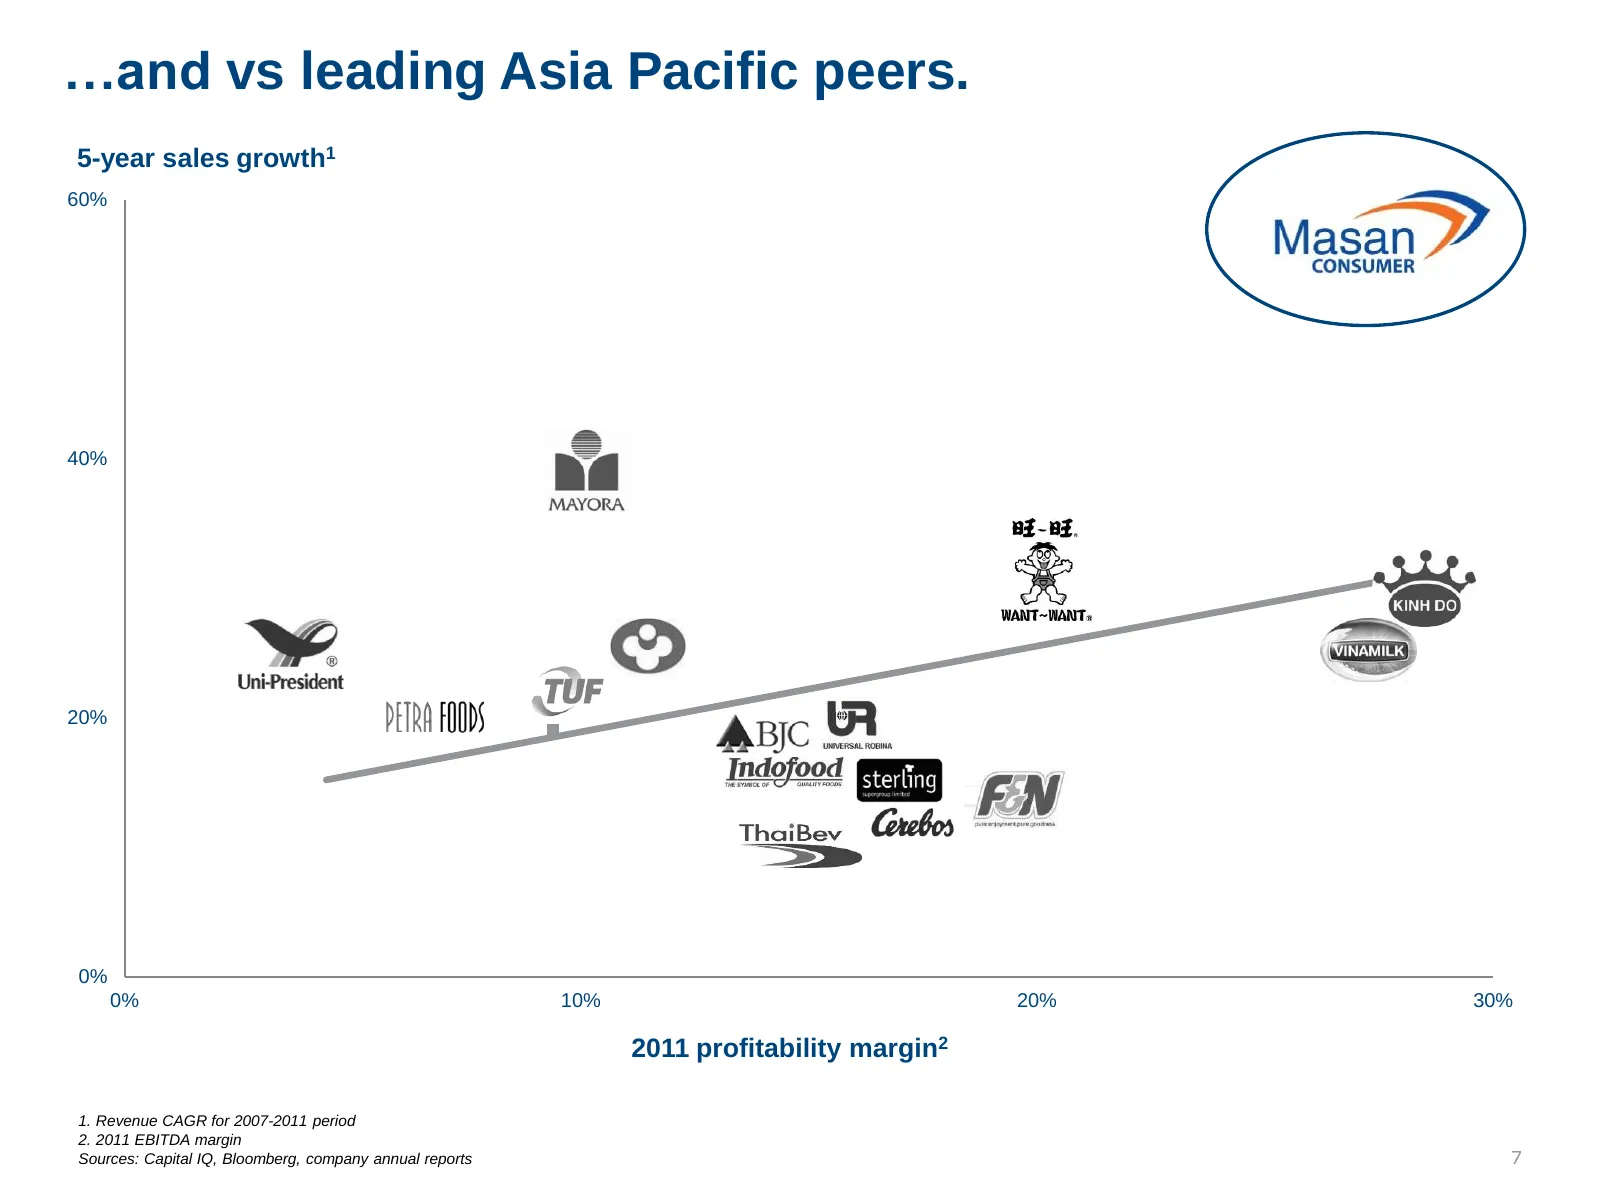
Slide 7: Outperformance vs leading Asia Pacific peers
…and vs leading Asia Pacific peers. 5-year sales growth1 Y-Value 1 60% 40% 20% 0% 0% 10% 20% 30% 2011 profitability margin2 1. Revenue CAGR for 2007-2011 period 2. 2011 EBITDA margin Sources: Capital IQ, Bloomberg, company annual reports 7
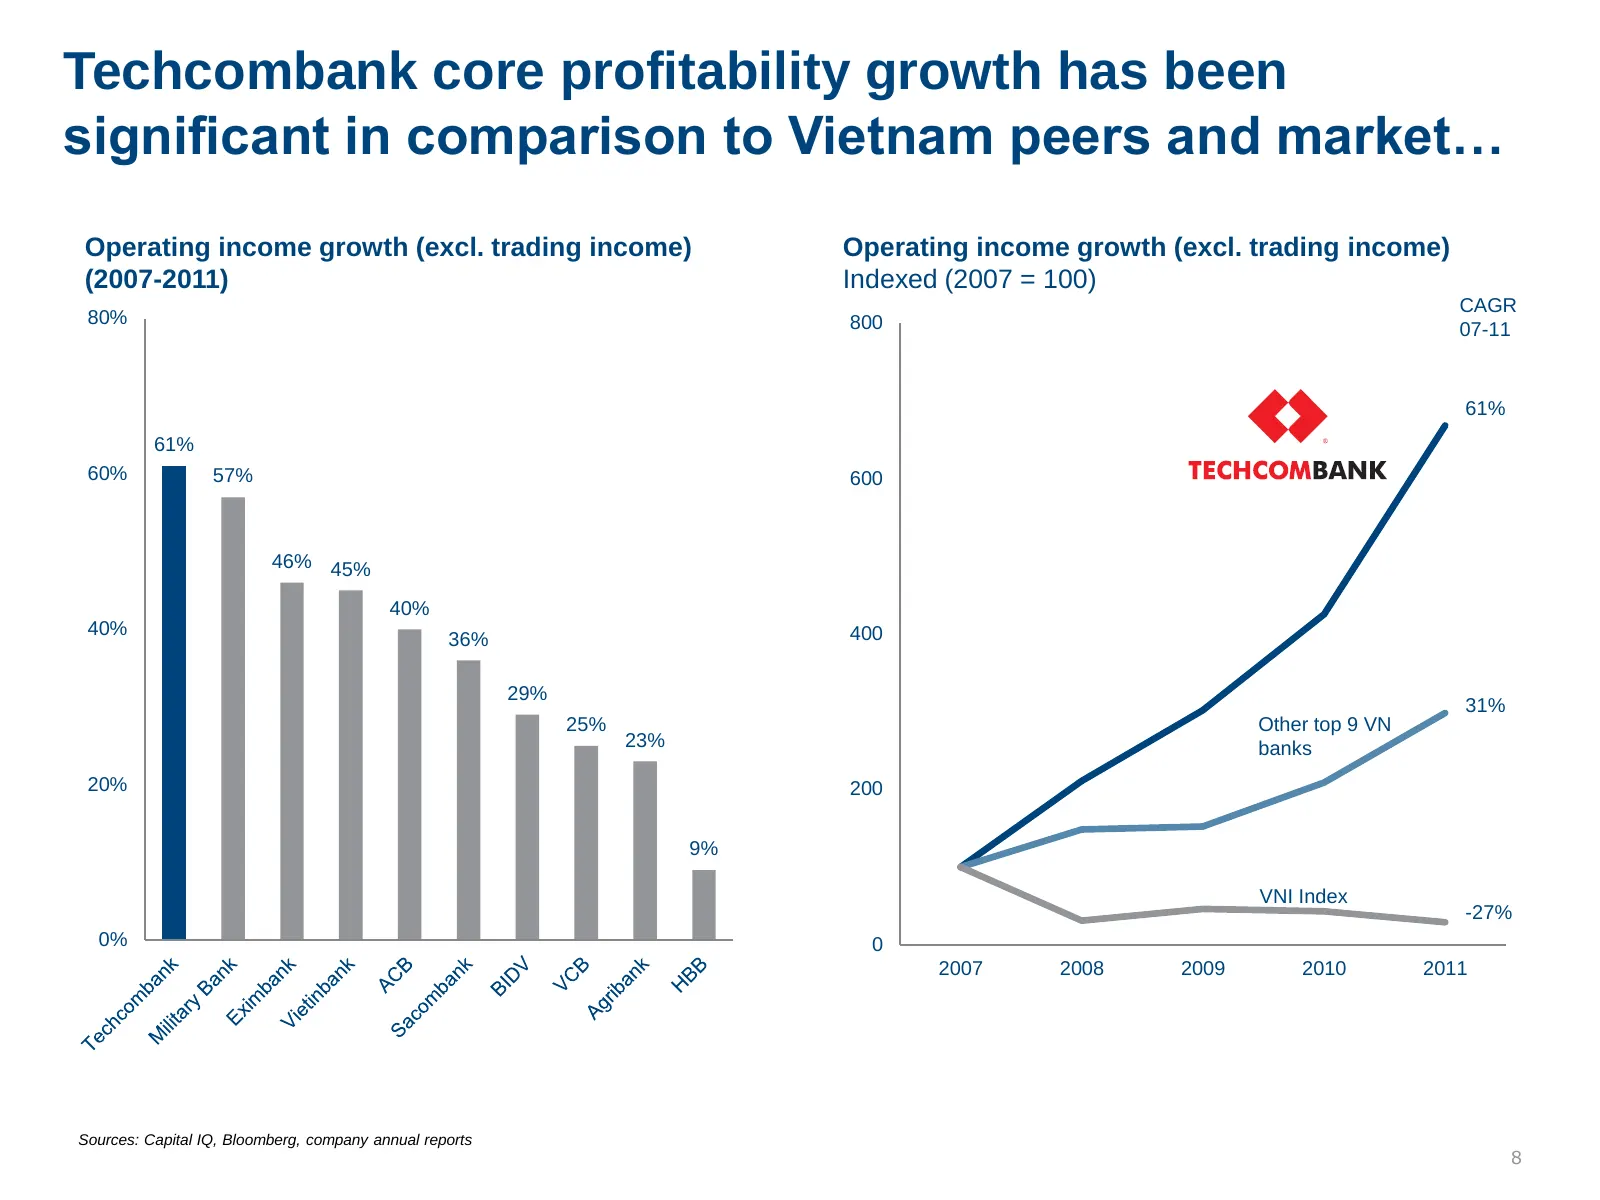
Slide 8: Techcombank core profitability growth vs peers
Techcombank core profitability growth has been significant in comparison to Vietnam peers and market… Operating income growth (excl. trading income) Operating income growth (excl. trading income) (2007-2011) Indexed (2007 = 100) CAGR 80% 800 07-11 61% 61% 60% 57% 600 46% 45% 40% 40% 400 36% 29% 31%
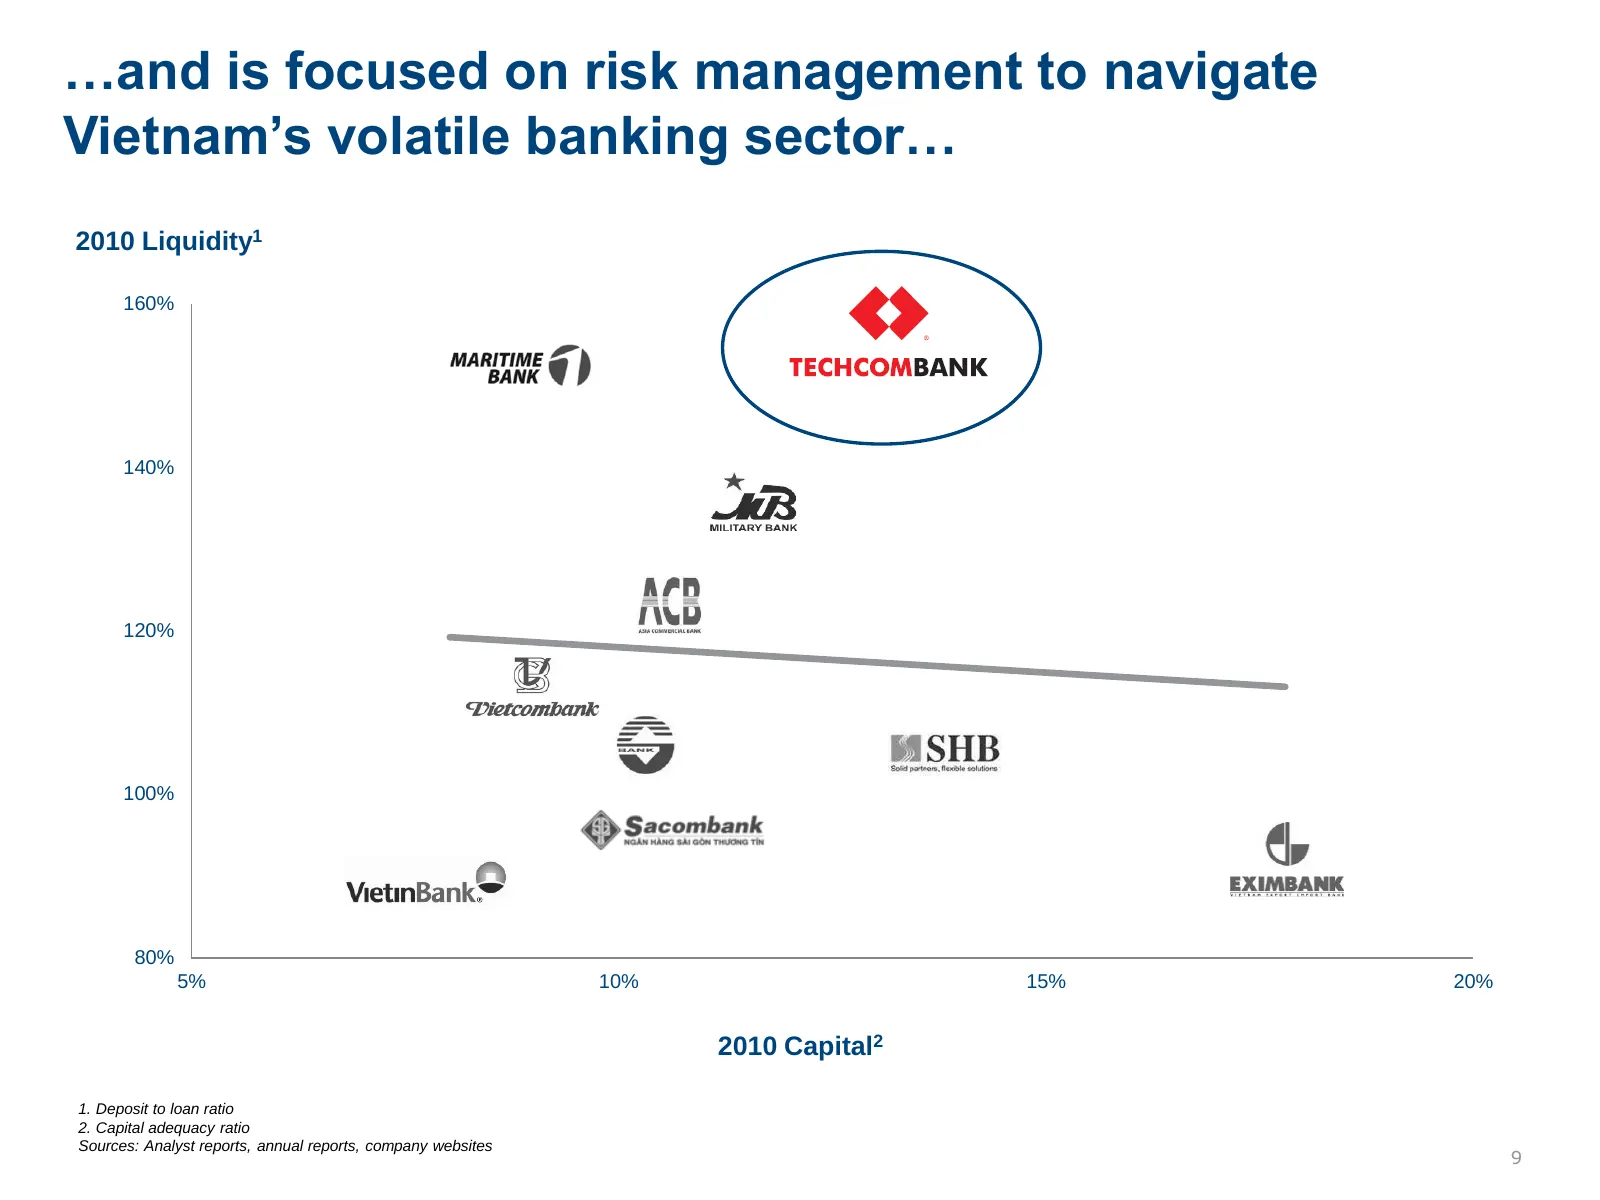
Slide 9: Risk management in Vietnam's volatile banking sector
…and is focused on risk management to navigate Vietnam’s volatile banking sector… 2010 Liquidity1 Y-Value 1 160% 140% 120% 100% 80% 5% 10% 15% 20% 2010 Capital2 1. Deposit to loan ratio 2. Capital adequacy ratio Sources: Analyst reports, annual reports, company websites 9
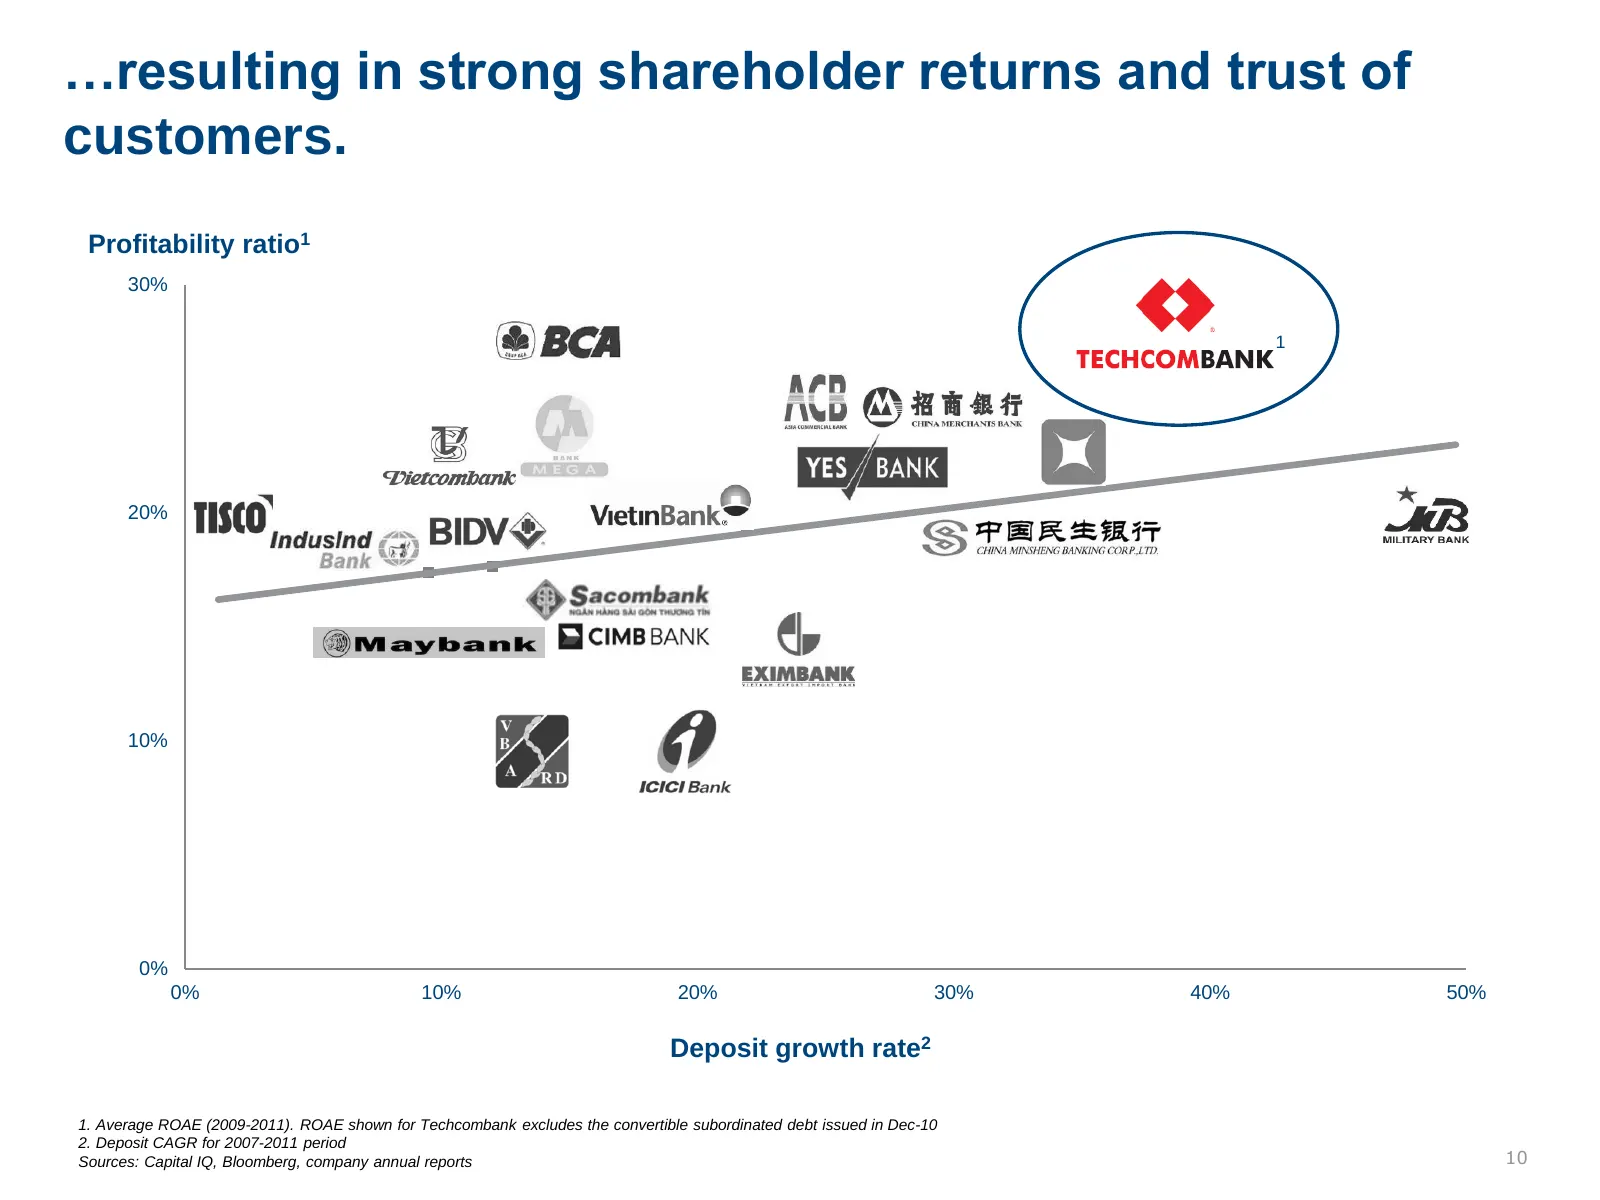
Slide 10: Strong shareholder returns and customer trust
…resulting in strong shareholder returns and trust of customers. Profitability ratio1 Y-Value 1 30% 1 20% 10% 0% 0% 10% 20% 30% 40% 50% Deposit growth rate2 1. Average ROAE (2009-2011). ROAE shown for Techcombank excludes the convertible subordinated debt issued in Dec-10 2. Deposit CAGR for 2007-20
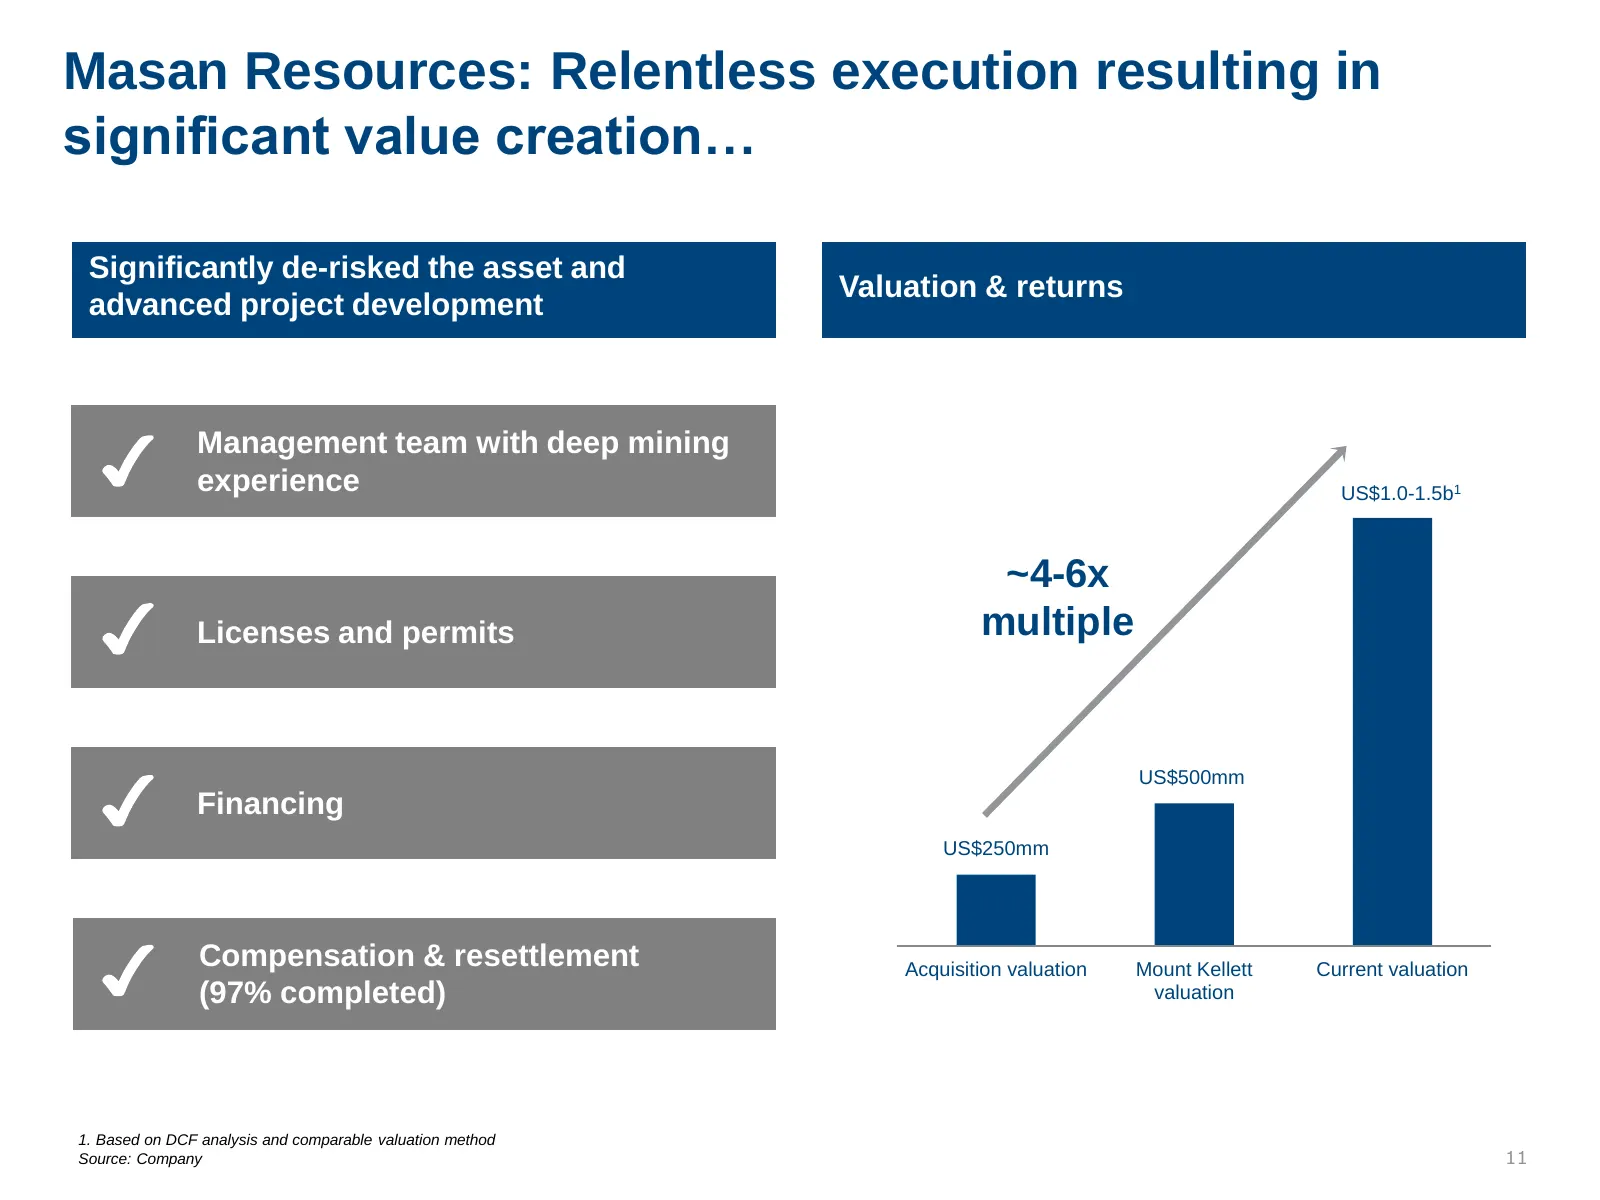
Slide 11: Masan Resources: Relentless execution resulting in significant value creation
Masan Resources: Relentless execution resulting in significant value creation… Significantly de-risked the asset and Valuation & returns advanced project development Management team with deep mining experience 1600 US$1.0-1.5b1 1400 ~4-6x 1200 Licenses and permits multiple 1000 800 600 US$500mm Fina
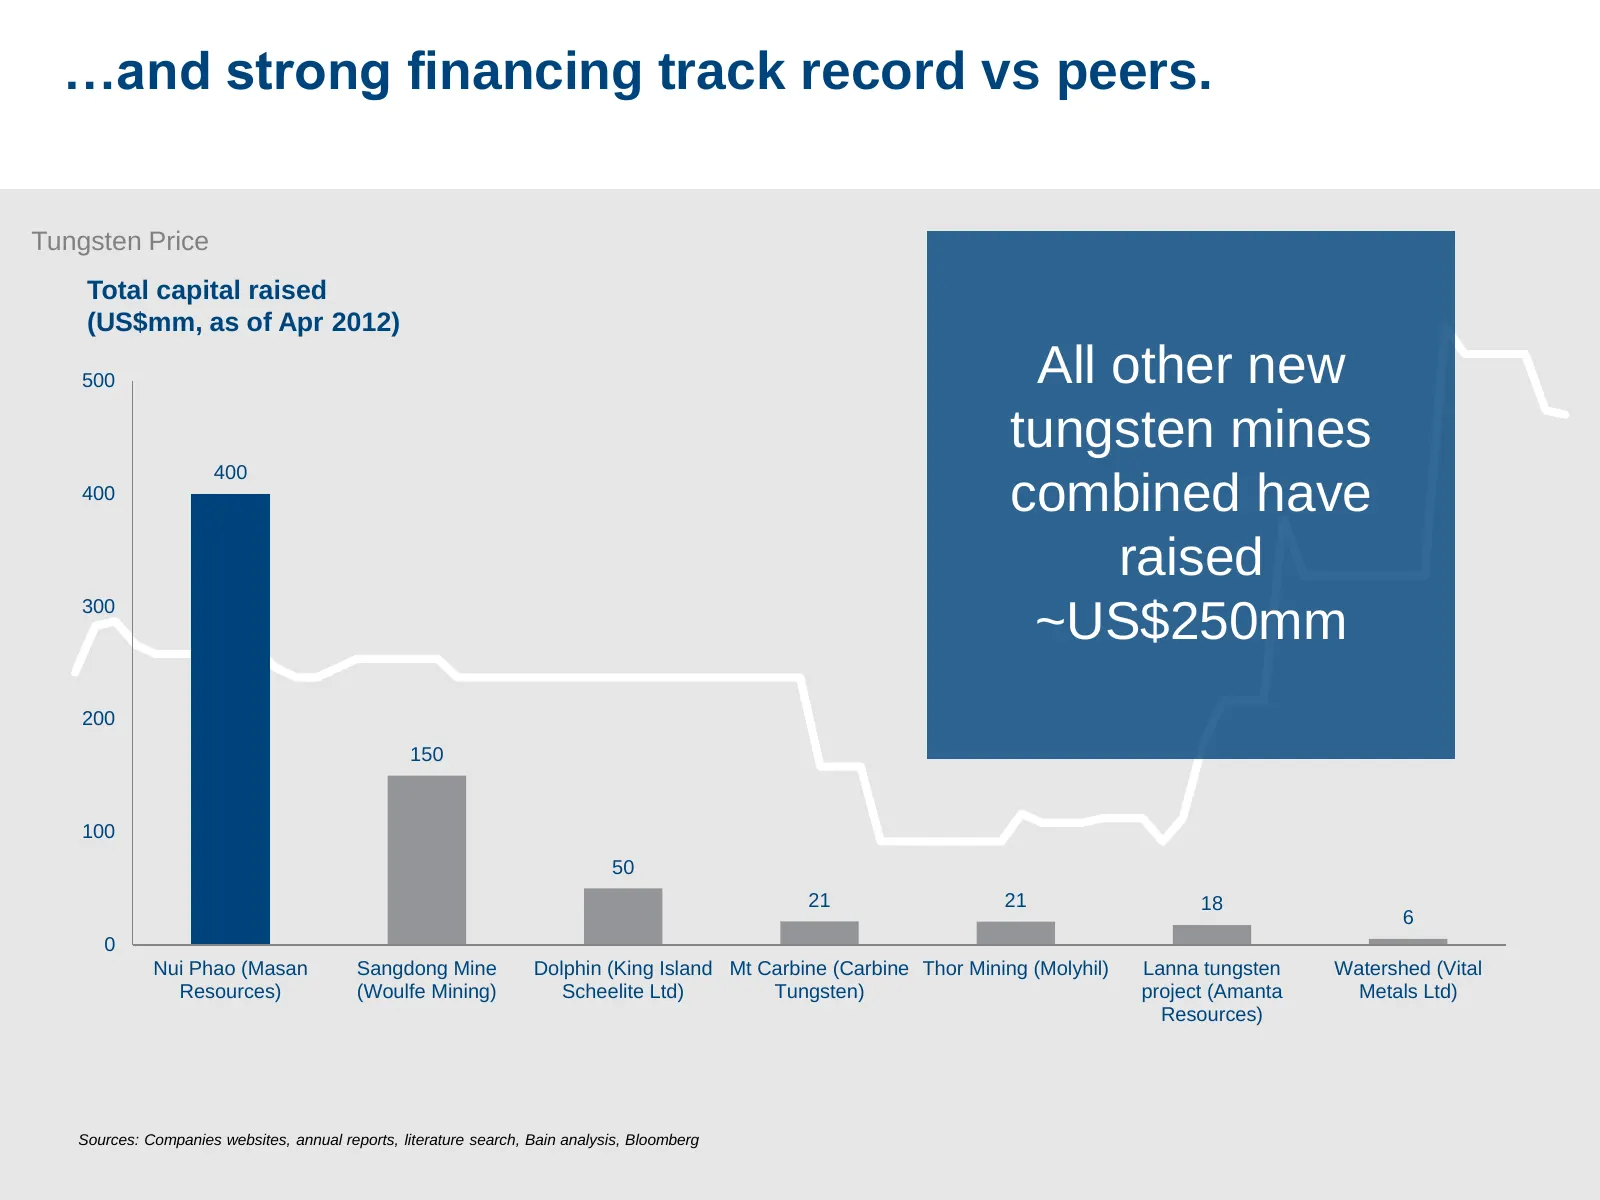
Slide 12: Strong financing track record vs peers
…and strong financing track record vs peers. 500 Tungsten Price Total capital raised (US$mm, as of Apr 2012) 400 500 All other new tungsten mines 400 400 combined have 300 raised 300 ~US$250mm 200 150 200 100 50 21 21 18 6 0 100 Nui Phao (Masan Sangdong Mine Dolphin (King Island Mt Carbine (Carbine
Slide 13: Masan business model thesis
Masan business model thesis 13

Slide 14: Mr. Miyagi quote
“Man who catch fly with chopstick accomplish anything” Mr. Miyagi Master of karate, fictional character in the movie ‘Karate Kid’ (1984) 14
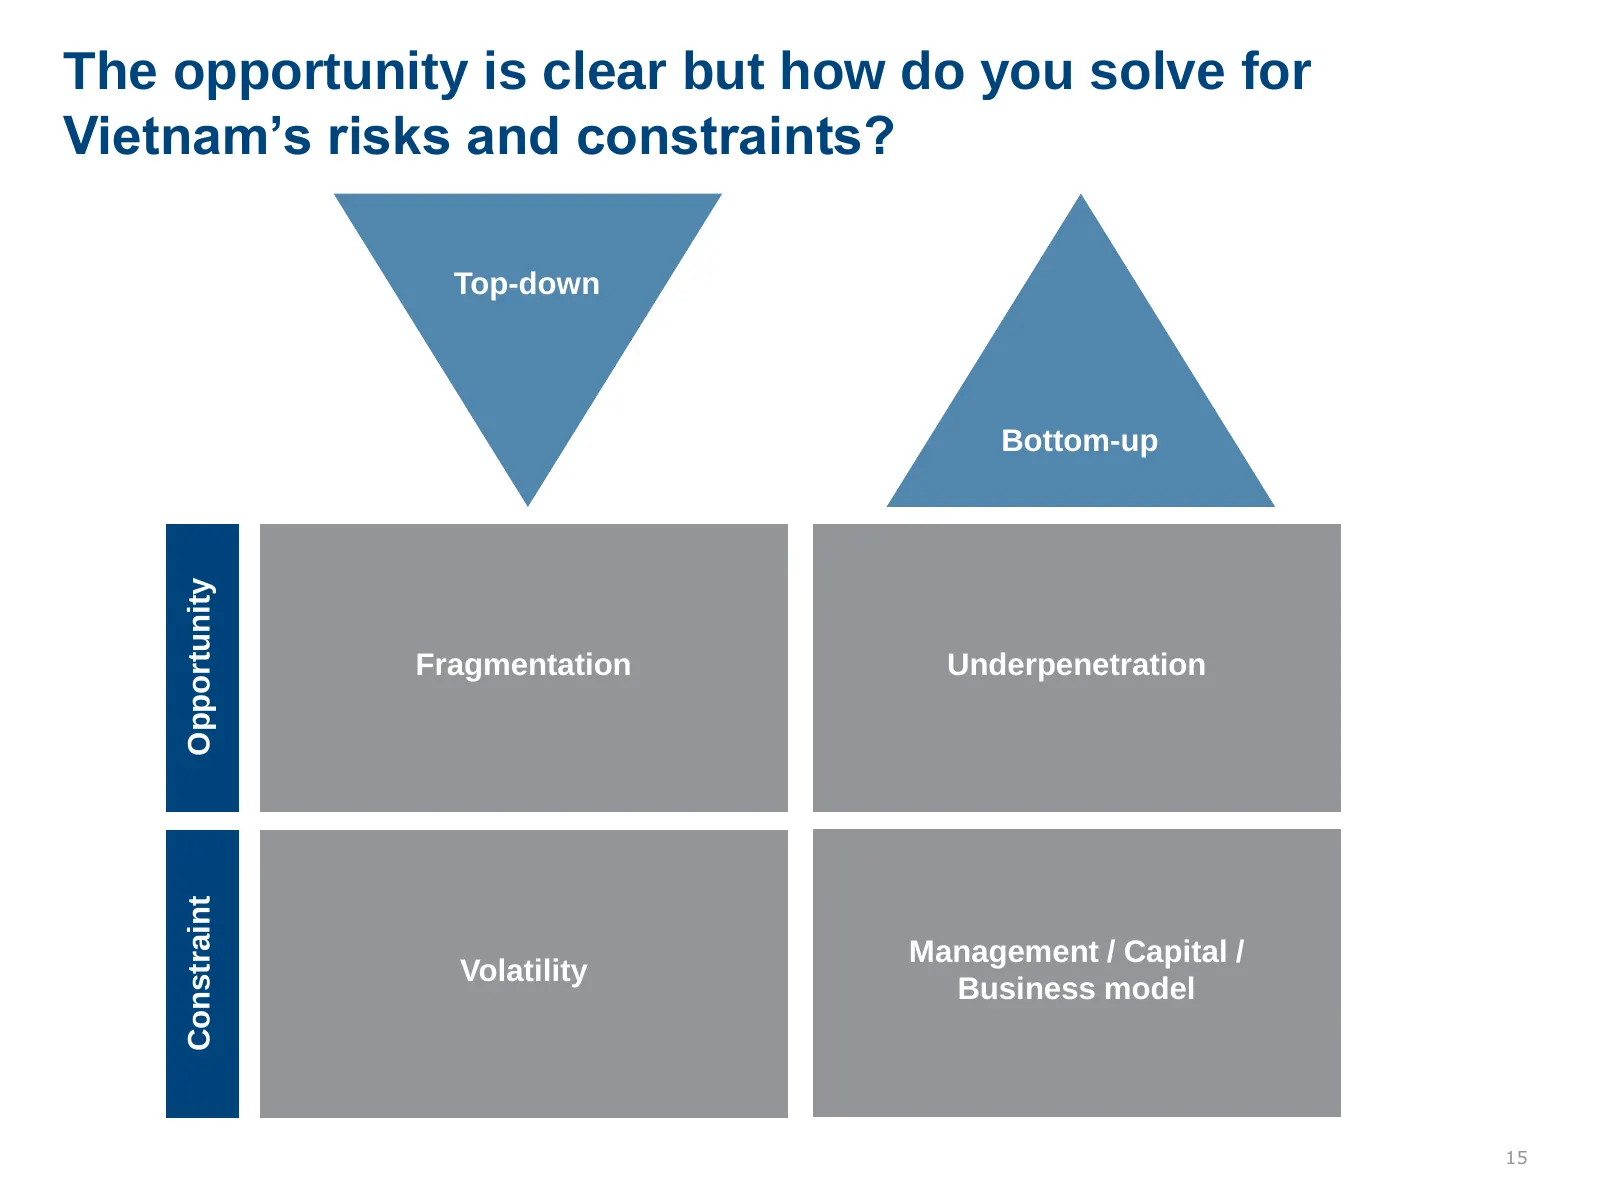
Slide 15: The opportunity is clear but how do you solve for Vietnam's risks
The opportunity is clear but how do you solve for Vietnam’s risks and constraints? Top-down Bottom-up Opportunity Fragmentation Underpenetration Constraint Management / Capital / Volatility Business model 15
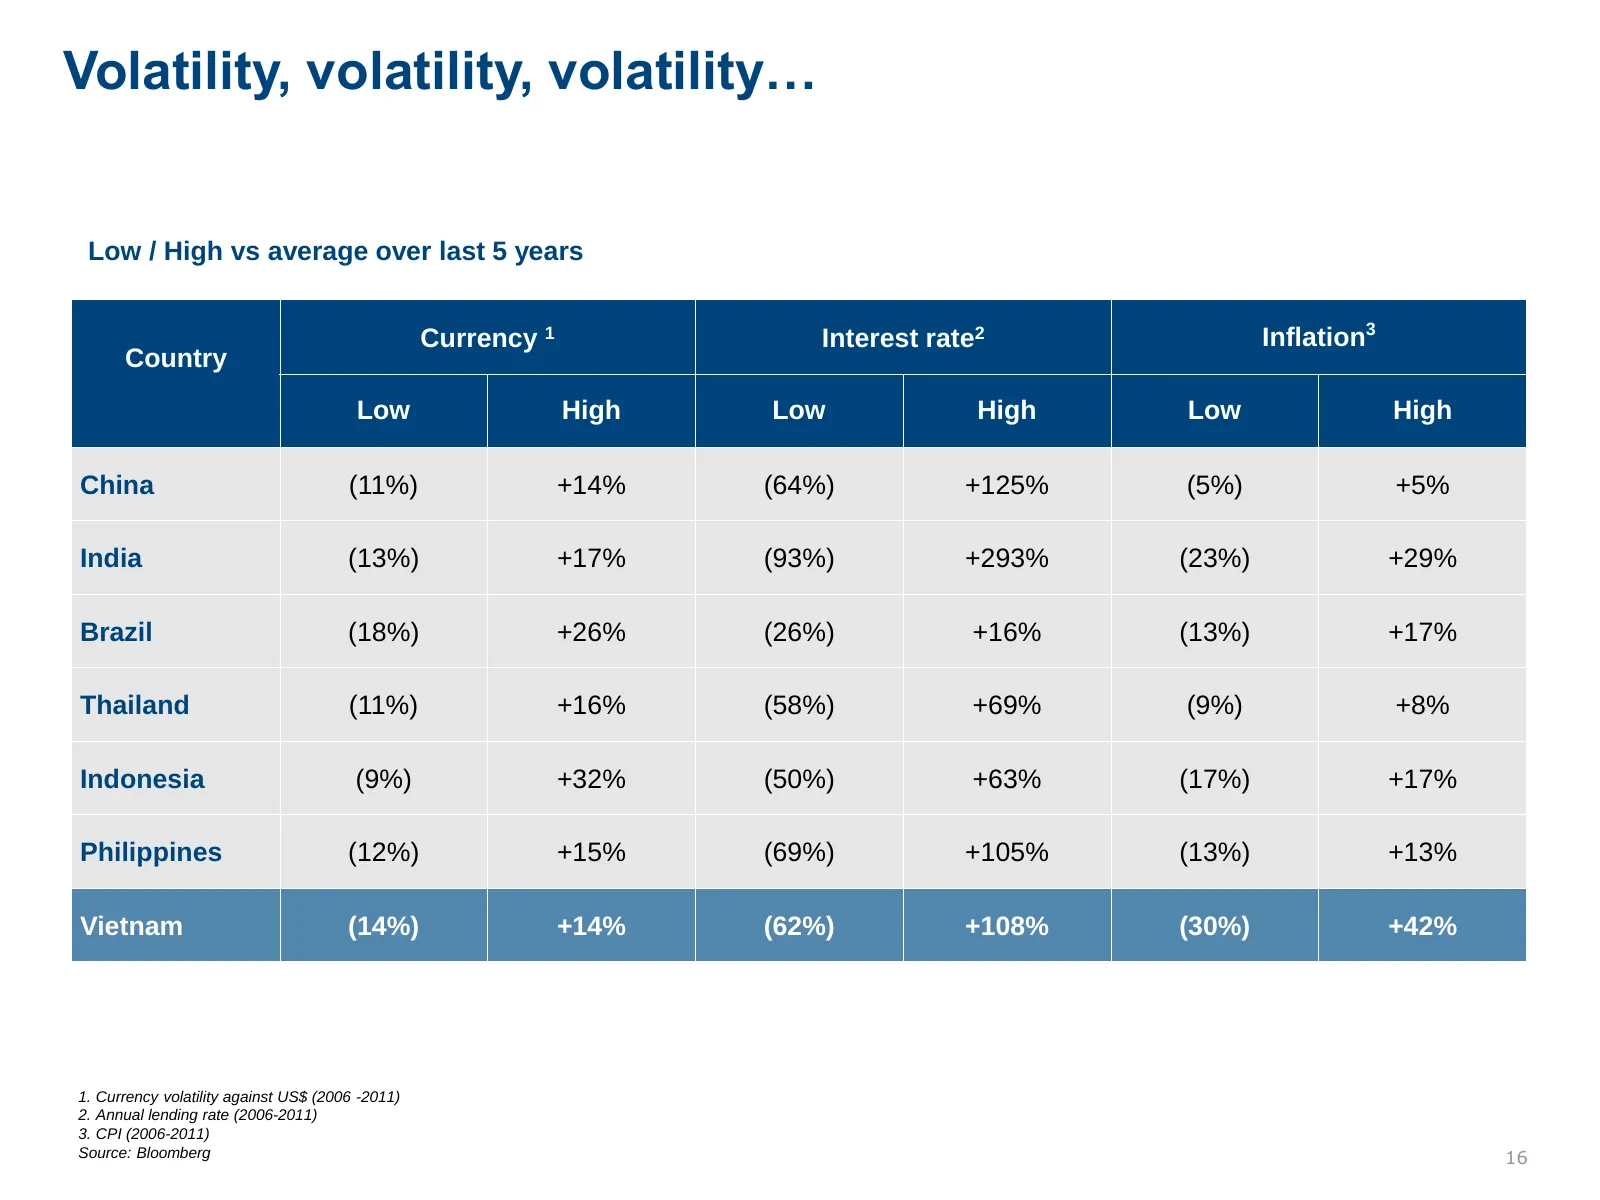
Slide 16: Volatility, volatility, volatility
Volatility, volatility, volatility… Low / High vs average over last 5 years Currency 1 Interest rate2 Inflation3 Country Low High Low High Low High China (11%) +14% (64%) +125% (5%) +5% India (13%) +17% (93%) +293% (23%) +29% Brazil (18%) +26% (26%) +16% (13%) +17% Thailand (11%) +16% (58%) +69% (9%
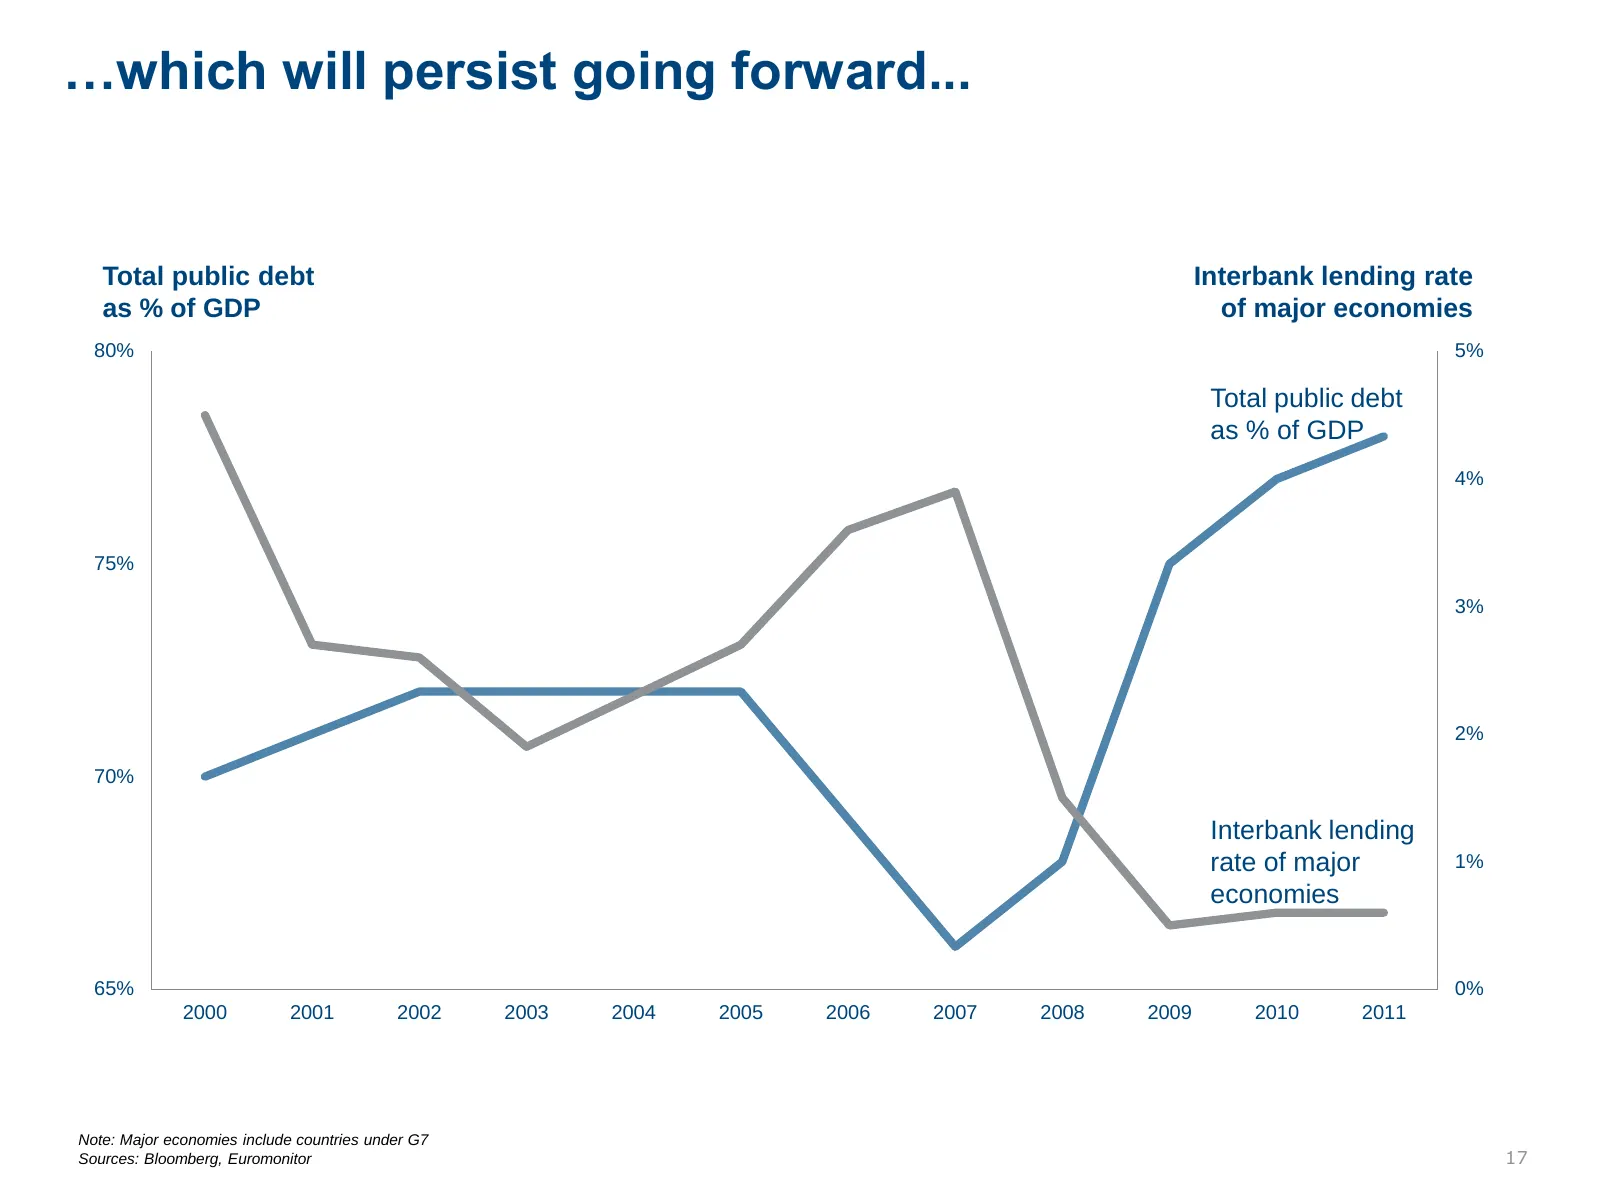
Slide 17: Volatility will persist going forward
…which will persist going forward... Total public debt Interbank lending rate as % of GDP of major economies 80% 5% Total public debt as % of GDP 4% 75% 3% 2% 70% Interbank lending rate of major 1% economies 65% 0% 2000 2001 2002 2003 2004 2005 2006 2007 2008 2009 2010 2011 Note: Major economies inc
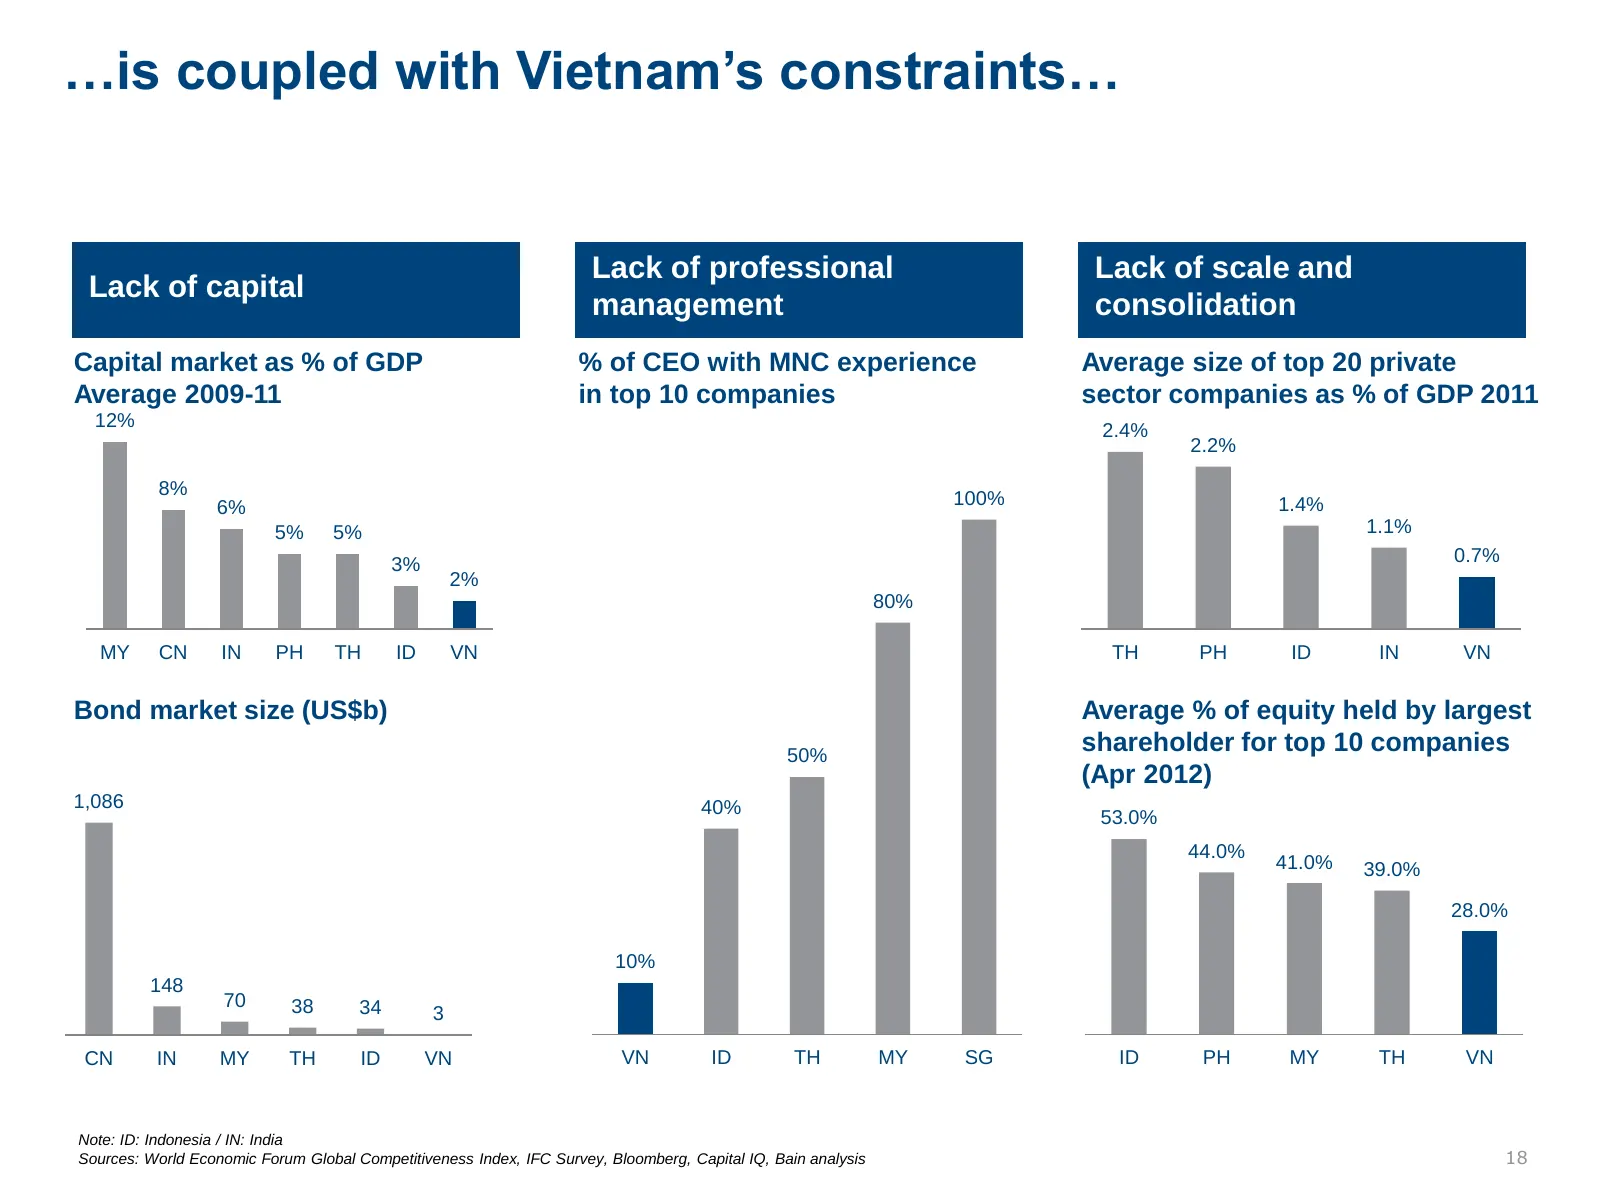
Slide 18: Vietnam's constraints
…is coupled with Vietnam’s constraints… Lack of professional Lack of scale and Lack of capital management consolidation Capital market as % of GDP % of CEO with MNC experience Average size of top 20 private 14% Average 2009-11 in top 10 companies 3.0% sector companies as % of GDP 2011 12% 120% 12% 2
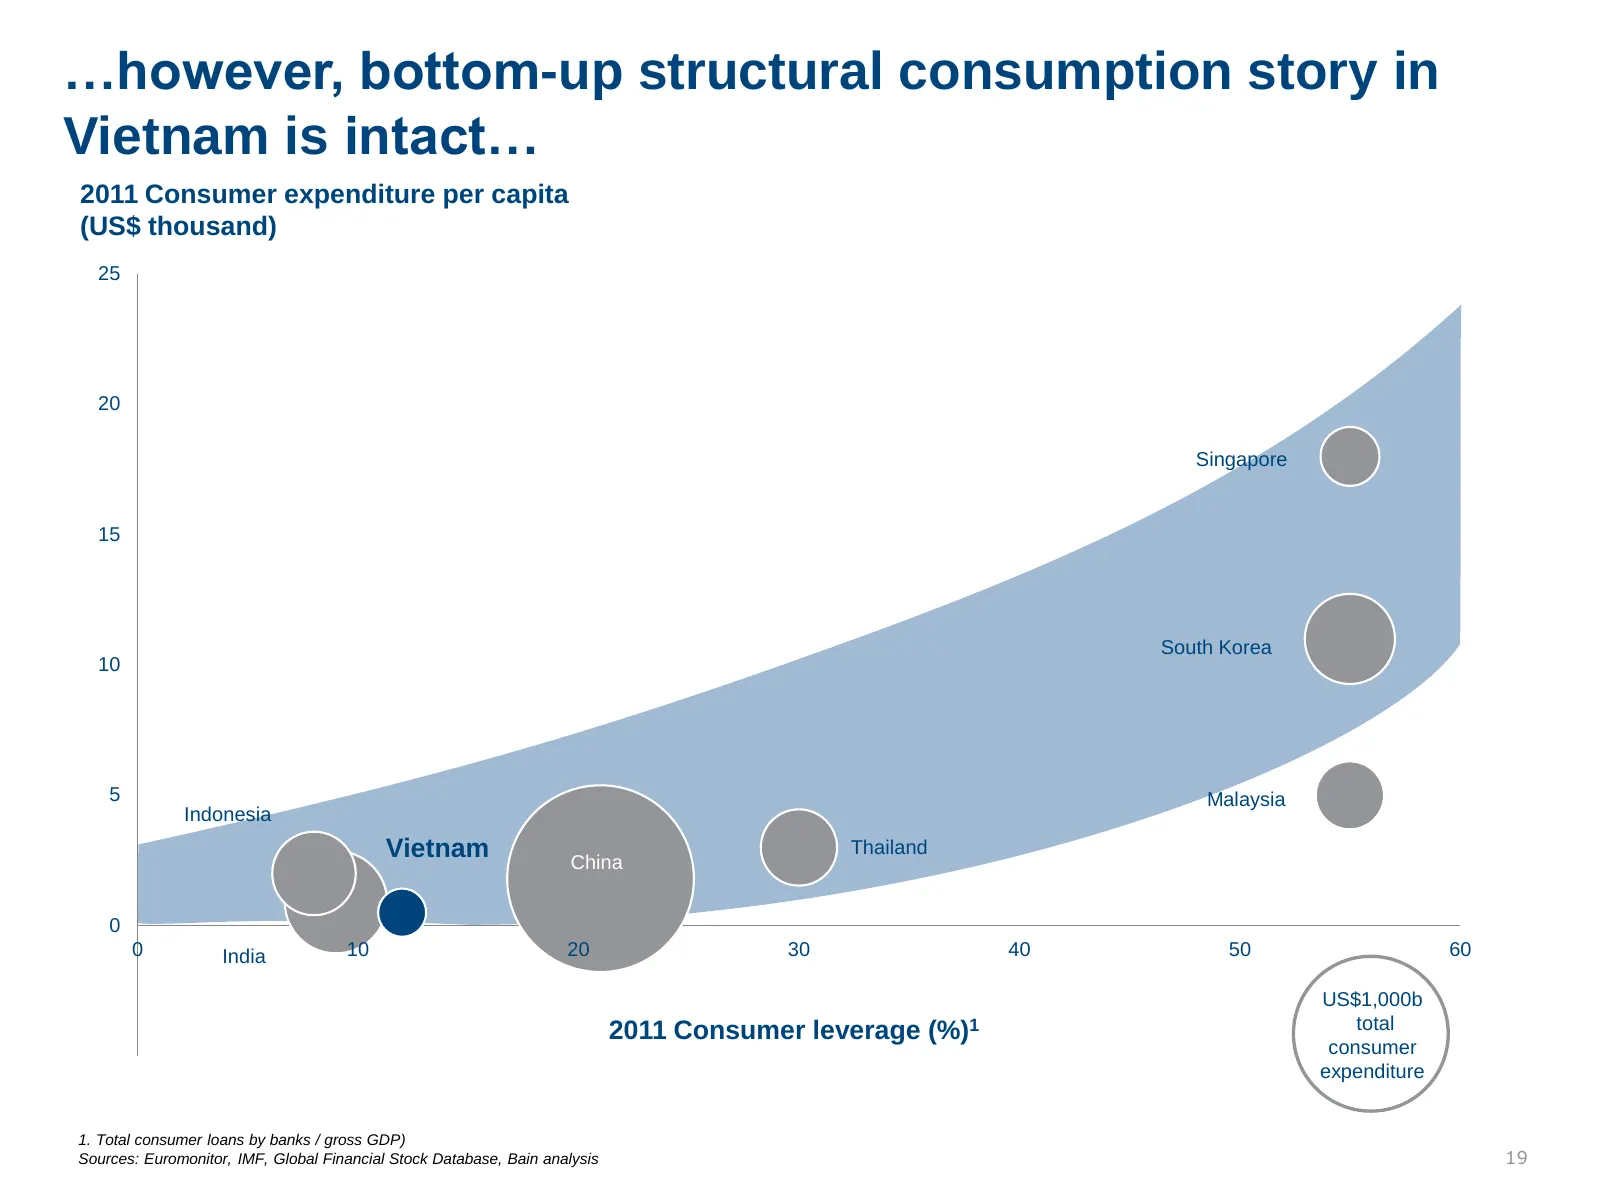
Slide 19: Structural consumption story in Vietnam is intact
…however, bottom-up structural consumption story in Vietnam is intact… 2011 Consumer expenditure per capita (US$ thousand) 25 20 Singapore 15 South Korea 10 5 Malaysia Indonesia Vietnam China Thailand 0 0 India 10 20 30 40 50 60 US$1,000b 2011 Consumer leverage (%)1 total -5 consumer expenditure 1.
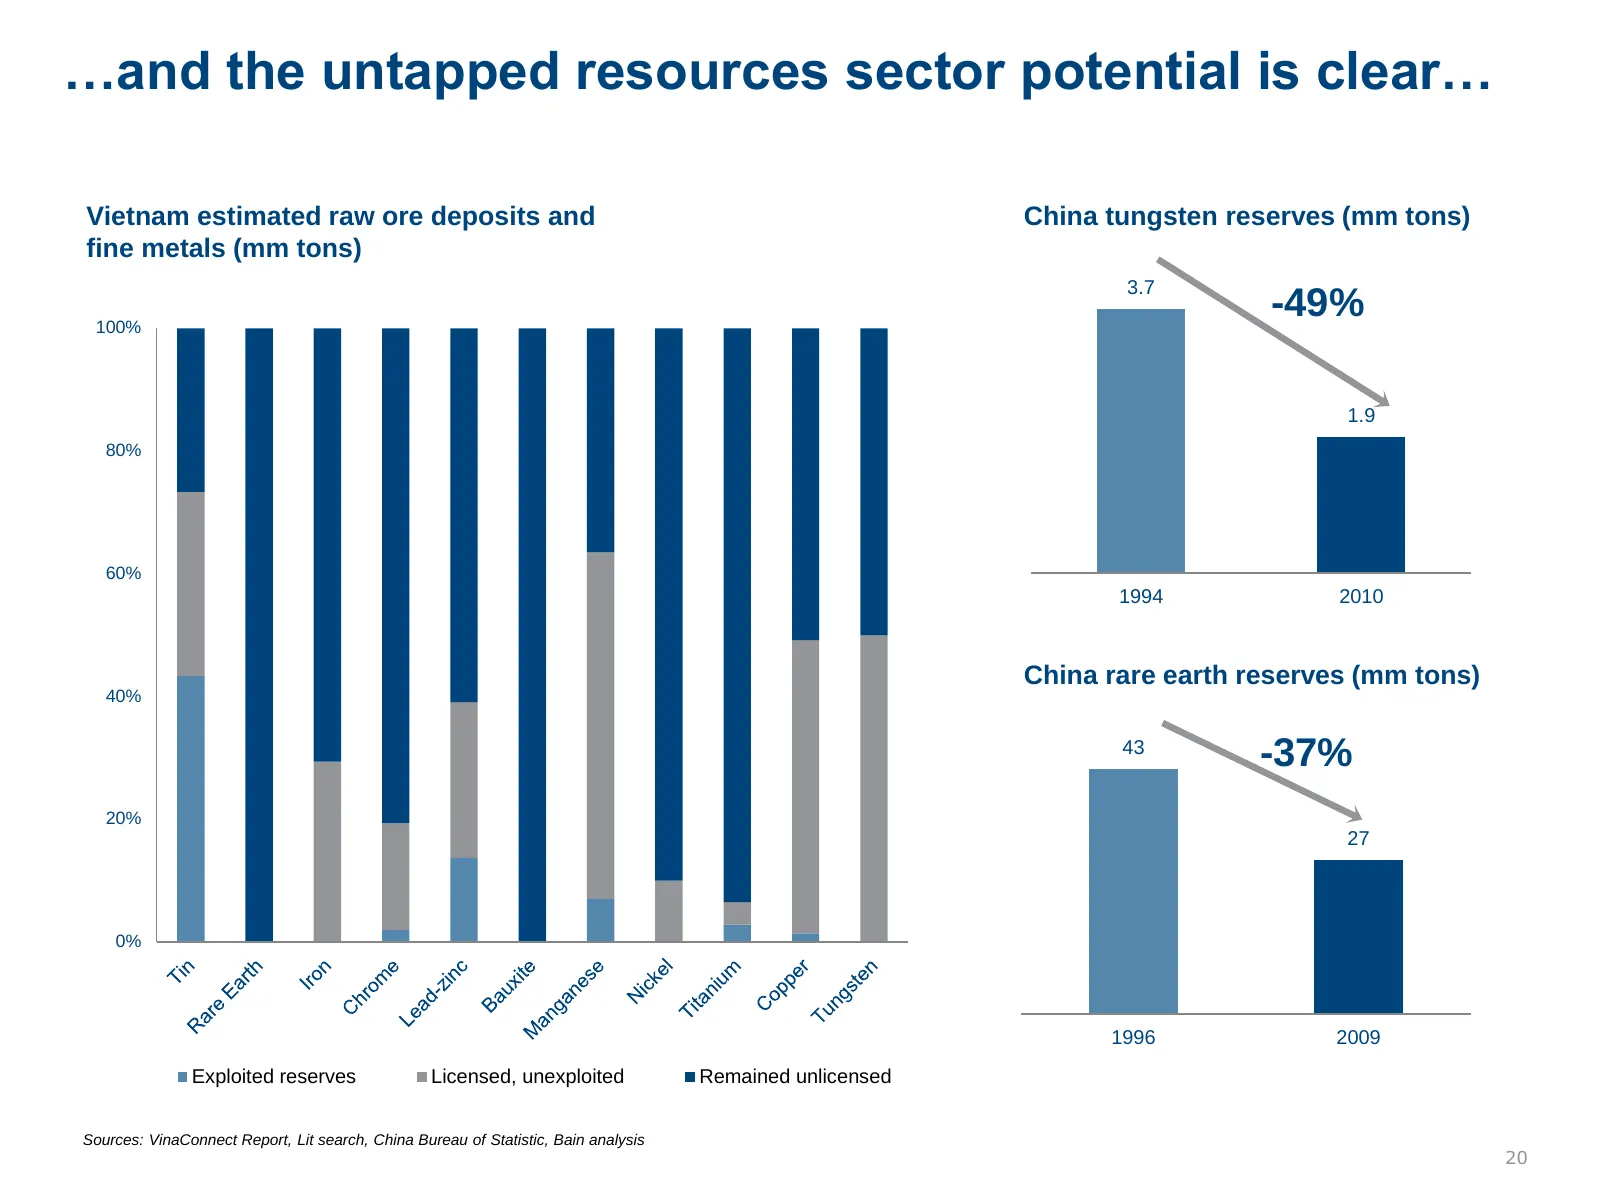
Slide 20: Untapped resources sector potential is clear
…and the untapped resources sector potential is clear… Vietnam estimated raw ore deposits and China tungsten reserves (mm tons) fine metals (mm tons) 4 3.7 100% 3.5 -49% 3 2.5 1.9 2 80% 1.5 1 0.5 60% 0 1994 2010 China rare earth reserves (mm tons) 40% 50 45 43 -37% 40 20% 35 30 27 25 20 15 0% 10 5 0
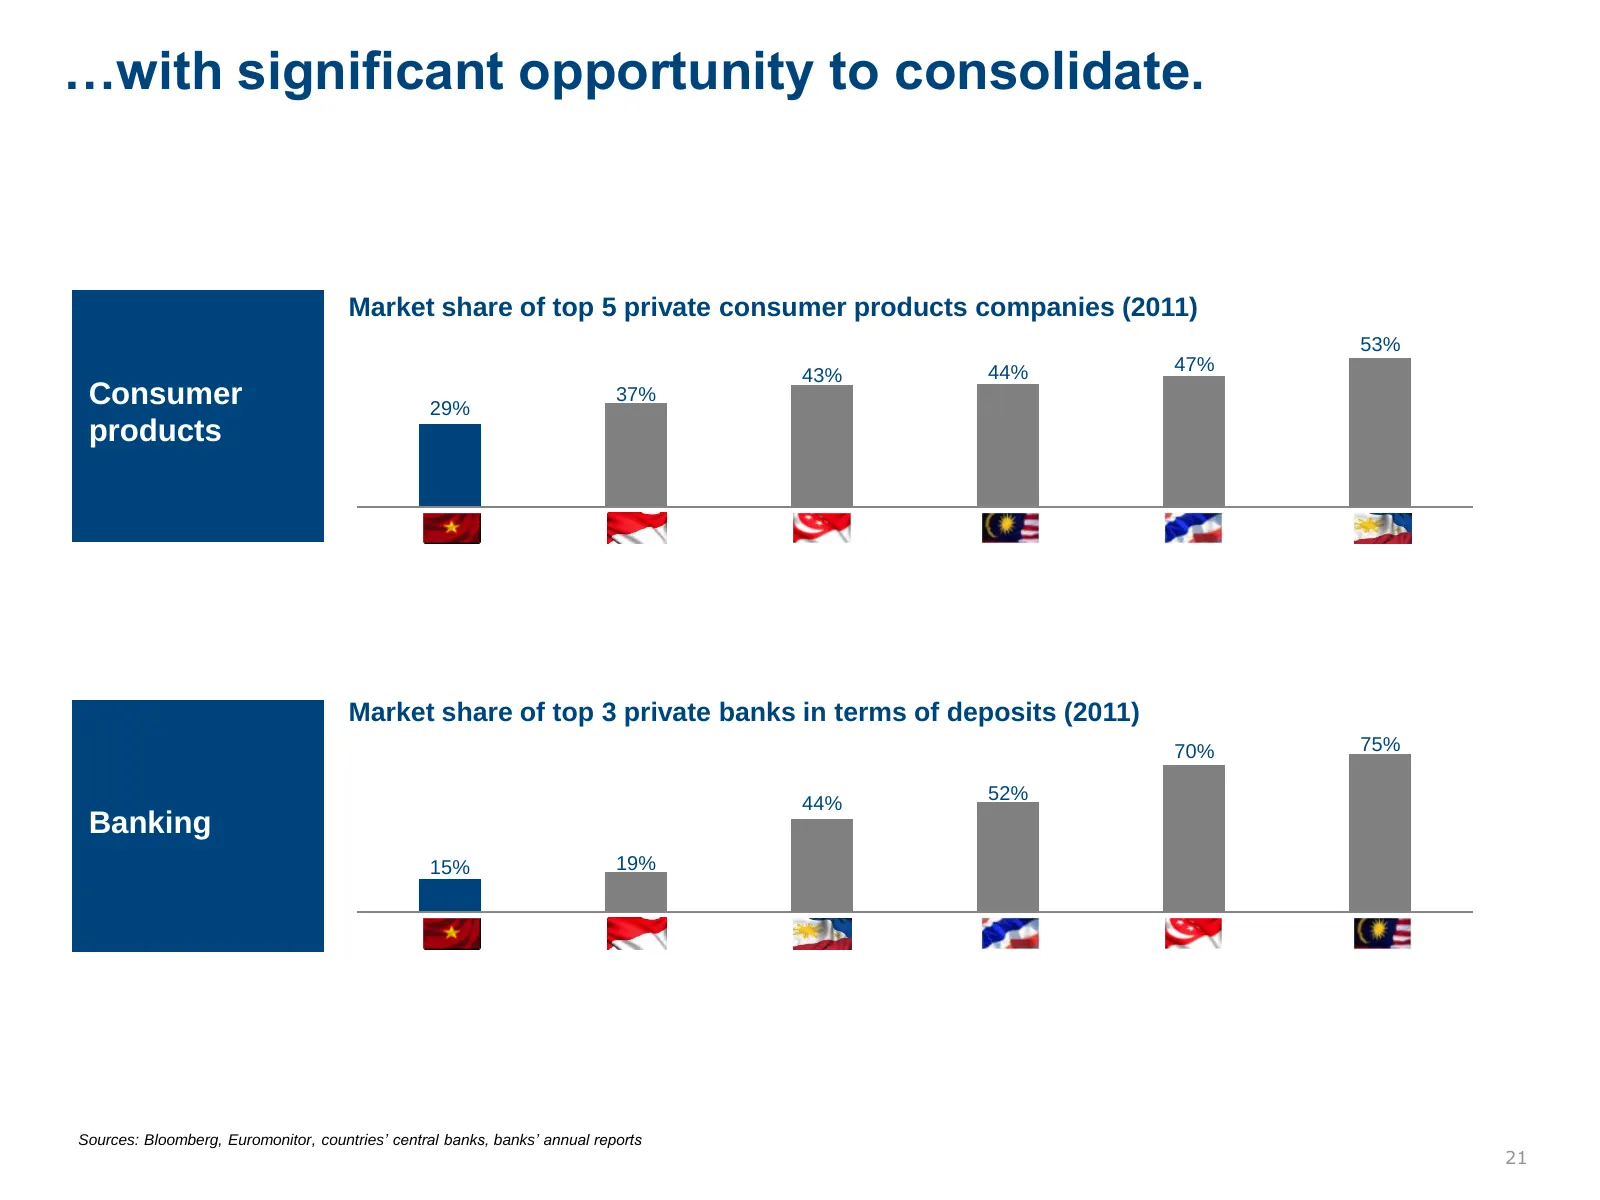
Slide 21: Significant opportunity to consolidate
…with significant opportunity to consolidate. Market share of top 5 private consumer products companies (2011) 53% 44% 47% 43% Consumer 29% 37% products Vietnam Indonesia Singapore Malaysia Thailand Philippines Market share of top 3 private banks in terms of deposits (2011) 70% 75% 44% 52% Banking 1
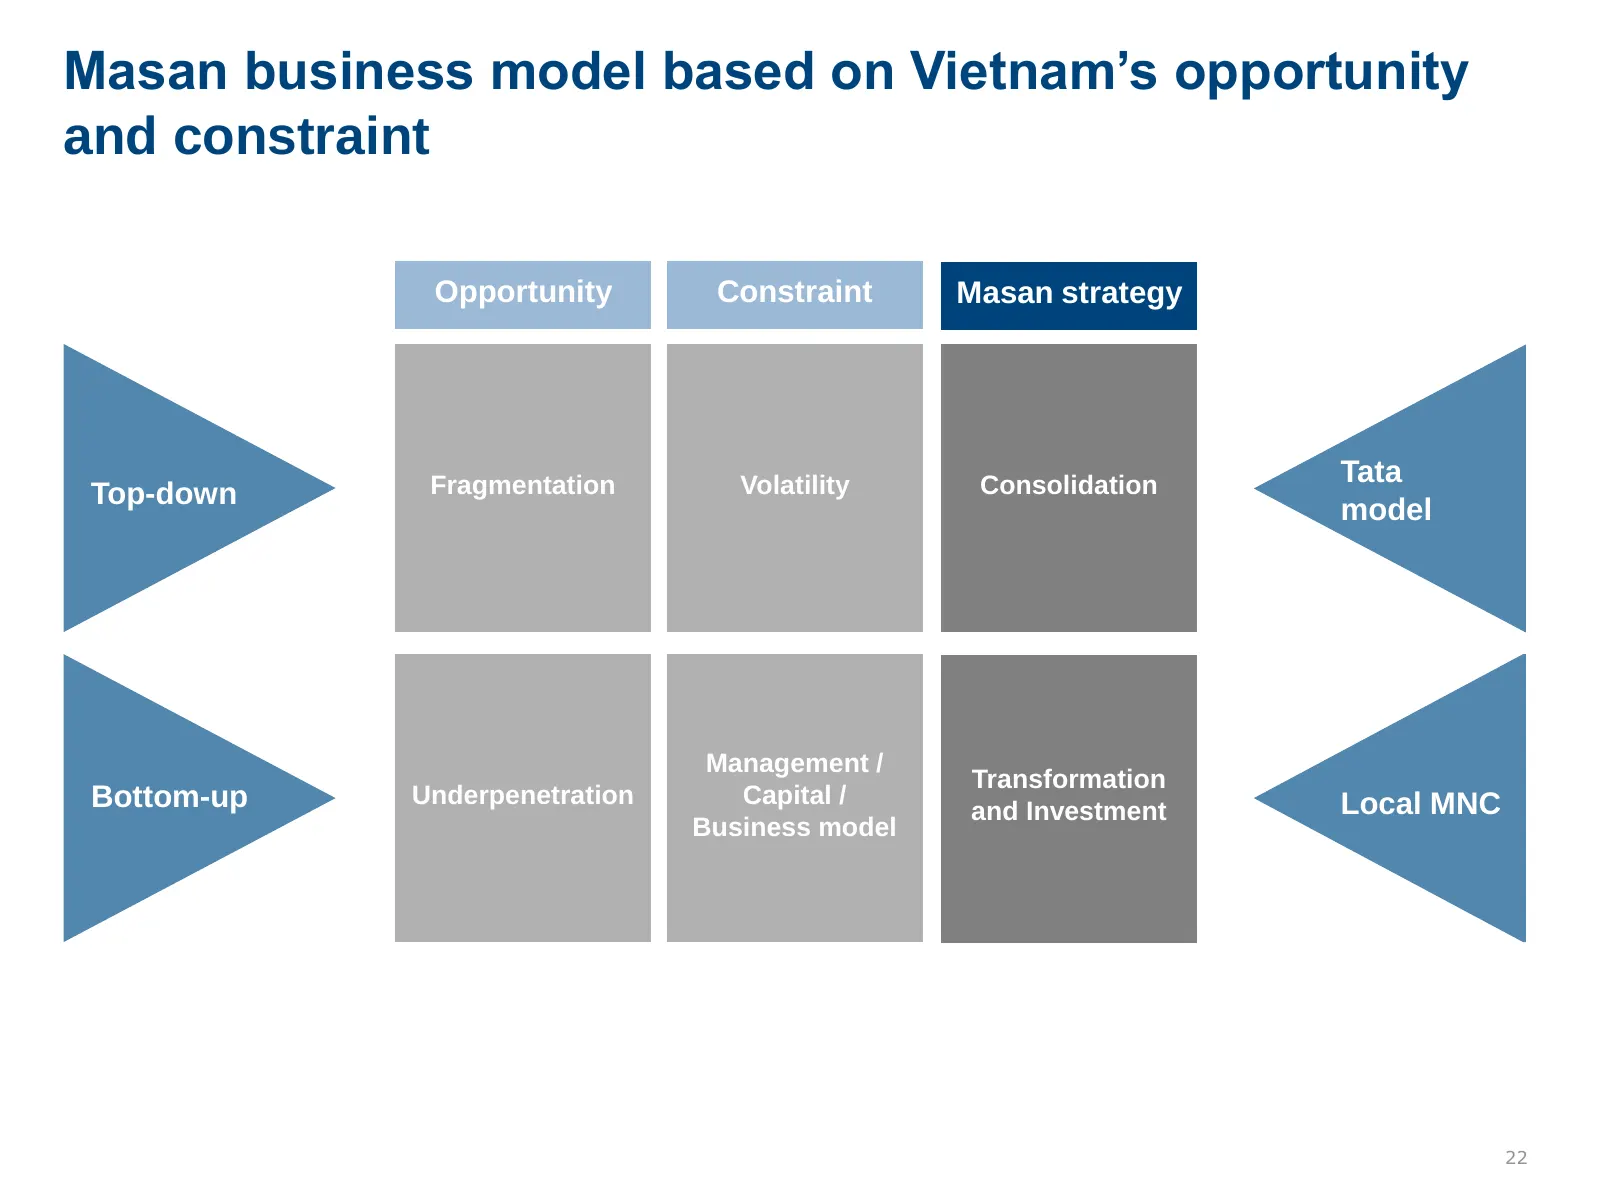
Slide 22: Masan business model based on Vietnam's opportunity and constraint
Masan business model based on Vietnam’s opportunity and constraint Opportunity Constraint Masan strategy Fragmentation Volatility Consolidation Tata Top-down model Management / Transformation Bottom-up Underpenetration Capital / Local MNC and Investment Business model 22
Slide 23: Top-down Tata model
Top-down Tata model 23

Slide 24: Osho quote
“It’s not a question of learning much. On the contrary. It’s a question of unlearning much” Osho Indian professor of philosophy and spiritual teacher 24
Slide 25: Masan business model based on Vietnam's opportunity and constraint
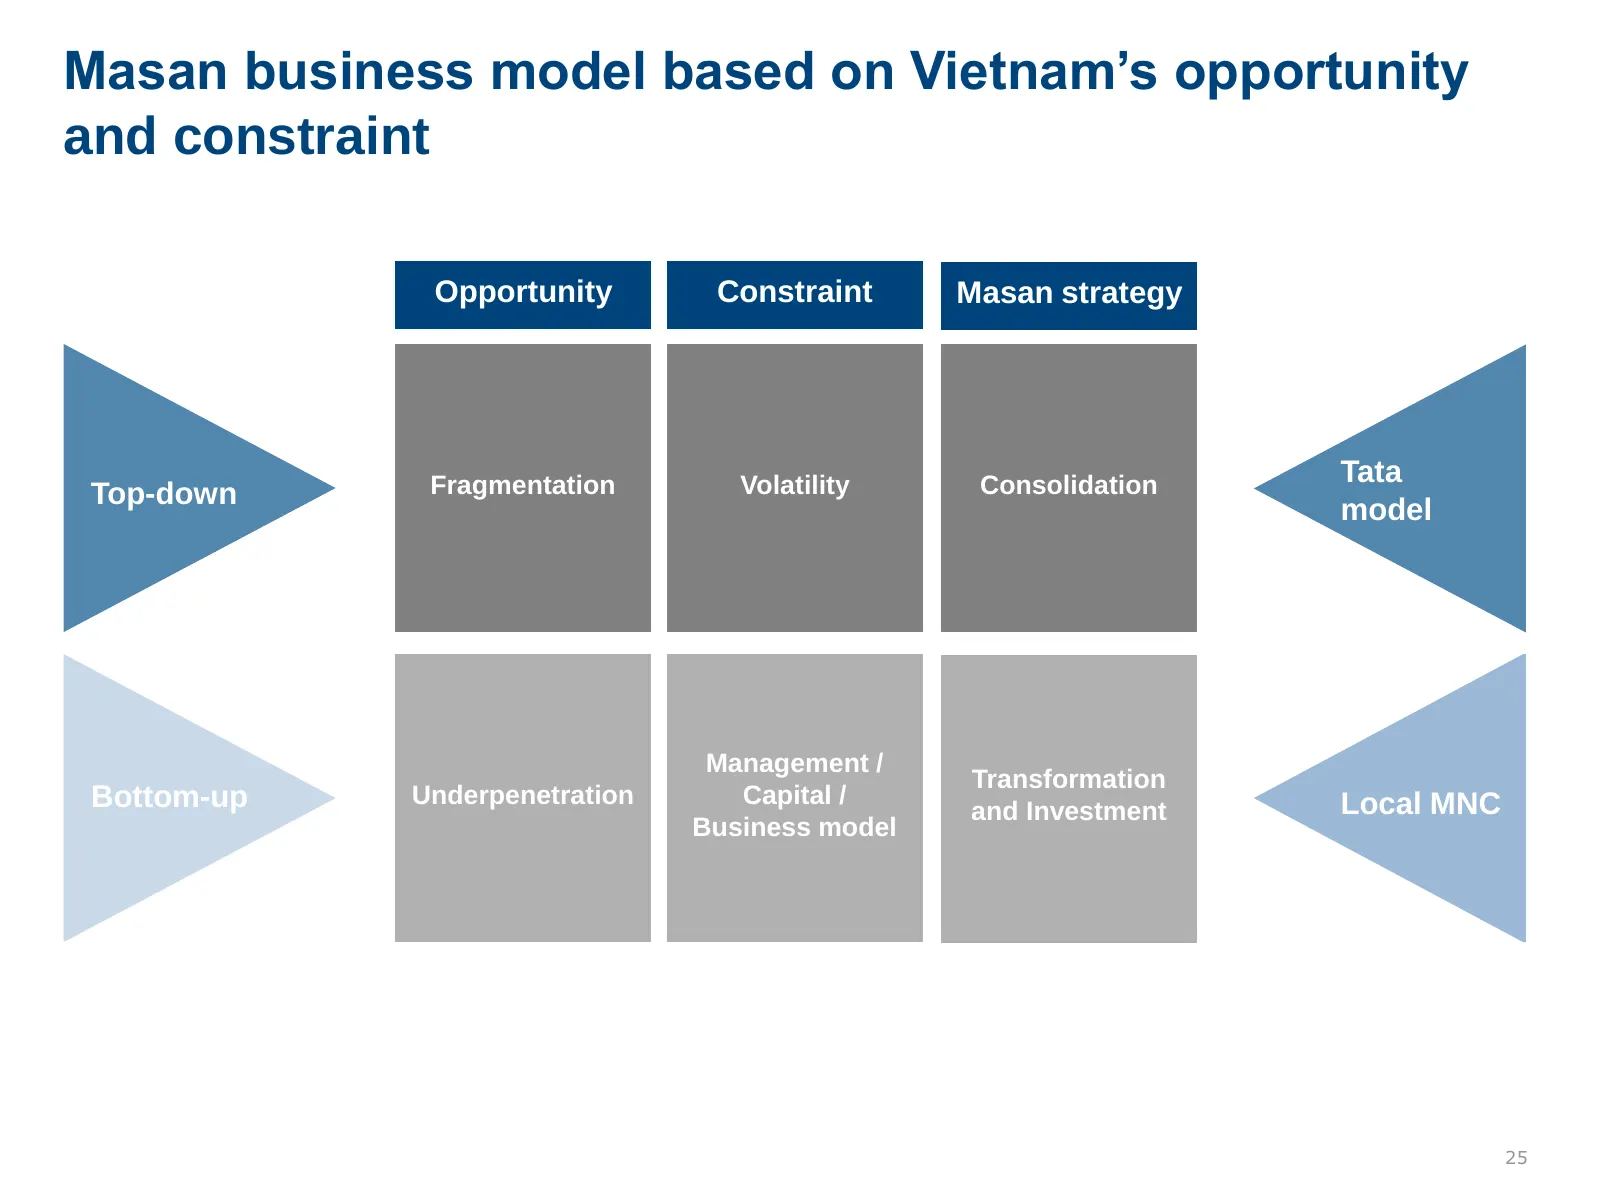
Masan business model based on Vietnam’s opportunity and constraint Opportunity Constraint Masan strategy Fragmentation Volatility Consolidation Tata Top-down model Management / Transformation Bottom-up Underpenetration Capital / Local MNC and Investment Business model 25
Slide 26: Raised ~US$1b of capital from best-in-class partners
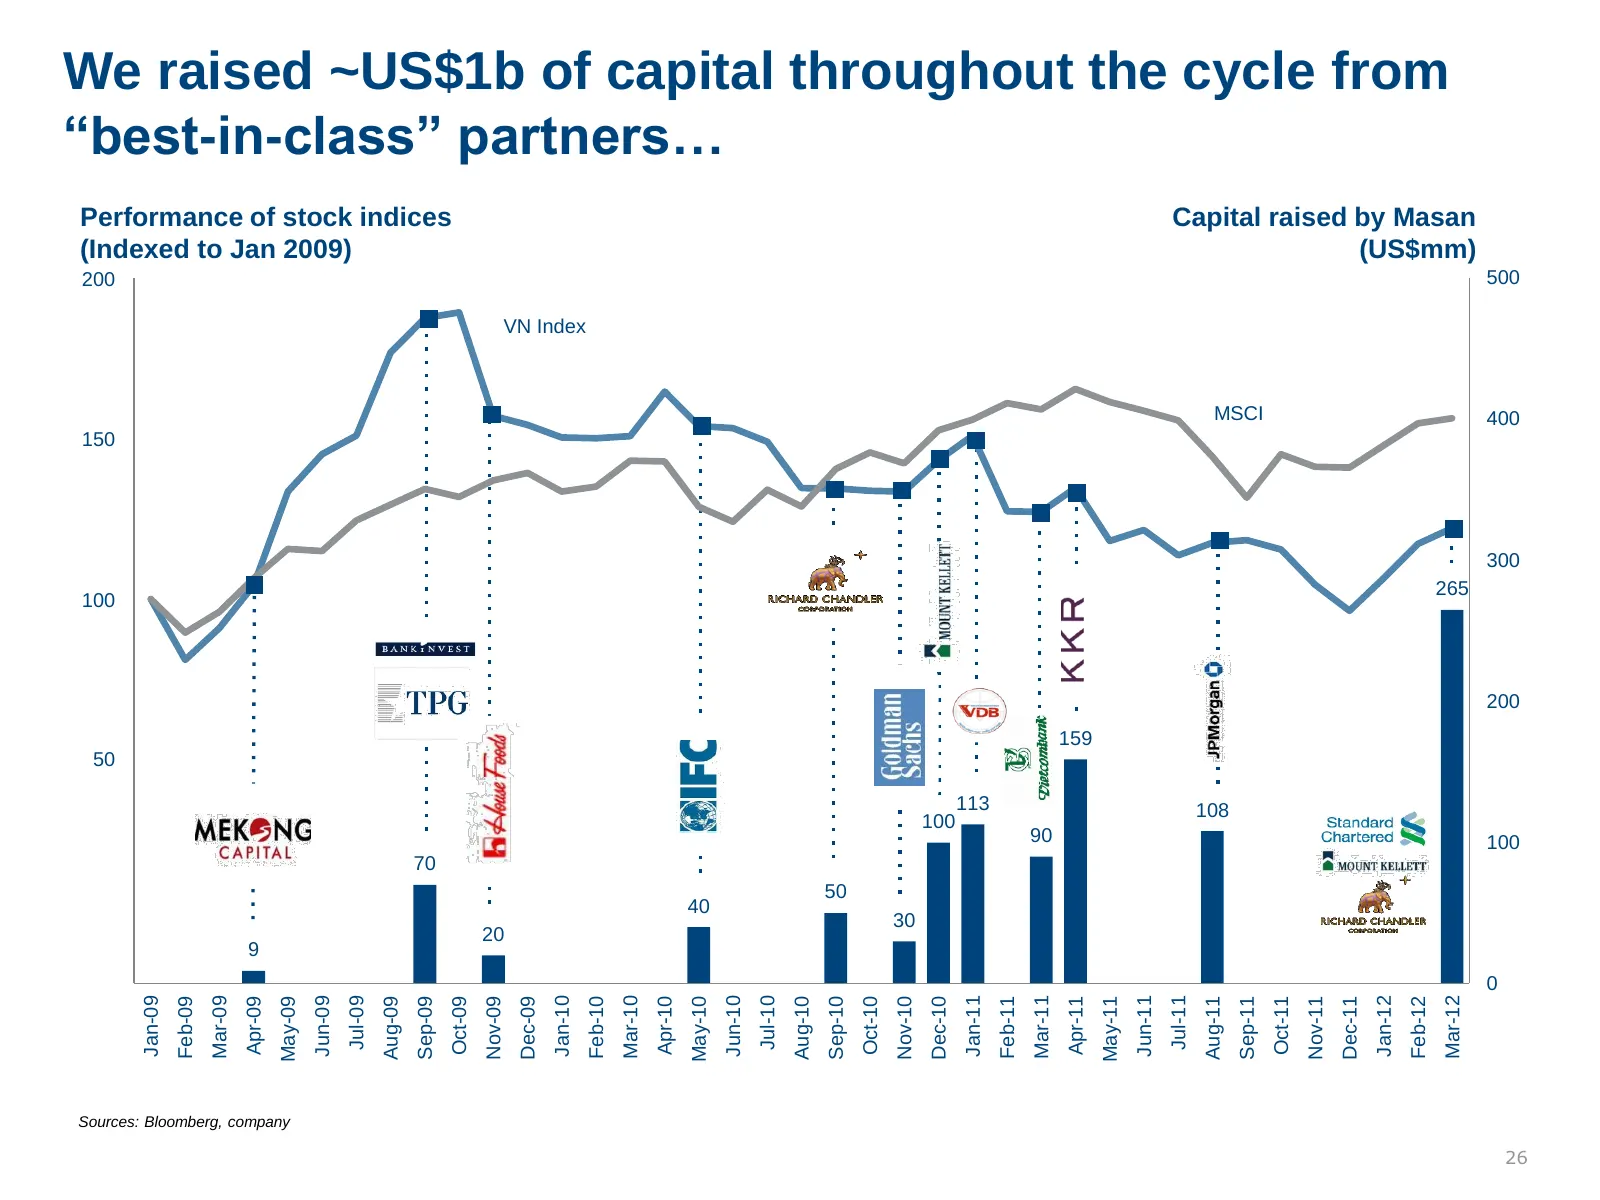
We raised ~US$1b of capital throughout the cycle from “best-in-class” partners… Performance of stock indices Capital raised by Masan (Indexed to Jan 2009) (US$mm) 200 500 190 VN Index 180 170 160 MSCI 400 150 140 130 120 110 300 265 100 90 80 70 200 60 159 50 40 113 108 30 100 90 100 20 70 10 50 40
Slide 27: Stringent in allocating capital
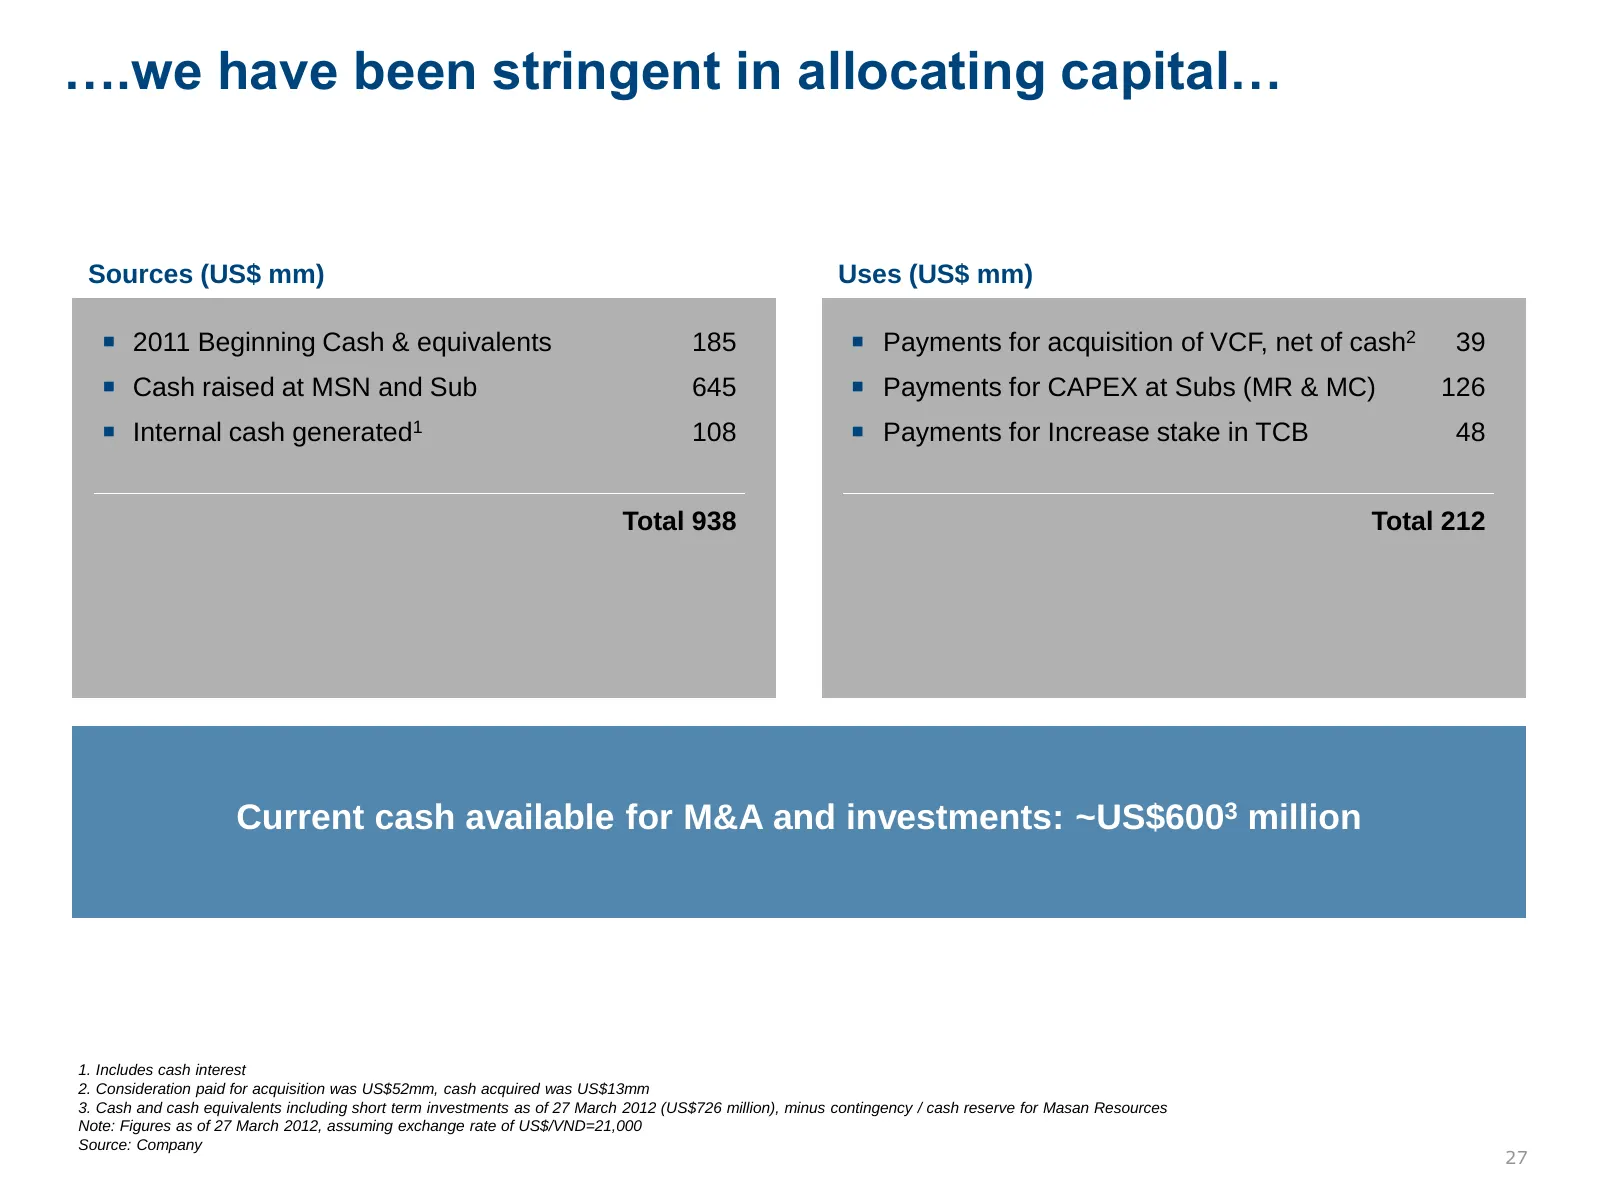
….we have been stringent in allocating capital… Sources (US$ mm) Uses (US$ mm) ■ 2011 Beginning Cash & equivalents 185 ■ Payments for acquisition of VCF, net of cash2 39 ■ Cash raised at MSN and Sub 645 ■ Payments for CAPEX at Subs (MR & MC) 126 ■ Internal cash generated1 108 ■ Payments for Increase
Slide 28: Strong returns through M&A
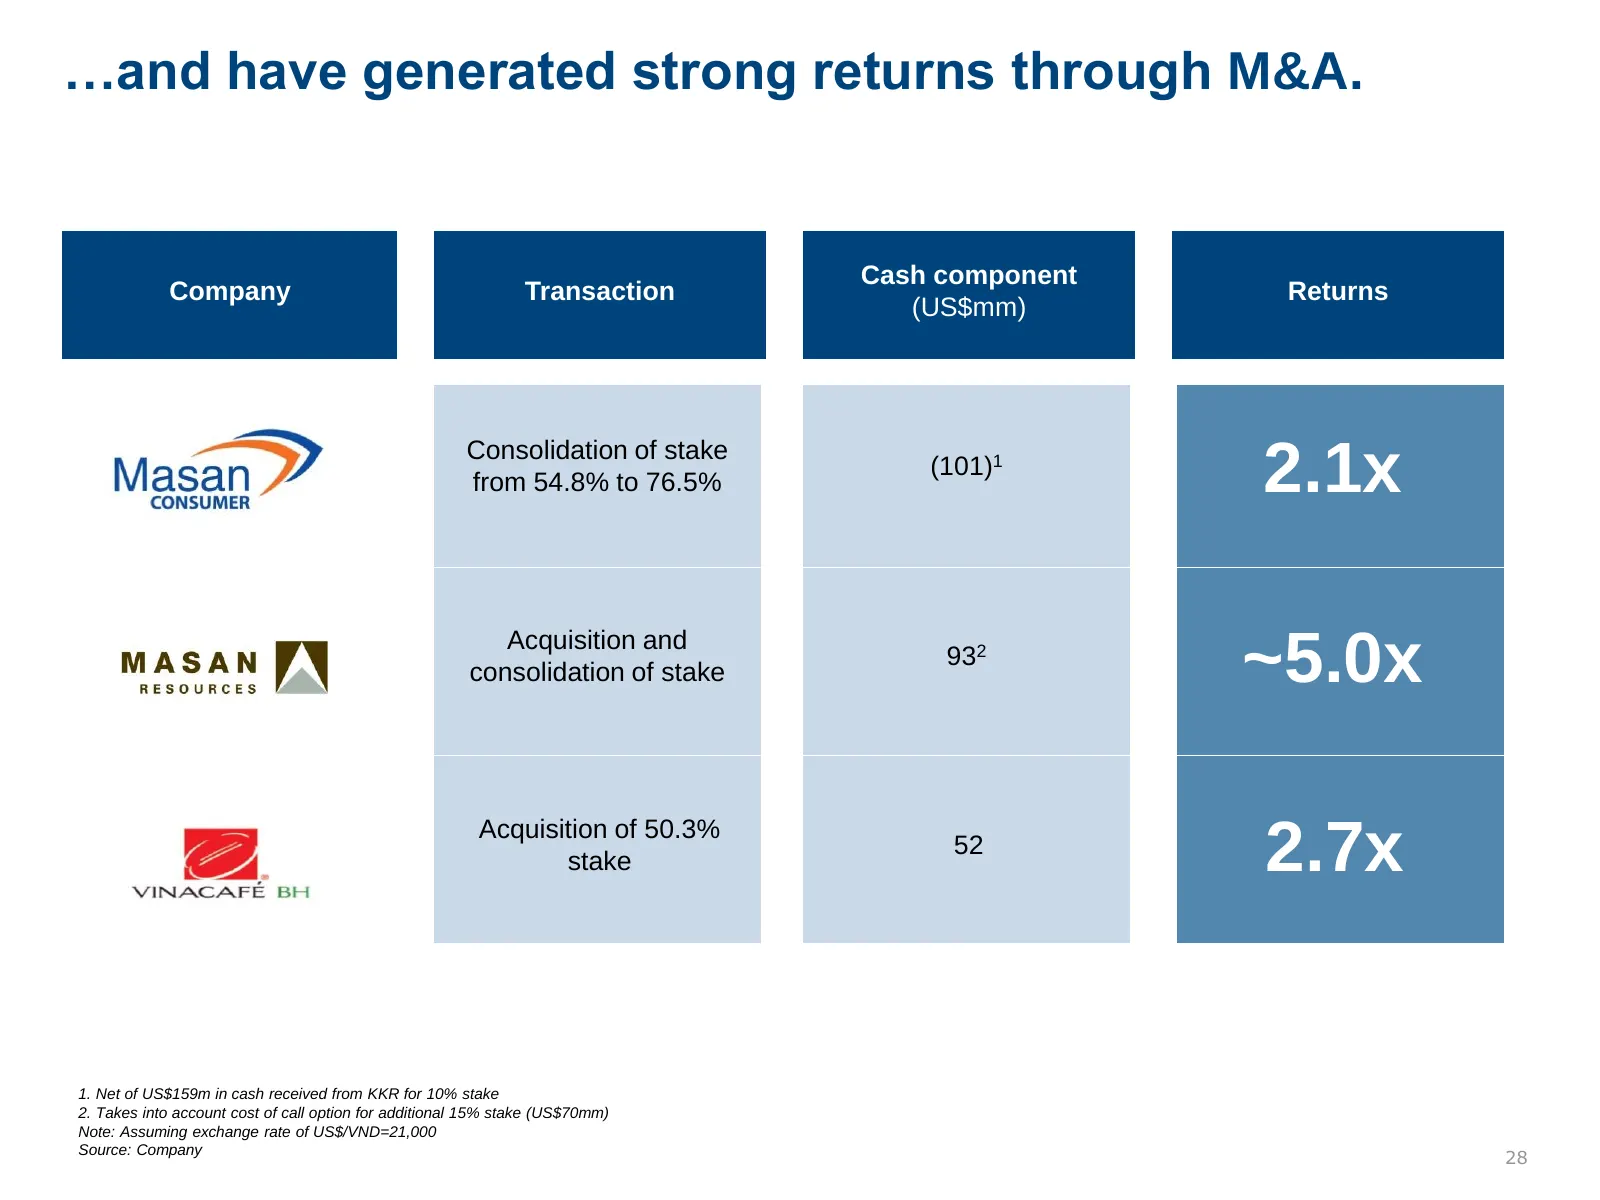
…and have generated strong returns through M&A. Cash component Company Transaction Returns (US$mm) Consolidation of stake from 54.8% to 76.5% (101)1 2.1x Acquisition and consolidation of stake 932 ~5.0x Acquisition of 50.3% stake 52 2.7x 1. Net of US$159m in cash received from KKR for 10% stake 2. T
Slide 29: Business performance has increased our market value
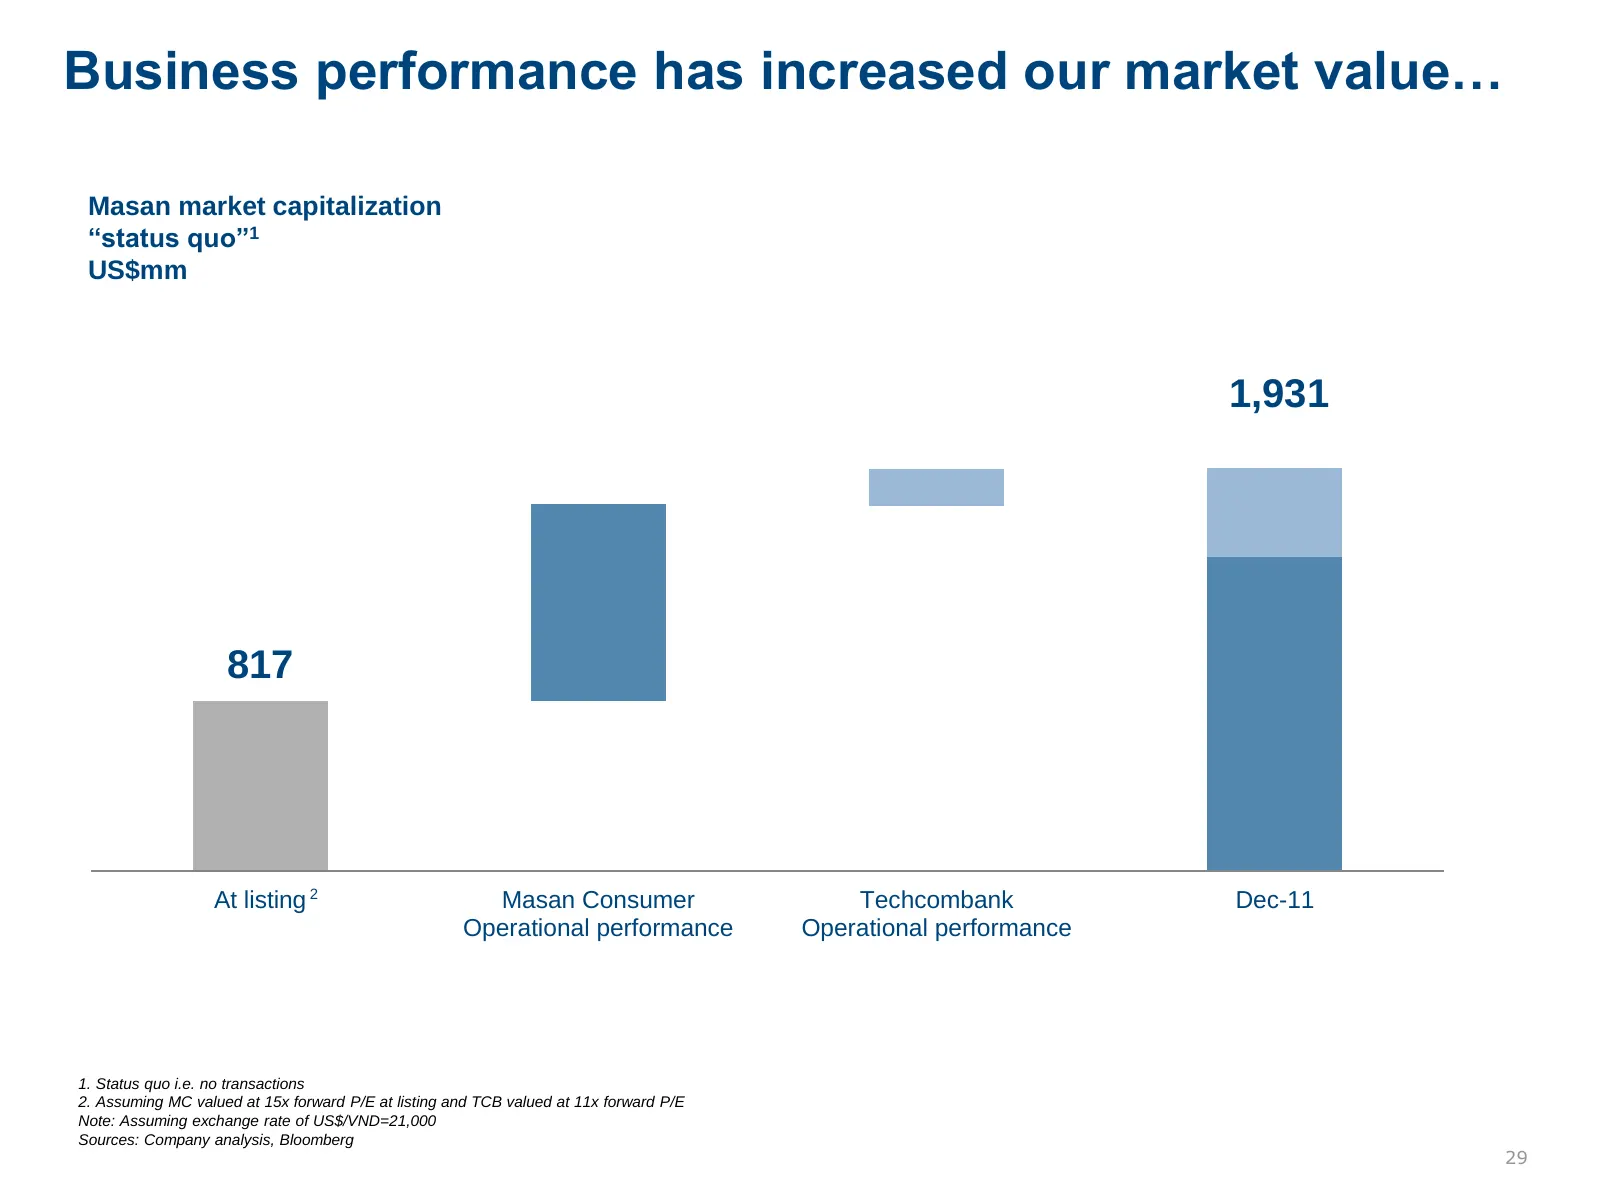
Business performance has increased our market value… Masan market capitalization “status quo”1 US$mm 1,931 817 At listing 2 Masan Consumer Techcombank Dec-11 Operational performance Operational performance 1. Status quo i.e. no transactions 2. Assuming MC valued at 15x forward P/E at listing and TCB
Slide 30: Shareholder value created through capital allocation
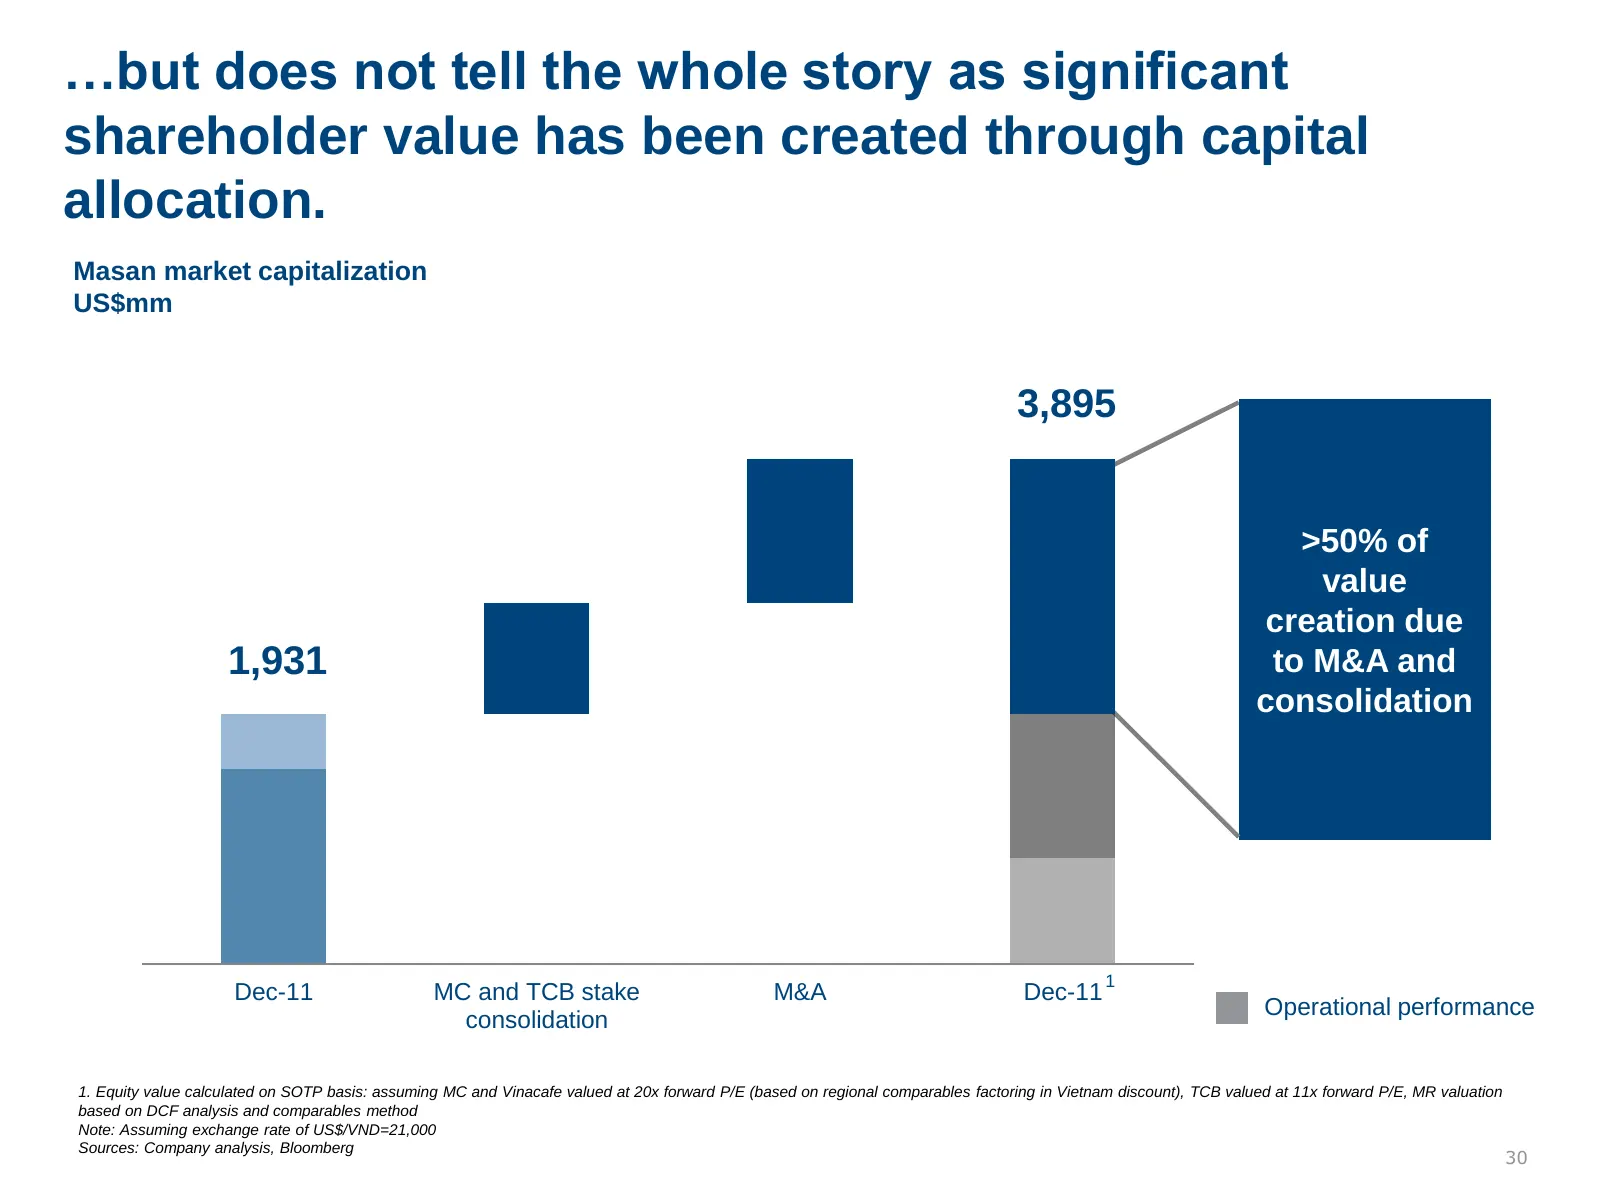
…but does not tell the whole story as significant shareholder value has been created through capital allocation. Masan market capitalization US$mm 3,895 >50% of value creation due 1,931 to M&A and consolidation 1 Dec-11 MC and TCB stake M&A Dec-11 Operational performance consolidation 1. Equity valu
Slide 31: Bottom-up Local MNC
Bottom-up Local MNC 31

Slide 32: Pablo Picasso quote
“Every act of creation, is first an act of destruction.” Pablo Picasso Famous Spanish artist 32
Slide 33: Masan business model based on Vietnam's opportunity and constraint
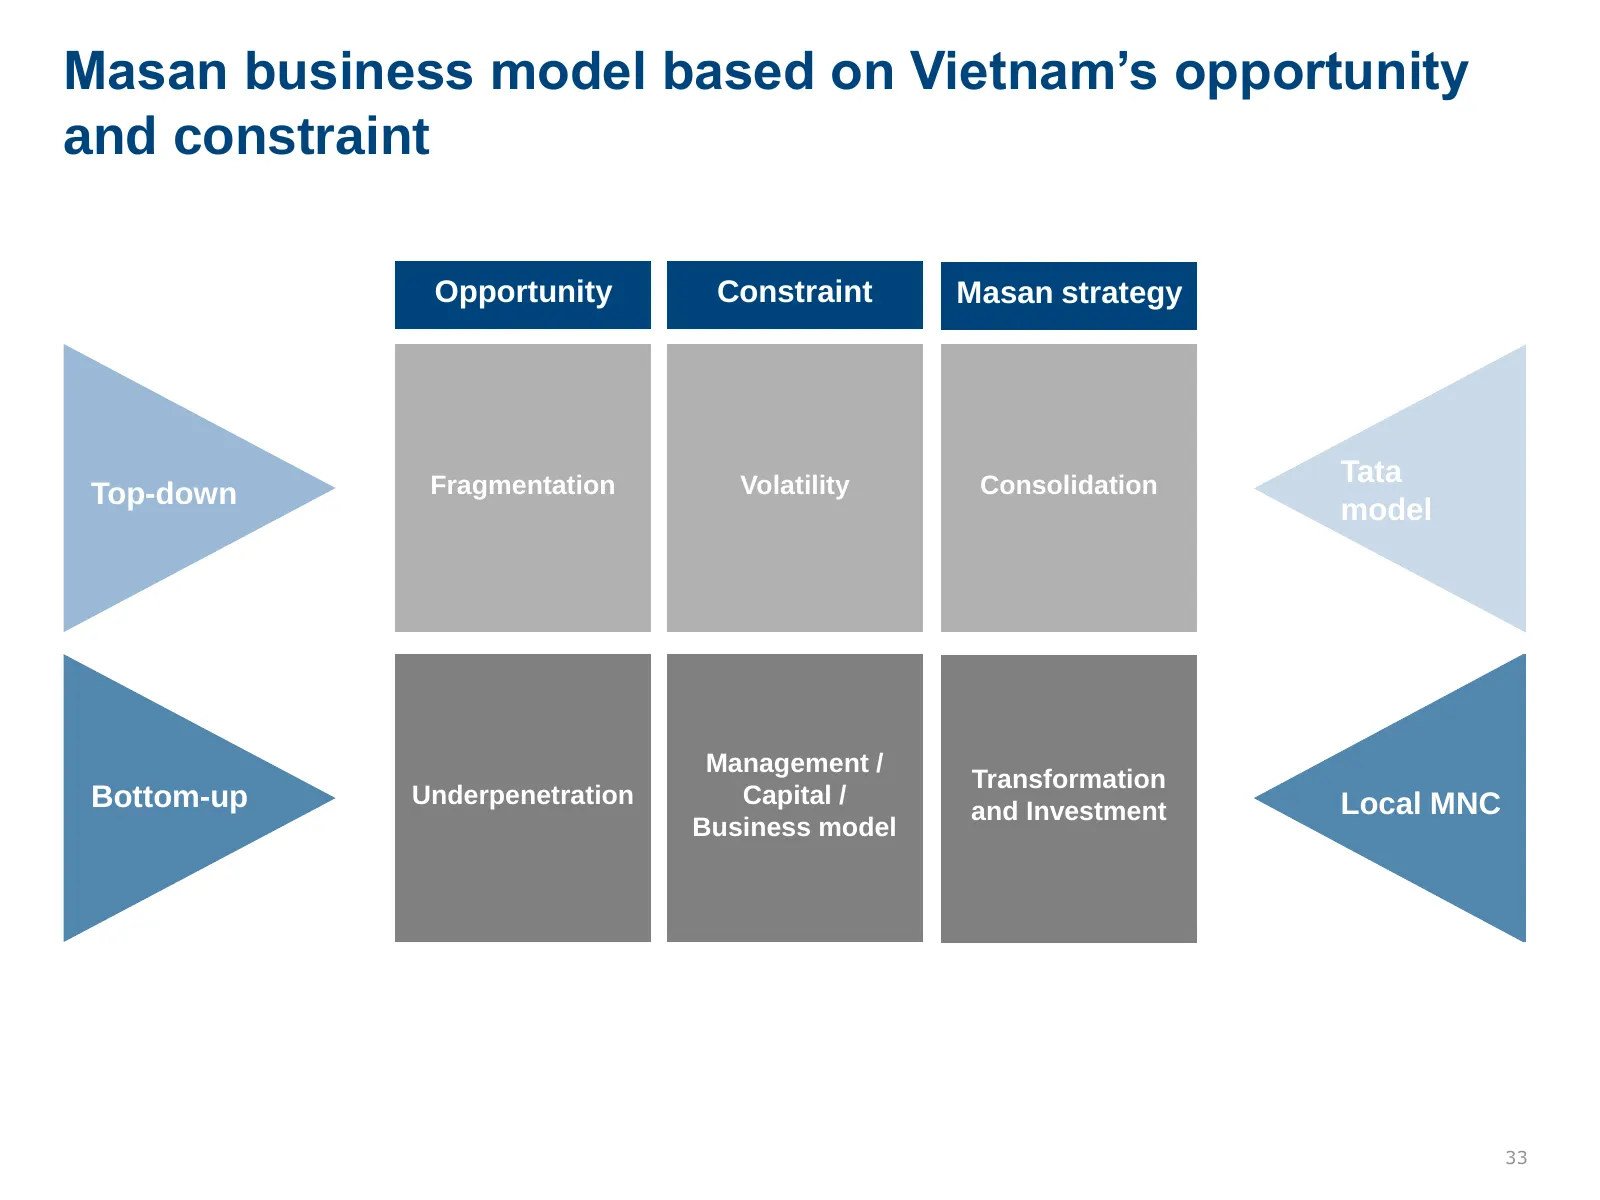
Masan business model based on Vietnam’s opportunity and constraint Opportunity Constraint Masan strategy Fragmentation Volatility Consolidation Tata Top-down model Management / Transformation Bottom-up Underpenetration Capital / Local MNC and Investment Business model 33
Slide 34: How do we judge transformation?
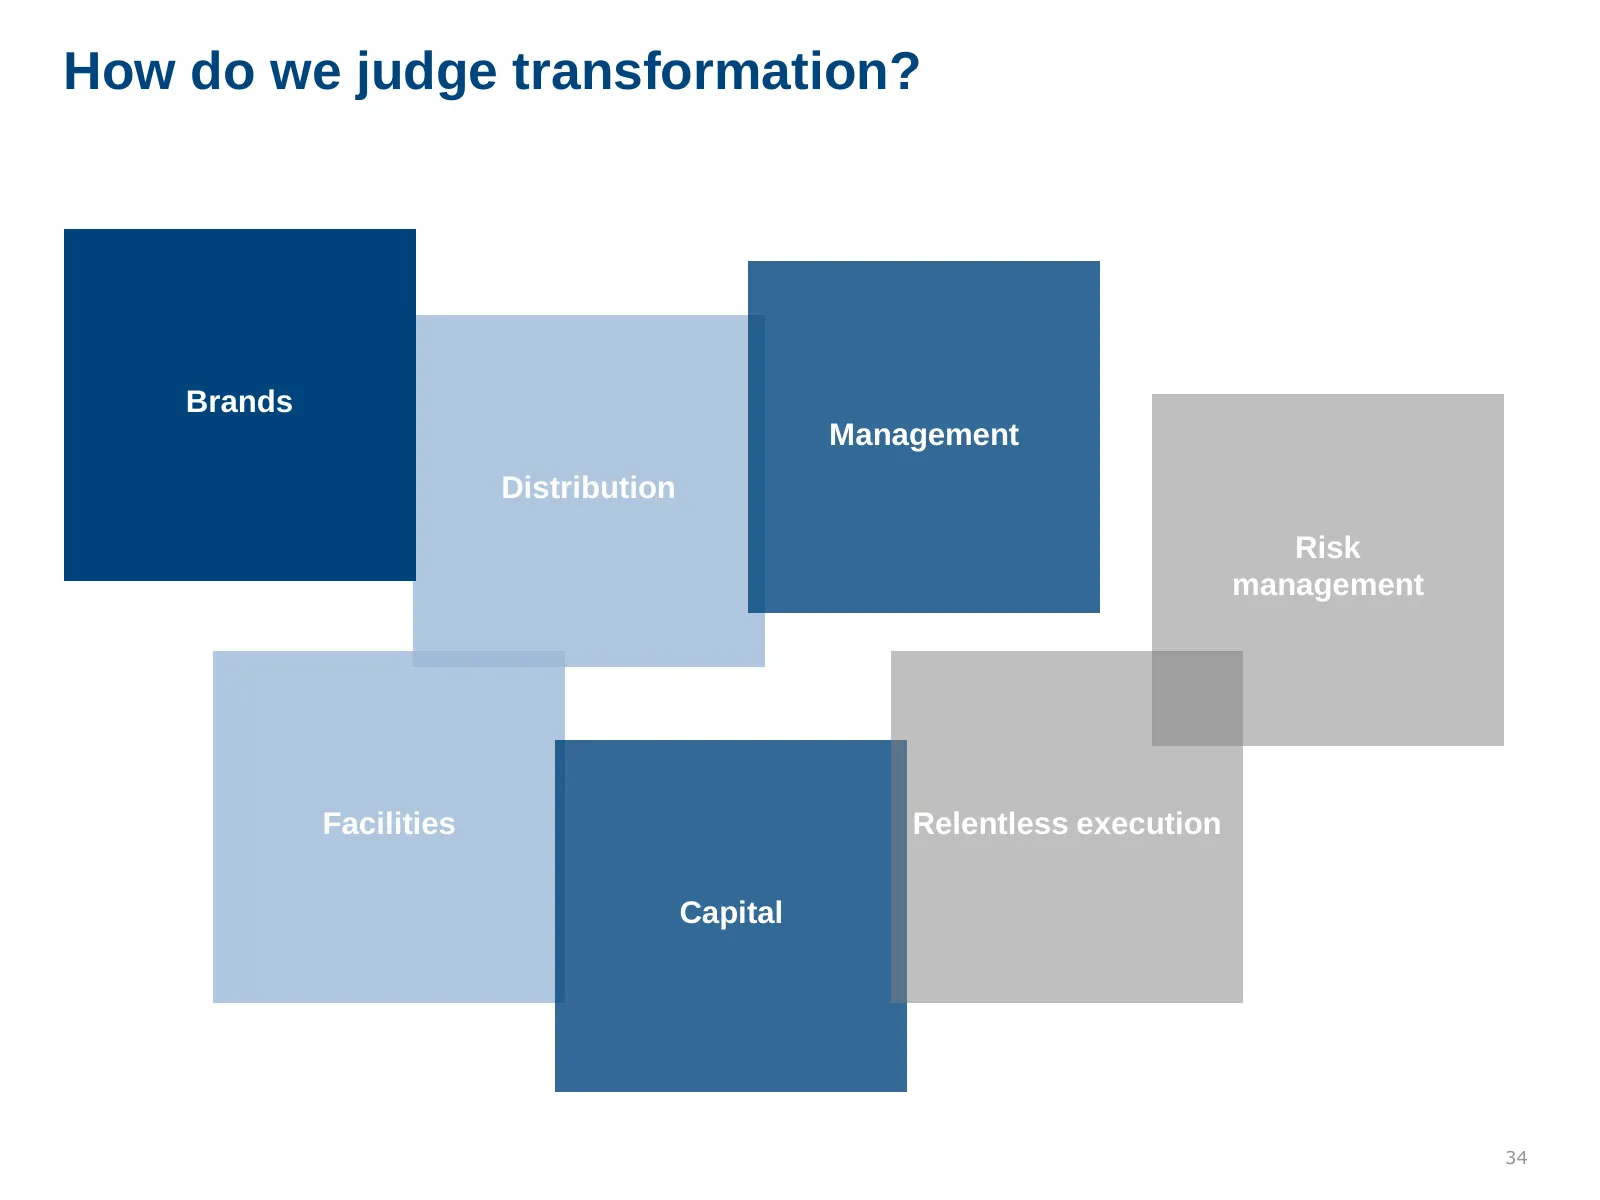
How do we judge transformation? Brands Management Distribution Risk management Facilities Relentless execution Capital 34
Slide 35: Brands
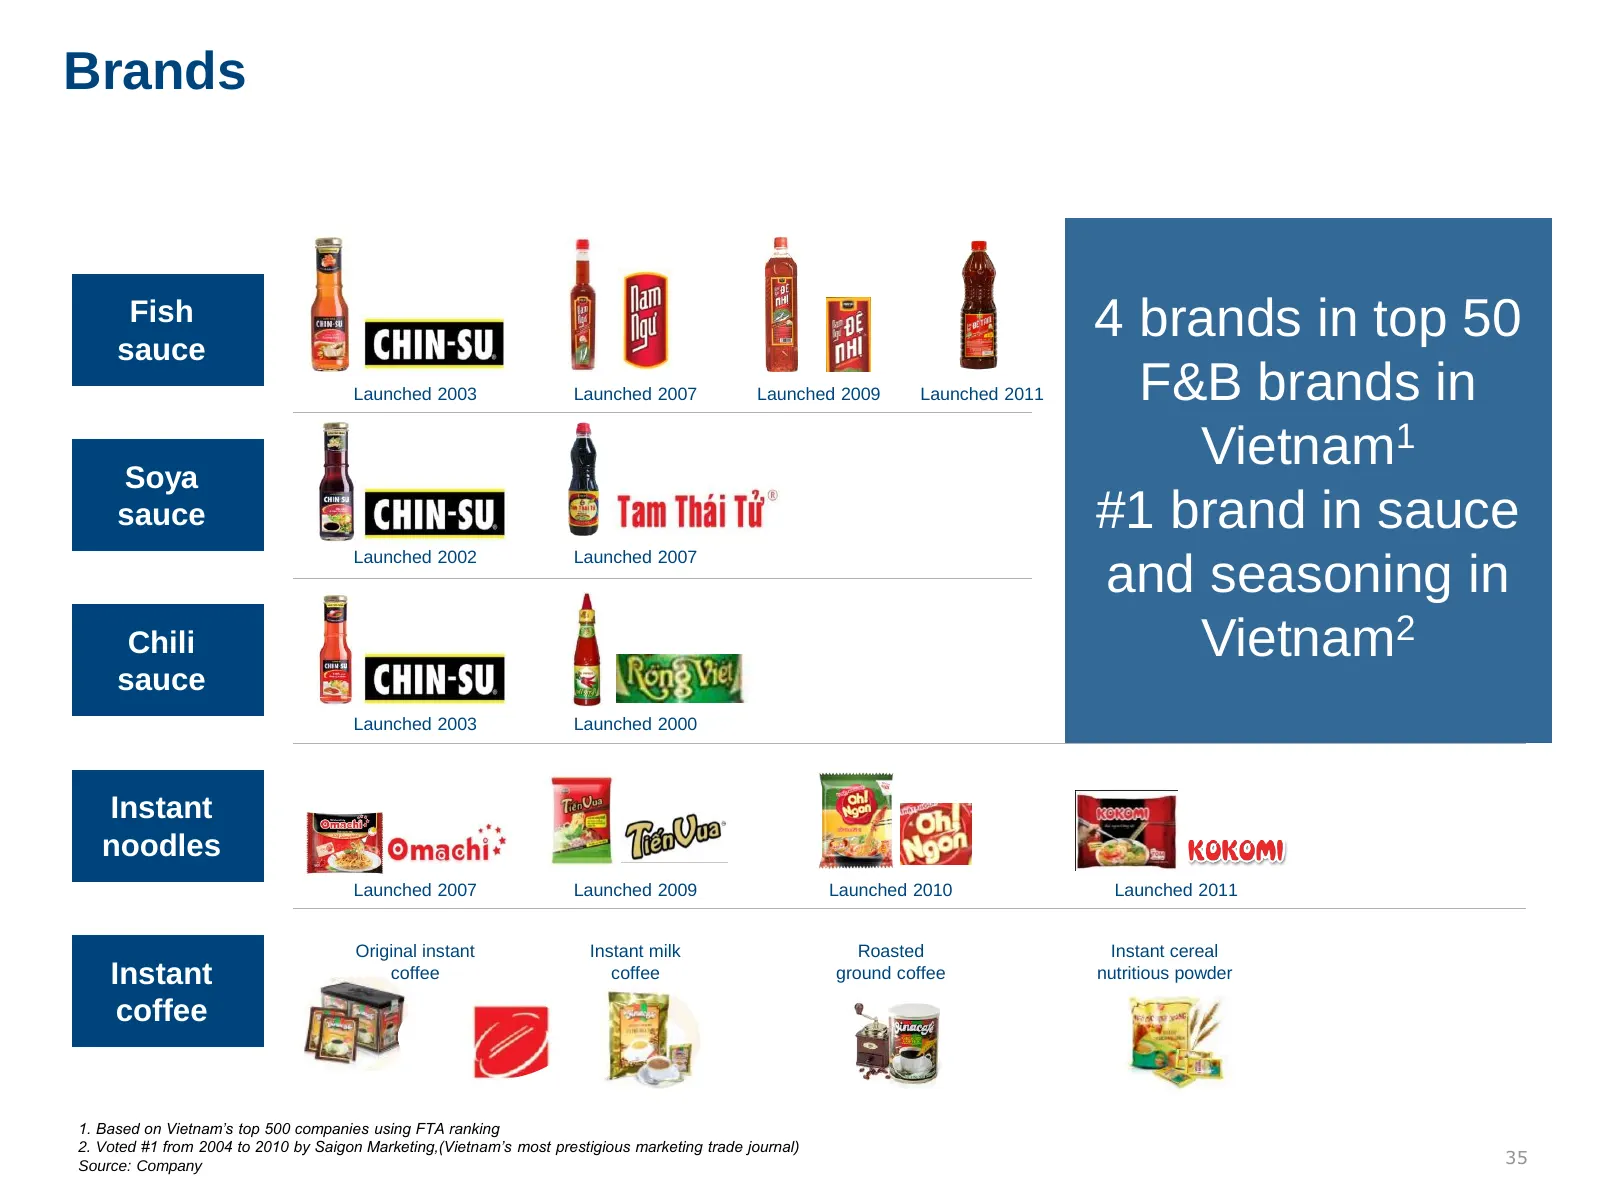
Brands Fish sauce 4 brands in top 50 Launched 2003 Launched 2007 Launched 2009 Launched 2011 F&B brands in Soya Vietnam1 sauce #1 brand in sauce Launched 2002 Launched 2007 and seasoning in Chili Vietnam2 sauce Launched 2003 Launched 2000 Instant noodles Launched 2007 Launched 2009 Launched 2010 Lau
Slide 36: Largest nationwide distribution
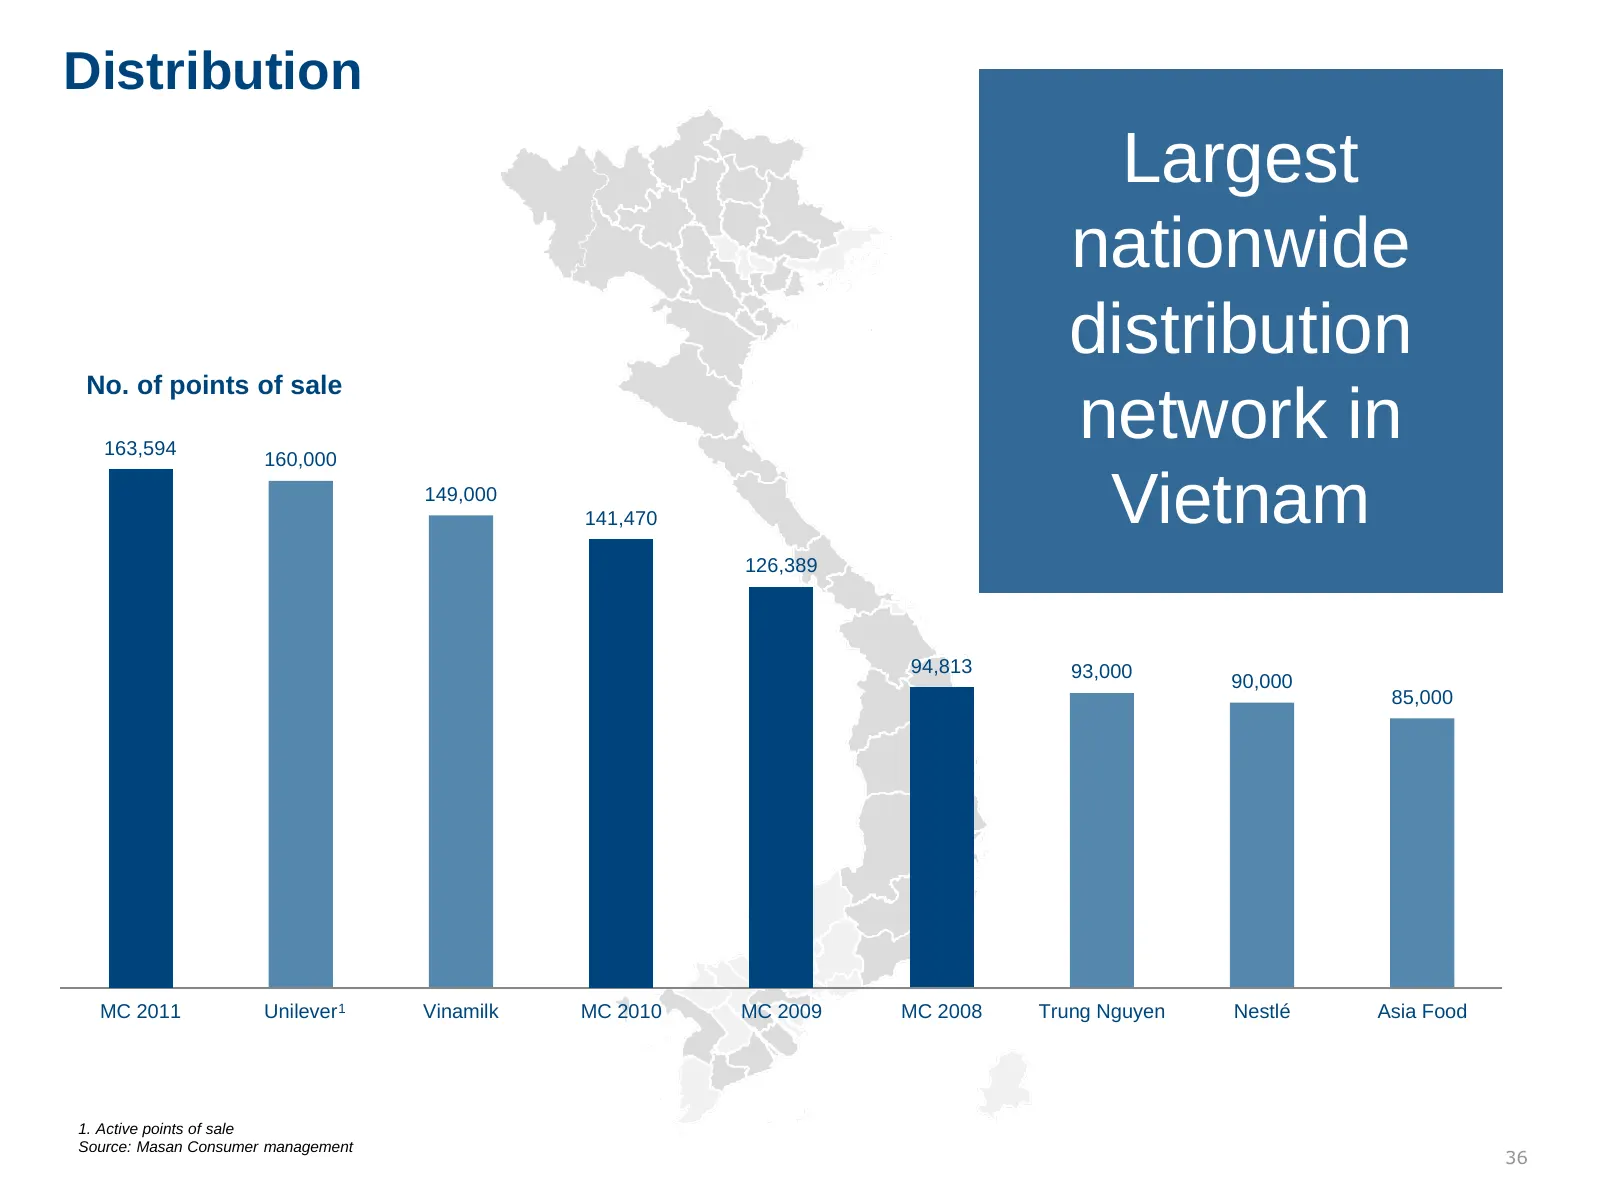
Distribution Largest nationwide distribution No. of points of sale 163,594 160,000 network in 149,000 141,470 Vietnam 126,389 94,813 93,000 90,000 85,000 MC 2011 Unilever 1 Vinamilk MC 2010 MC 2009 MC 2008 Trung Nguyen Nestlé Asia Food 1. Active points of sale Source: Masan Consumer management 36
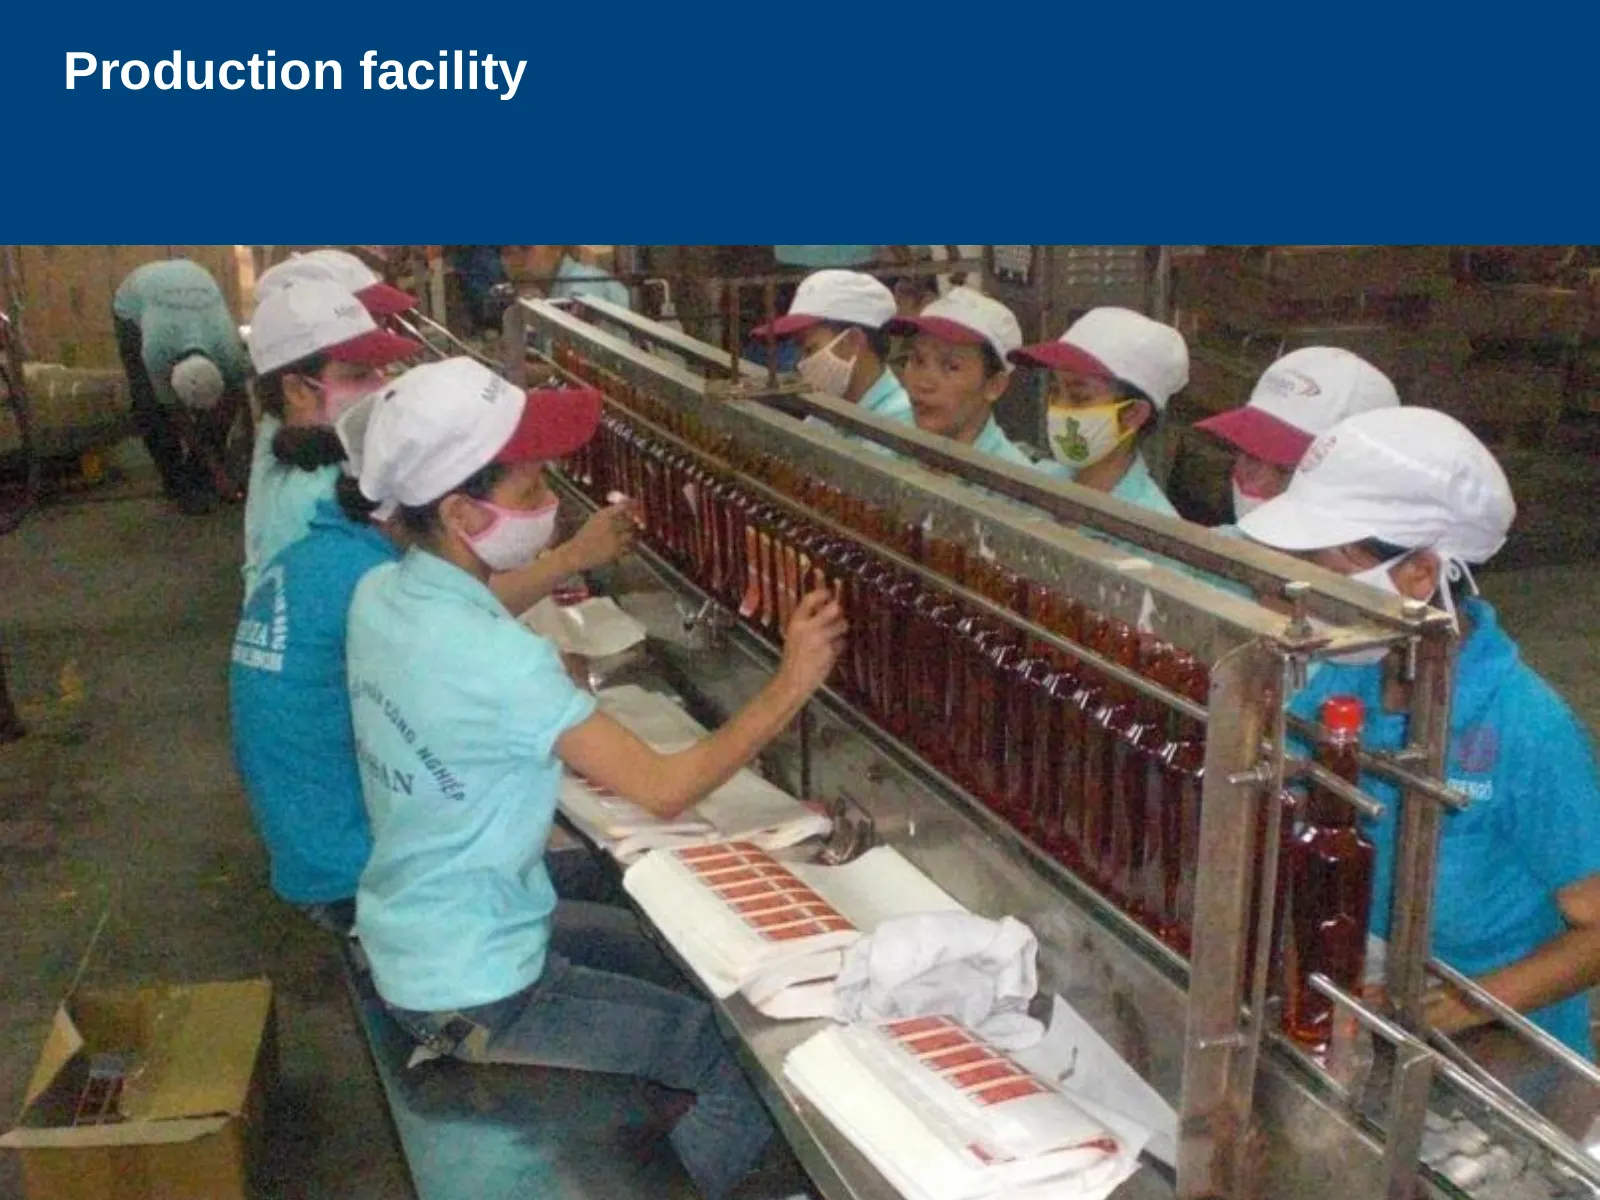
Slide 37: Production facility
Production facility 37
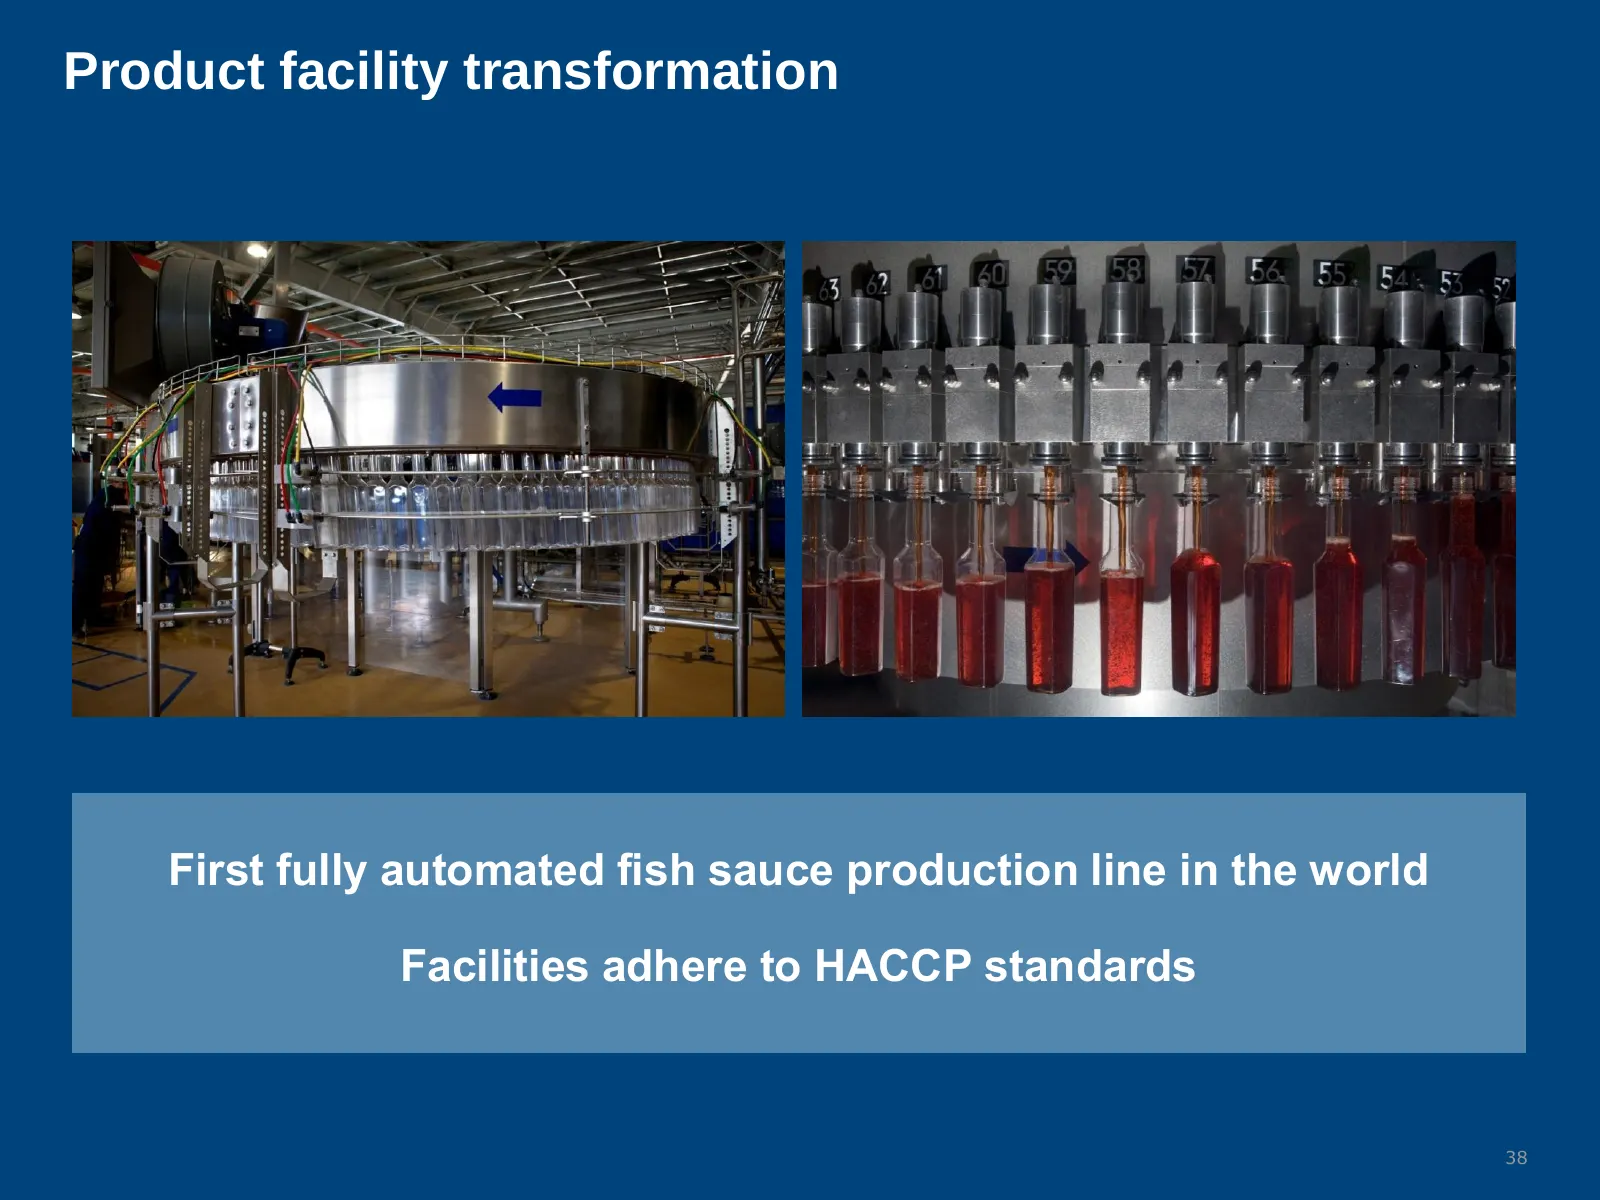
Slide 38: Product facility transformation
Product facility transformation First fully automated fish sauce production line in the world Facilities adhere to HACCP standards 38
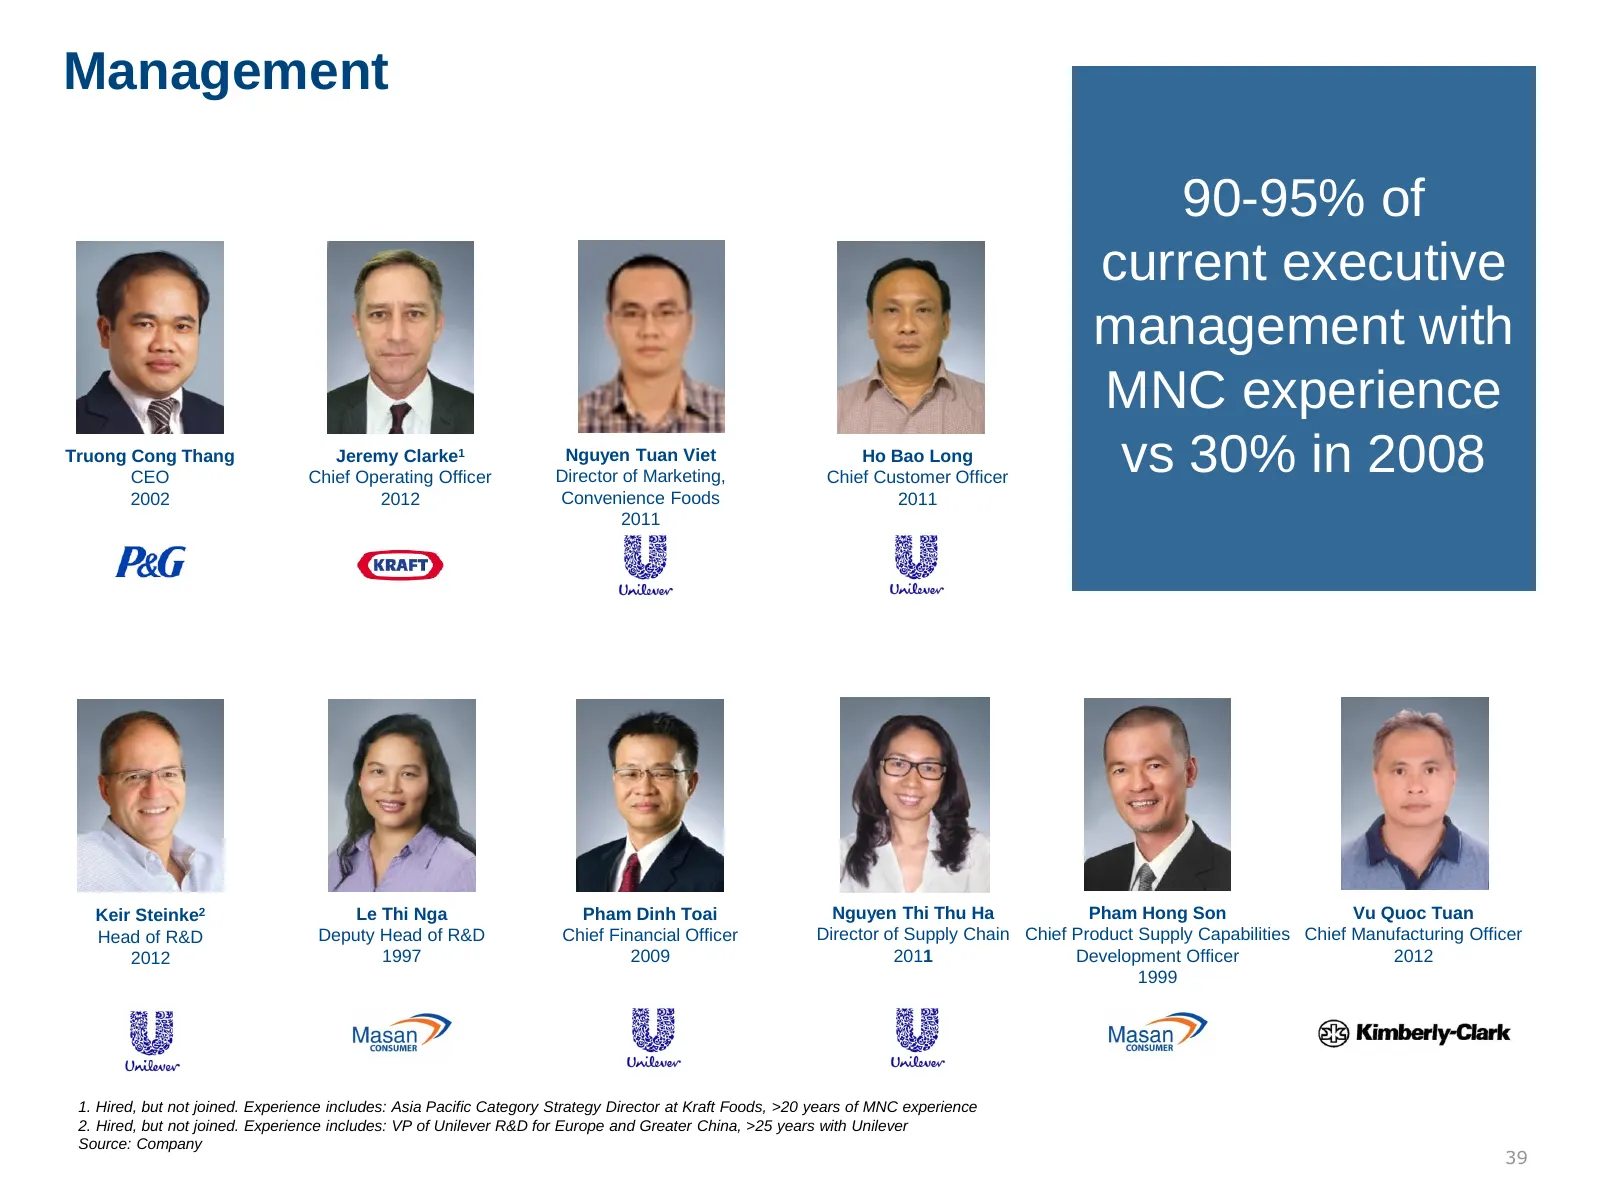
Slide 39: Management
Management 90-95% of current executive management with MNC experience Truong Cong Thang CEO Jeremy Clarke1 Chief Operating Officer Nguyen Tuan Viet Director of Marketing, Ho Bao Long Chief Customer Officer vs 30% in 2008 2002 2012 Convenience Foods 2011 2011 Keir Steinke2 Le Thi Nga Pham Dinh Toai N
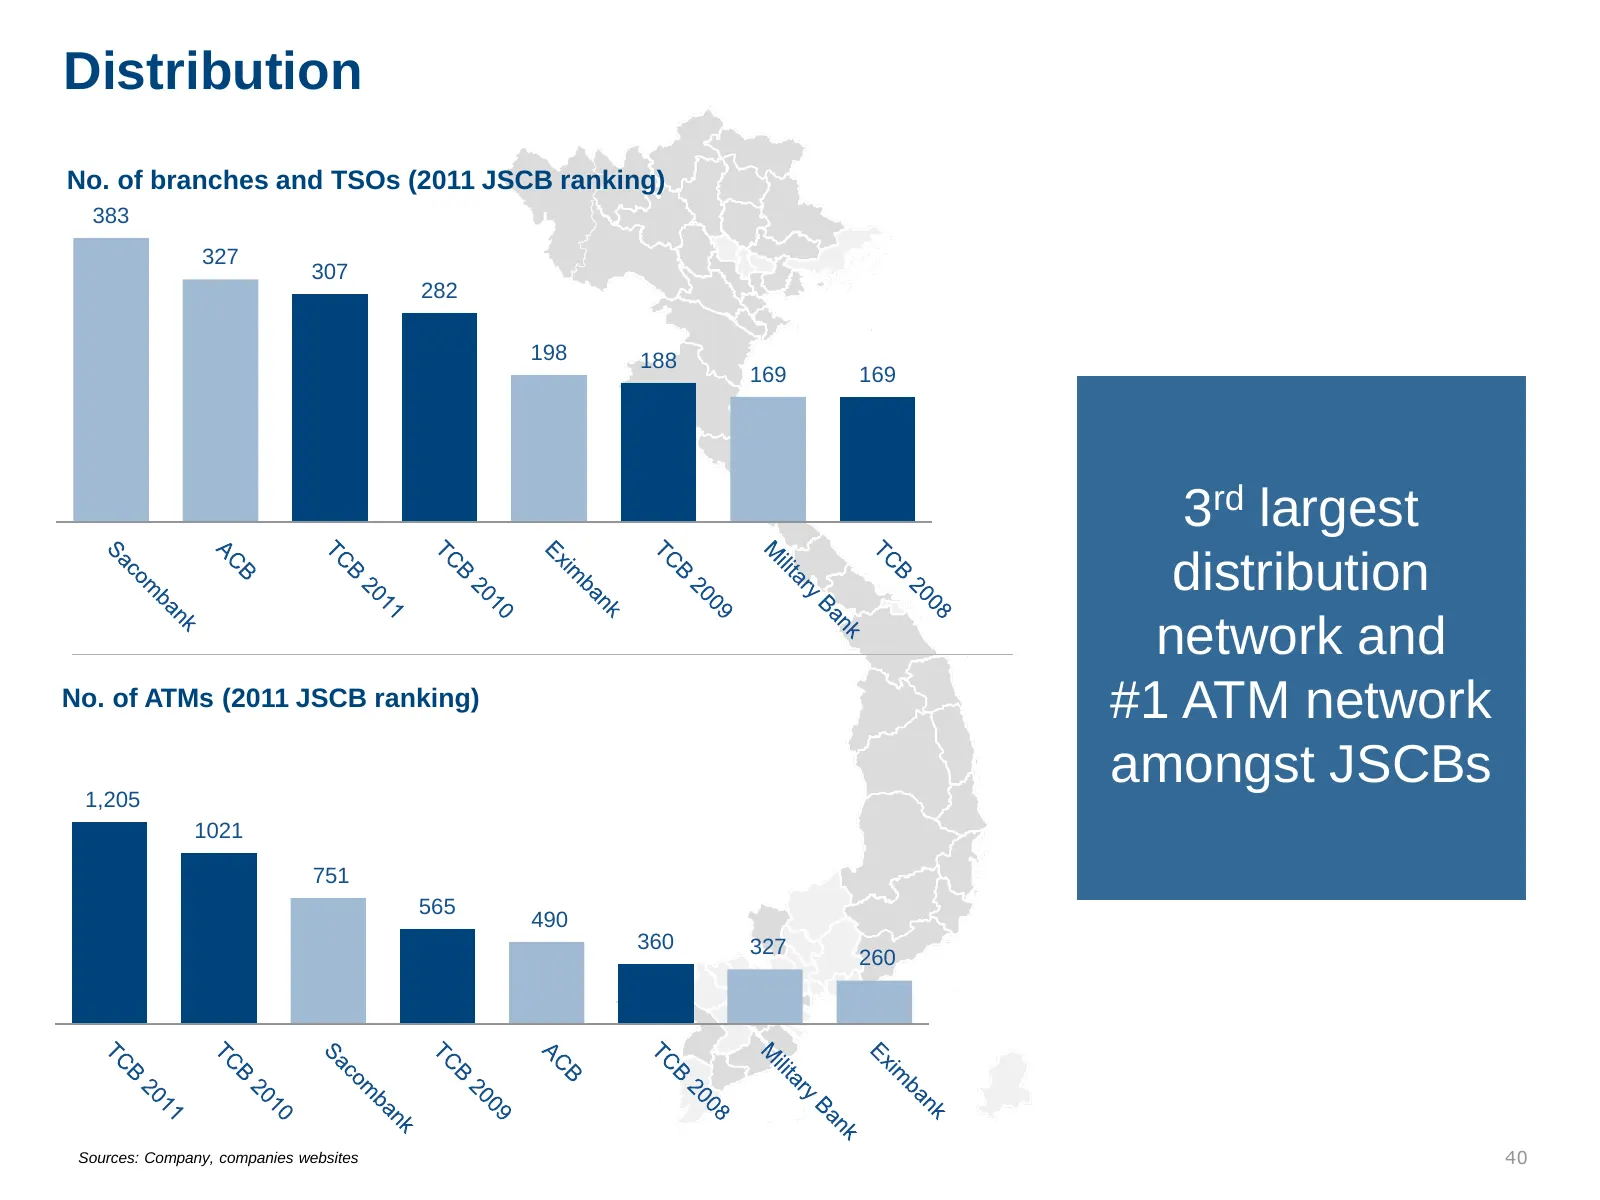
Slide 40: Distribution
Distribution No. of branches and TSOs (2011 JSCB ranking) 383 327 307 282 198 188 169 169 3rd largest distribution network and No. of ATMs (2011 JSCB ranking) #1 ATM network 1,205 amongst JSCBs 1021 751 565 490 360 327 260 Sources: Company, companies websites 40
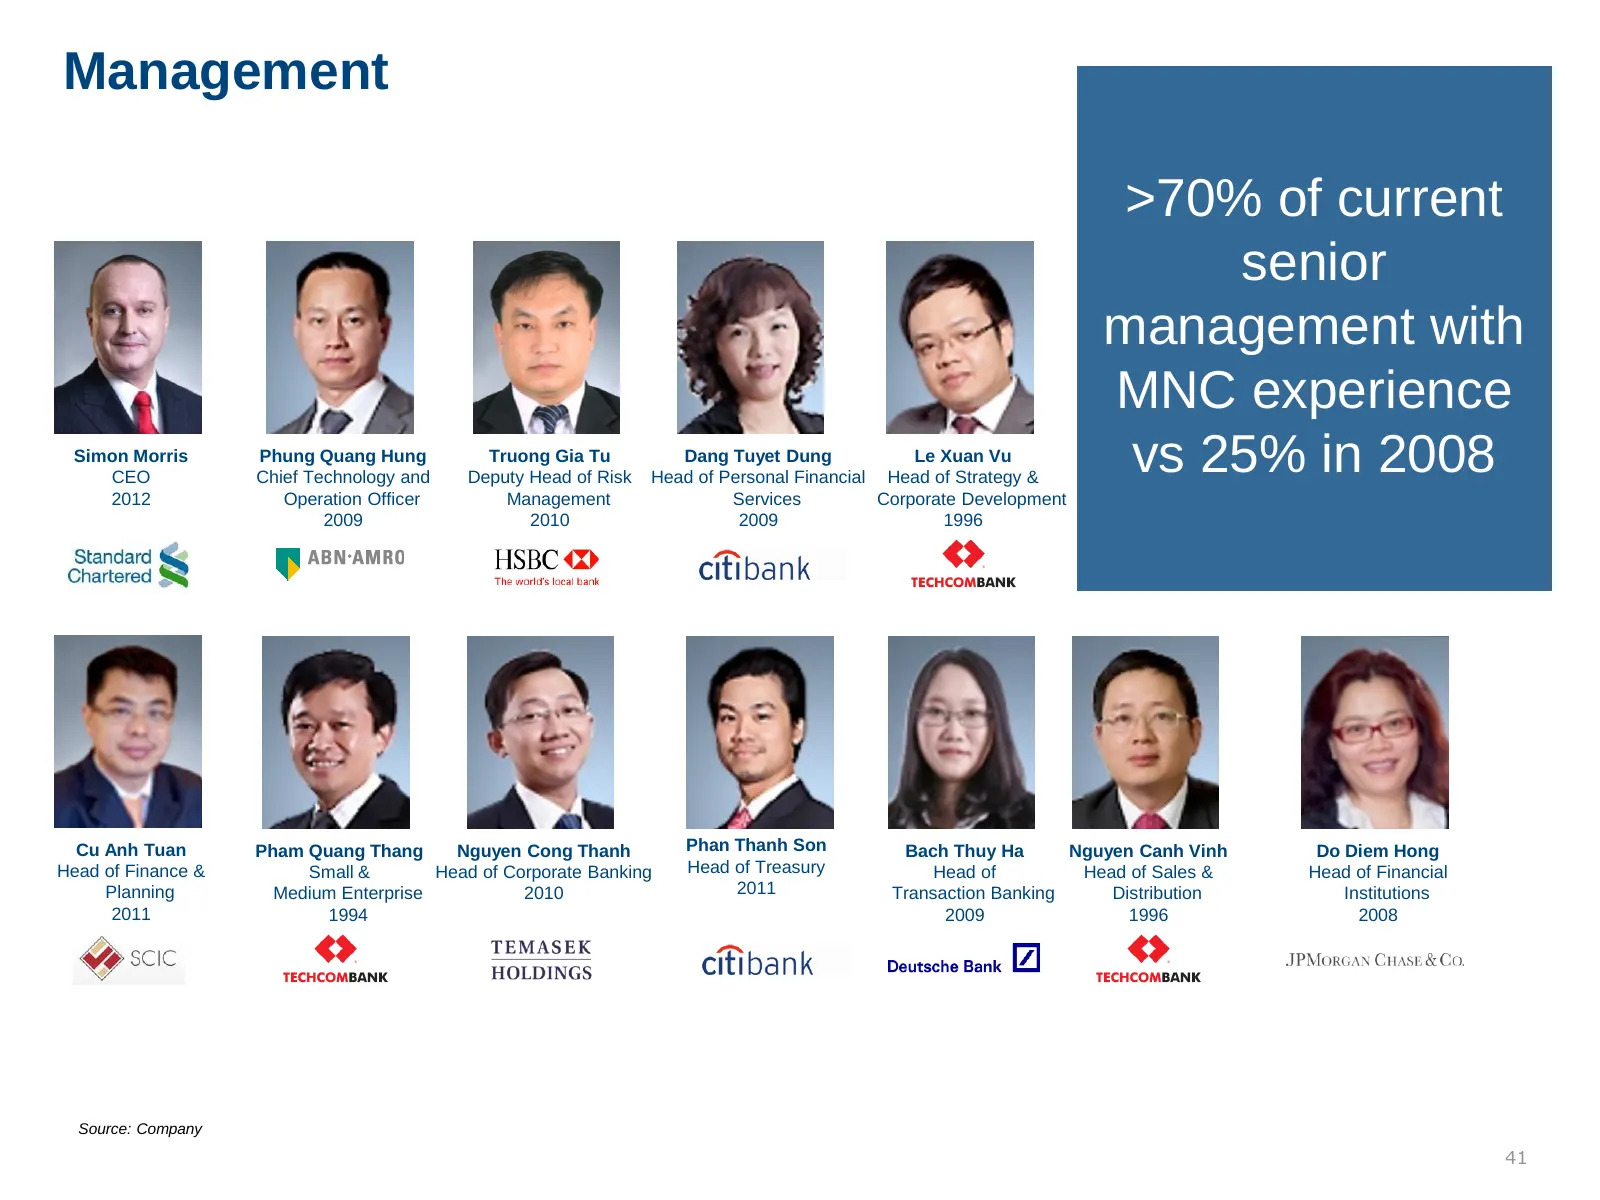
Slide 41: Management
Management >70% of current senior management with MNC experience Simon Morris CEO Phung Quang Hung Chief Technology and Truong Gia Tu Deputy Head of Risk Dang Tuyet Dung Le Xuan Vu Head of Personal Financial Head of Strategy & vs 25% in 2008 2012 Operation Officer Management Services Corporate Devel
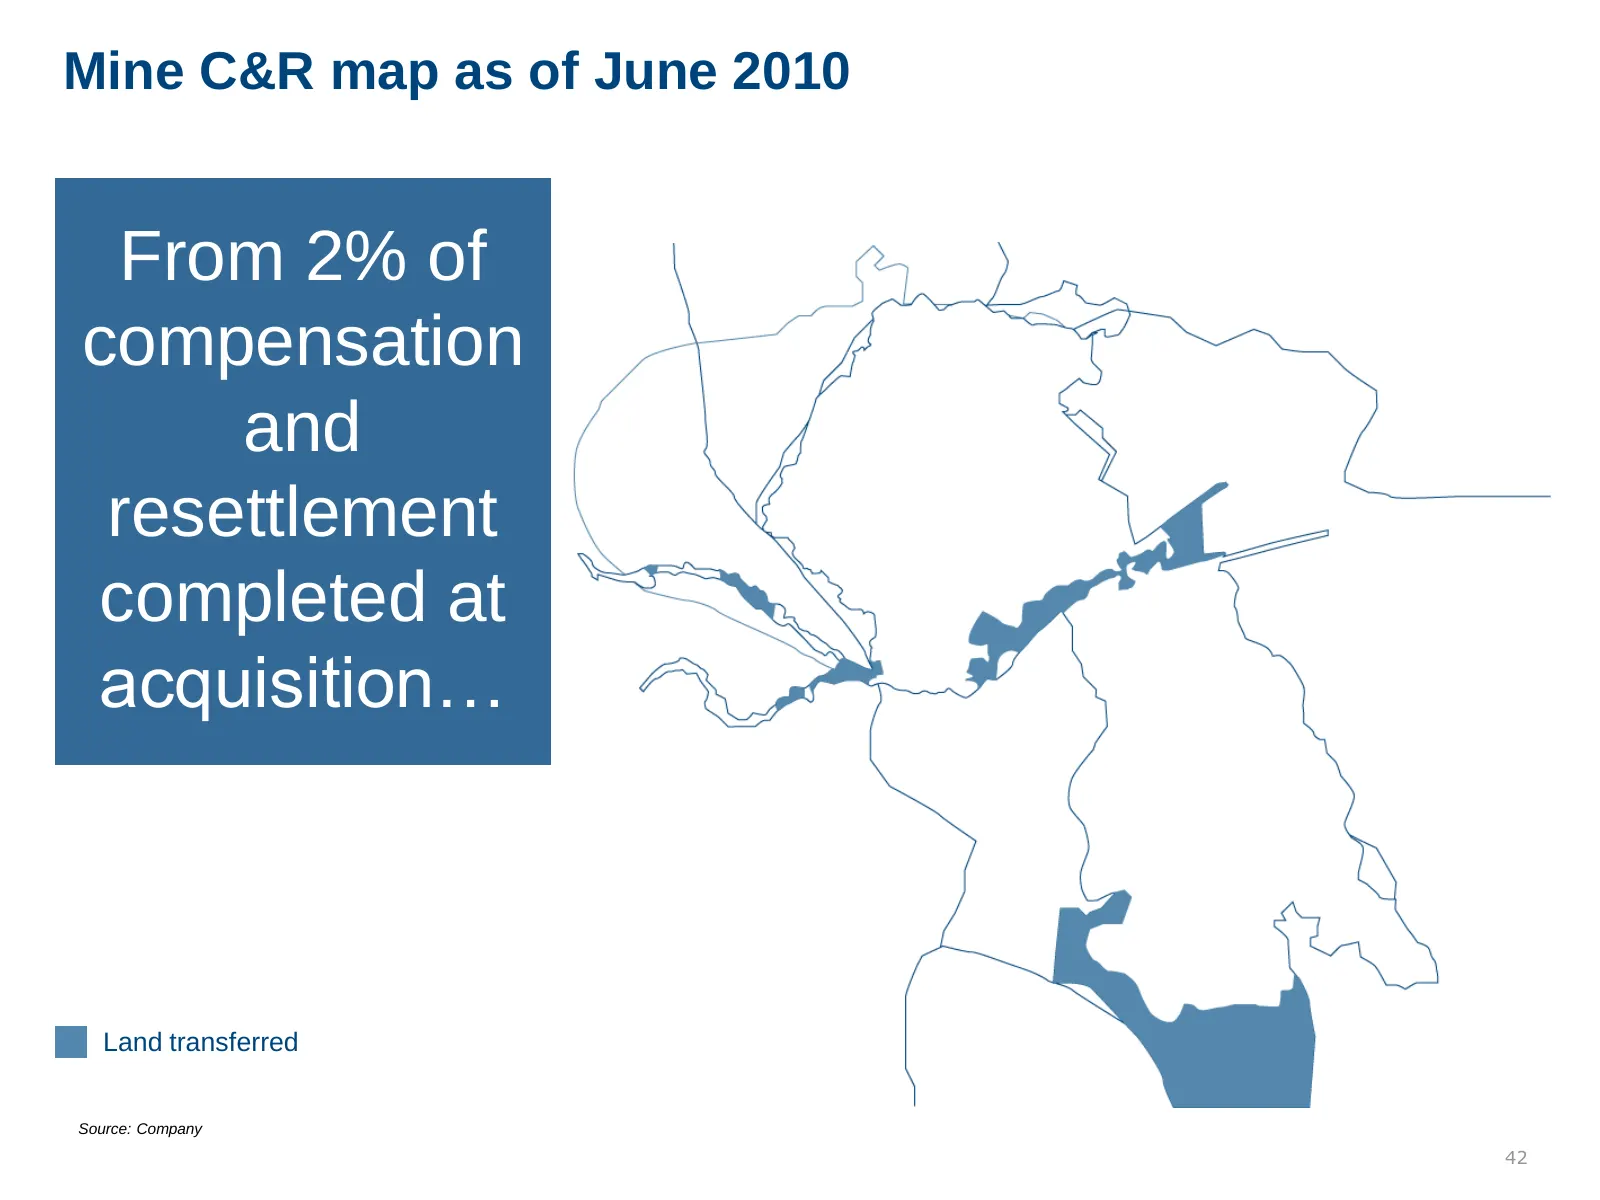
Slide 42: Mine C&R map as of June 2010
Mine C&R map as of June 2010 From 2% of compensation and resettlement completed at acquisition… Land transferred Source: Company 42
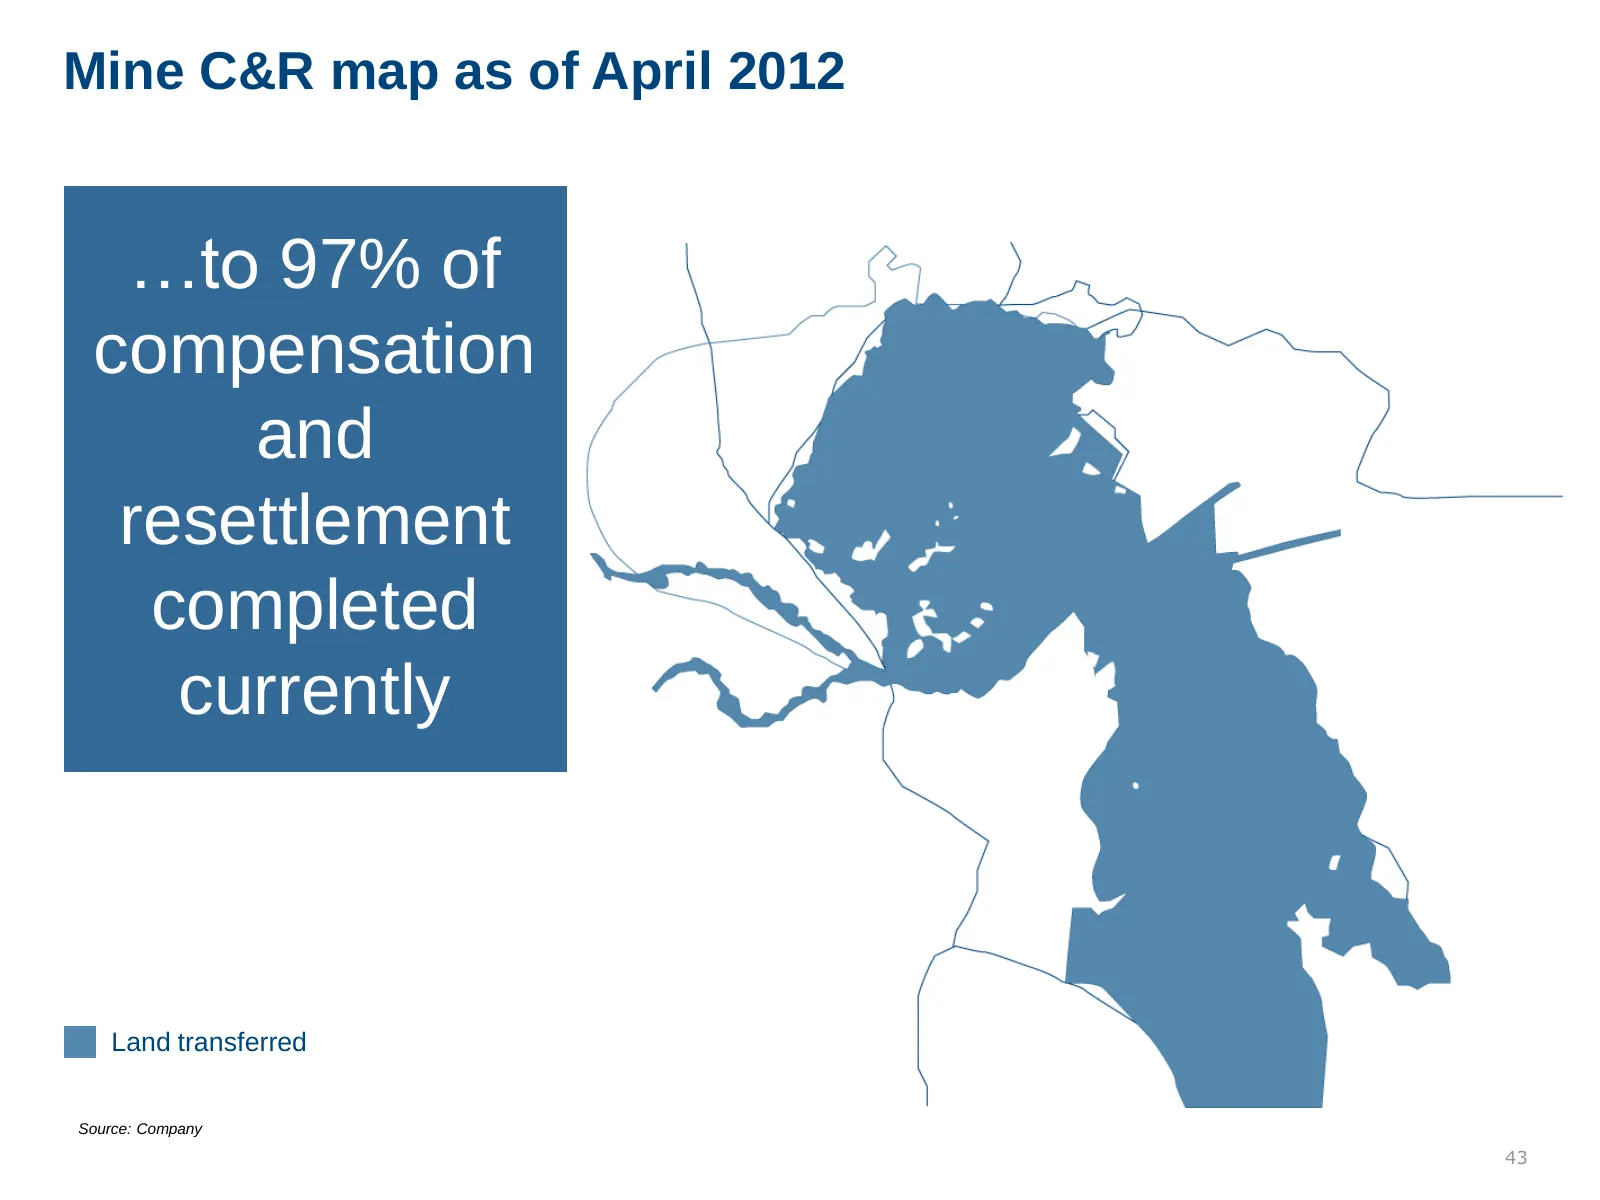
Slide 43: 97% of compensation and resettlement completed
Mine C&R map as of April 2012 …to 97% of compensation and resettlement completed currently Land transferred Source: Company 43
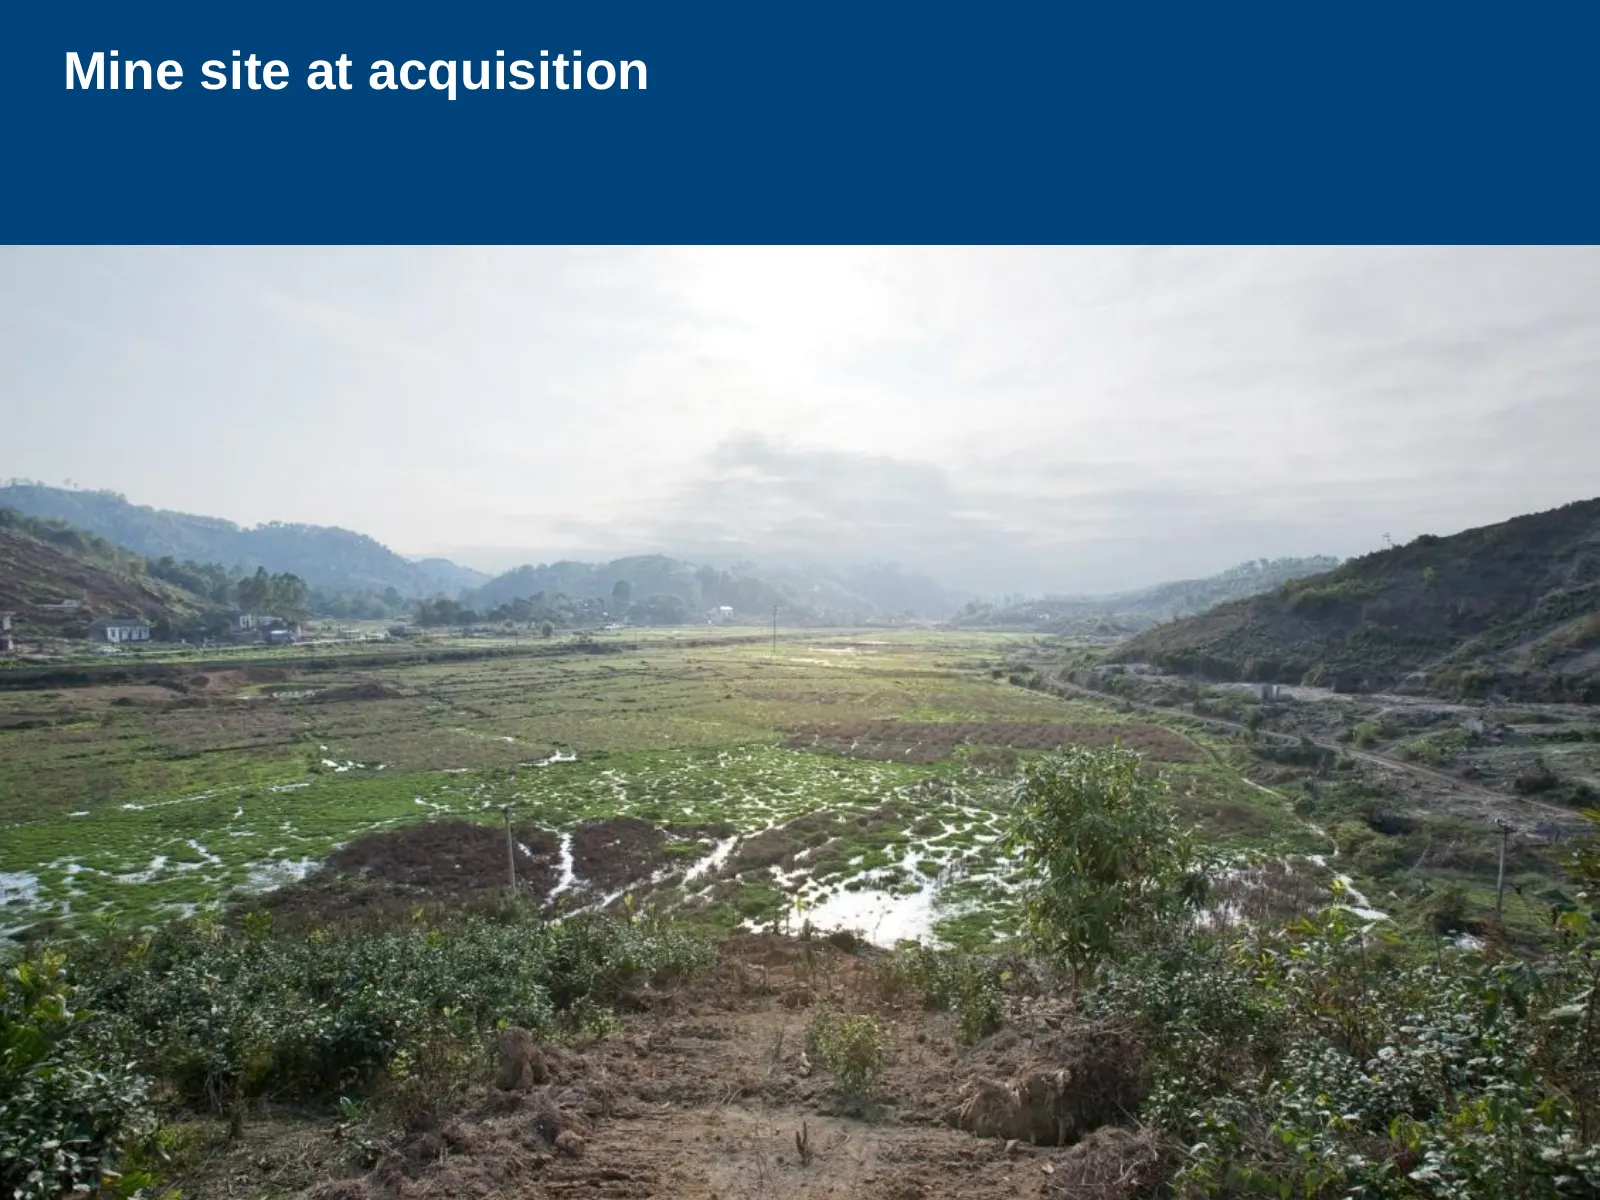
Slide 44: Mine site at acquisition
Mine site at acquisition 44
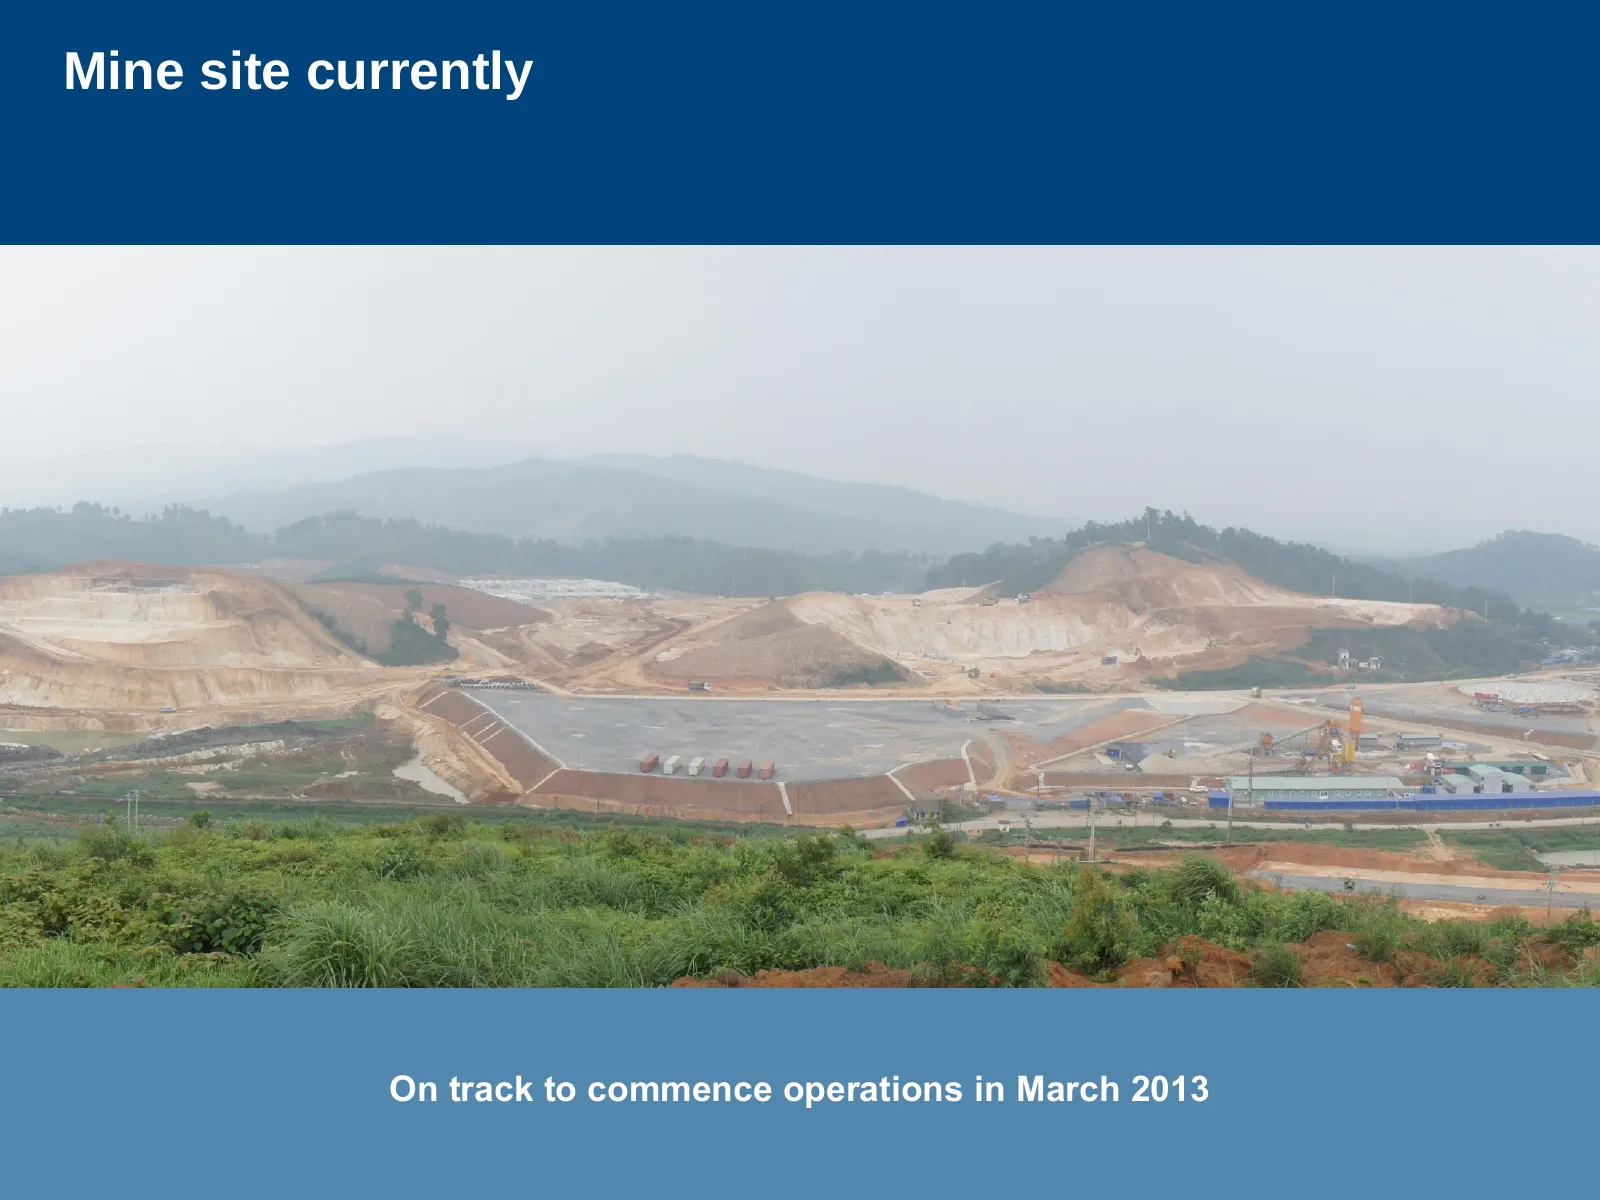
Slide 45: Mine site currently
Mine site currently On track to commence operations in March 2013 45
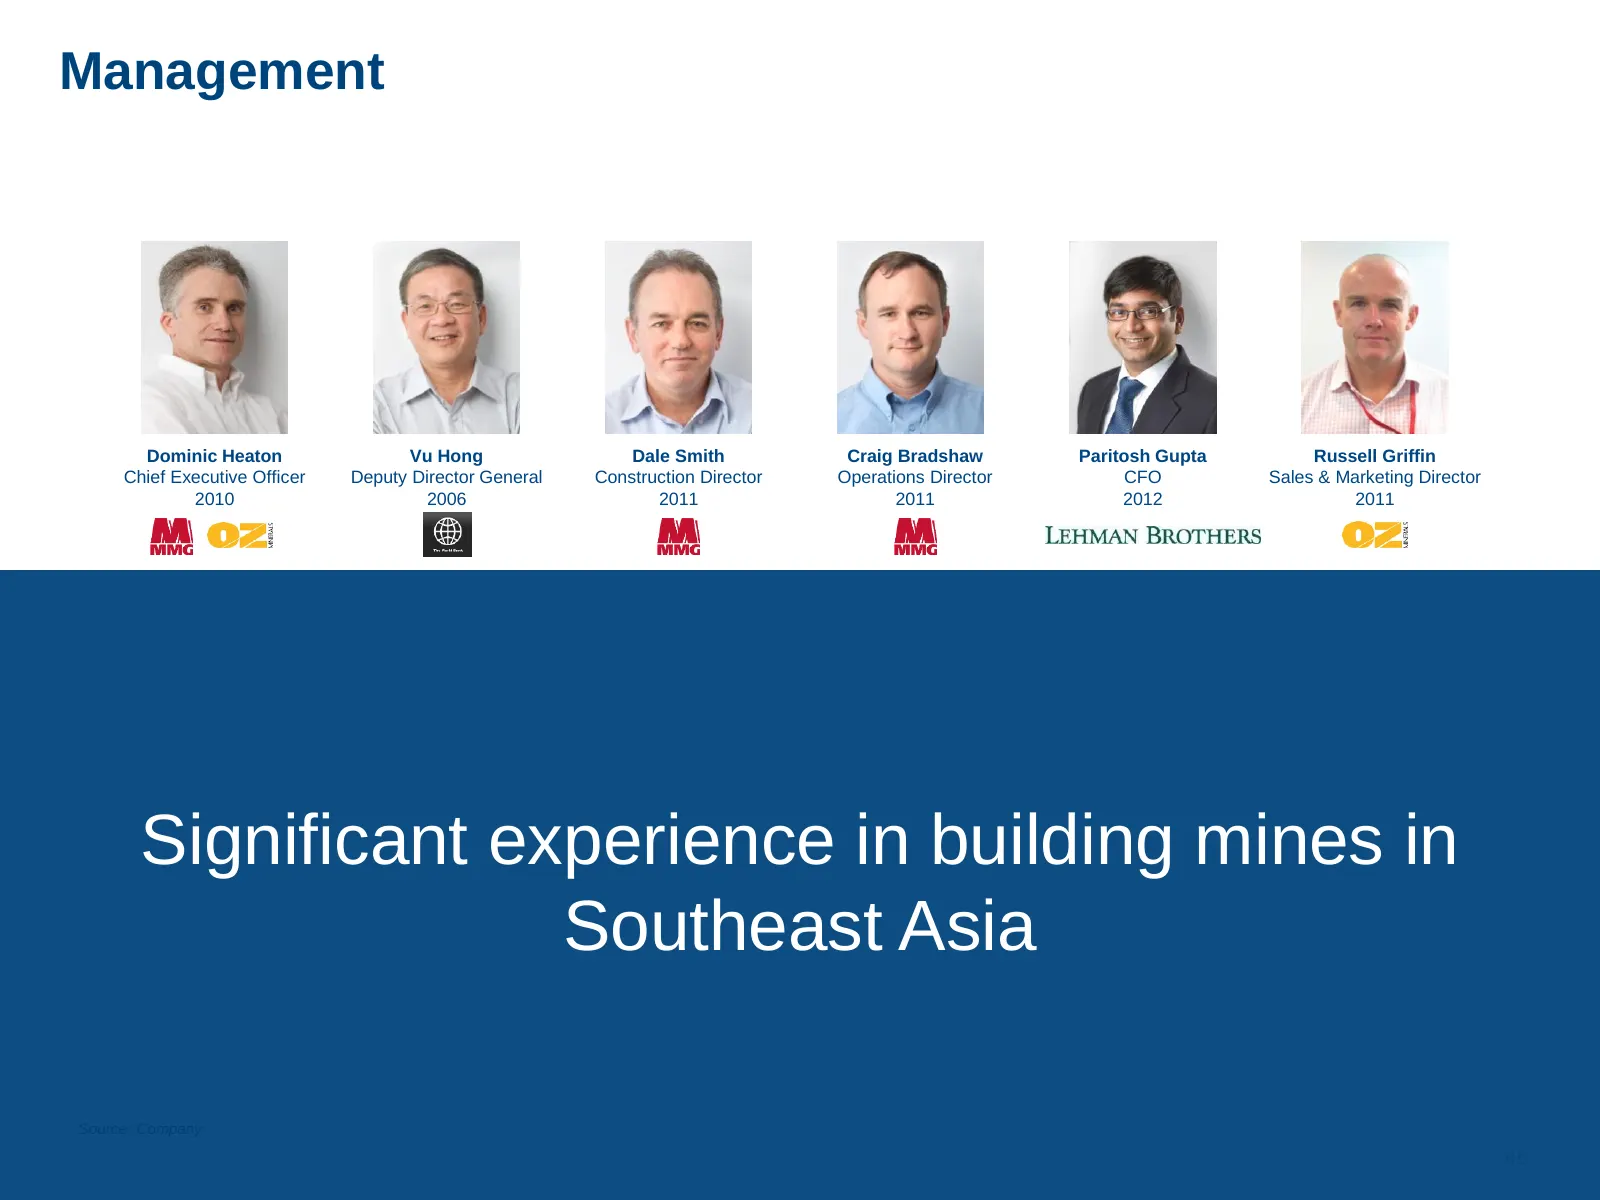
Slide 46: Significant experience in building mines in Southeast Asia
Management Dominic Heaton Vu Hong Dale Smith Craig Bradshaw Paritosh Gupta Russell Griffin Chief Executive Officer Deputy Director General Construction Director Operations Director CFO Sales & Marketing Director 2010 2006 2011 2011 2012 2011 Significant experience in building mines in Southeast Asia
Slide 47: Creating value for shareholders
Creating value for shareholders 47

Slide 48: Steve Jobs quote
“I want to put a ding in the universe” Steve Jobs Co-founder of Apple 48
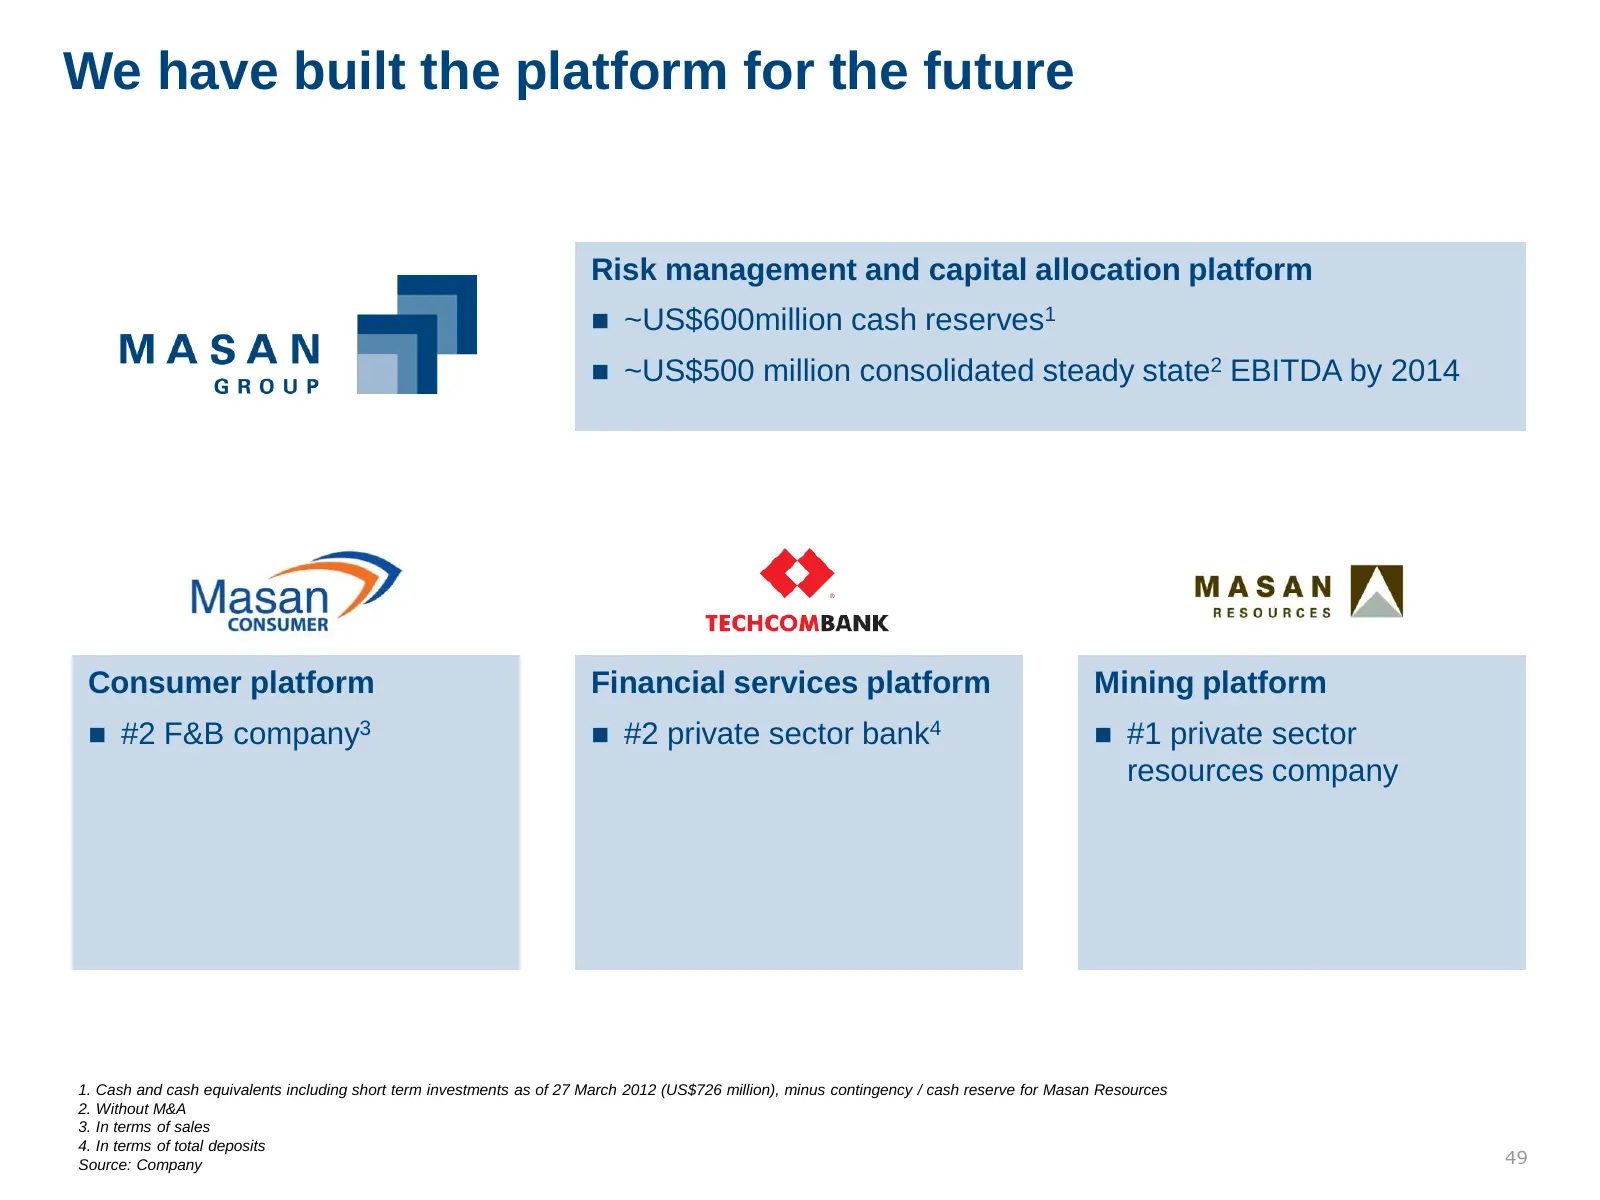
Slide 49: We have built the platform for the future
We have built the platform for the future Risk management and capital allocation platform ~US$600million cash reserves1 ~US$500 million consolidated steady state2 EBITDA by 2014 Consumer platform Financial services platform Mining platform #2 F&B company3 #2 private sector bank4 #1 private
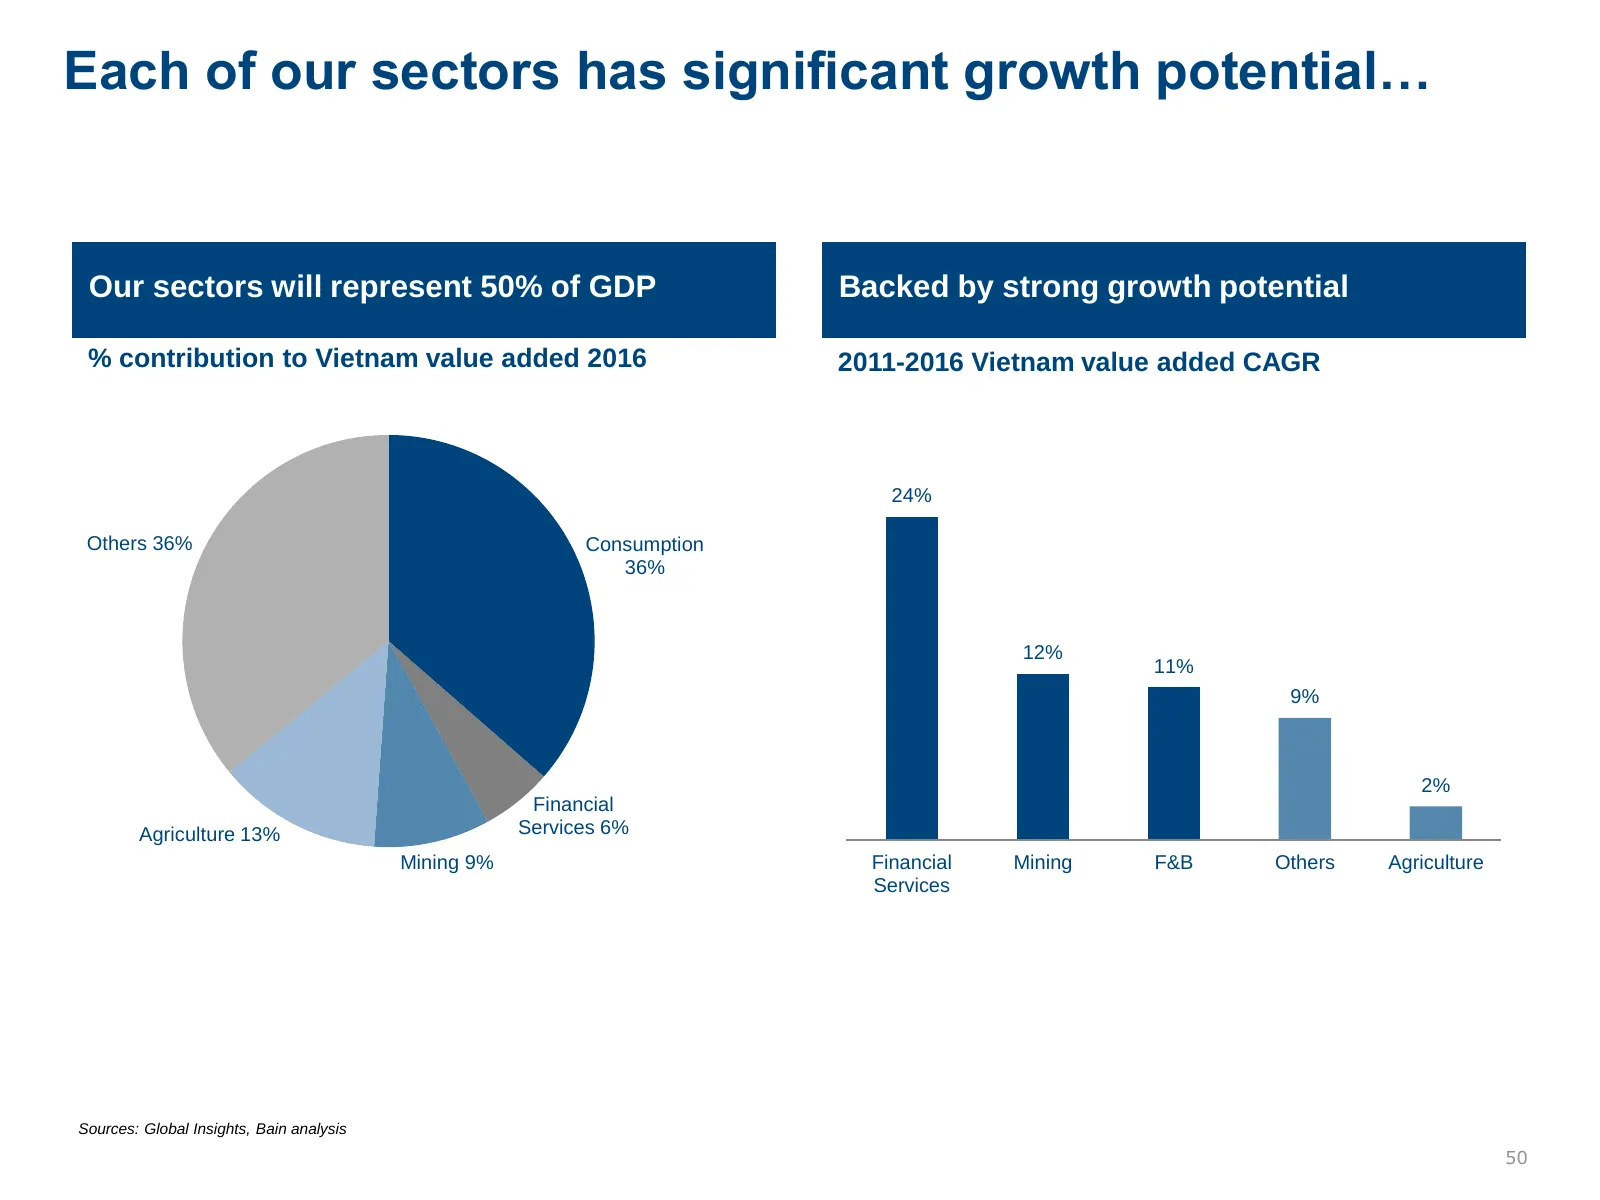
Slide 50: Each of our sectors has significant growth potential
Each of our sectors has significant growth potential… Our sectors will represent 50% of GDP Backed by strong growth potential % contribution to Vietnam value added 2016 2011-2016 Vietnam value added CAGR 24% Others 36% Consumption 36% 12% 11% 9% 2% Financial Agriculture 13% Services 6% Mining 9% Fin
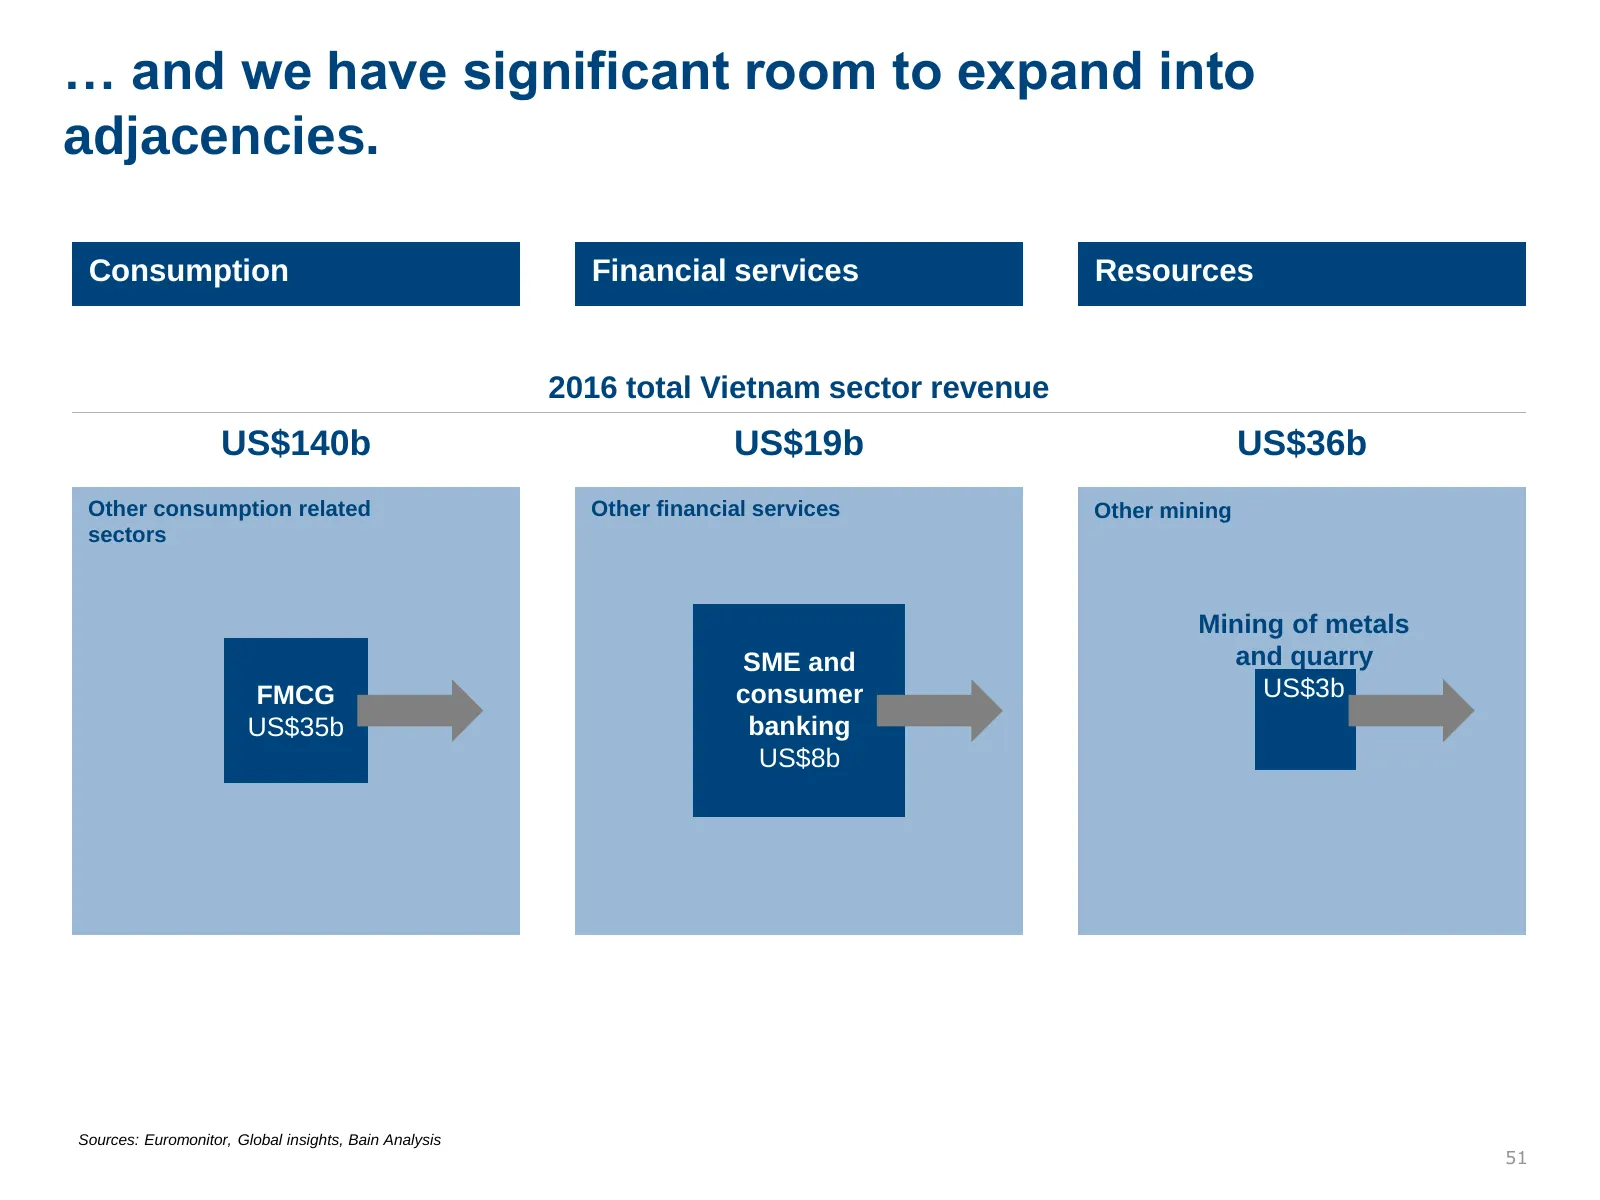
Slide 51: Significant room to expand into adjacencies
… and we have significant room to expand into adjacencies. Consumption Financial services Resources 2016 total Vietnam sector revenue US$140b US$19b US$36b Other consumption related Other financial services Other mining sectors Mining of metals SME and and quarry FMCG consumer US$3b US$35b banking U
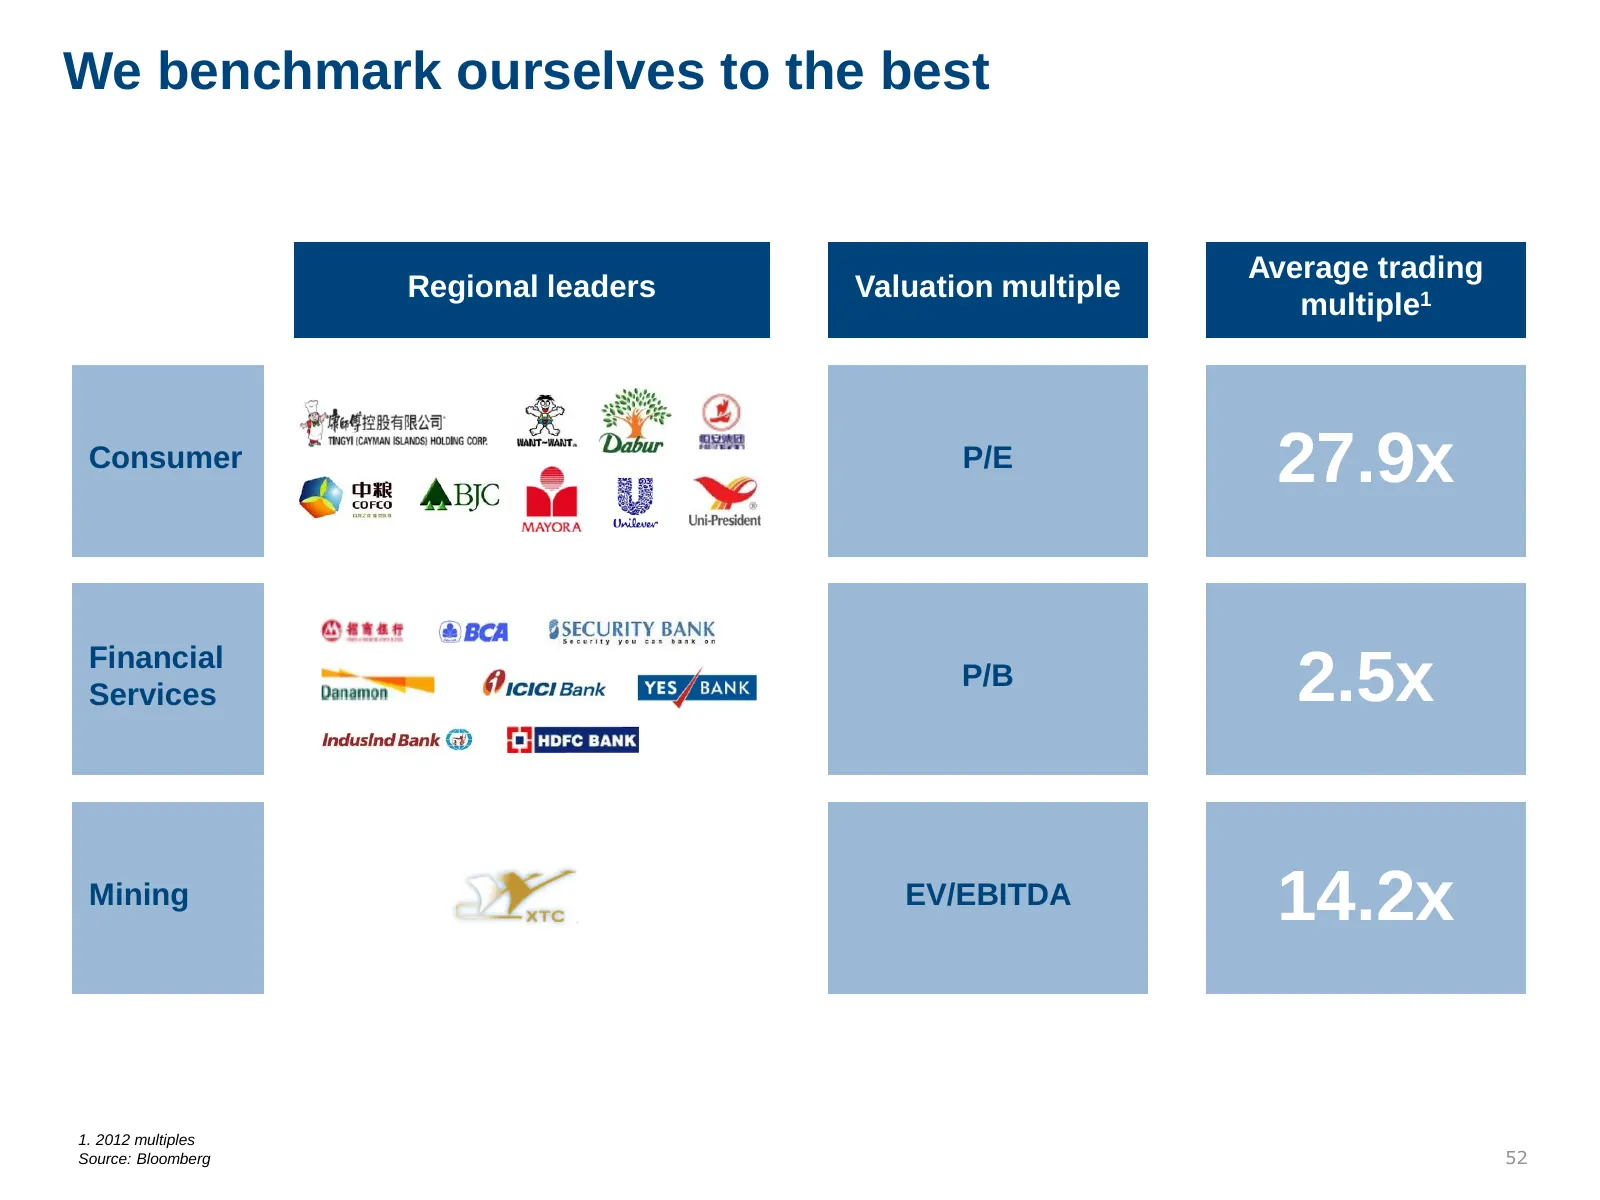
Slide 52: We benchmark ourselves to the best
We benchmark ourselves to the best Average trading Regional leaders Valuation multiple multiple1 Consumer P/E 27.9x Financial Services P/B 2.5x Mining EV/EBITDA 14.2x 1. 2012 multiples Source: Bloomberg 52
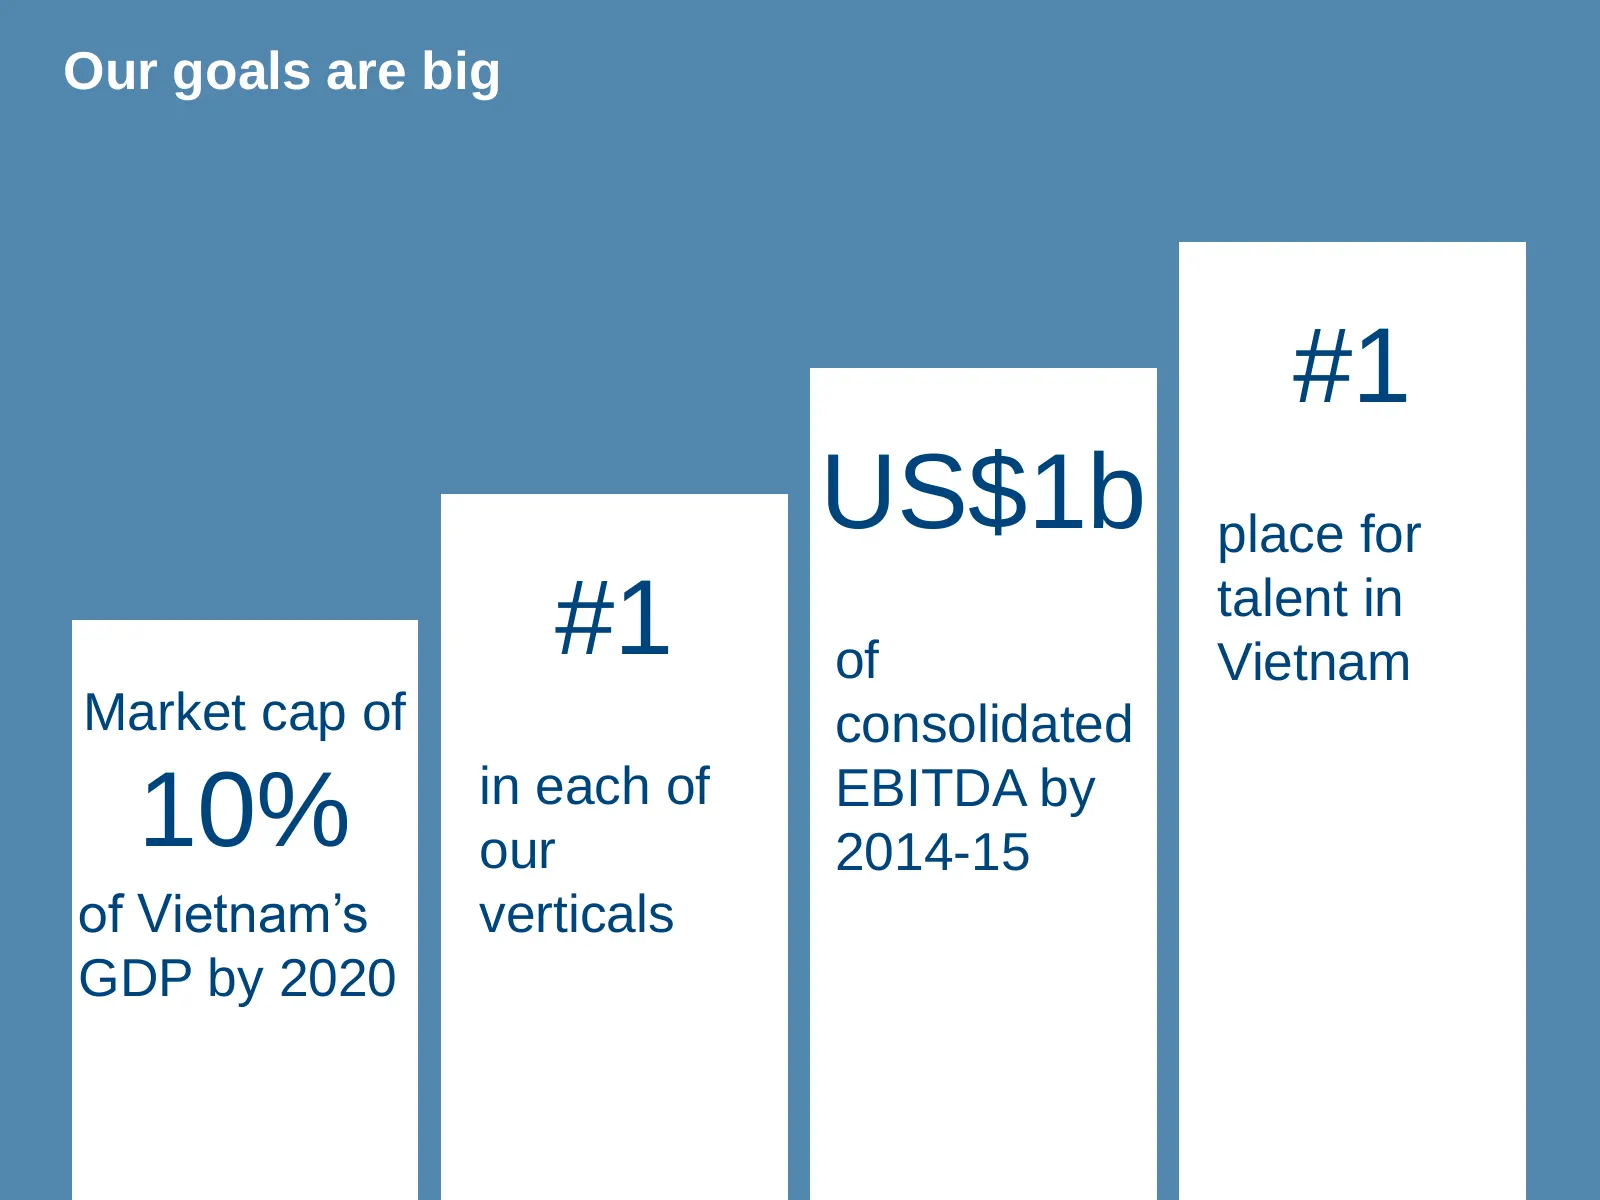
Slide 53: Our goals are big
Our goals are big #1 US$1b place for #1 of talent in Vietnam Market cap of consolidated in each of EBITDA by 10% our 2014-15 of Vietnam’s verticals GDP by 2020 53

Slide 54: Best person for each job
Best person for each job 54

Slide 55: Inception quote
“Because, in my dreams we are together.” Dom Cobb Corporate spy, fictional character in the movie ‘Inception’ (2010) 55
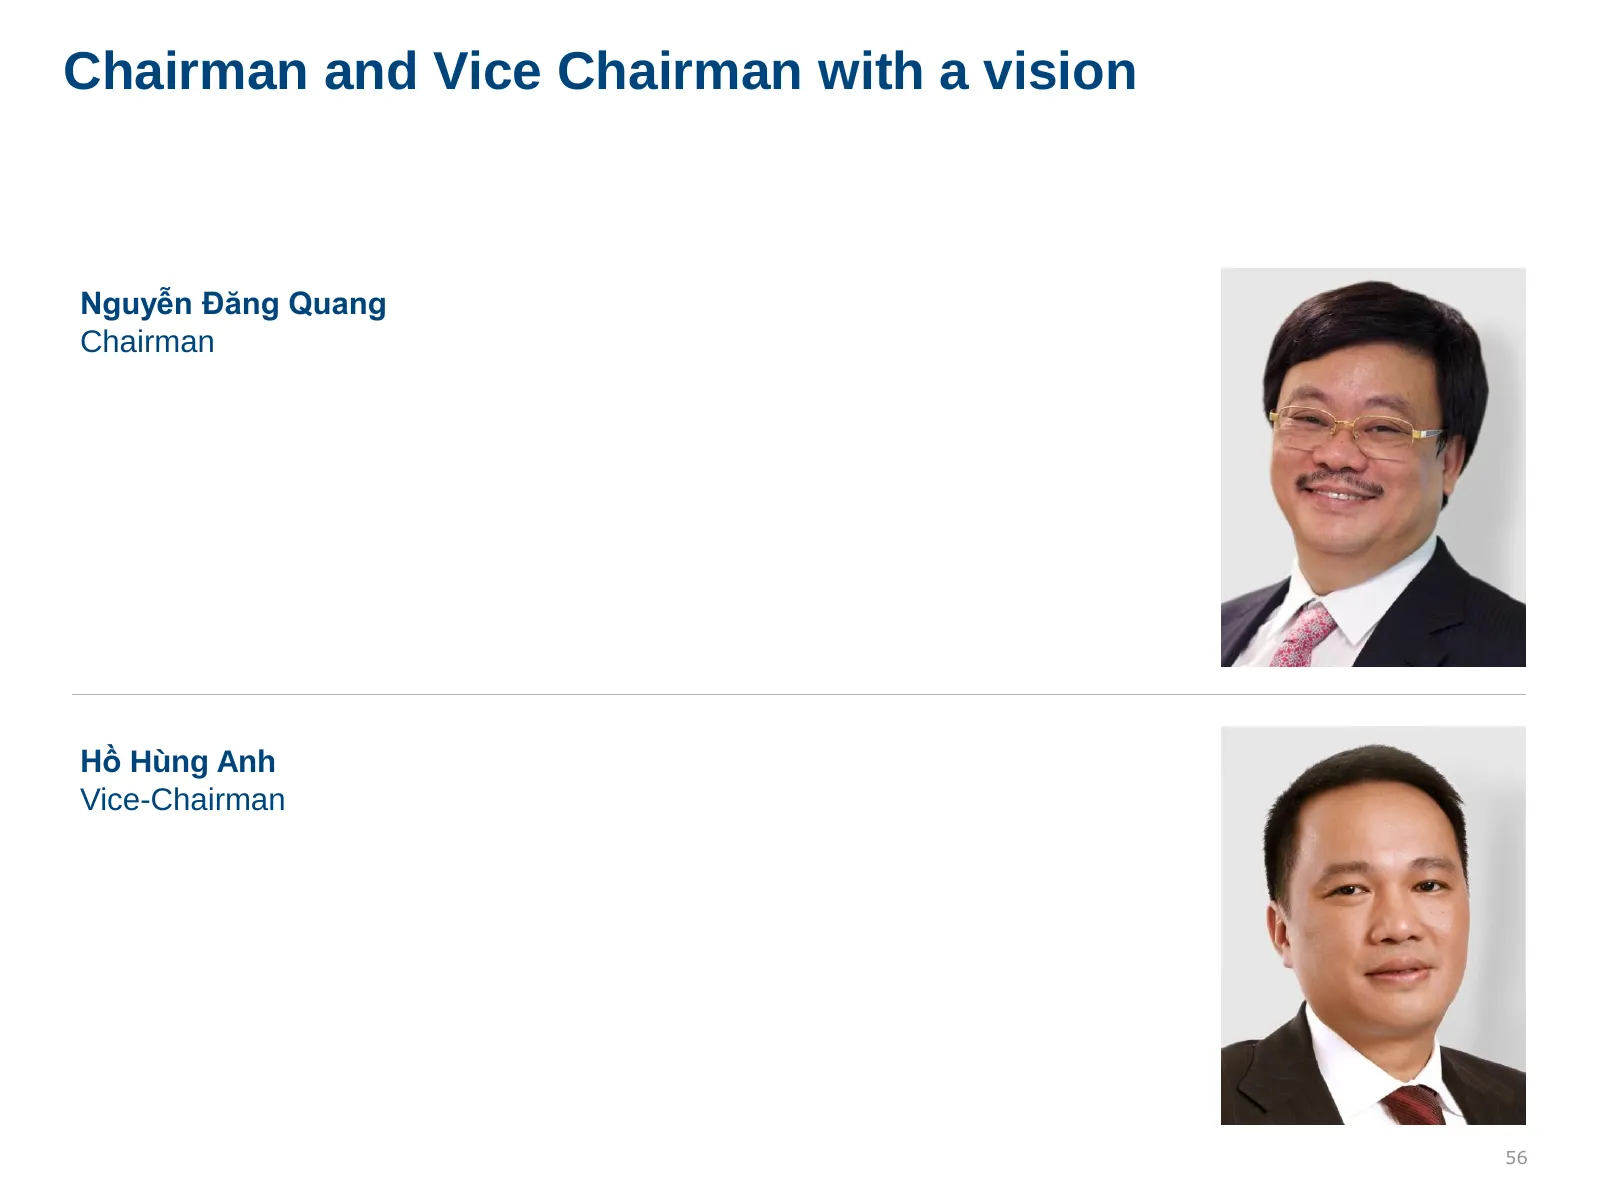
Slide 56: Chairman and Vice Chairman with a vision
Chairman and Vice Chairman with a vision Nguyễn Đăng Quang Chairman Hồ Hùng Anh Vice-Chairman 56
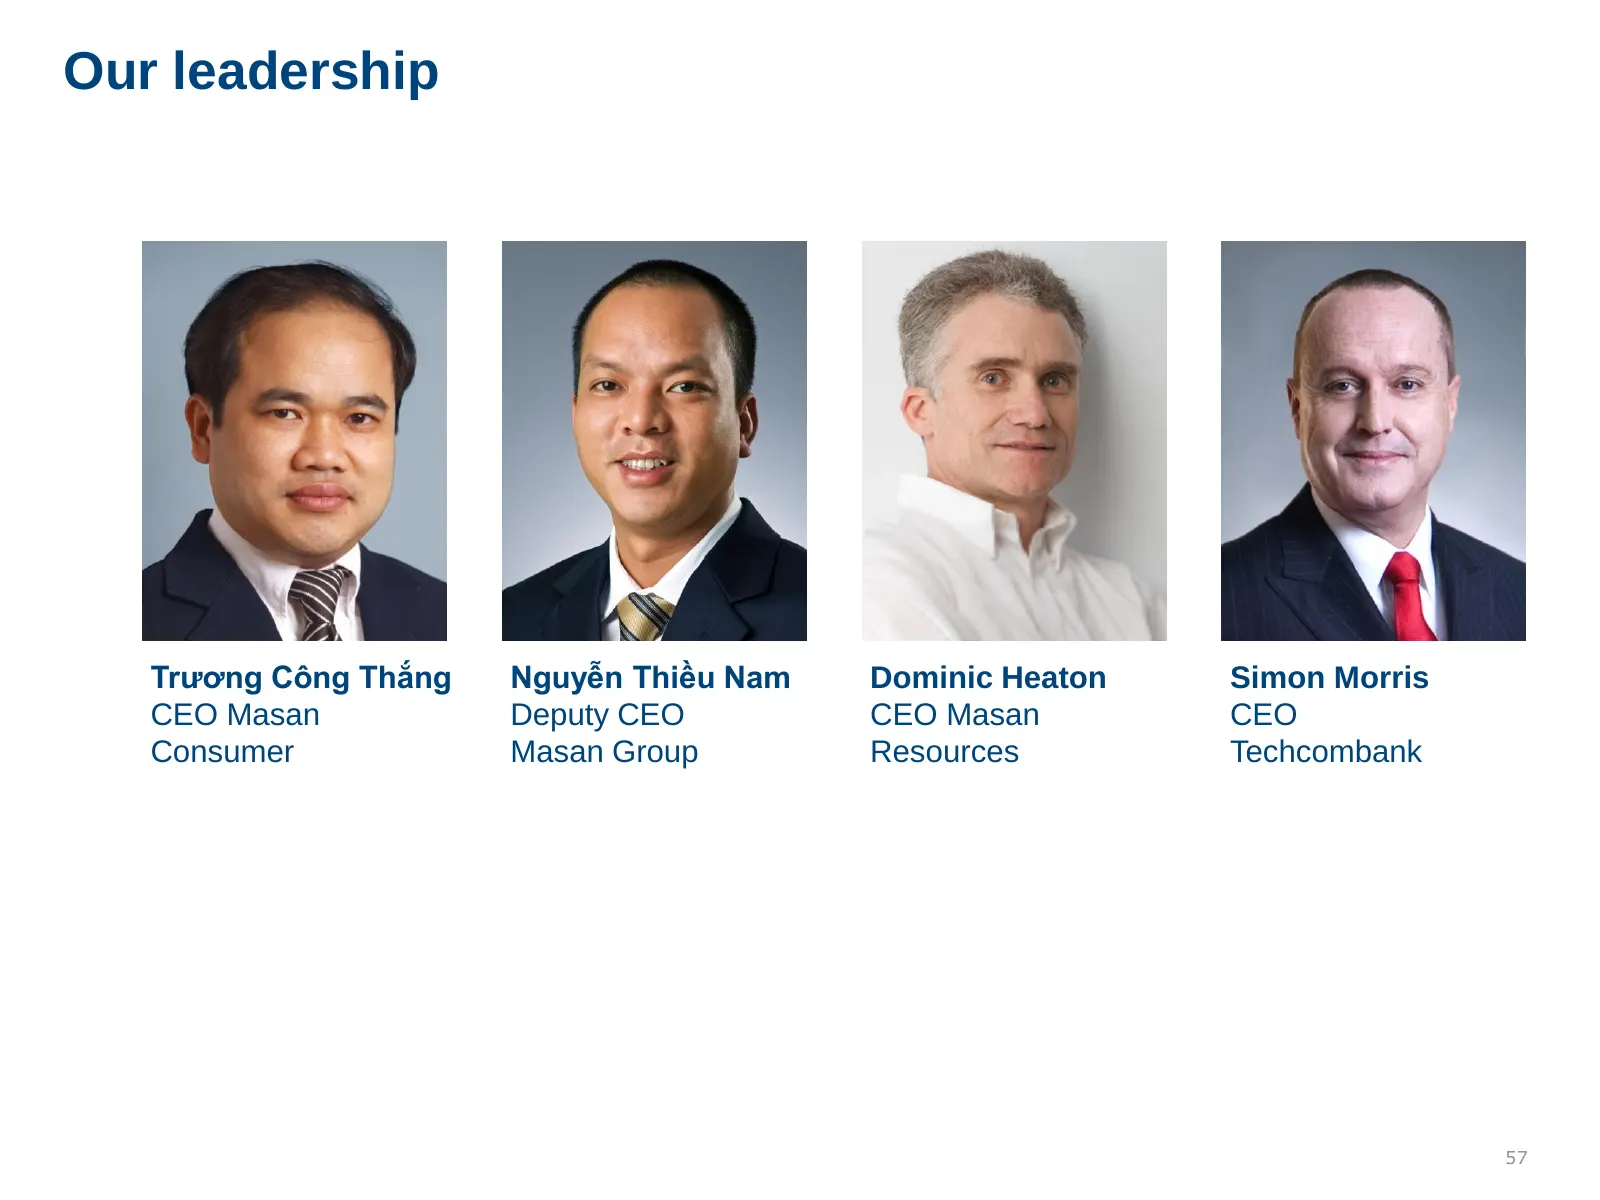
Slide 57: Our leadership
Our leadership Trương Công Thắng Nguyễn Thiều Nam Dominic Heaton Simon Morris CEO Masan Deputy CEO CEO Masan CEO Consumer Masan Group Resources Techcombank 57
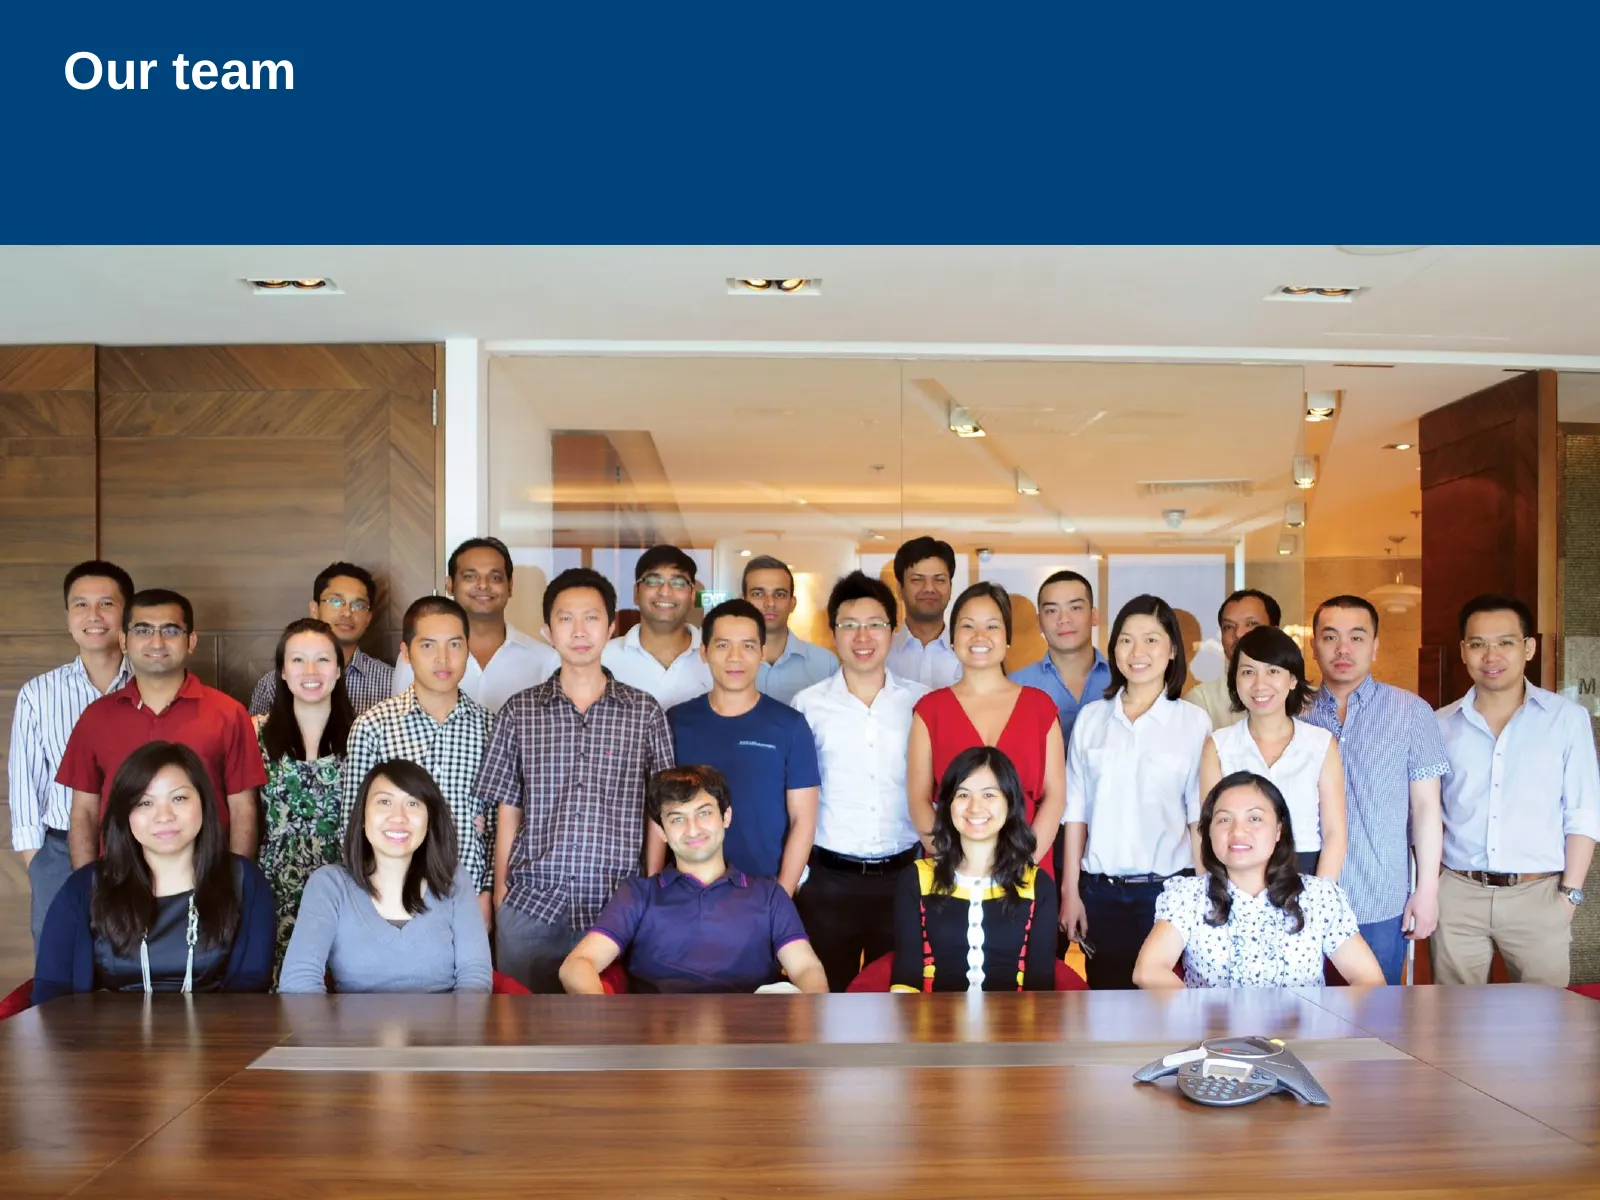
Slide 58: Our team
Our team 58
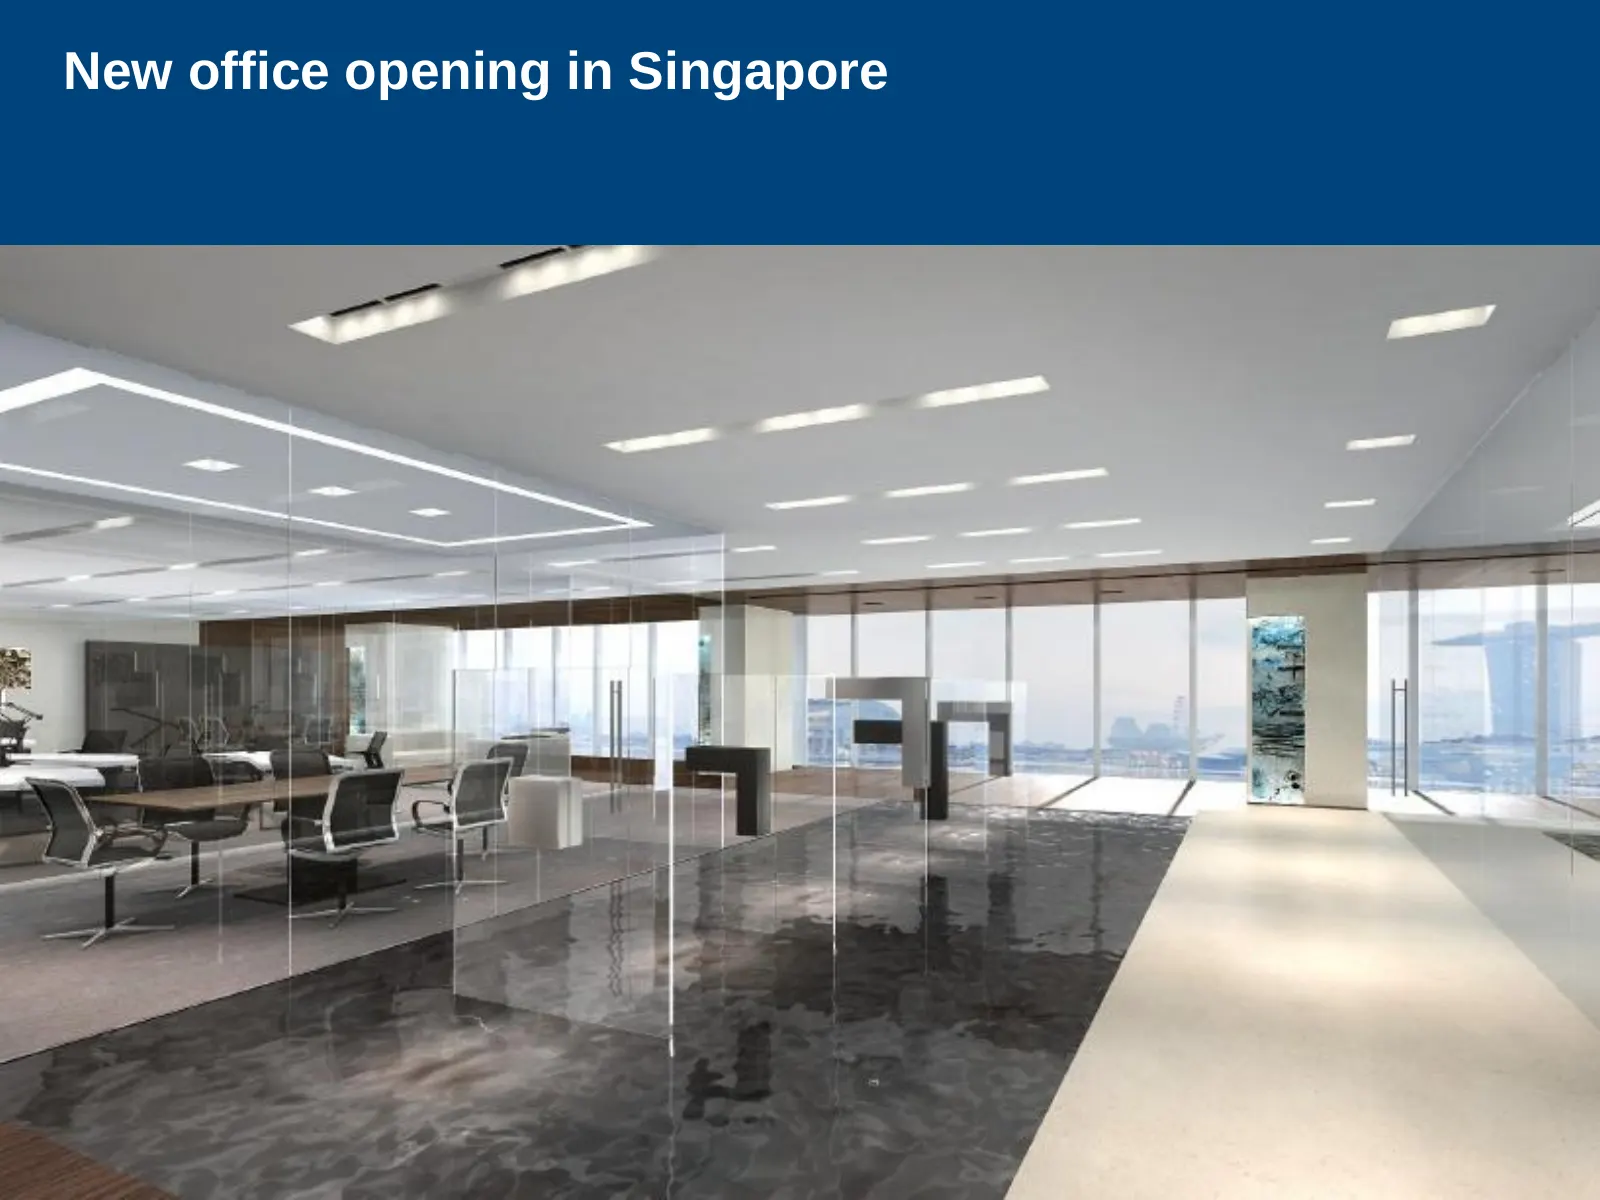
Slide 59: New office opening in Singapore
New office opening in Singapore 59
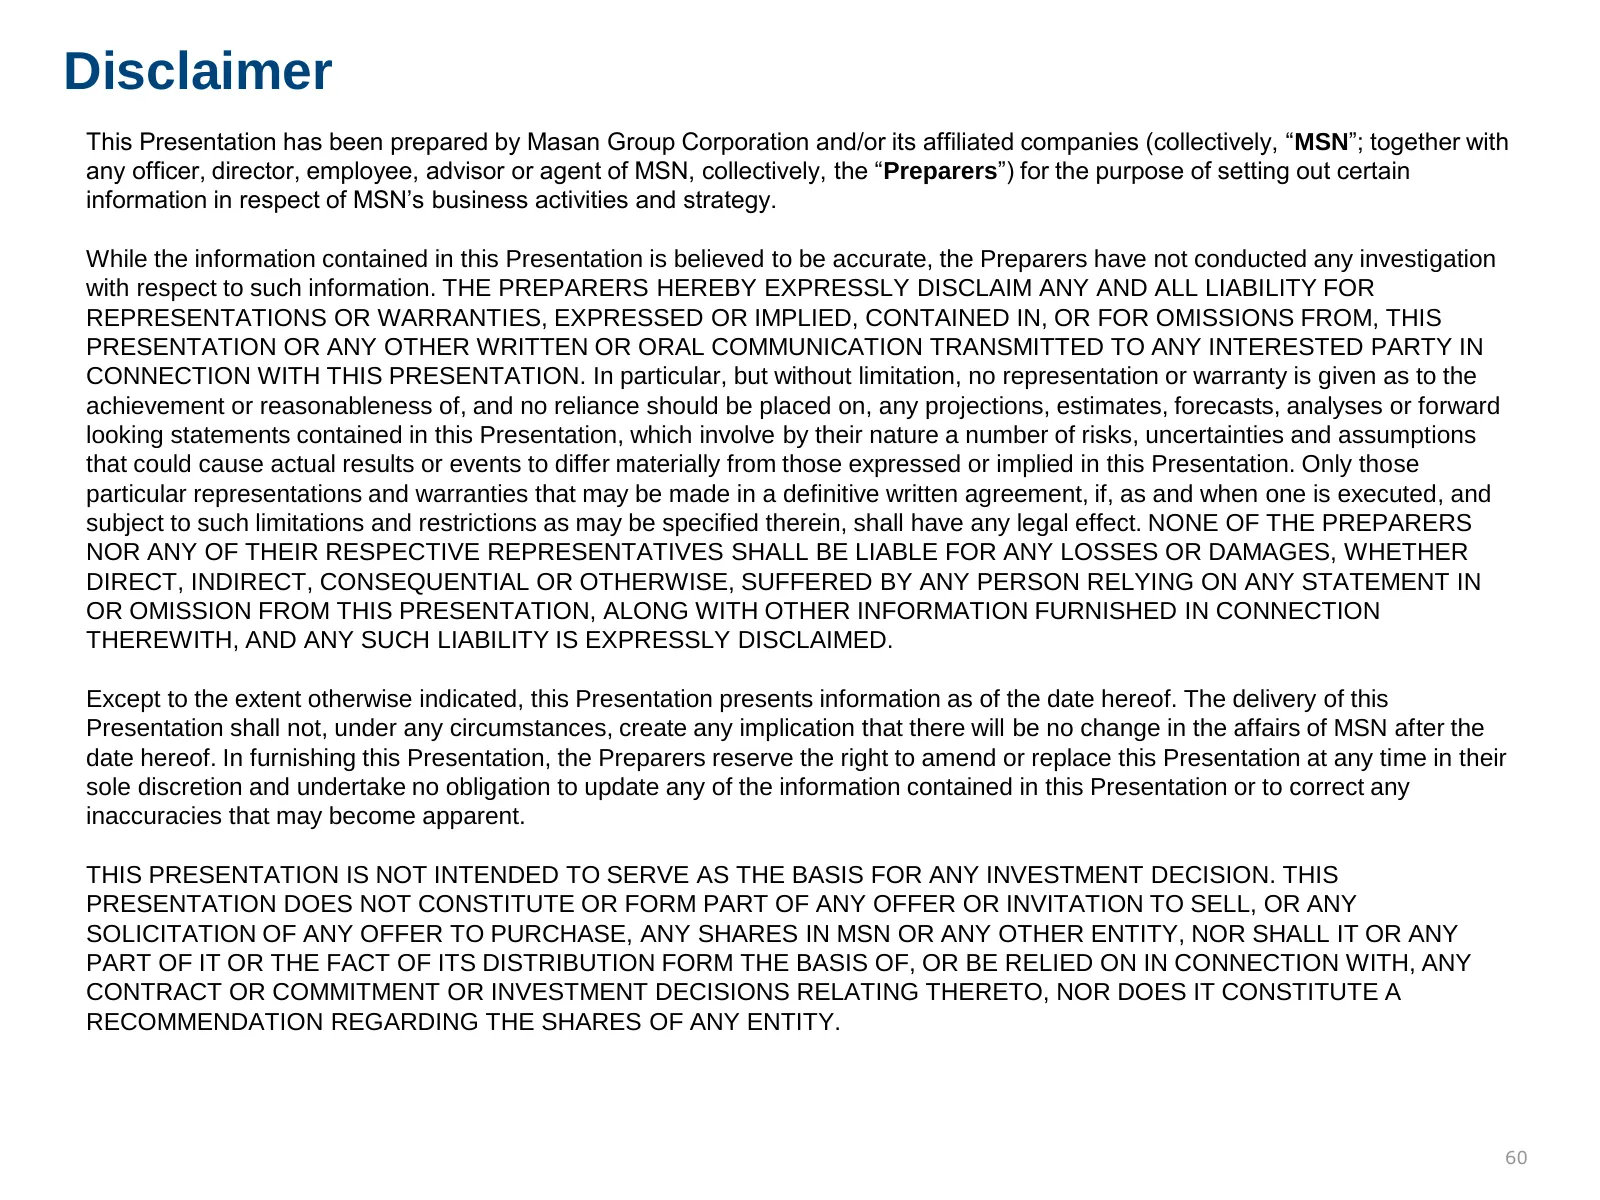
Slide 60: Disclaimer
Disclaimer This Presentation has been prepared by Masan Group Corporation and/or its affiliated companies (collectively, “MSN”; together with any officer, director, employee, advisor or agent of MSN, collectively, the “Preparers”) for the purpose of setting out certain information in respect of MSN’
Source: Internet Archive copy of masangroup.com
More decks from Masan Group Corporation
 Q3 2026 Earnings Presentation34 slides · Oct 26, 2026
 Q3 2026 Earnings Presentation34 slides · Oct 26, 2026
 Q2 2026 Earnings Presentation39 slides · Jul 31, 2026
 Q2 2026 Earnings Presentation39 slides · Jul 29, 2026
 WinCommerce — Nov 2025 Earnings Presentation6 slides · Dec 16, 2025
 October 2025 Earnings Presentation6 slides · Nov 13, 2025