Inland Real Estate — Shareholder Meeting (June 2005)
15 slides from Inland Real Estate's shareholder meeting presentation, Jun 23, 2005
Slide 1: Inland Real Estate Corporation
Inland Real Estate Corporation
Slide 2: Forward Looking Statements
FORWARD LOOKING STATEMENTS * These presentation materials contain forward-looking statements. Forward-looking statements are statements that are nat historical, including statements regarding management's intentions, beliefs, expectations, representations, plans or predictions ofthe future, and are
Slide 3: Company Overview
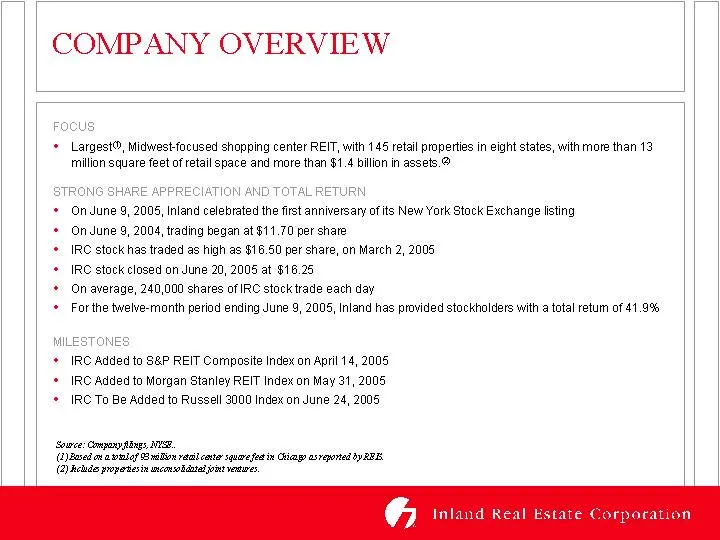
COMPANY OVERVIEW + Largest®, Midwest-focused shopping center REIT, with 145 retail properties in eight states, with more than 13 million square feet of retail space and more than $1.4 billion in assets.® + On June 9, 2005, Inland celebrated the first anniversary of ts New York Stack Exchange listing
Slide 4: Company Overview
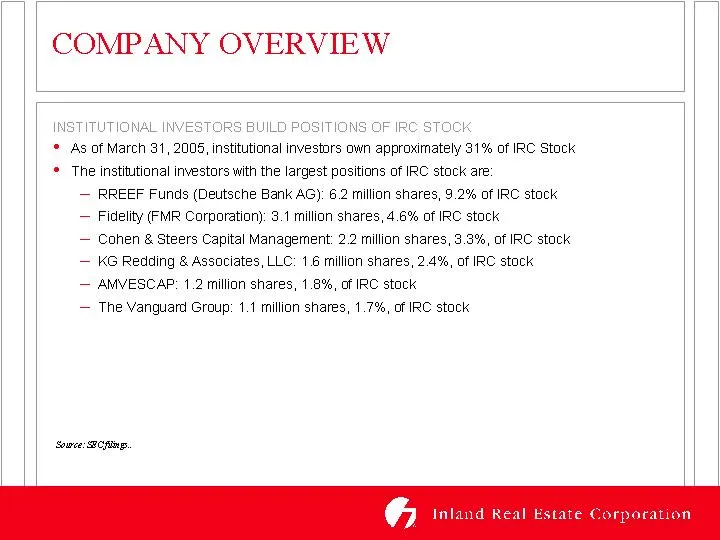
COMPANY OVERVIEW * AS of March 31, 2005, institutional investors own approximately 31% af IRC Stack ‘* The institutional investors with the largest positions of IRC stack are: — RREEF Funds (Deutsche Bank AG): 6.2 million shares, 9.2% of IRC stack — Fidelity (FMR Corporation): 3.1 million shares, 4.
Slide 5: Financial Highlights
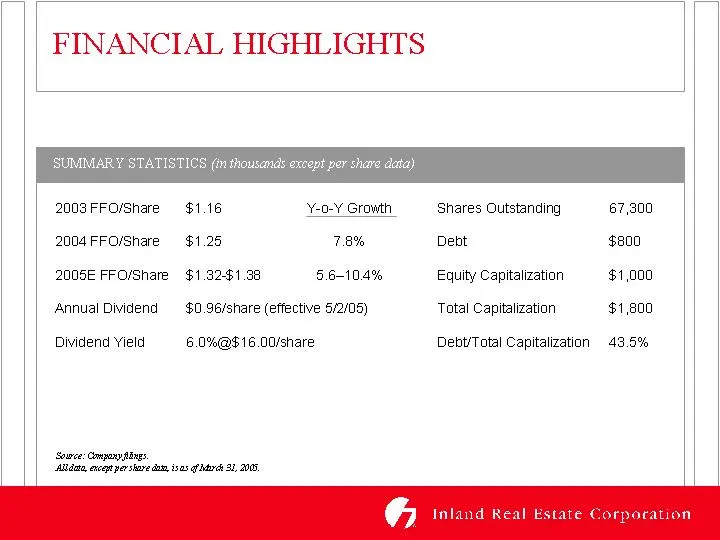
FINANCIAL HIGHLIGHTS 2003FFO/Share $1.16 Y-0-¥ Growth Shares Outstanding 67,300 2004 FFO/Share $1.25 7.8% Debt $800 2005 FFO/Share $1.32-$1.38 5.6-10.4% Equity Capitalization $1,000 Annual Dividend — $0.96/share (effective 6/2/06) Total Capitalization $1,800 Dividend Yield 6.0%@$16.00/share Debt/Tot
Slide 6: Financial Highlights
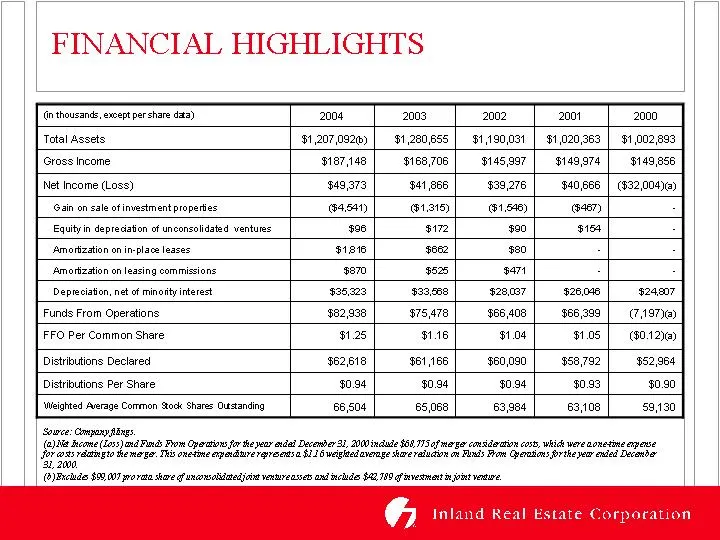
FINANCIAL HIGHLIGHTS Green enero) em En Taal Asete siaoream | s12006%| sisenas | soma | vomae ross Incone siaras | stearos | staseor | staasra | _stas55 Net noone 055) waa | senses | _sseave | senses | @ezcane Tah nse ona aan] era] orem] oan Eun depen of wows ves So sm woo [ies | Foz ol eases He se
Slide 7: Visible Growth
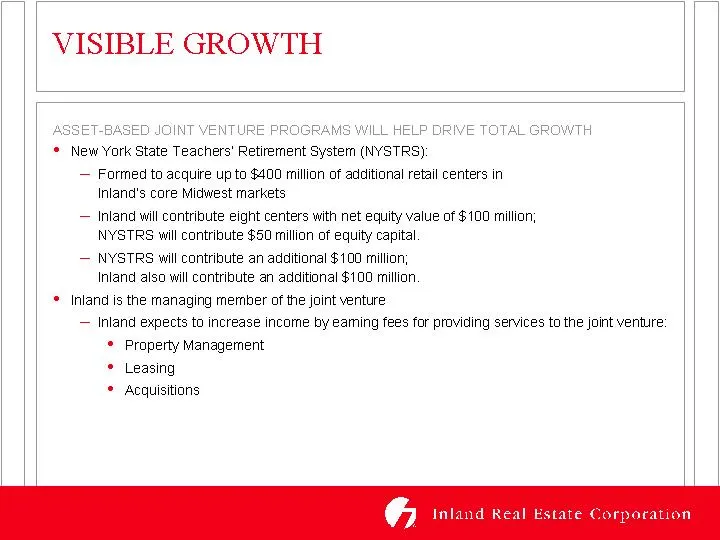
VISIBLE GROWTH © New York State Teachers’ Retirement System (NYSTRS): — Formed to acquire up to $400 million of additional retail centers in Inland’s core Midwest markets — Inland will contribute eight centers with net equity value of $100 million; NYSTRS will contribute $50 million af equity capita
Slide 8: Focused Investment Strategy and Portfolio
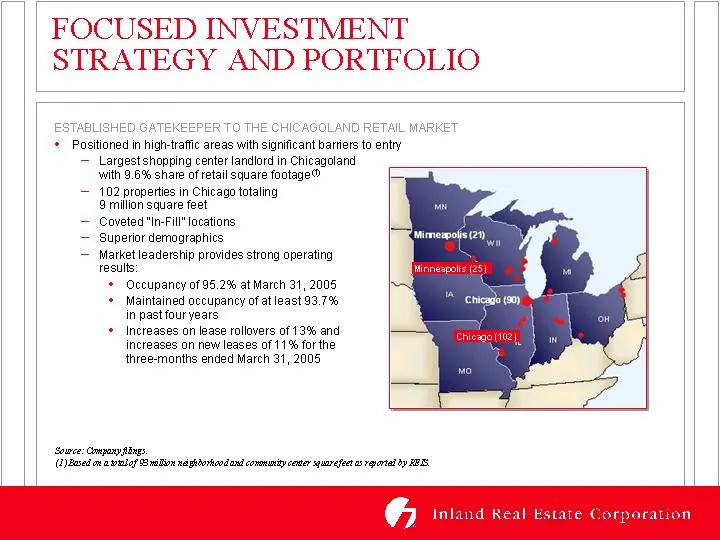
FOCUSED INVESTMENT STRATEGY AND PORTFOLIO ESTABLISHED GATEKEEPER TO THE CHICAGOLAND RETAIL MARKET + Positioned in high-traffic areas with significant barfiers ta entry — Largest shopping center landlord in Chicagoland ‘with 9.6% share of retail square footage — 102 properties in Chicago totaling 9 m
Slide 9: Focused Investment Strategy and Portfolio
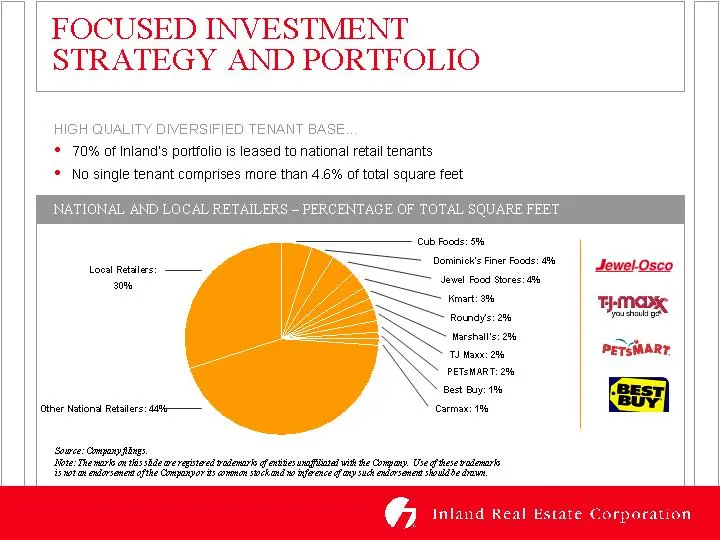
FOCUSED INVESTMENT STRATEGY AND PORTFOLIO HIGH QUALITY DIVERSIFIED TENANT BASE. * 70% of Inlanc!’s portfolio is leased to national retail tenants * No single tenant comprises more than 4.6% of total square feet AL RETAILER: Local Retalers 06 Ty Maen: 2% PETEMART: 2% Best Buy 1% cara: 1% ther Nationa
Slide 10: Focused Investment Strategy and Portfolio
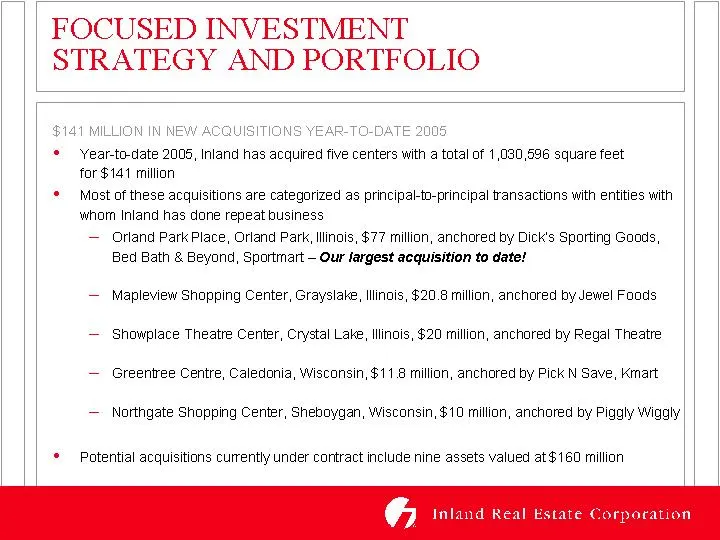
FOCUSED INVESTMENT STRATEGY AND PORTFOLIO * Year-to-date 2005, Inland has acquired five centers with a total of 1,030,596 square feet for $141 milion * Most of these acquisitions are categorized as principal-to-principal transactions with entities with whom Inland has done repeat business — Orland P
Slide 11: Appendix
APPENDIX
Slide 12: Appendix
APPENDIX ‘Throughout these presentation materials, we present certain financial measures that, while not prepared in accordance with generally accepted accounting principles, or GAAP, we believe are useful to investors, as key measures of our operating performance: Funds From Operations, or FFO; Adj
Slide 13: Appendix
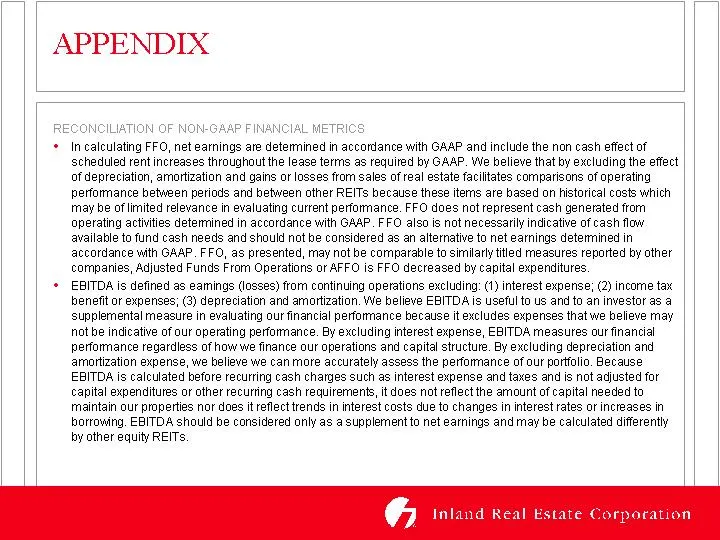
APPENDIX + In calculating FFO, net earnings are determined in accordance with GAAP and include the nan cash effect of scheduled rent increases throughout the lease terms as requited by GAAP. We believe that by excluding the effect of depreciation, amortization and gains or losses from sales of real
Slide 14: Reconciliation of Non-GAAP Financial Metrics
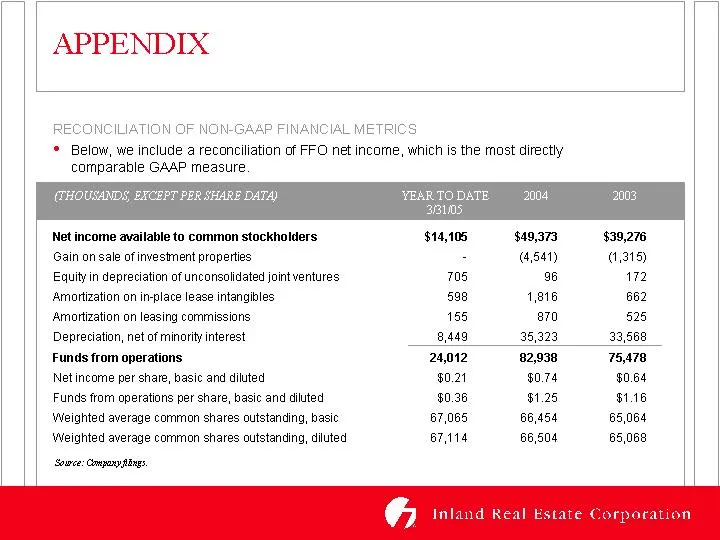
APPENDIX RECONCILIATION OF NON-GAAP FINANCIAL METRICS * Below, we include a reconciliation of FFO net income, which is the most directly comparable GAAP measure Net income available to common stockholders Gain on sale of investment properties Equity in depreciation of unconsolidated joint ventures A
Slide 15: Searchable text section of graphics shown above
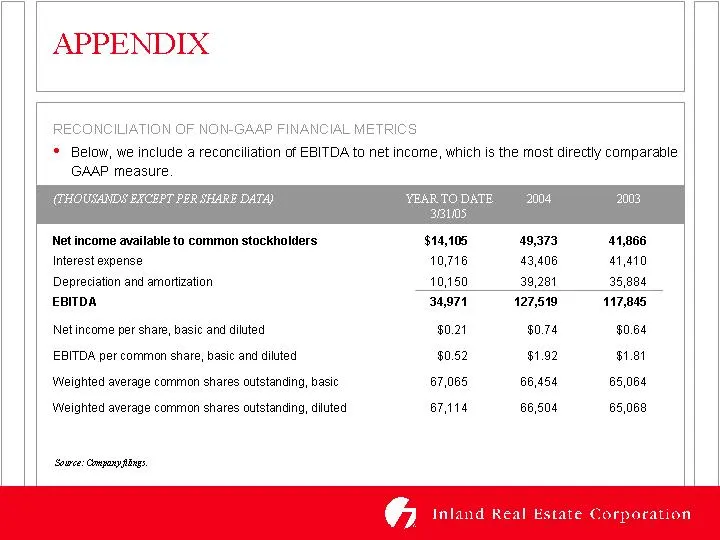
Searchable text section of graphics shown above [LO GO] Annual Meeting of Stockholders June 23, 2005 FO RWARD LOOKING STATEMENTS • These presentation materials contain forward-looking statements. Forward-looking statements are statements that are not historical, including statements regarding manage
Source: SEC EDGAR · 8-K filed Jun 23, 2005
More decks from Inland Real Estate Corp
 Investor Presentation (November 2015)30 slides · Nov 17, 2015
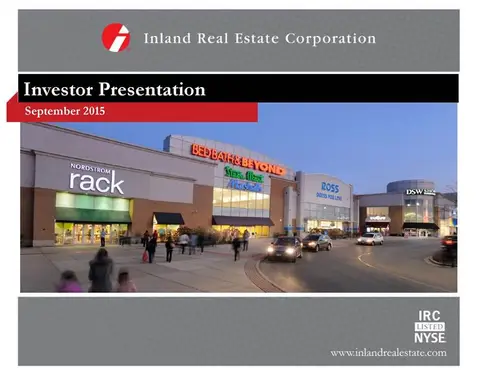 Investor Presentation (September 2015)29 slides · Sep 16, 2015
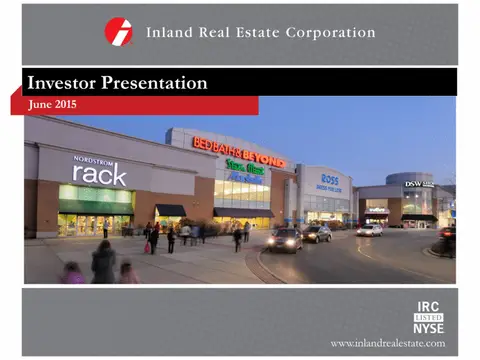 Investor Presentation (June 2015)29 slides · Jun 9, 2015
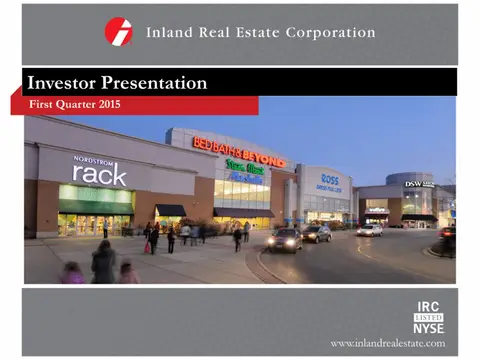 Investor Presentation (May 2015)26 slides · May 15, 2015
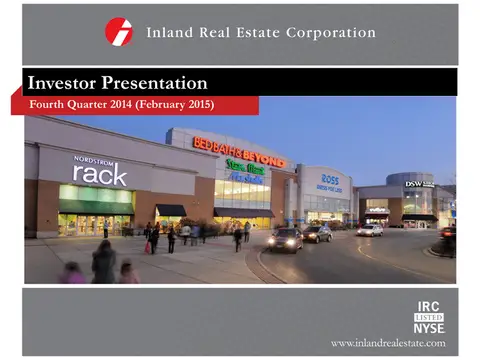 Investor Presentation (February 2015)26 slides · Feb 24, 2015
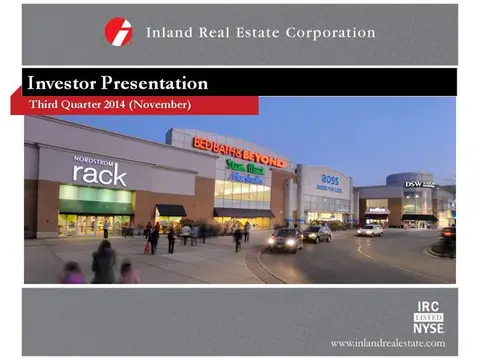 Investor Presentation (November 2014)26 slides · Nov 5, 2014