Pharsight — Investor Presentation (August 2004)
33 slides from Pharsight's investor presentation, Aug 17, 2004
Slide 1: Pharsight Investor Presentation, August 2004
Exhibit 99.1 ExhibitO’Connor Pharsight Investor August Shawn Cynthia Copyright 2004 99.1 Stephens Presentation Corporation © 2004President SVP Pharsight. & CFO&All CEOrights reserved.
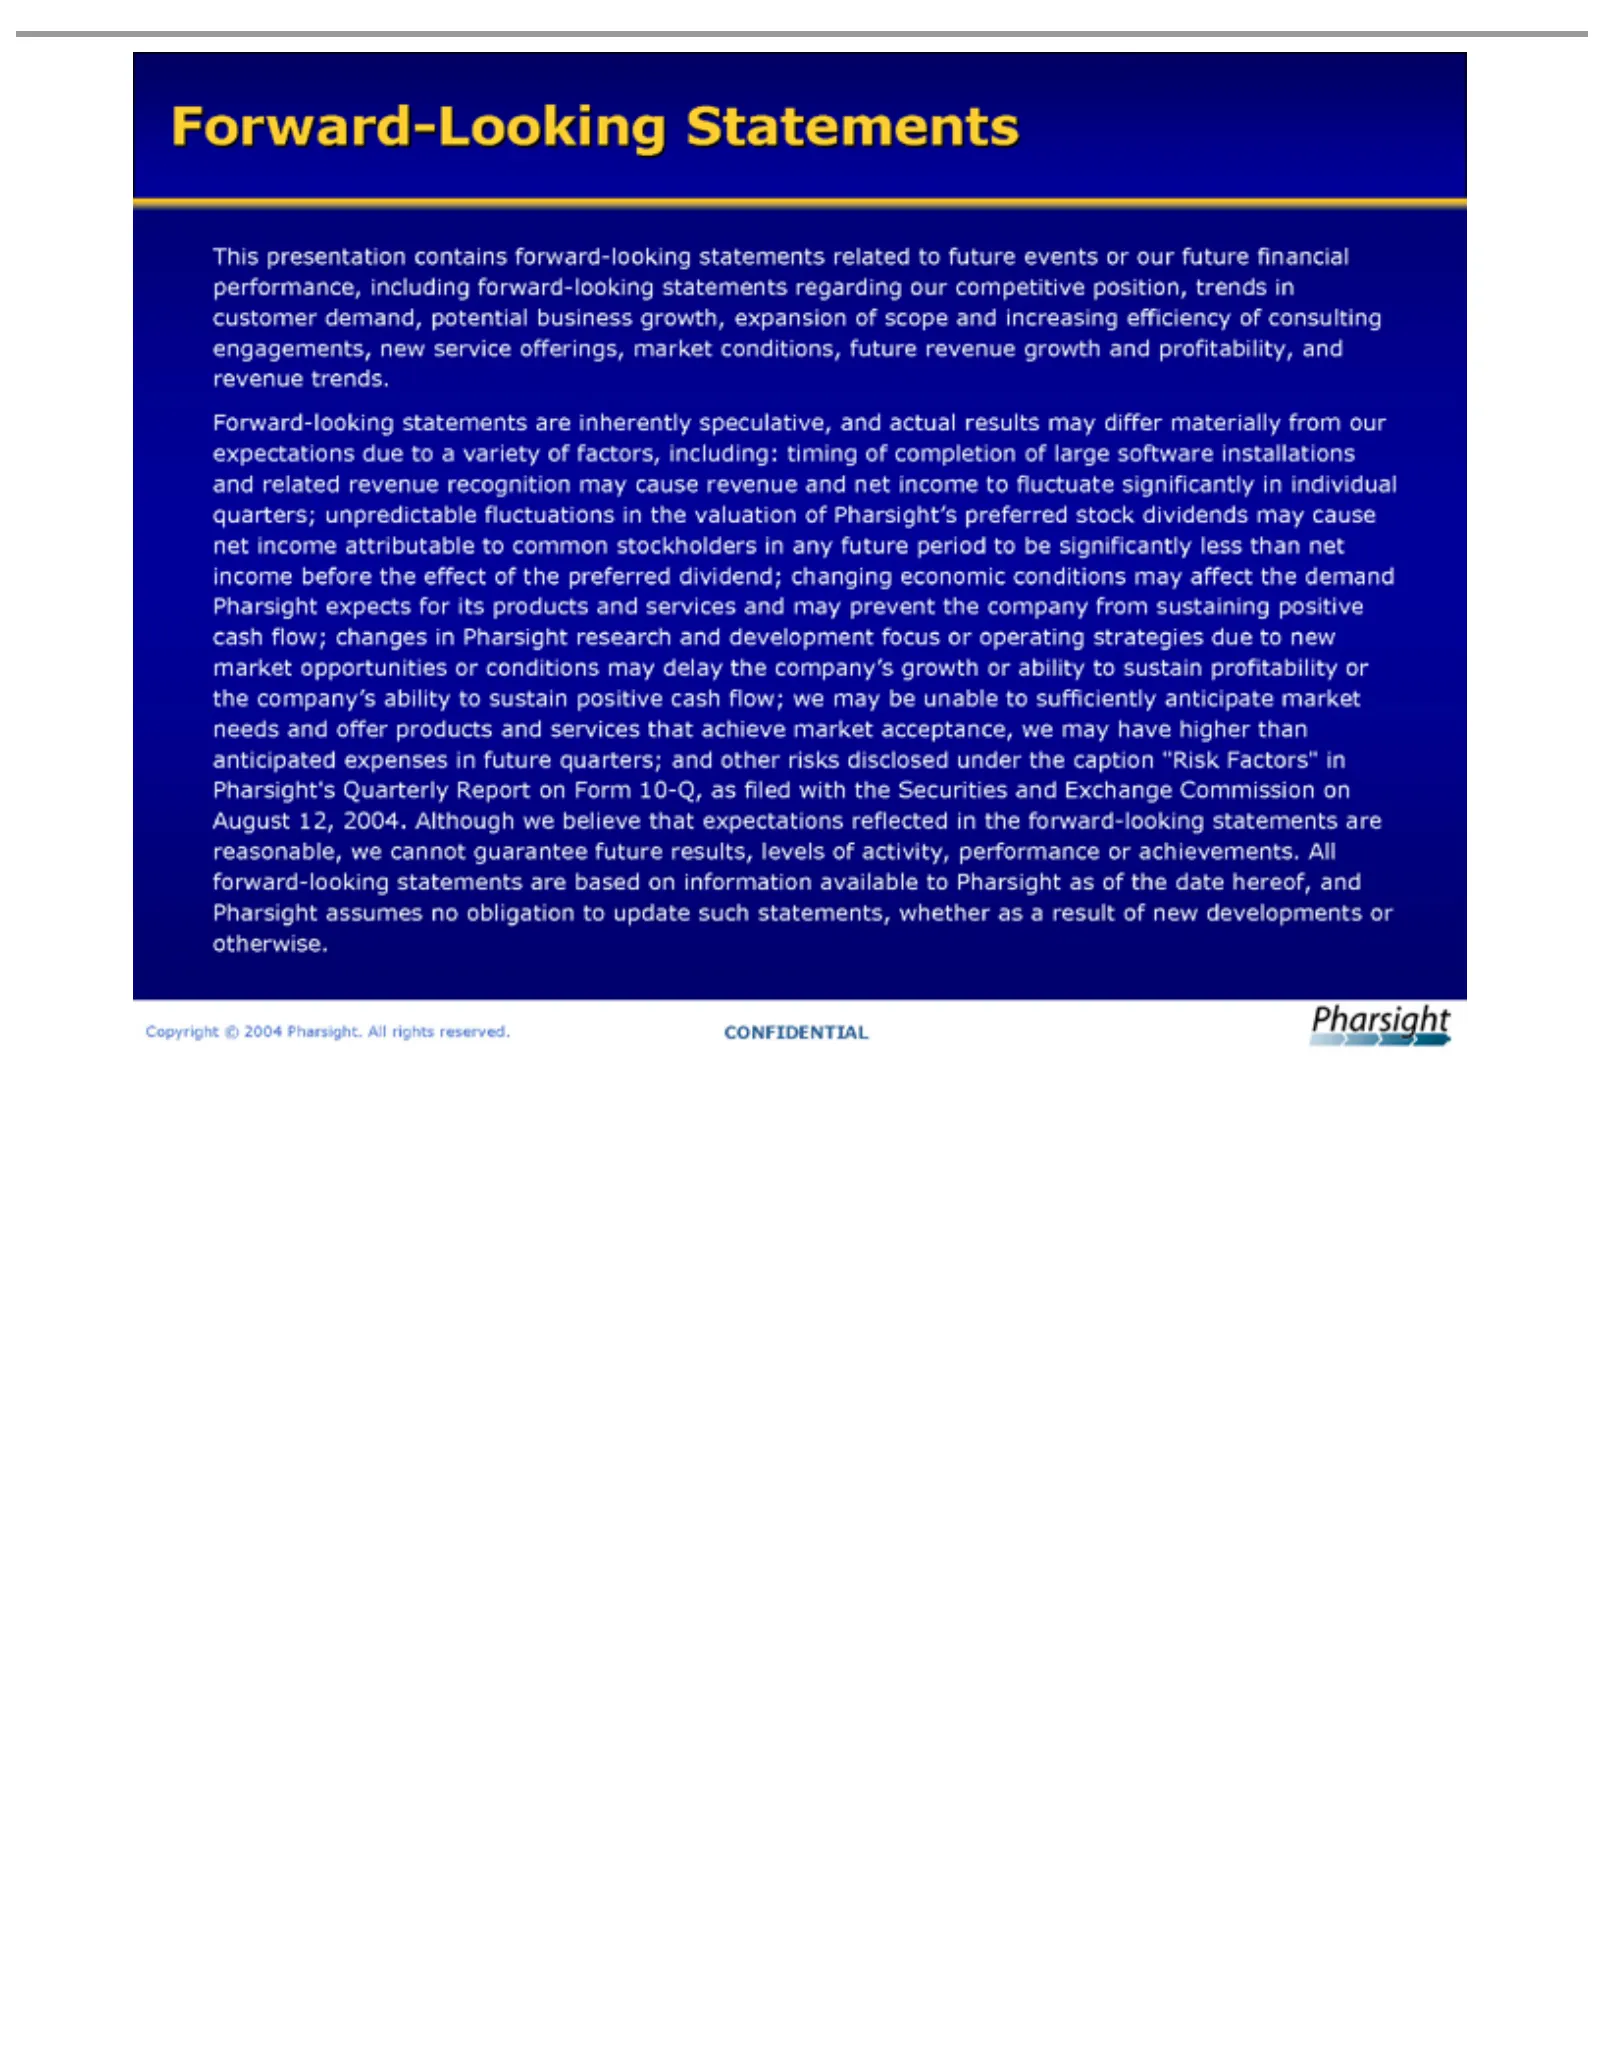
Slide 2: Forward-Looking Statements
Forward-Looking This customer profitability, Forward-looking installations stock conditions focus may disclosed expectations on Copyright CONFIDENTIAL information be presentation dividends orunable operating demand, under © mayand and reflected 2004 to available affect the may related revenue statem
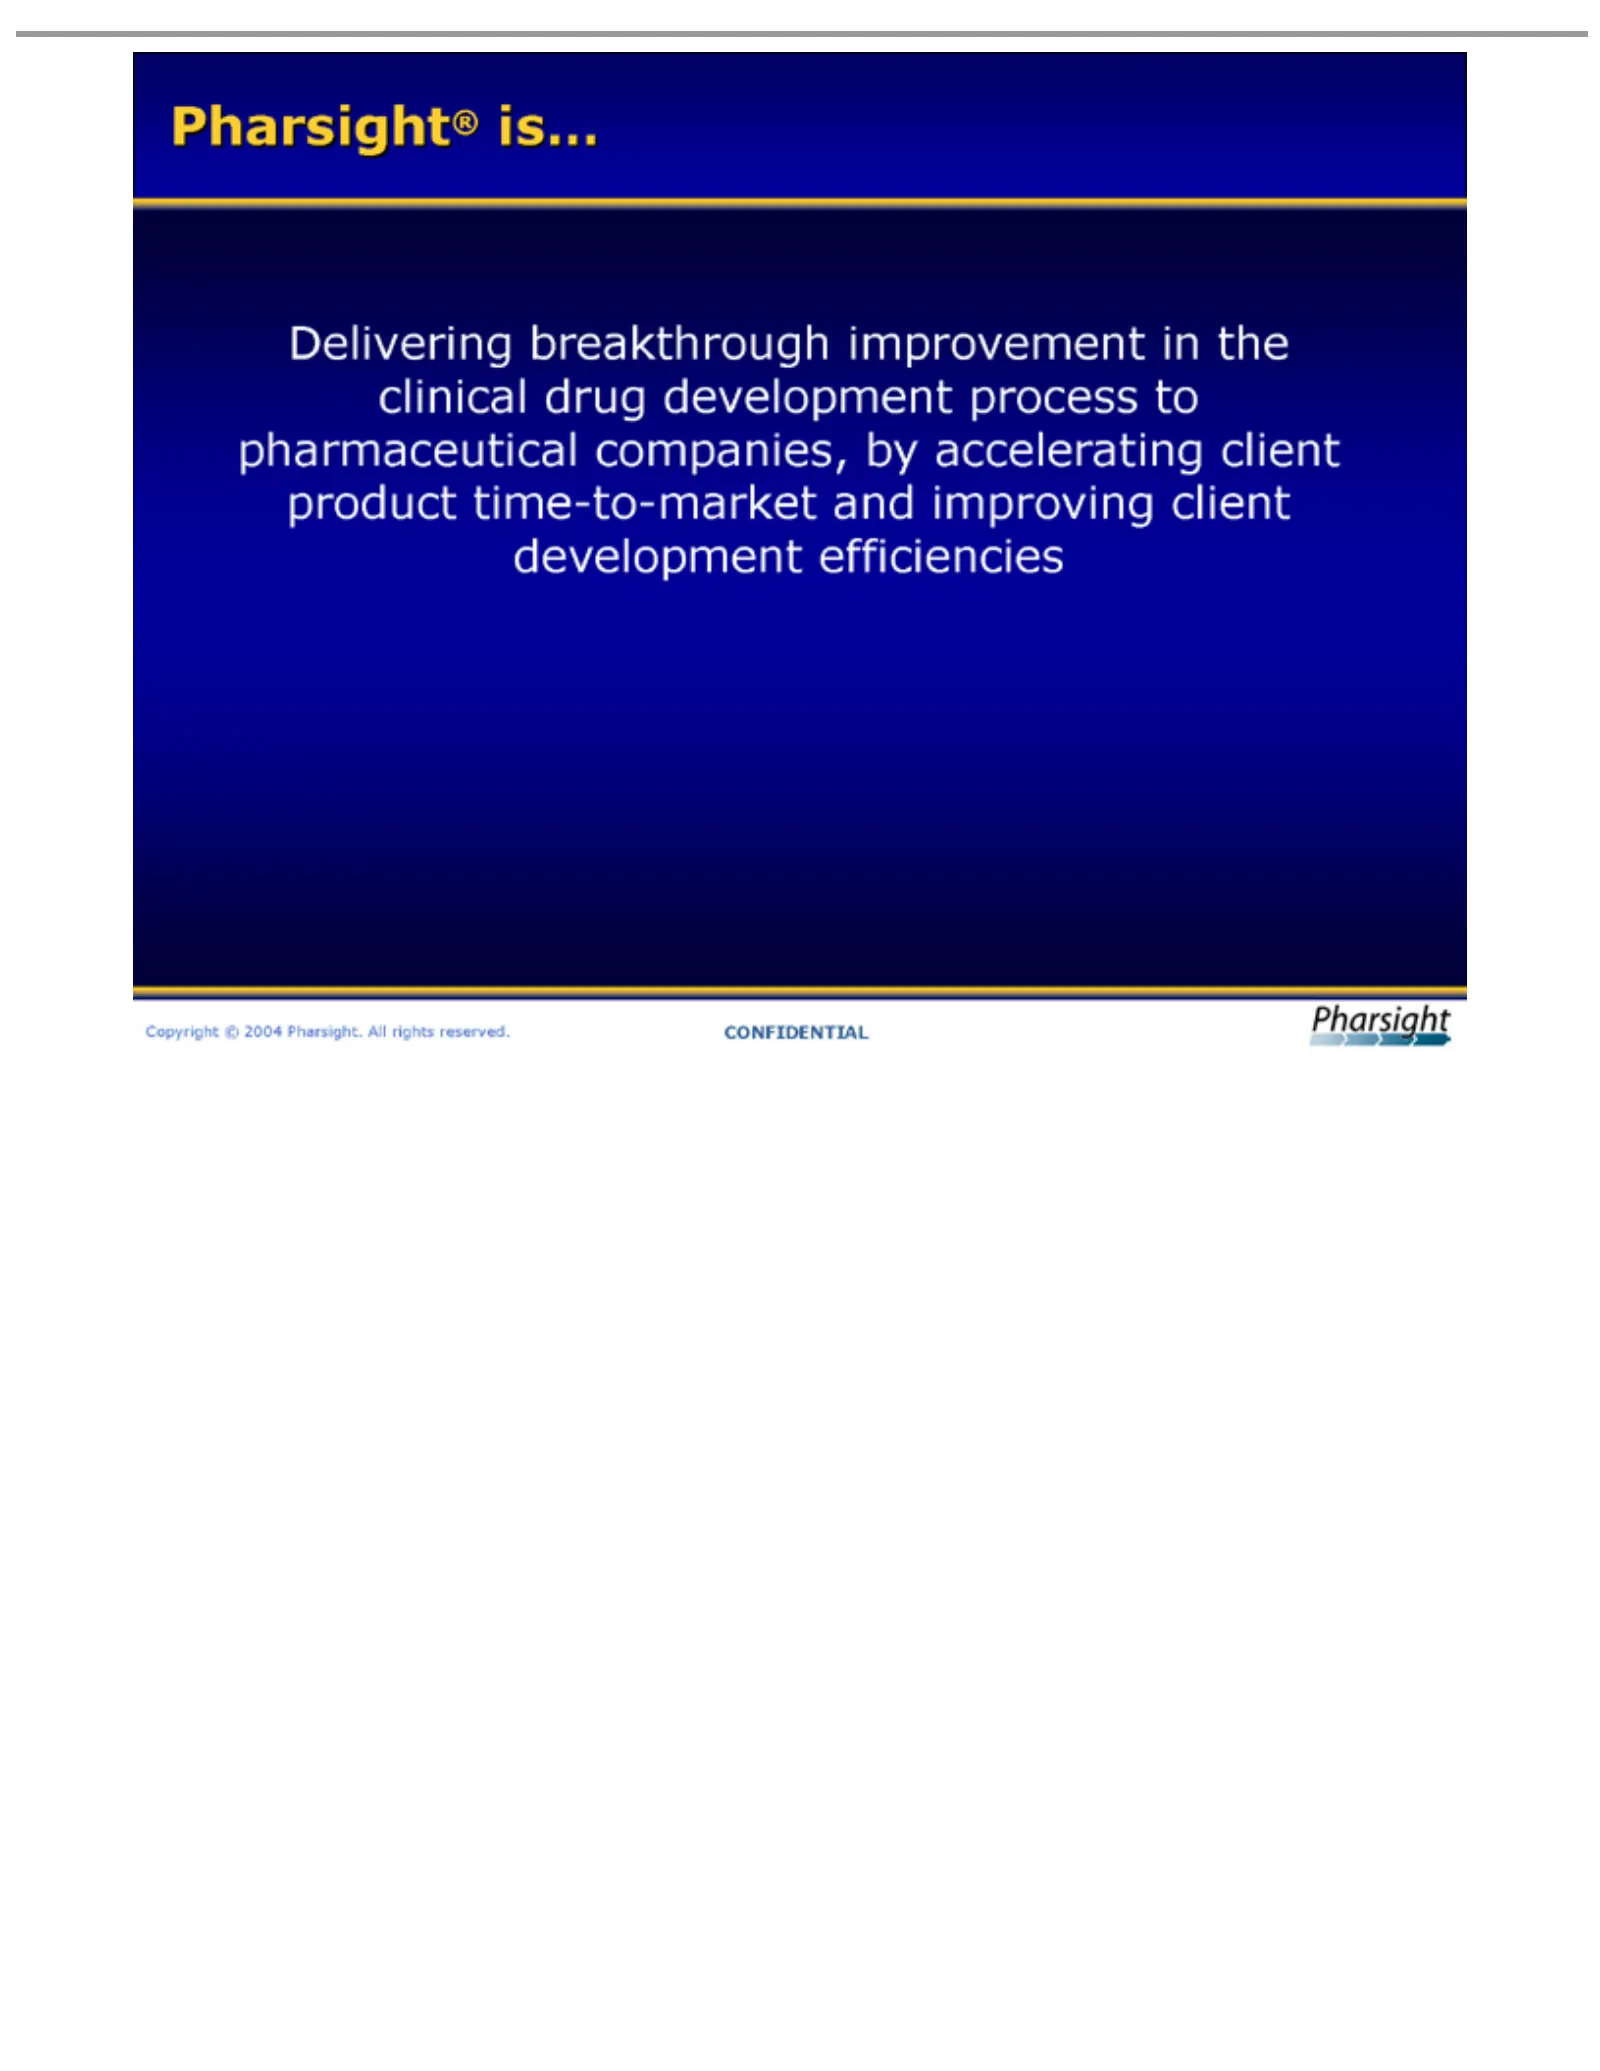
Slide 3: Pharsight is delivering breakthrough improvement in clinical drug development
Pharsight®© Delivering Copyright efficiencies CONFIDENTIALbreakthrough is… 2004 Pharsight. improvement All rights in reserved. the clinical drug development process to pharmaceutical companies, by accelerating client product time-to-market and improving client development
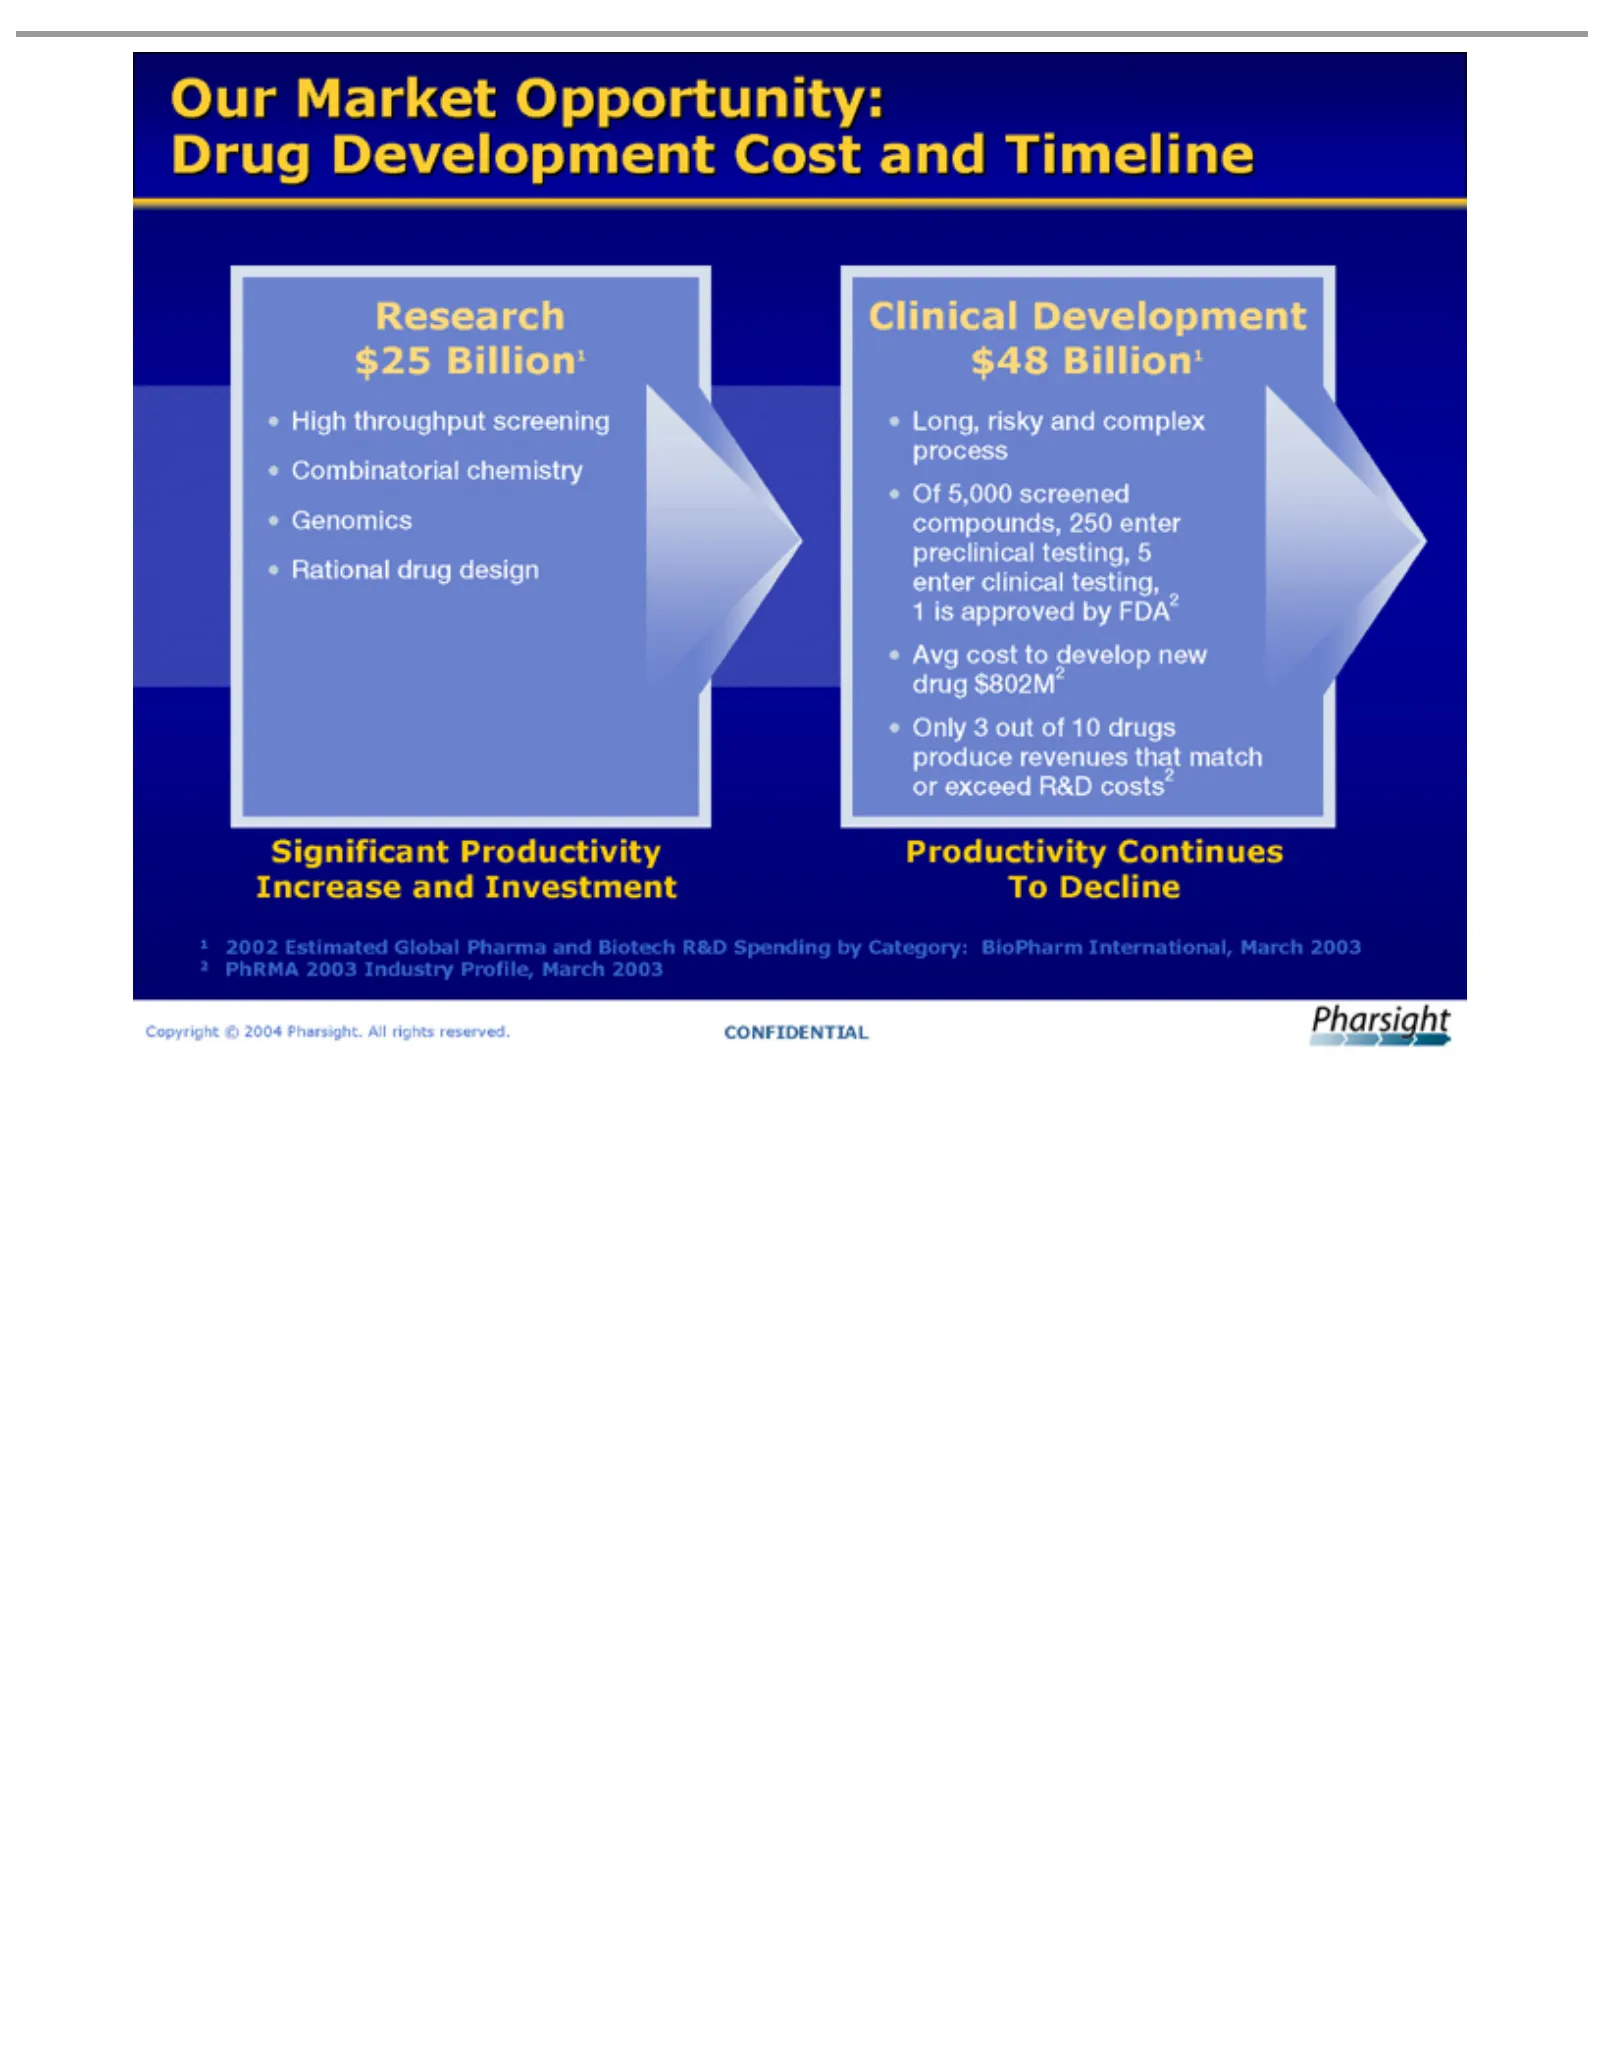
Slide 4: Our Drug Development Market Opportunity
Our Drug $25 Research High Combinatorial Rational Genomics Significant Clinical $48 Long, Of process Avg Only Productivity 1 2 Copyright CONFIDENTIAL 2002 PhRMA 5,000 Billion1 Market cost 3throughput Development risky out Estimated Development drug to screened 2003 © of Productivity develop and Oppo
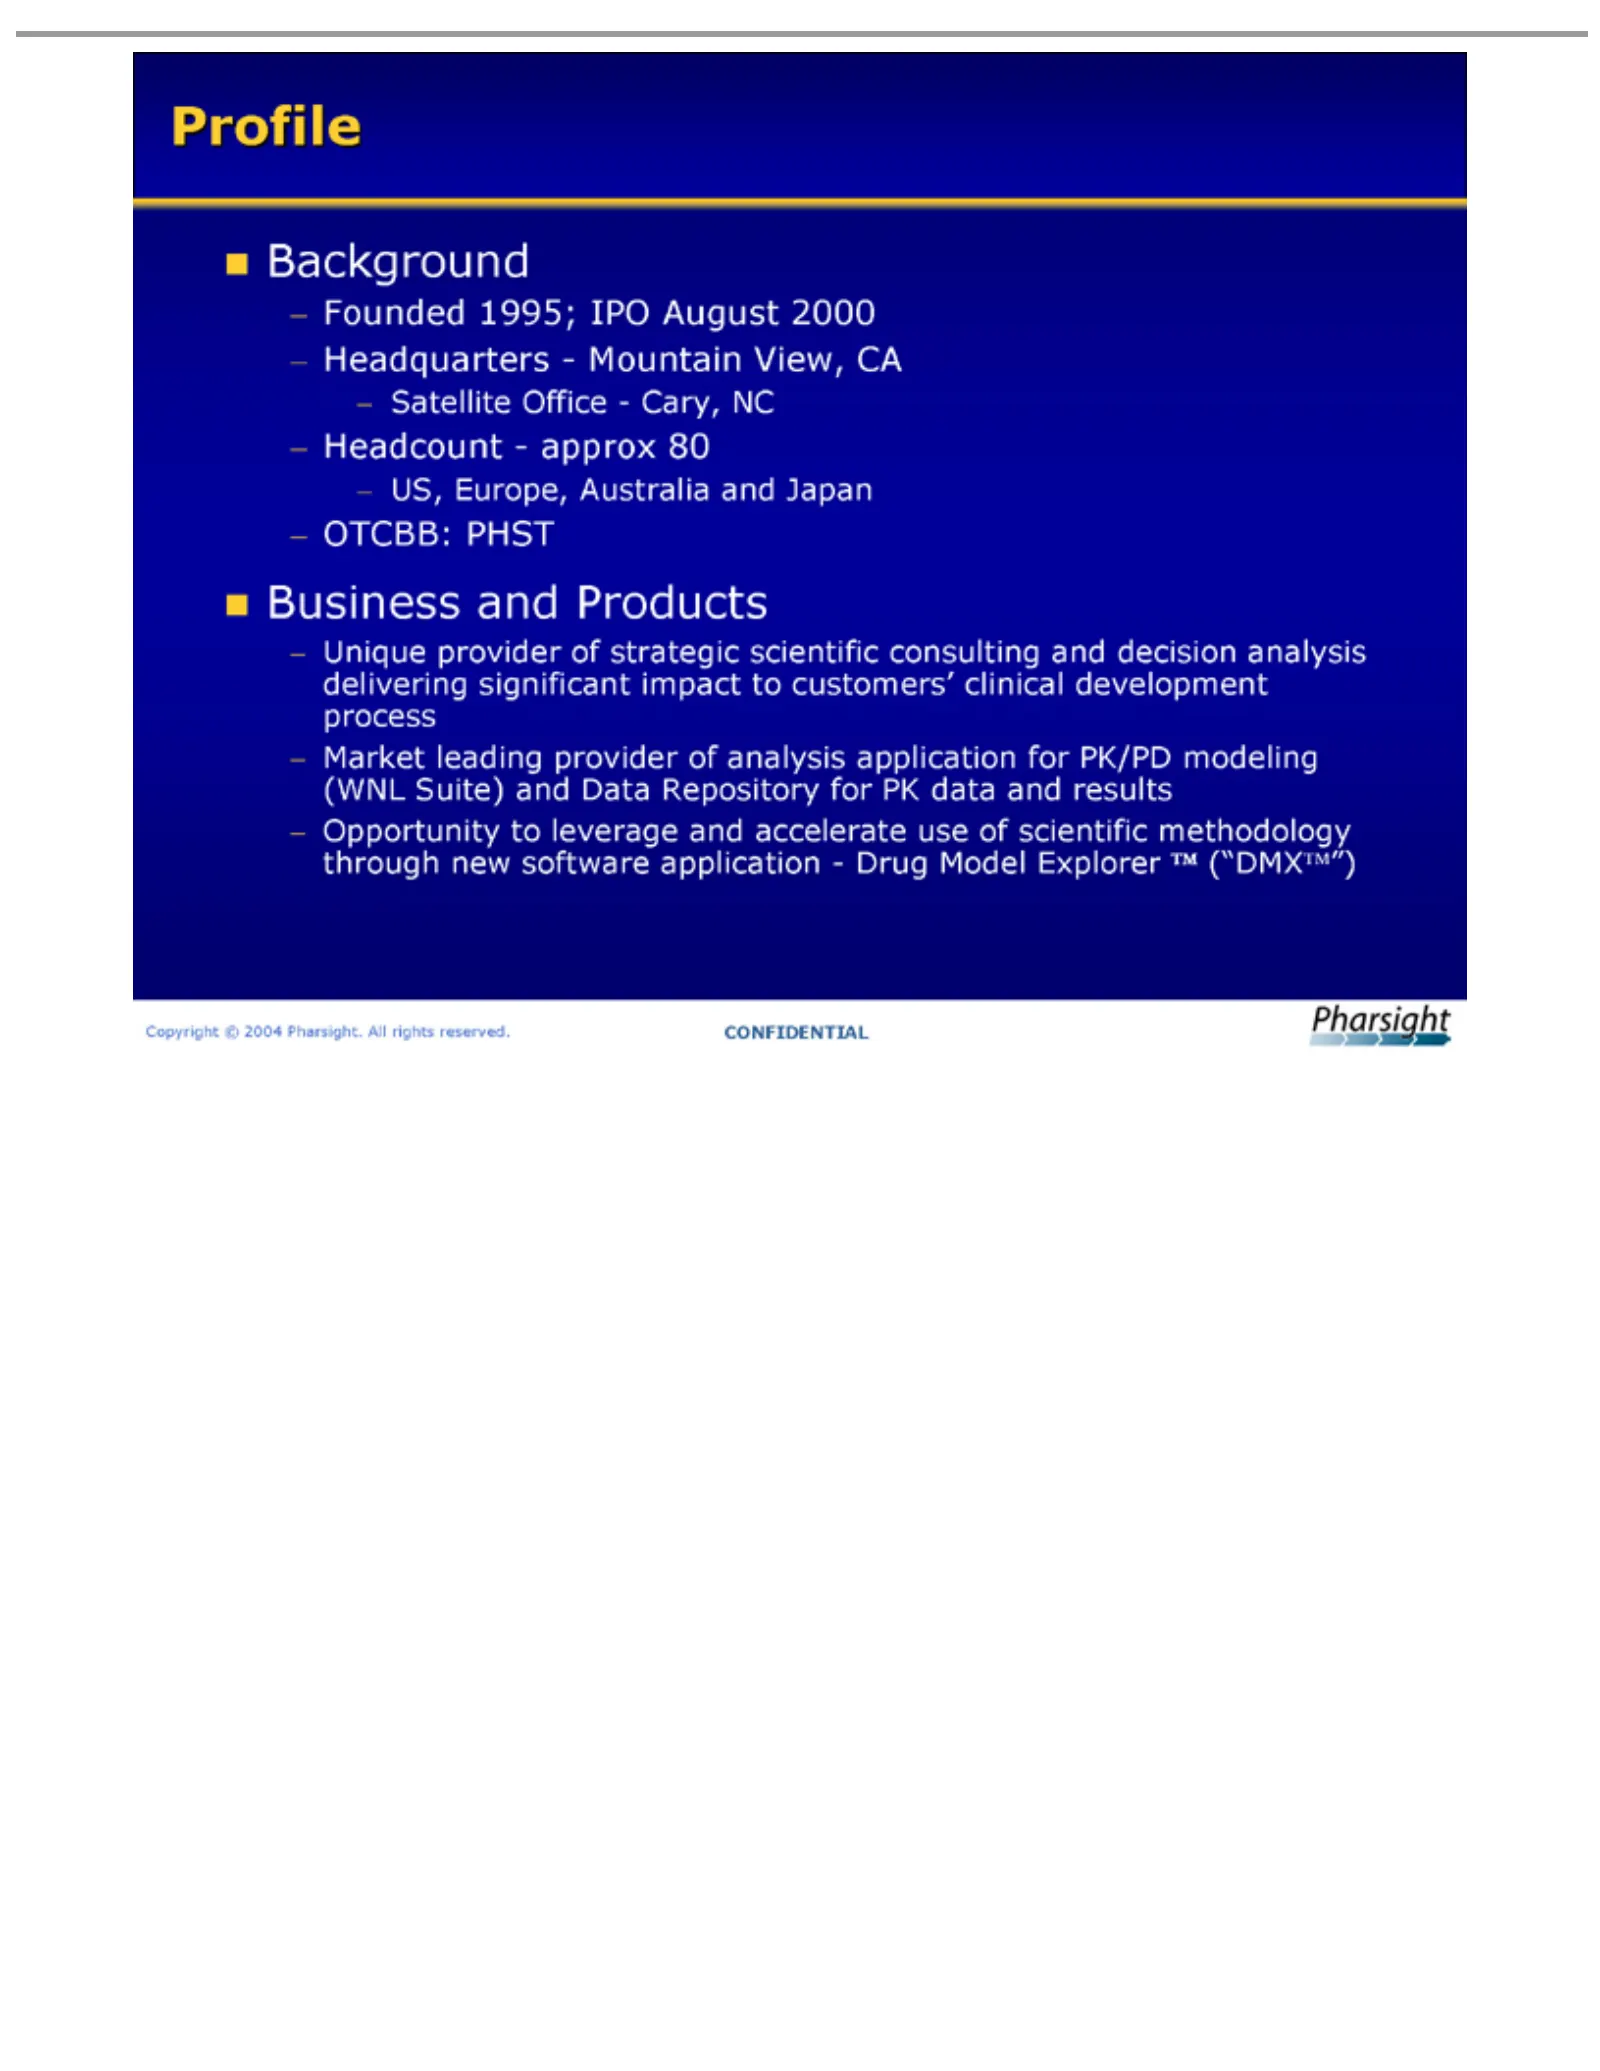
Slide 5: Company Profile and Background
Founded Background Profile Headquarters—Mountain Satellite Headcount—approx US, OTCBB: ??Business Unique Market Opportunity Copyright CONFIDENTIAL Europe, leading provider Office—Cary, 1995; PHST ©and Australia to 2004 leverage IPO provider Products ofPharsight. strategic August 80and NC and ofView,
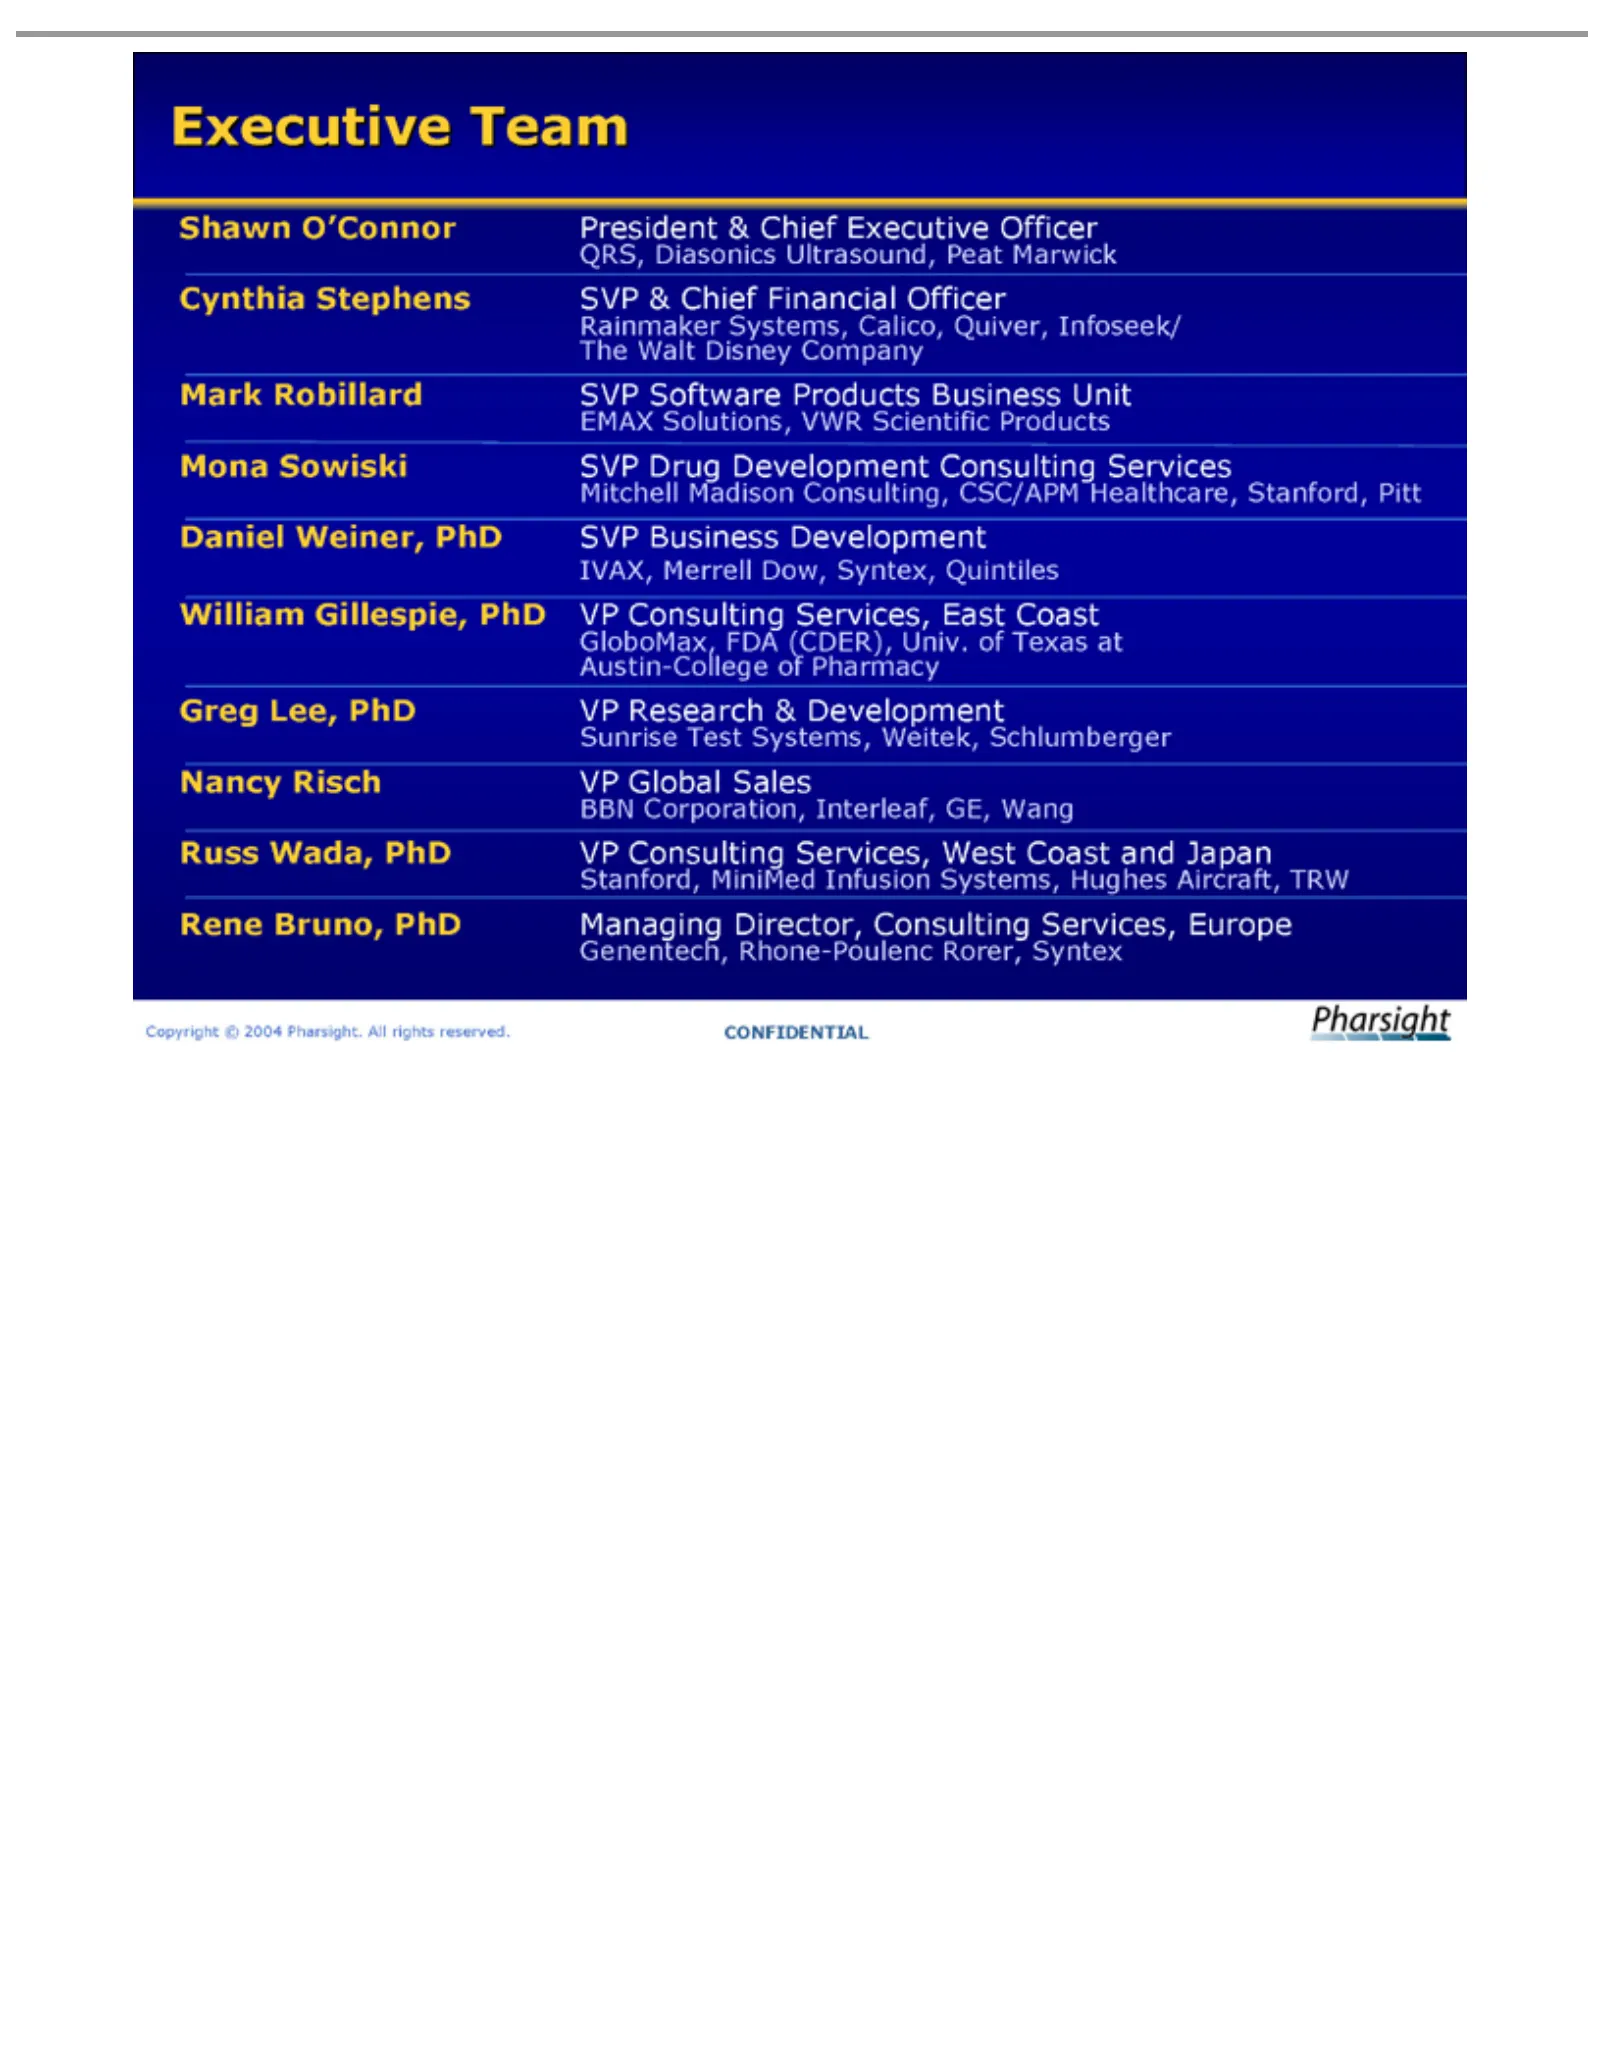
Slide 6: Executive Team
Executive Shawn Cynthia Mark Mona Daniel William Greg Nancy Russ Rene Copyright CONFIDENTIAL Wada, Lee, Bruno, Robillard Sowiski Risch Weiner, O’Connor Stephens Gillespie, Team PhD ©PhD PhD 2004 VPSVP PhD VP SVP Global VP President SVP Managing Pharsight. PhD Research Drug SVP Consulting Software &V
Slide 7: Software Products
Software Products Copyright © 2004 Pharsight. All rights reserved.
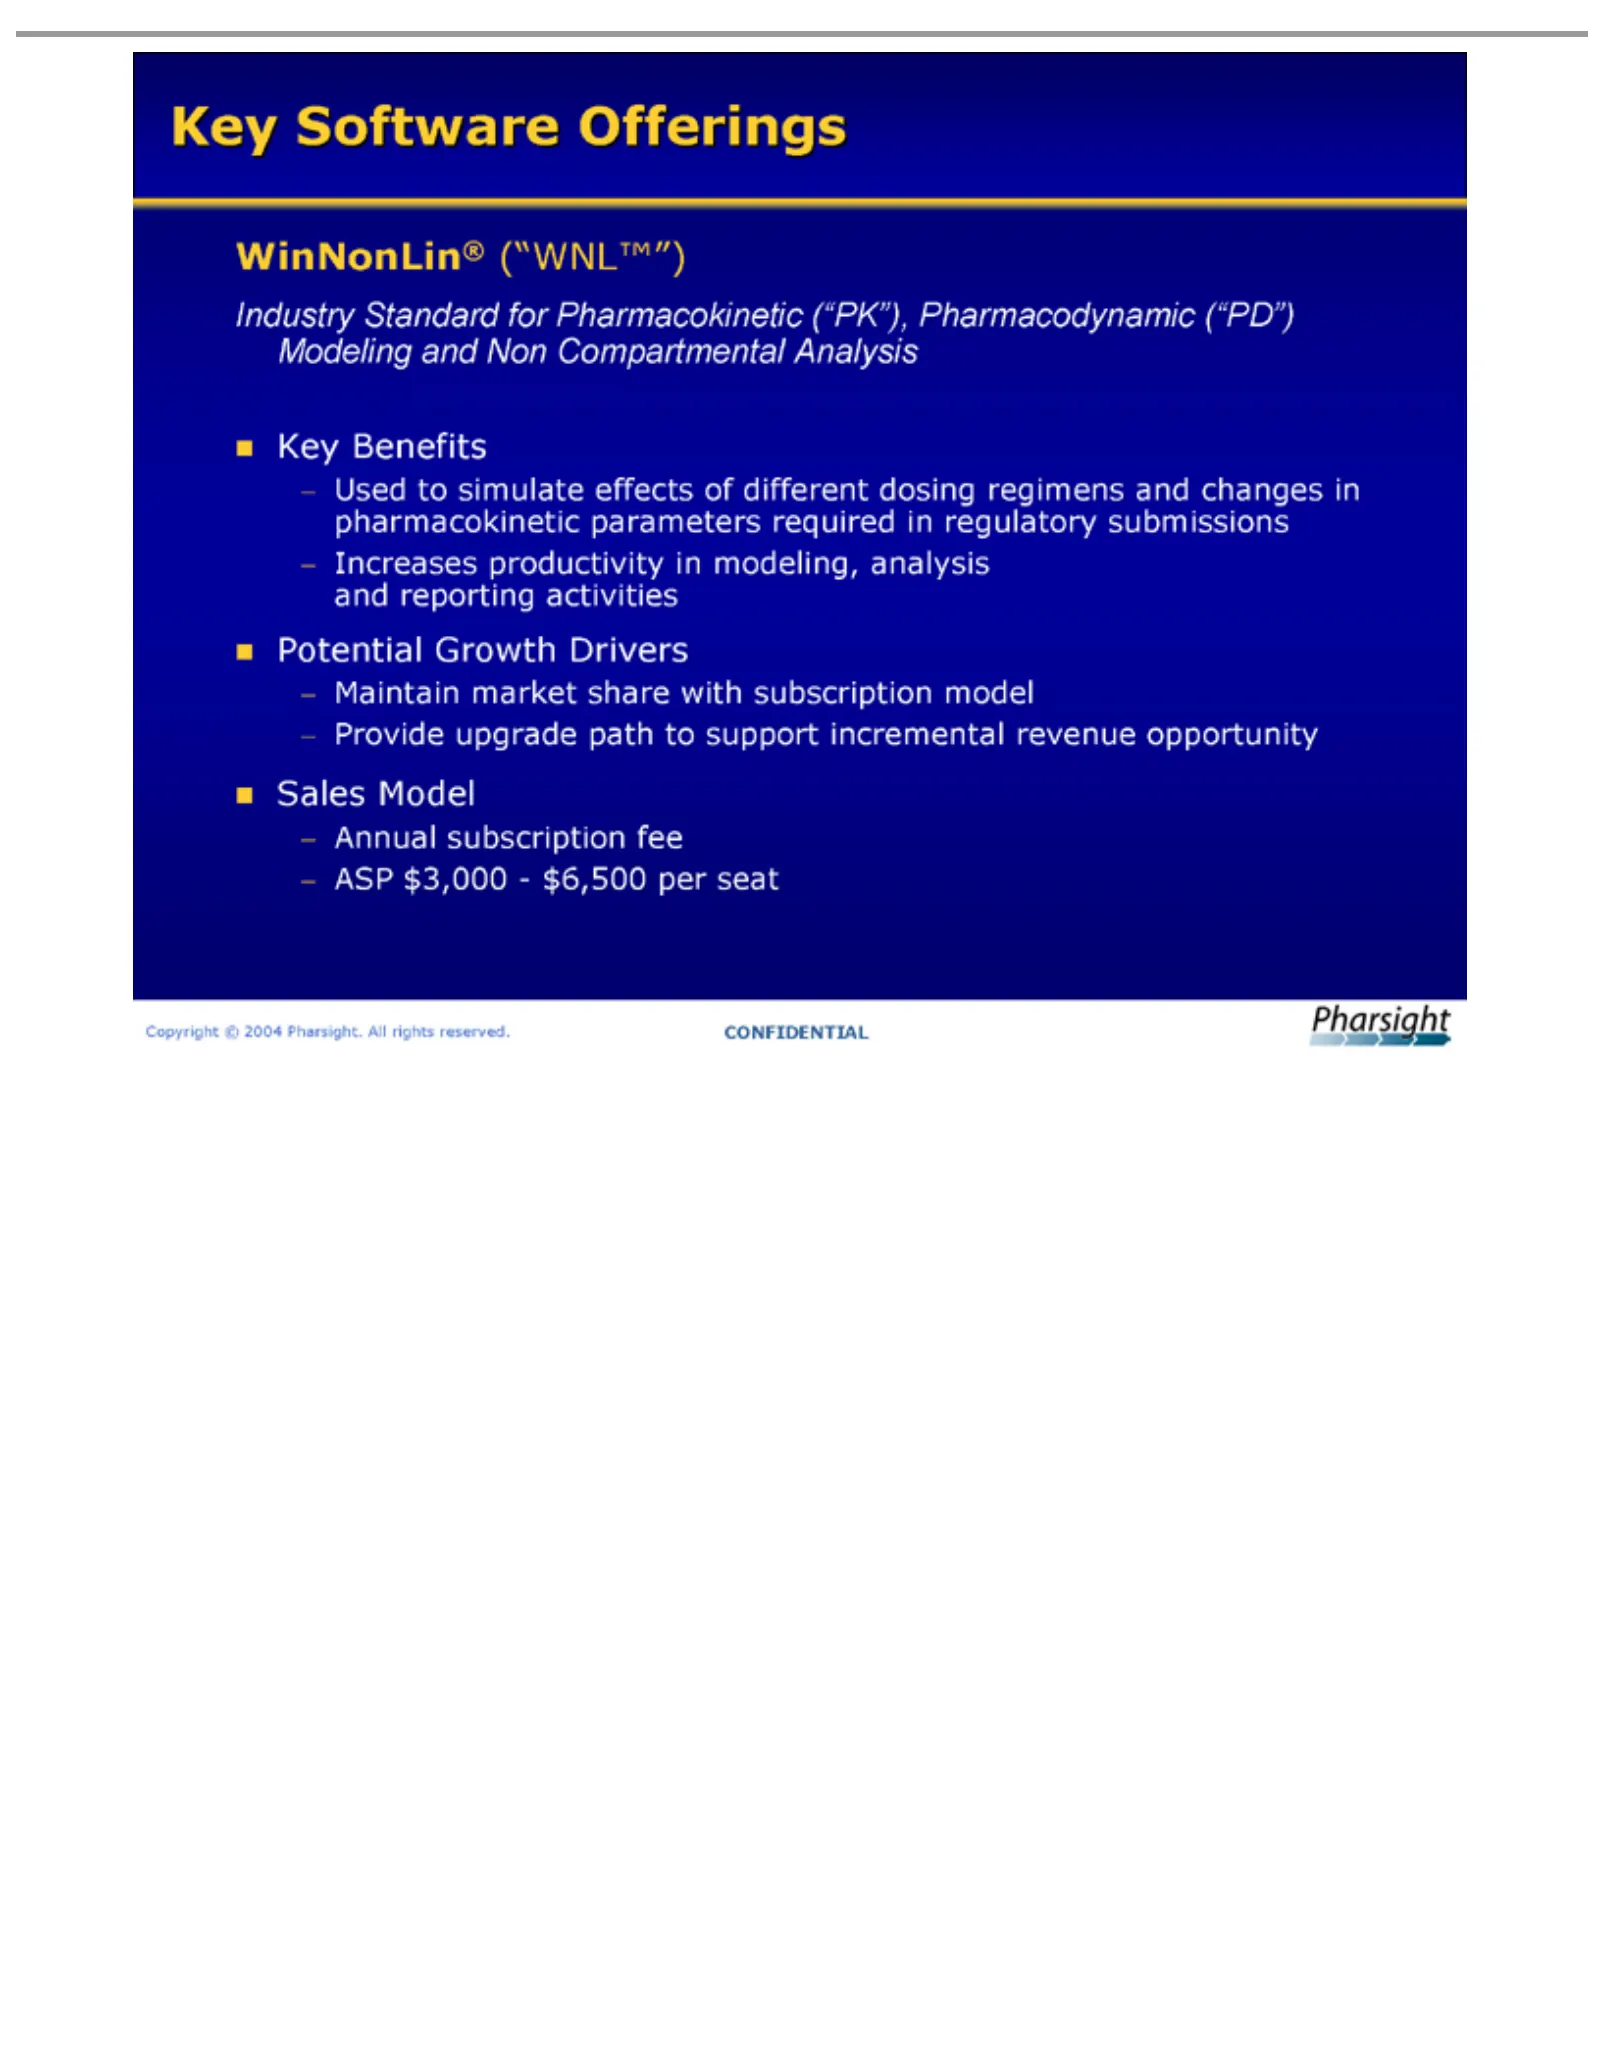
Slide 8: WinNonlin
WinNonLin® Industry Key Used pharmacokinetic Increases and ?Potential Maintain Provide ?Sales Annual ASP Copyright CONFIDENTIAL reporting Software Benefits $3,000—$6,500 toModel subscription simulate upgrade Standard market productivity Growth © 2004 activities Offerings (“WNL™”) path share paramete
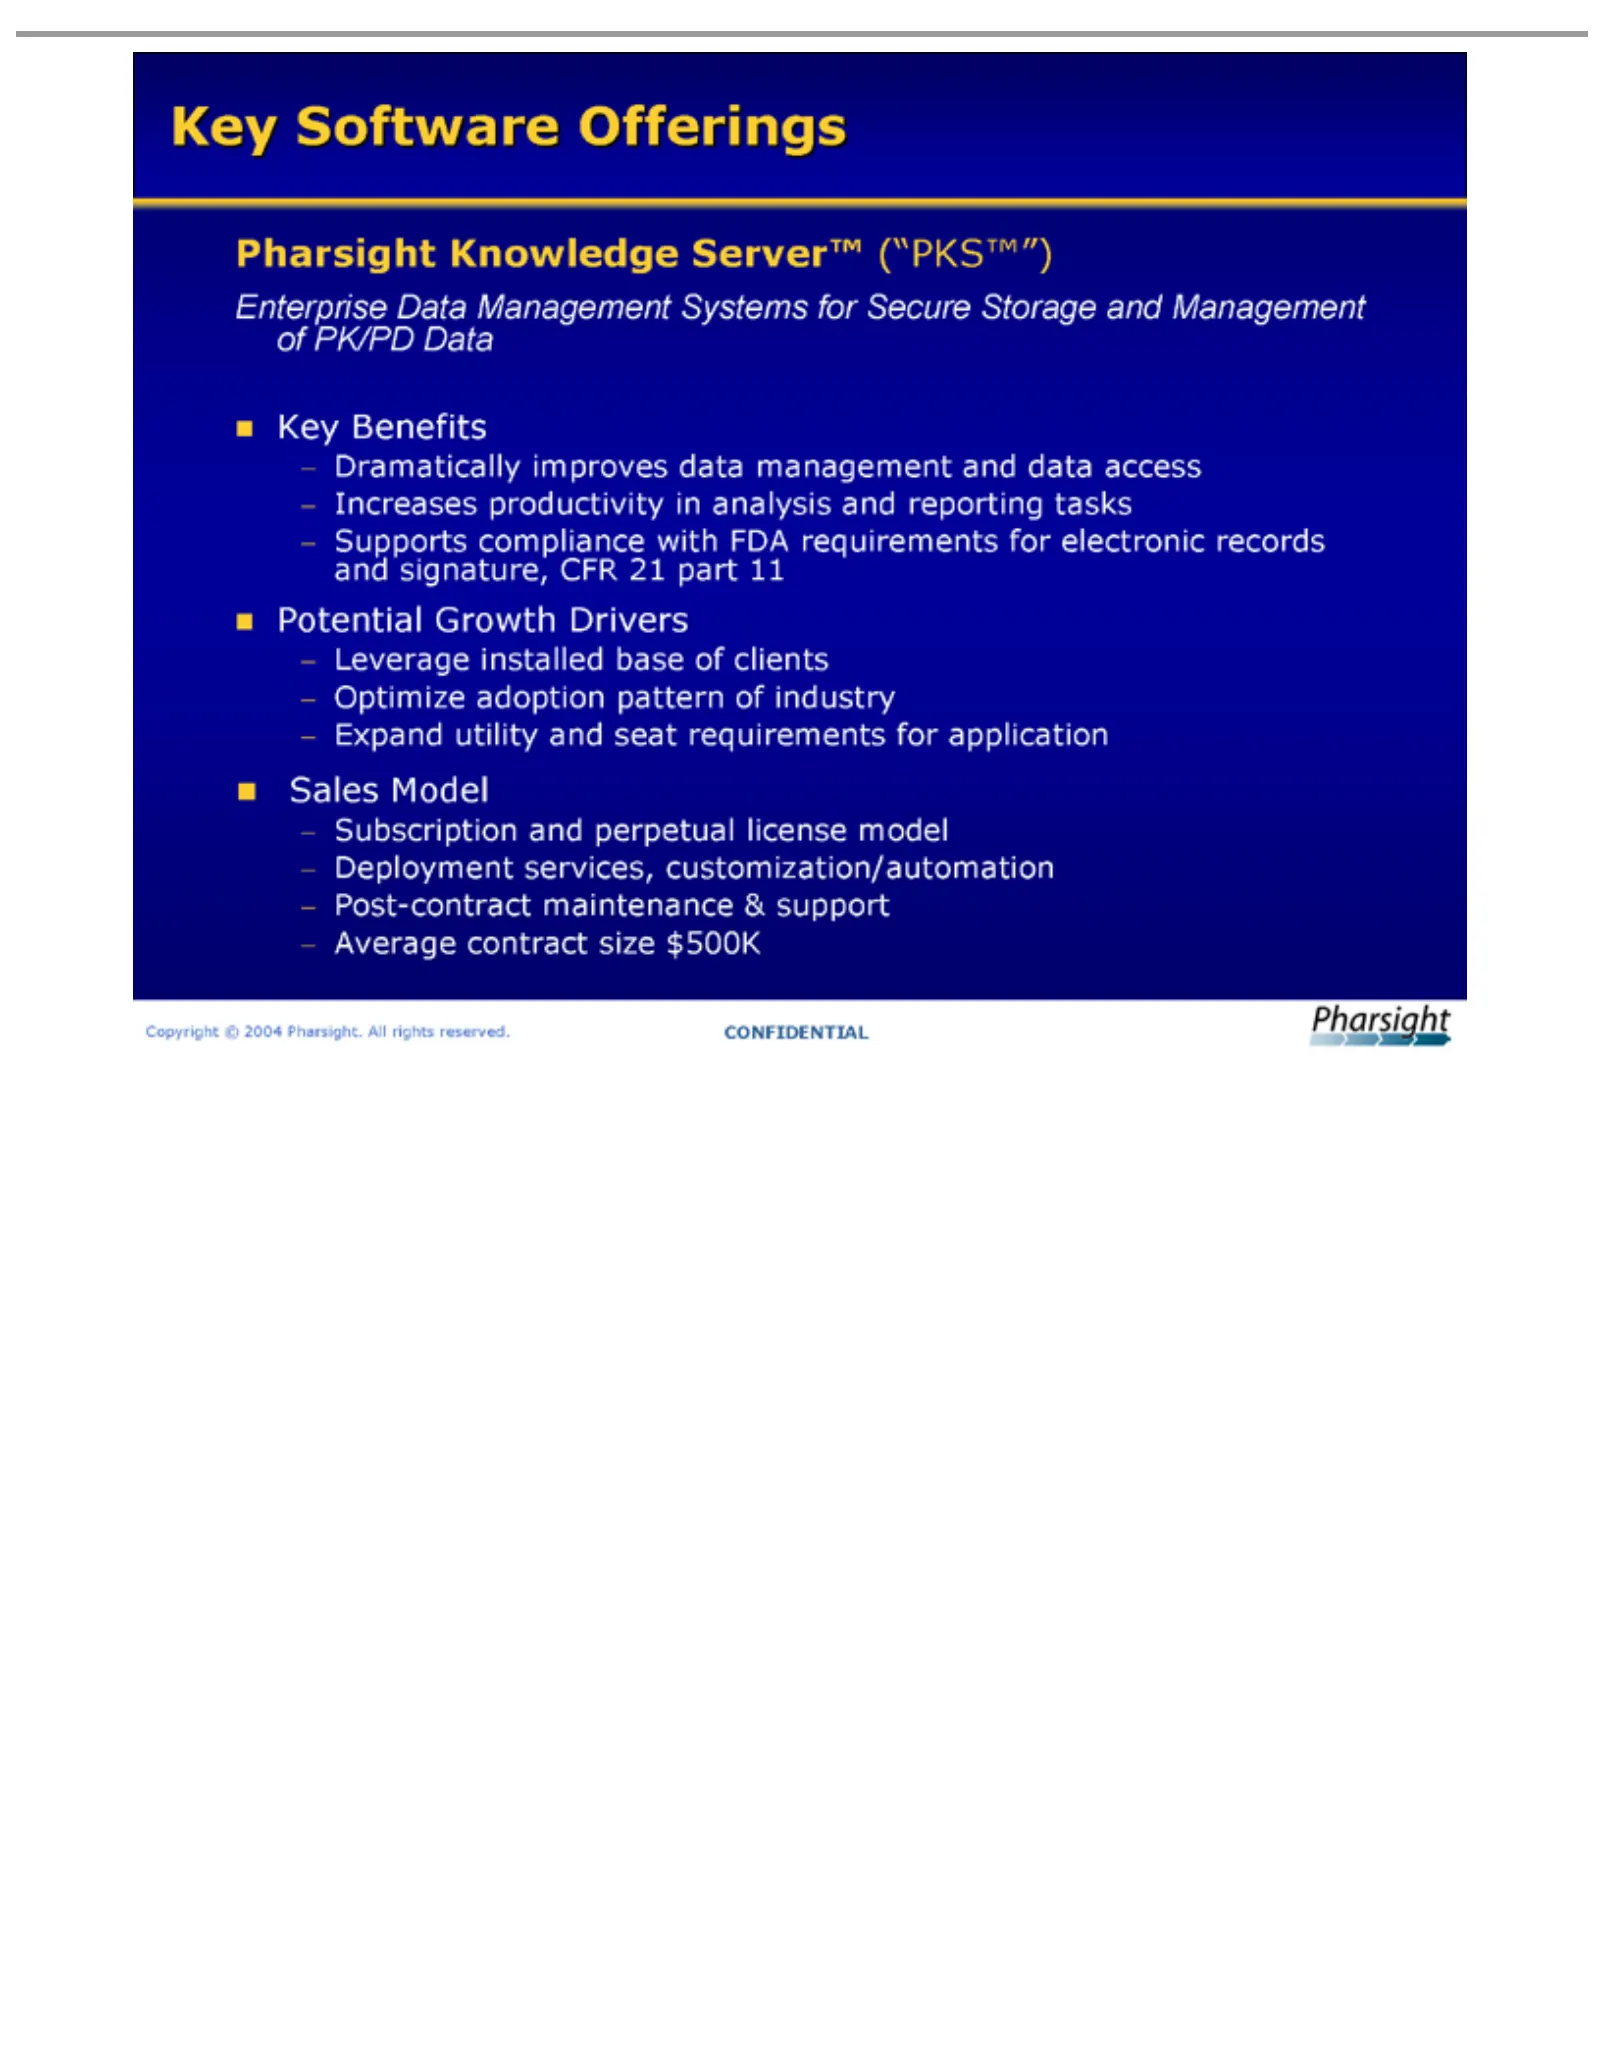
Slide 9: Pharsight Knowledgebase Server (PKS)
Pharsight Enterprise Key Dramatically Increases Supports and Potential Leverage Optimize Expand Sales Subscription Deployment Post-contract Average Copyright signature, Software Benefits Model utility contract Growth compliance installed productivity adoption Knowledge © Data services, and 2004 impr
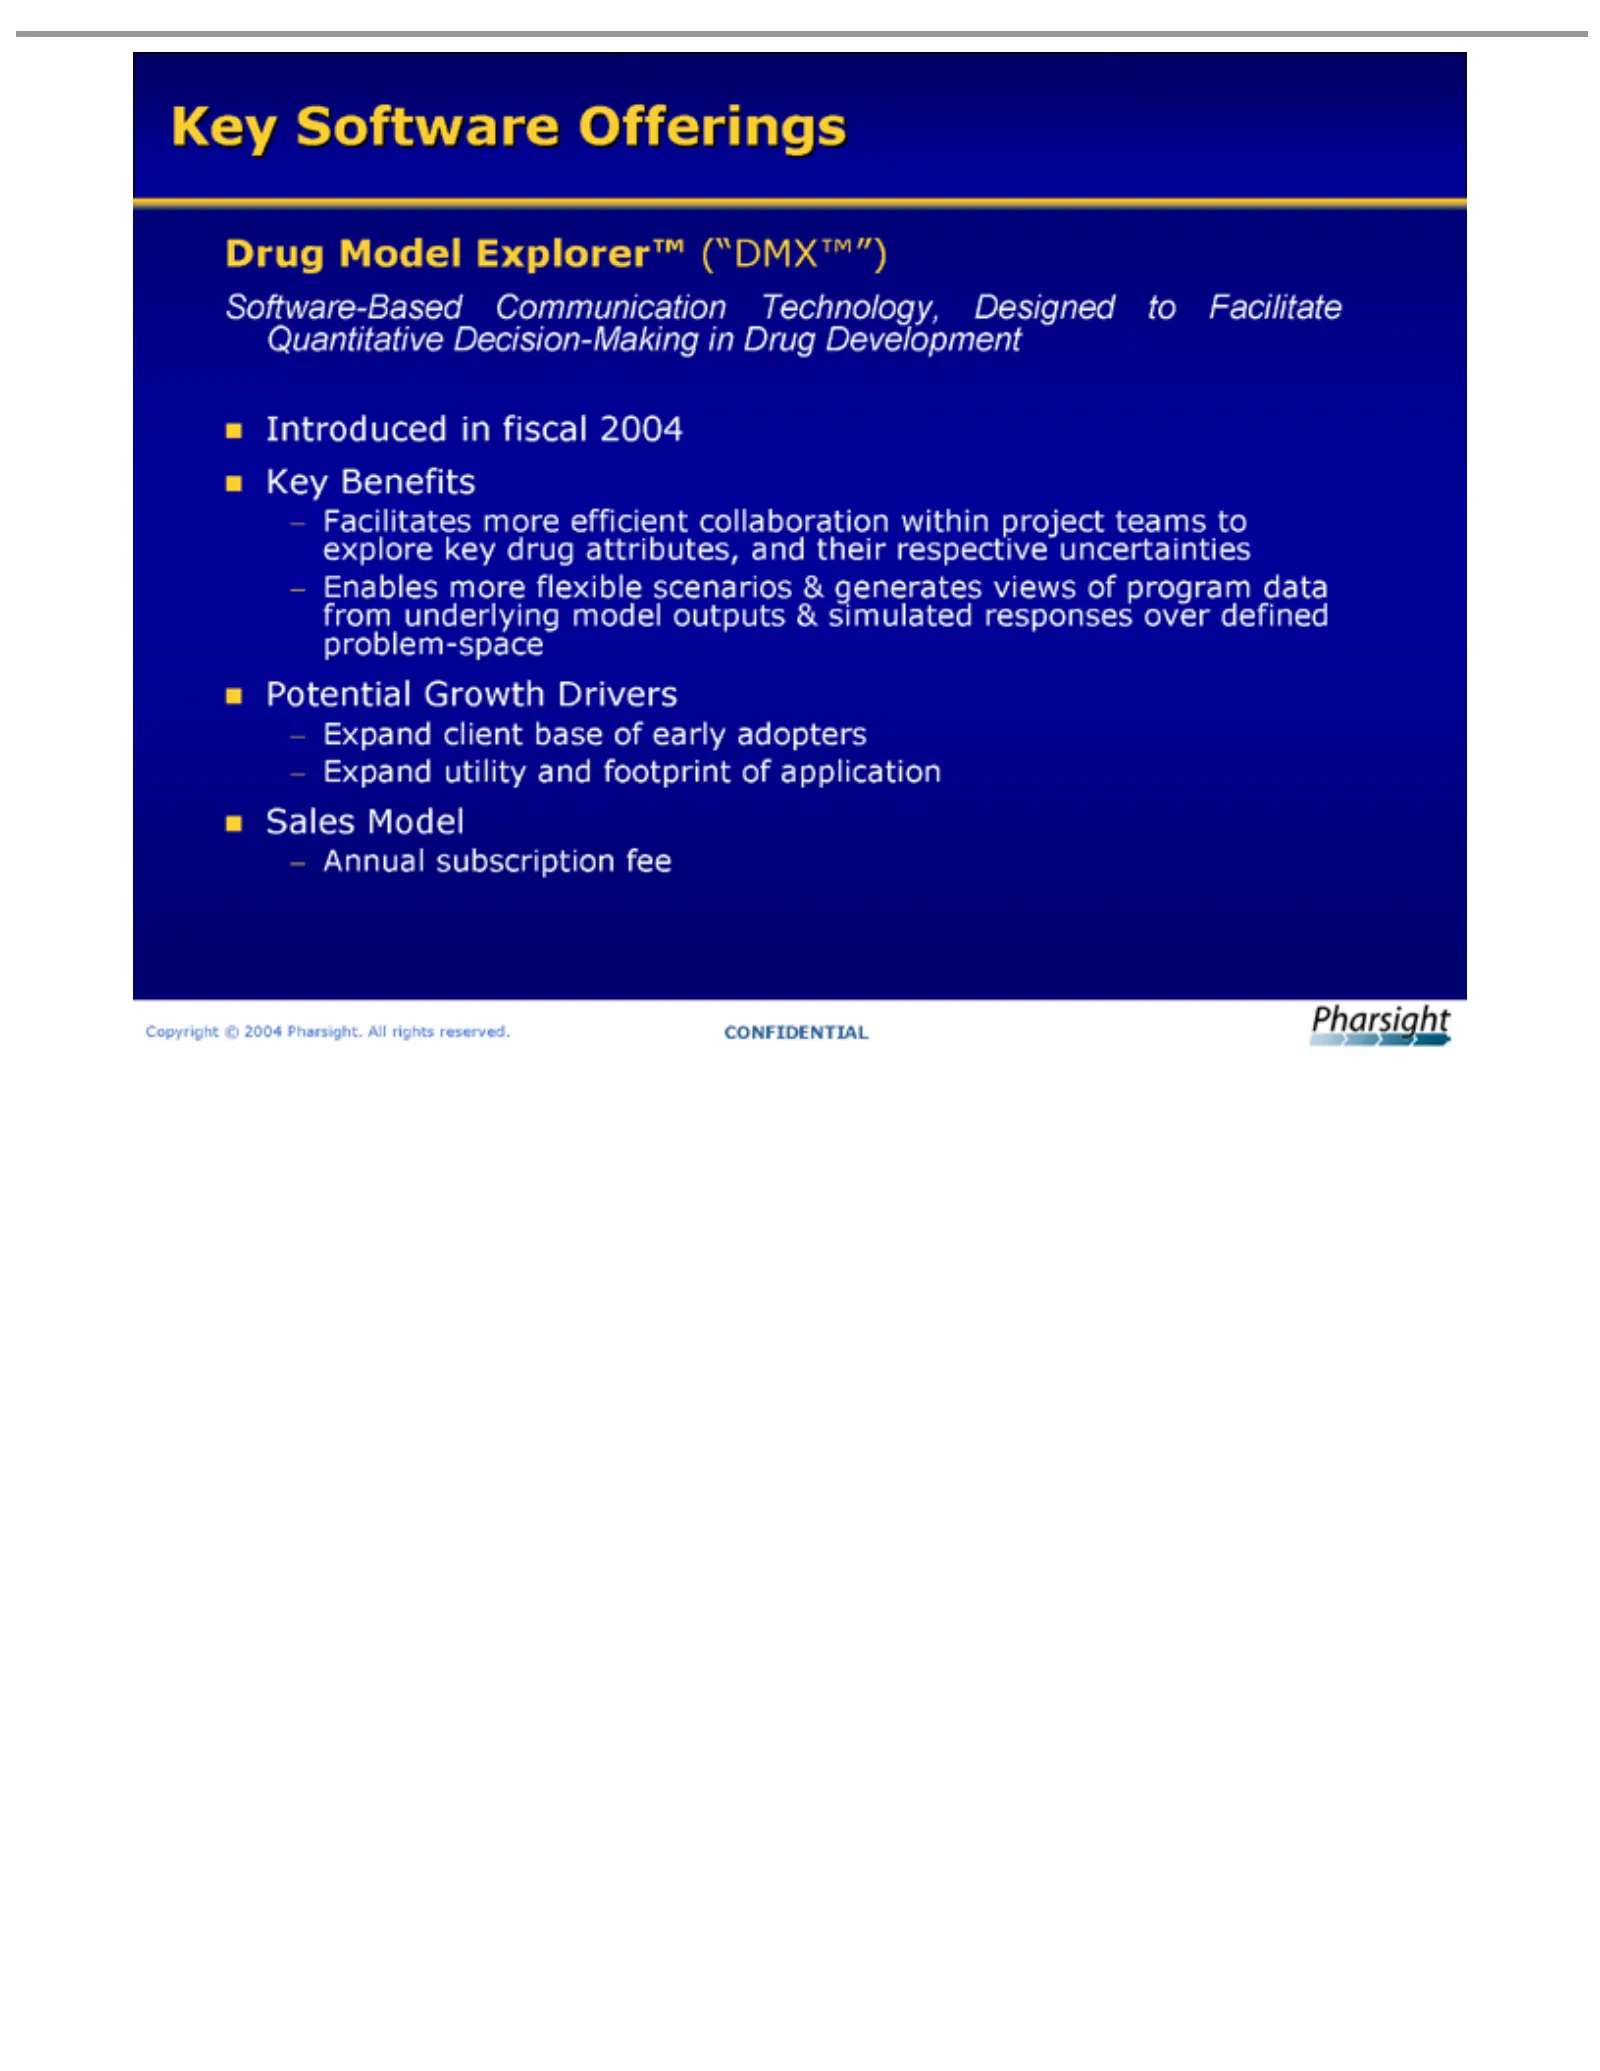
Slide 10: Drug Model Explorer (DMX)
DrugBenefits Introduced Key Facilitates Enables Potential Expand Sales Annual Copyright Software Model subscription client utility more Growth © more inExplorer™ 2004 fiscal flexible Offerings base and efficient Drivers Pharsight. footprint of 2004 fee early scenarios (“DMX™”) collaboration adopters
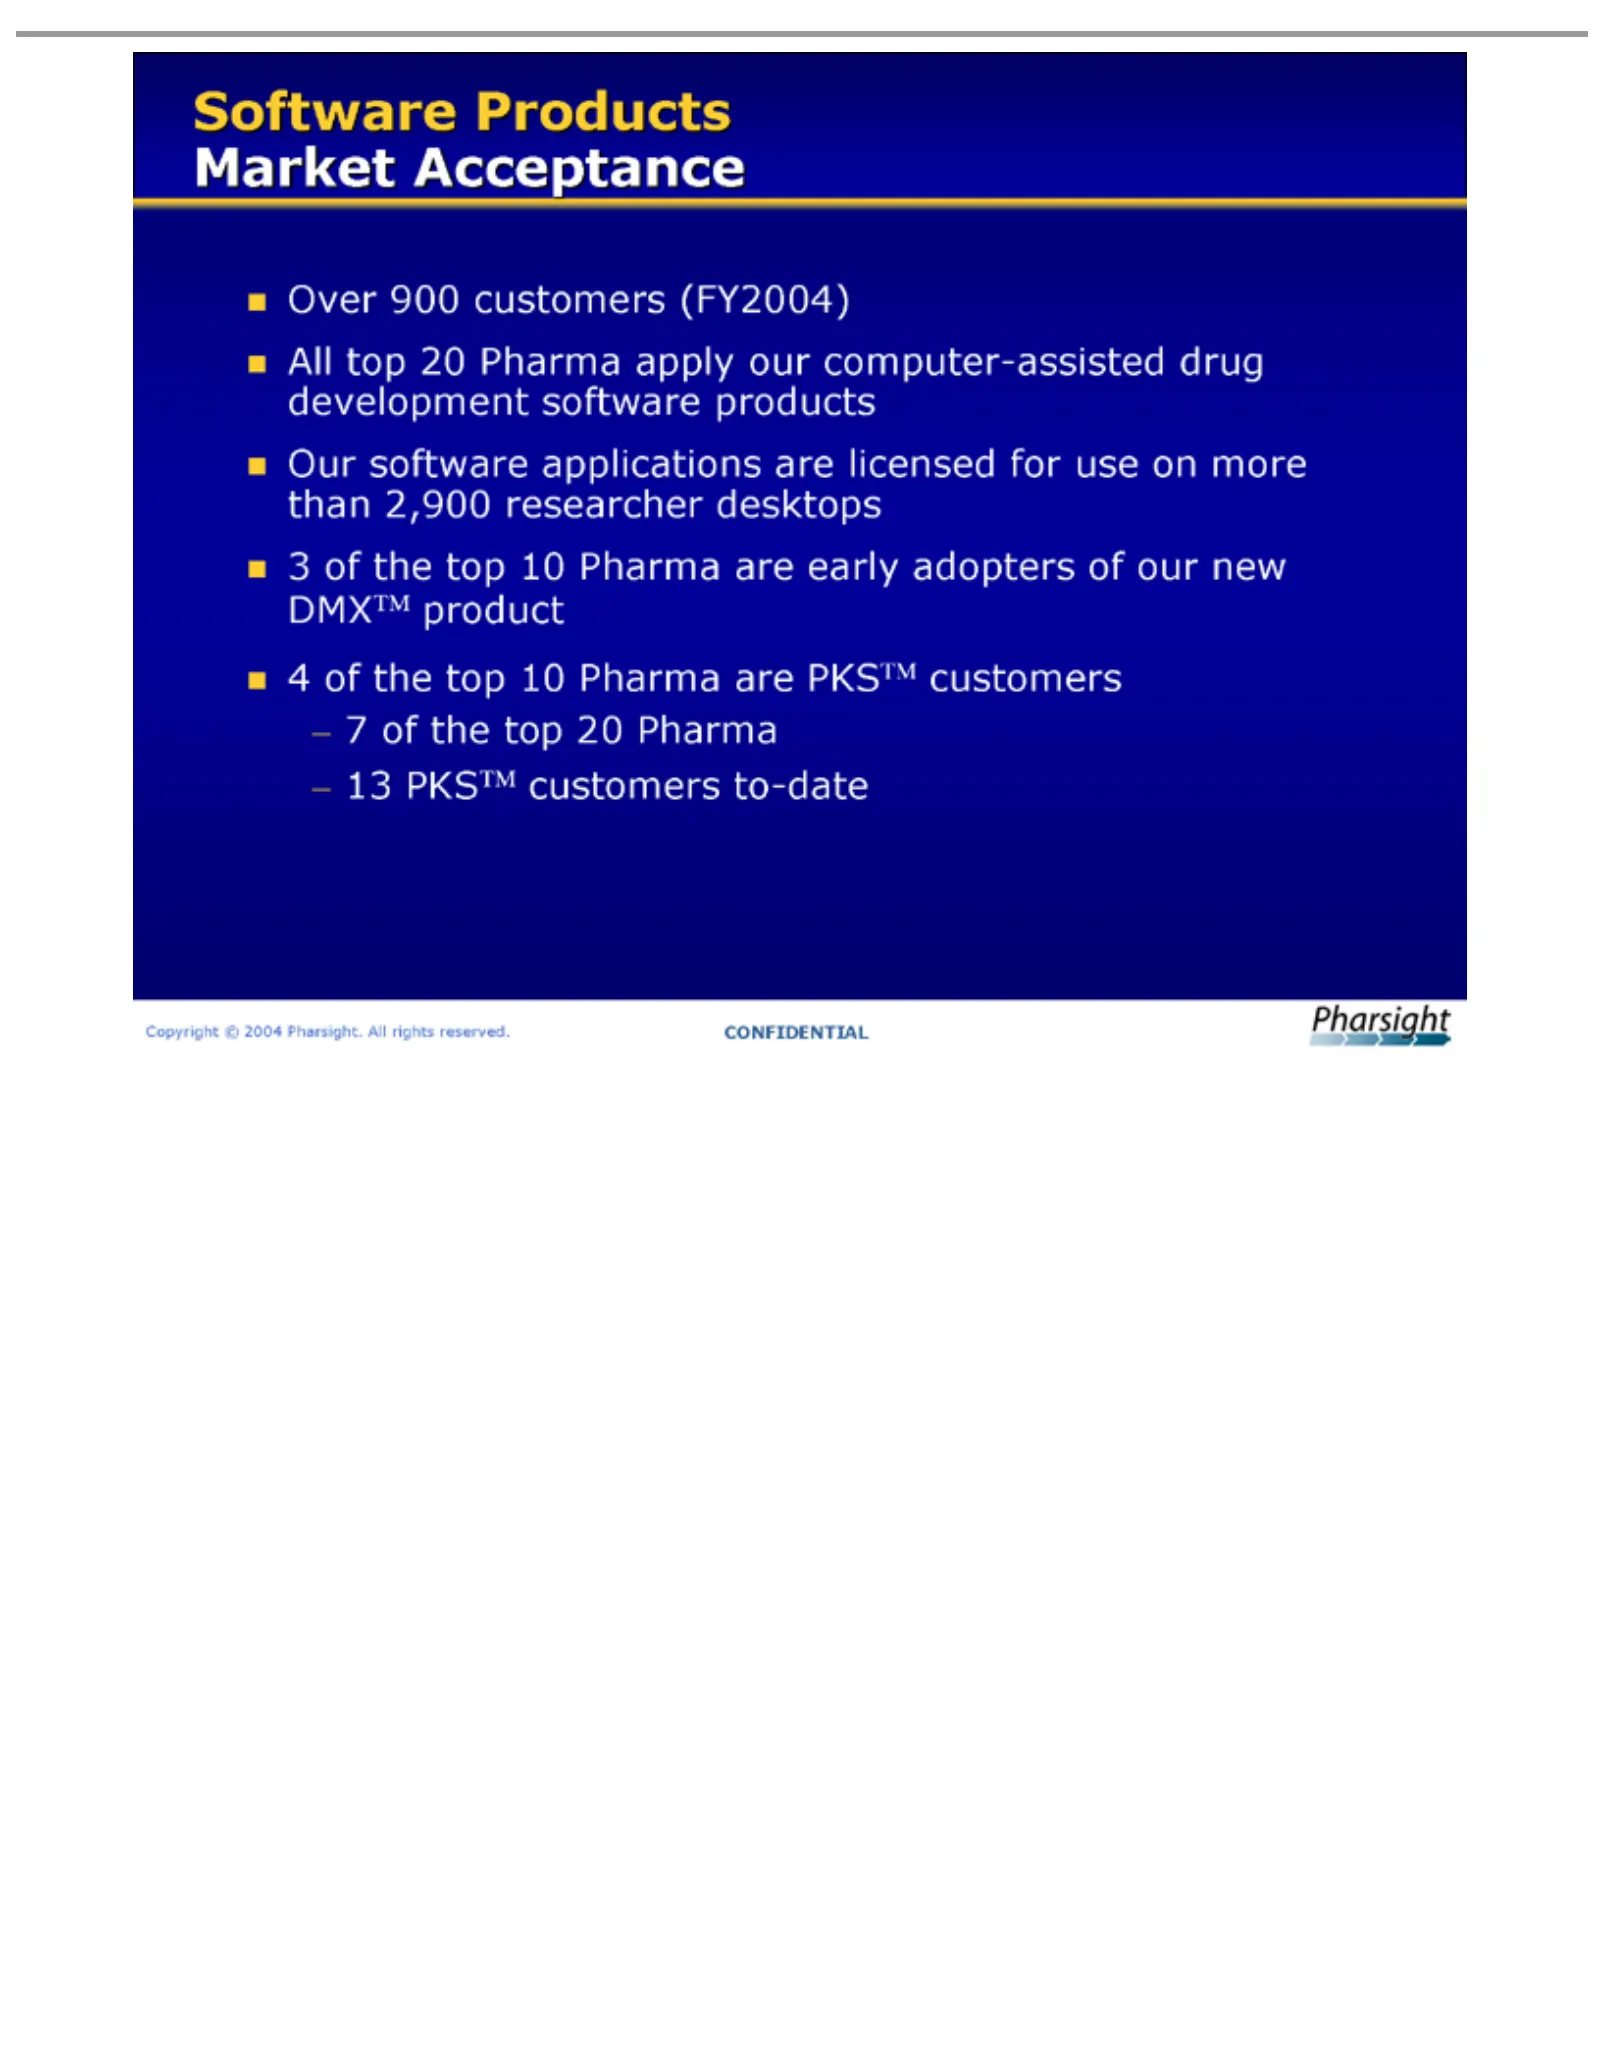
Slide 11: Software Products Market Acceptance
Software Over All Our 3 4 7 13 Copyright ofPKS top software the 90020 top customers Products customers © Pharma 10 20 2004 applications Pharma Pharsight. Market apply to-date (FY2004) are our are Acceptance early PKS computer-assisted All licensed TM adopters rights customers for reserved. of useour
Slide 12: Drug Development Consulting Services
Drug Development Copyright © 2004 Pharsight. ConsultingAllServices rights reserved.
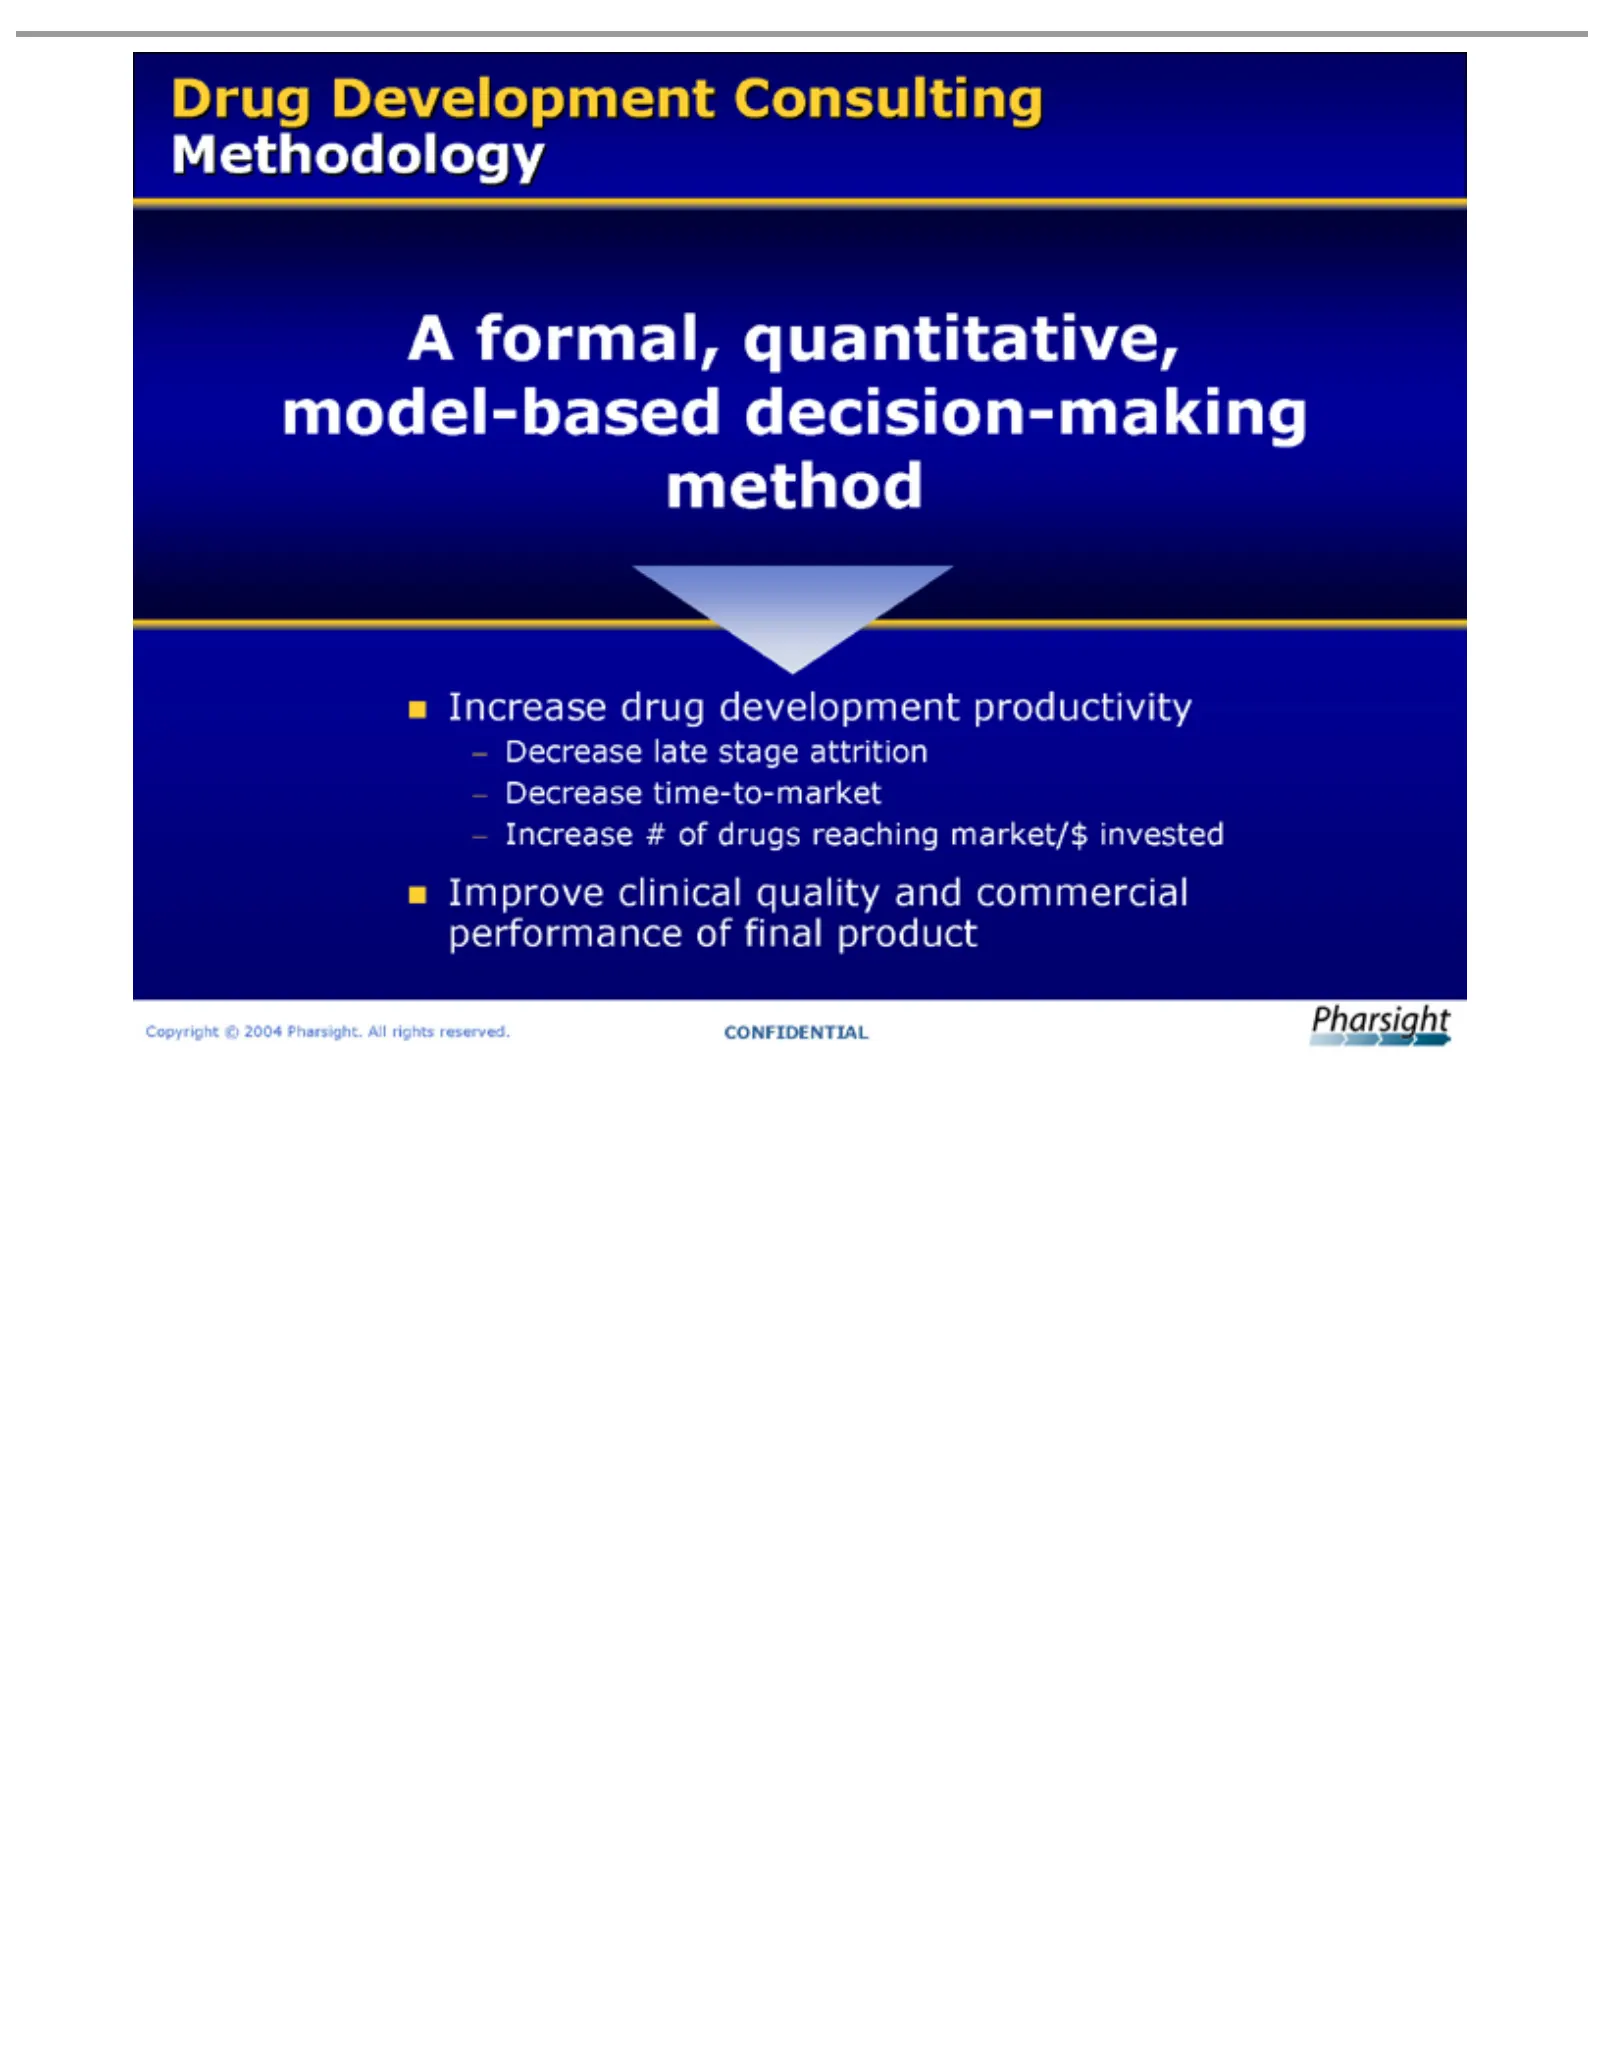
Slide 13: Consulting Methodology
Drug A Decrease Increase Improve Copyright formal, Development drug # clinical late time-to-market quantitative, ©of 2004 drugs stage development quality Pharsight. reaching attrition Consulting model-based andproductivity commercial market/$ AllMethodology rights decision-making invested reserved.
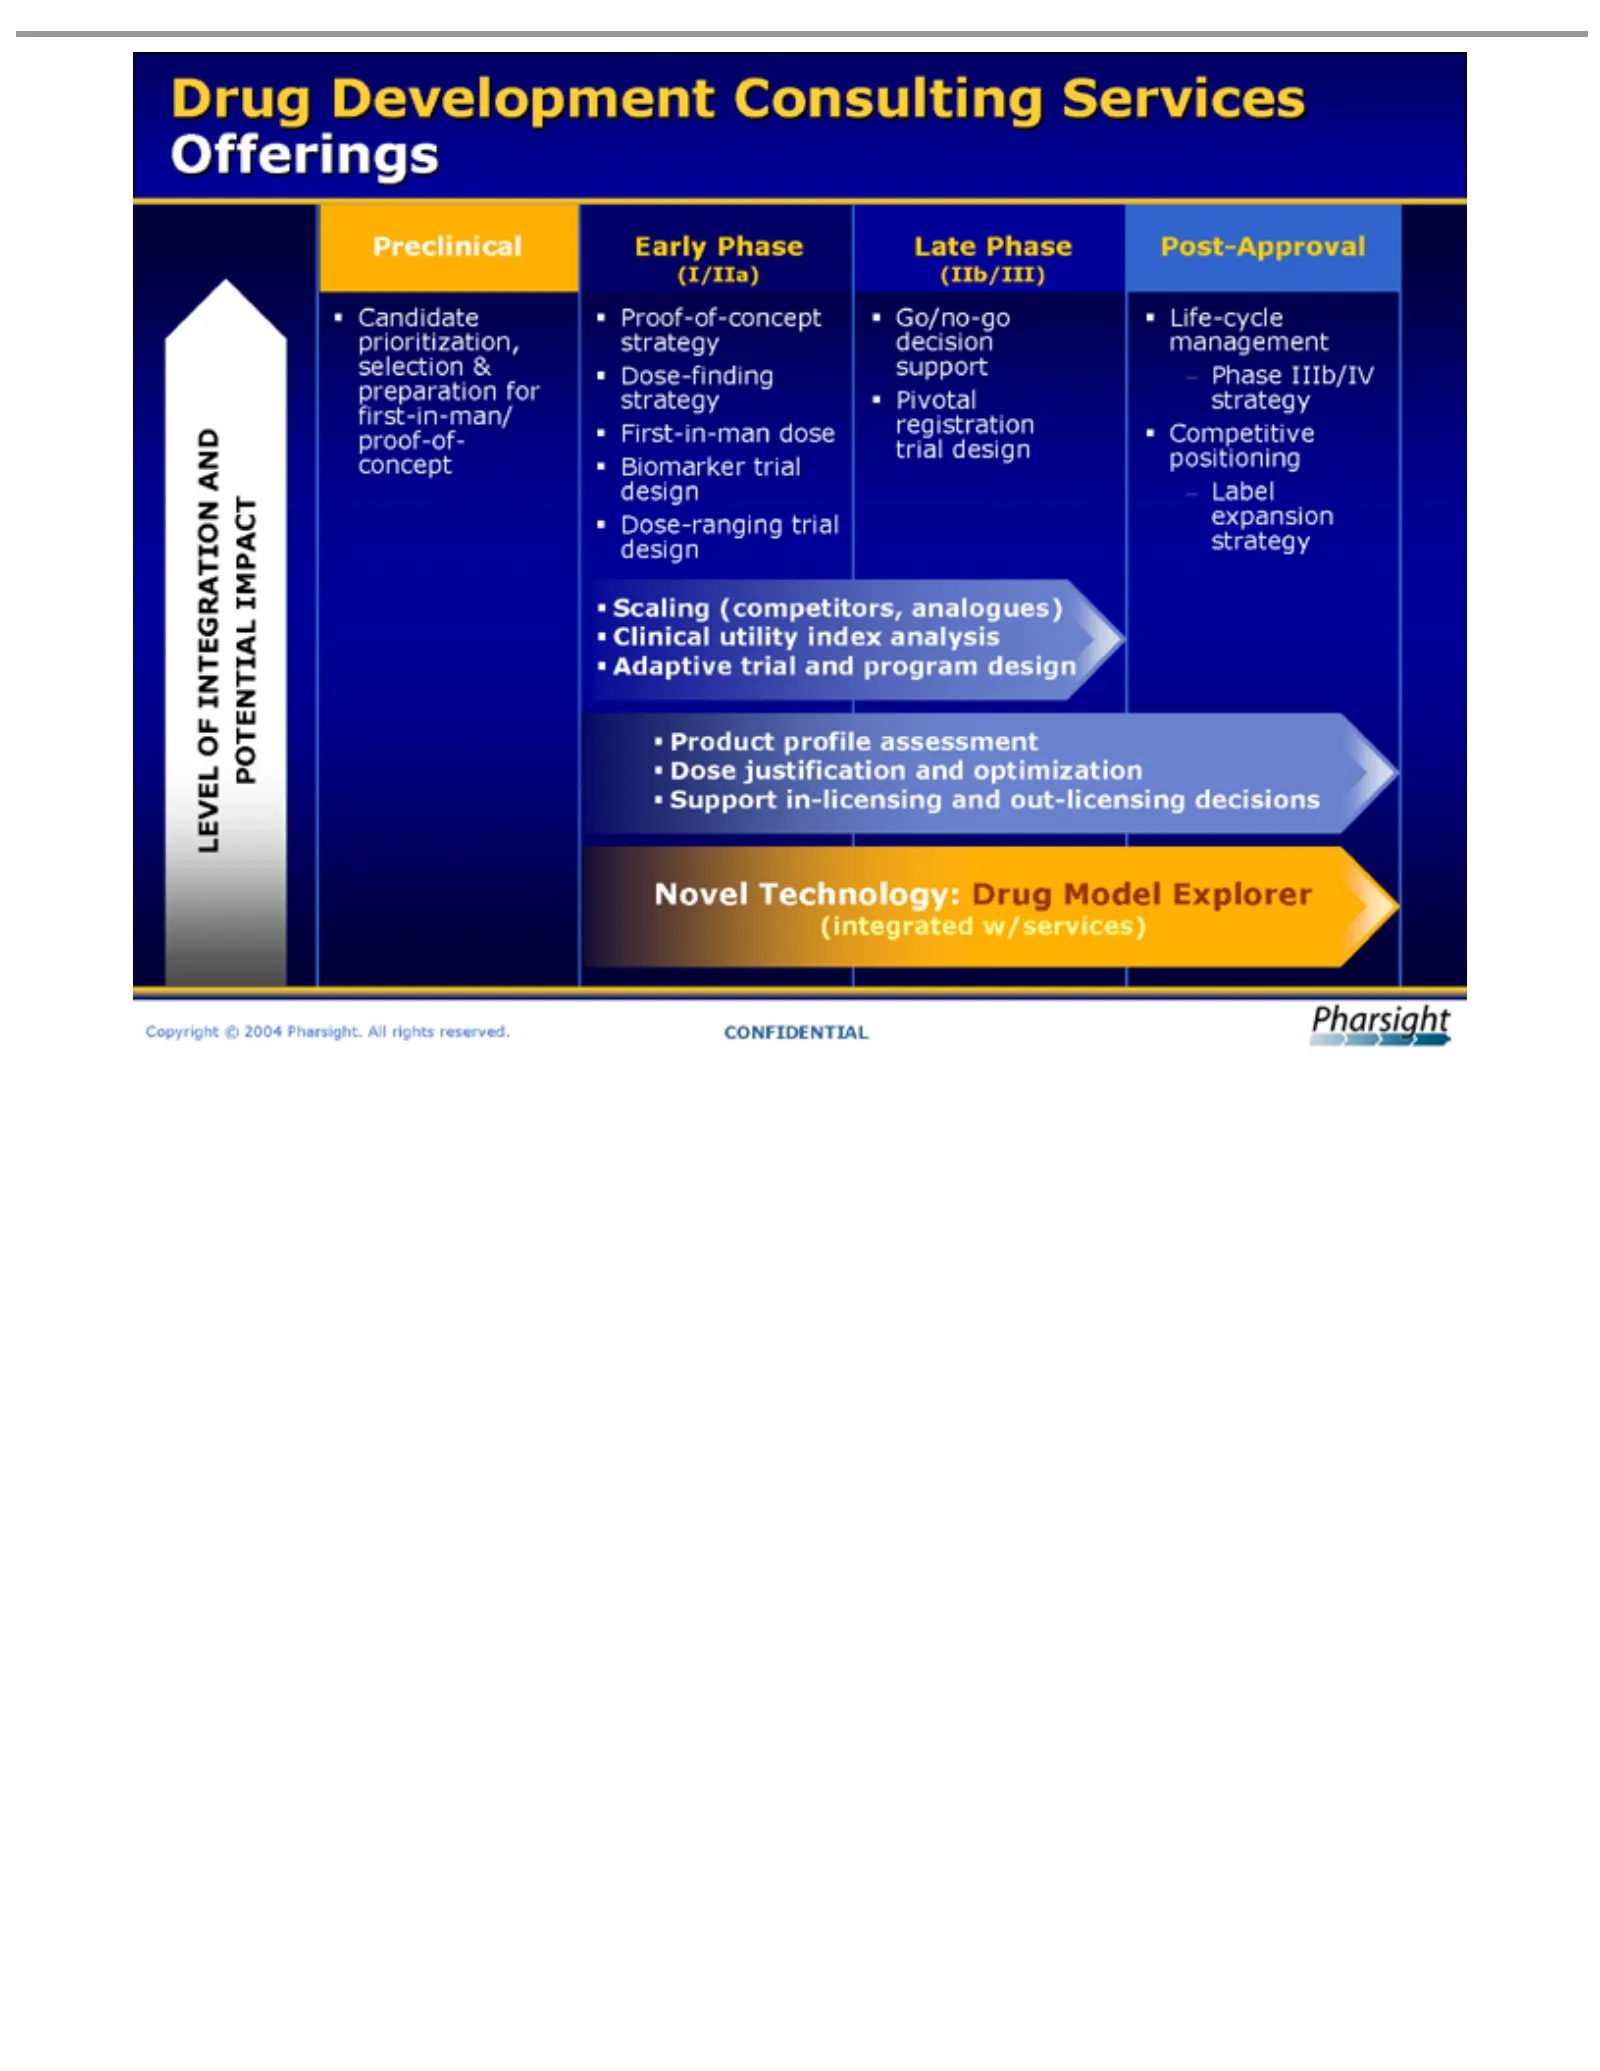
Slide 14: Consulting Services Offerings by Development Phase
DrugPhase LEVEL POTENTIAL ?Candidate Preclinical Early Proof-of-concept (I/IIa) Dose-finding First-in-man Biomarker Dose-ranging Late Go/no-go (IIb/III) Life-cycle Post-Approval Phase Label Scaling Clinical Adaptive Product Dose Support Novel (integrated Copyright Development justification Phase exp
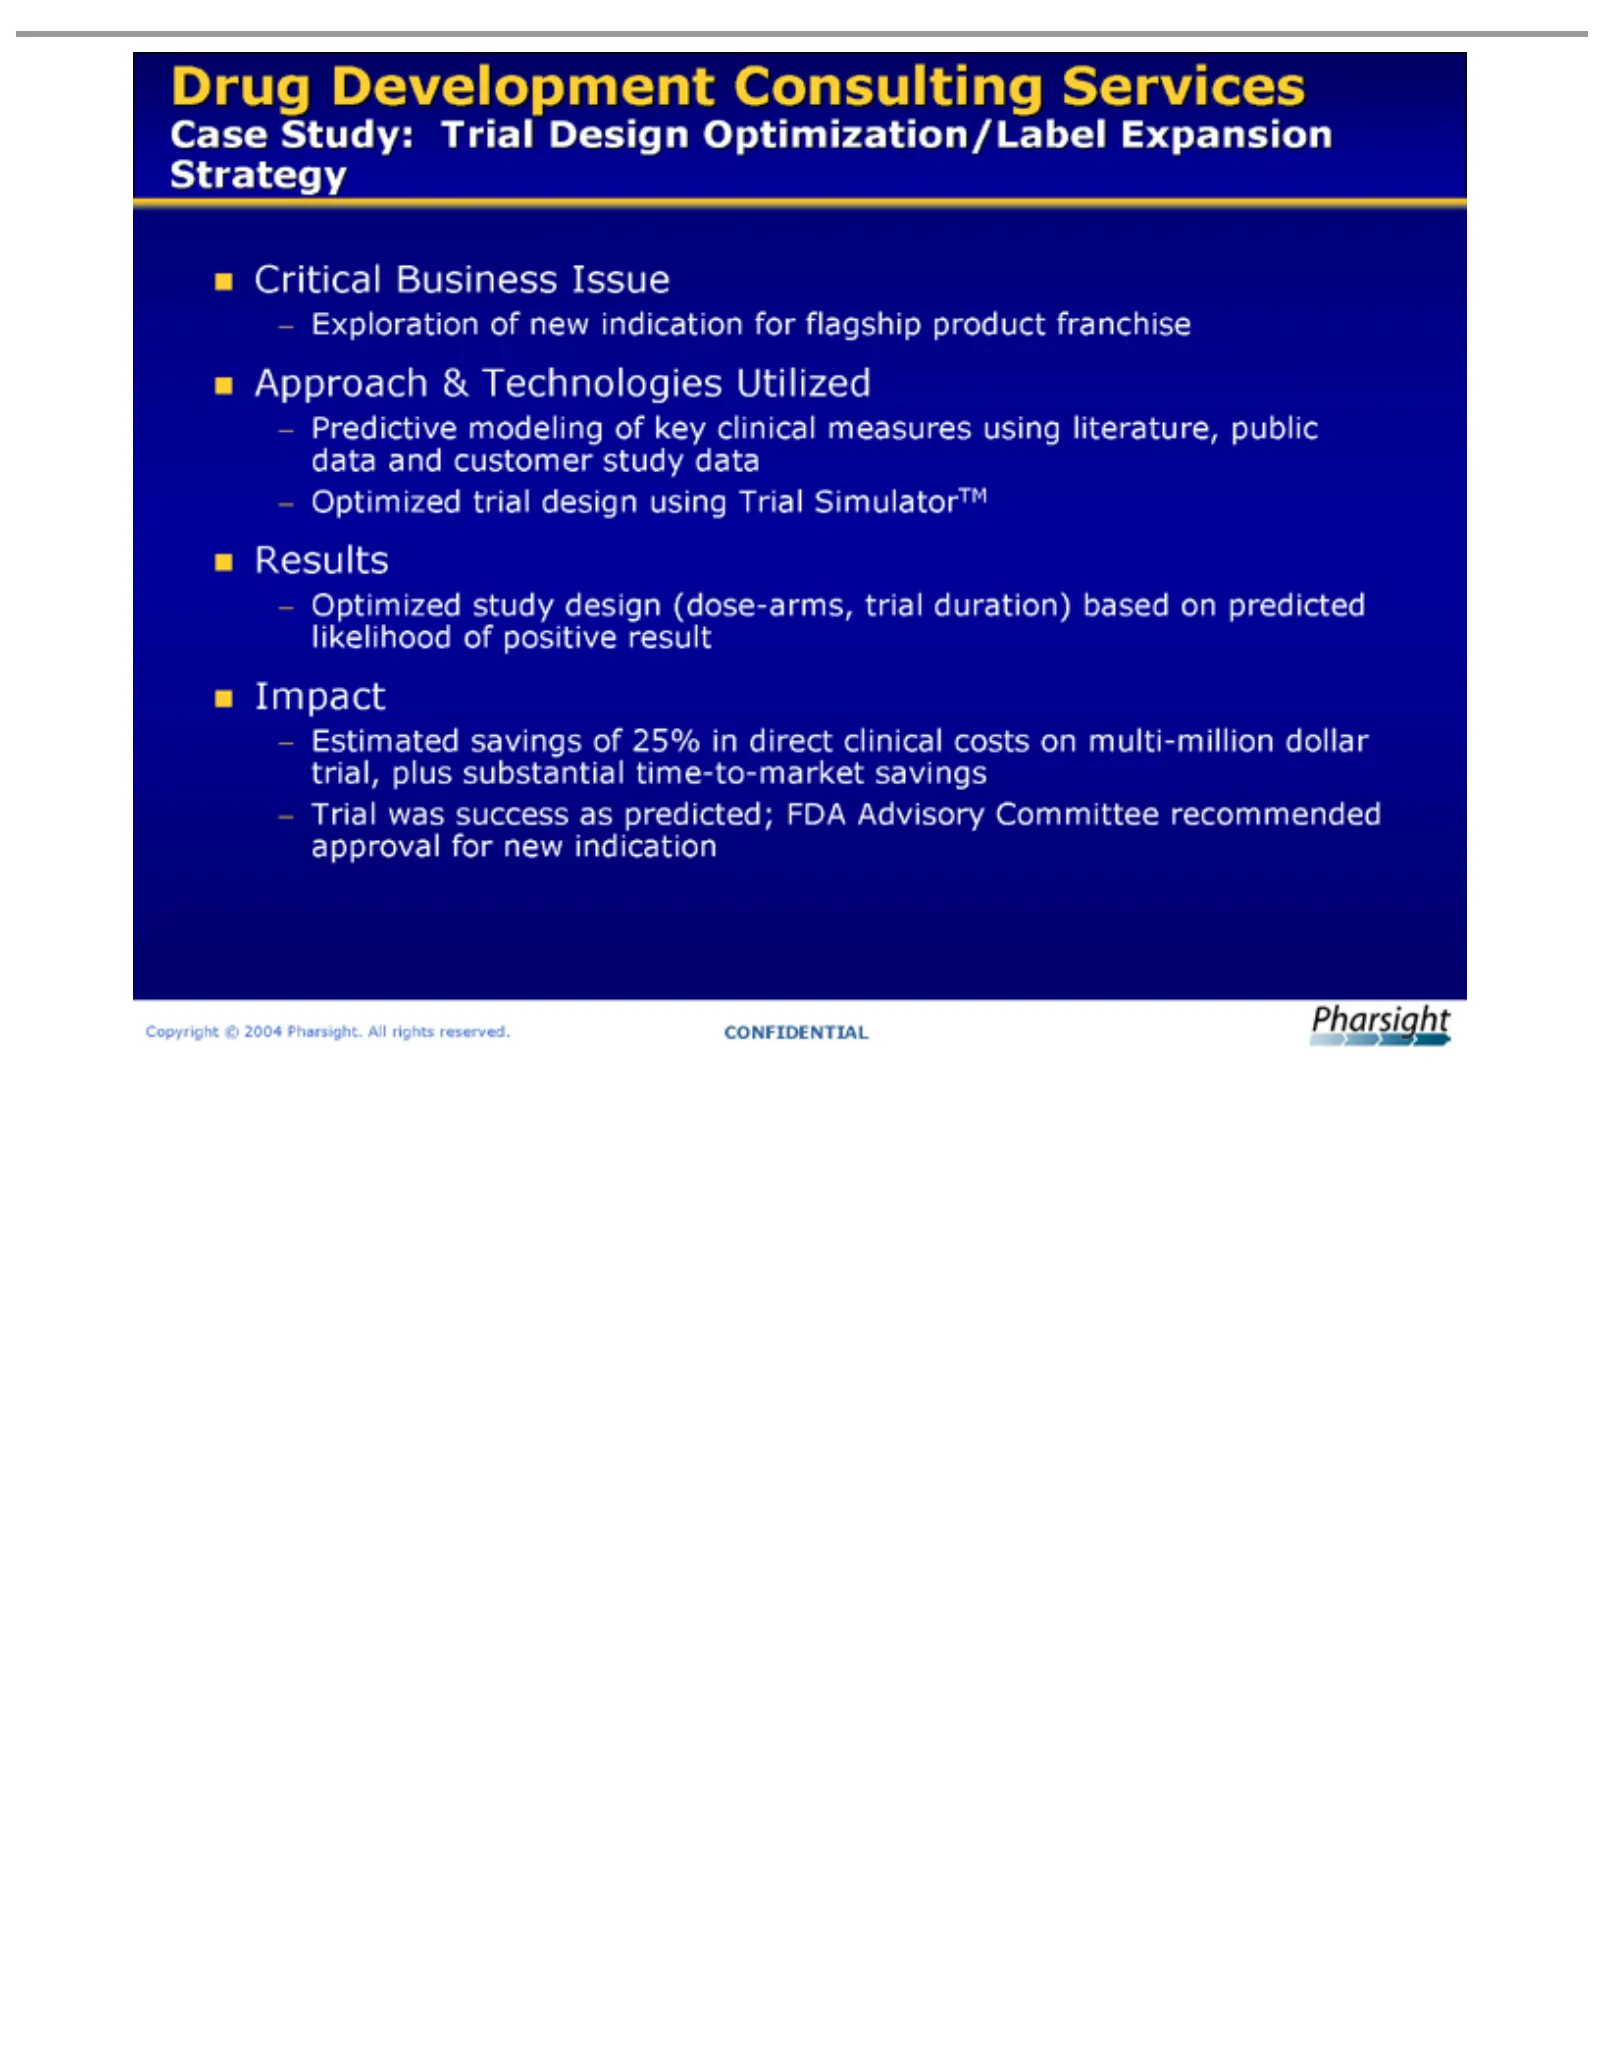
Slide 15: Case Study: Trial Design Optimization
Drug was Case Critical Exploration Approach Predictive Optimized Results Estimated Impact Trial approval Copyright Study: Development Business for success & savings modeling ©trial study of Trial new Technologies 2004 new design design Issue indication Design as of Pharsight. Consulting indication p
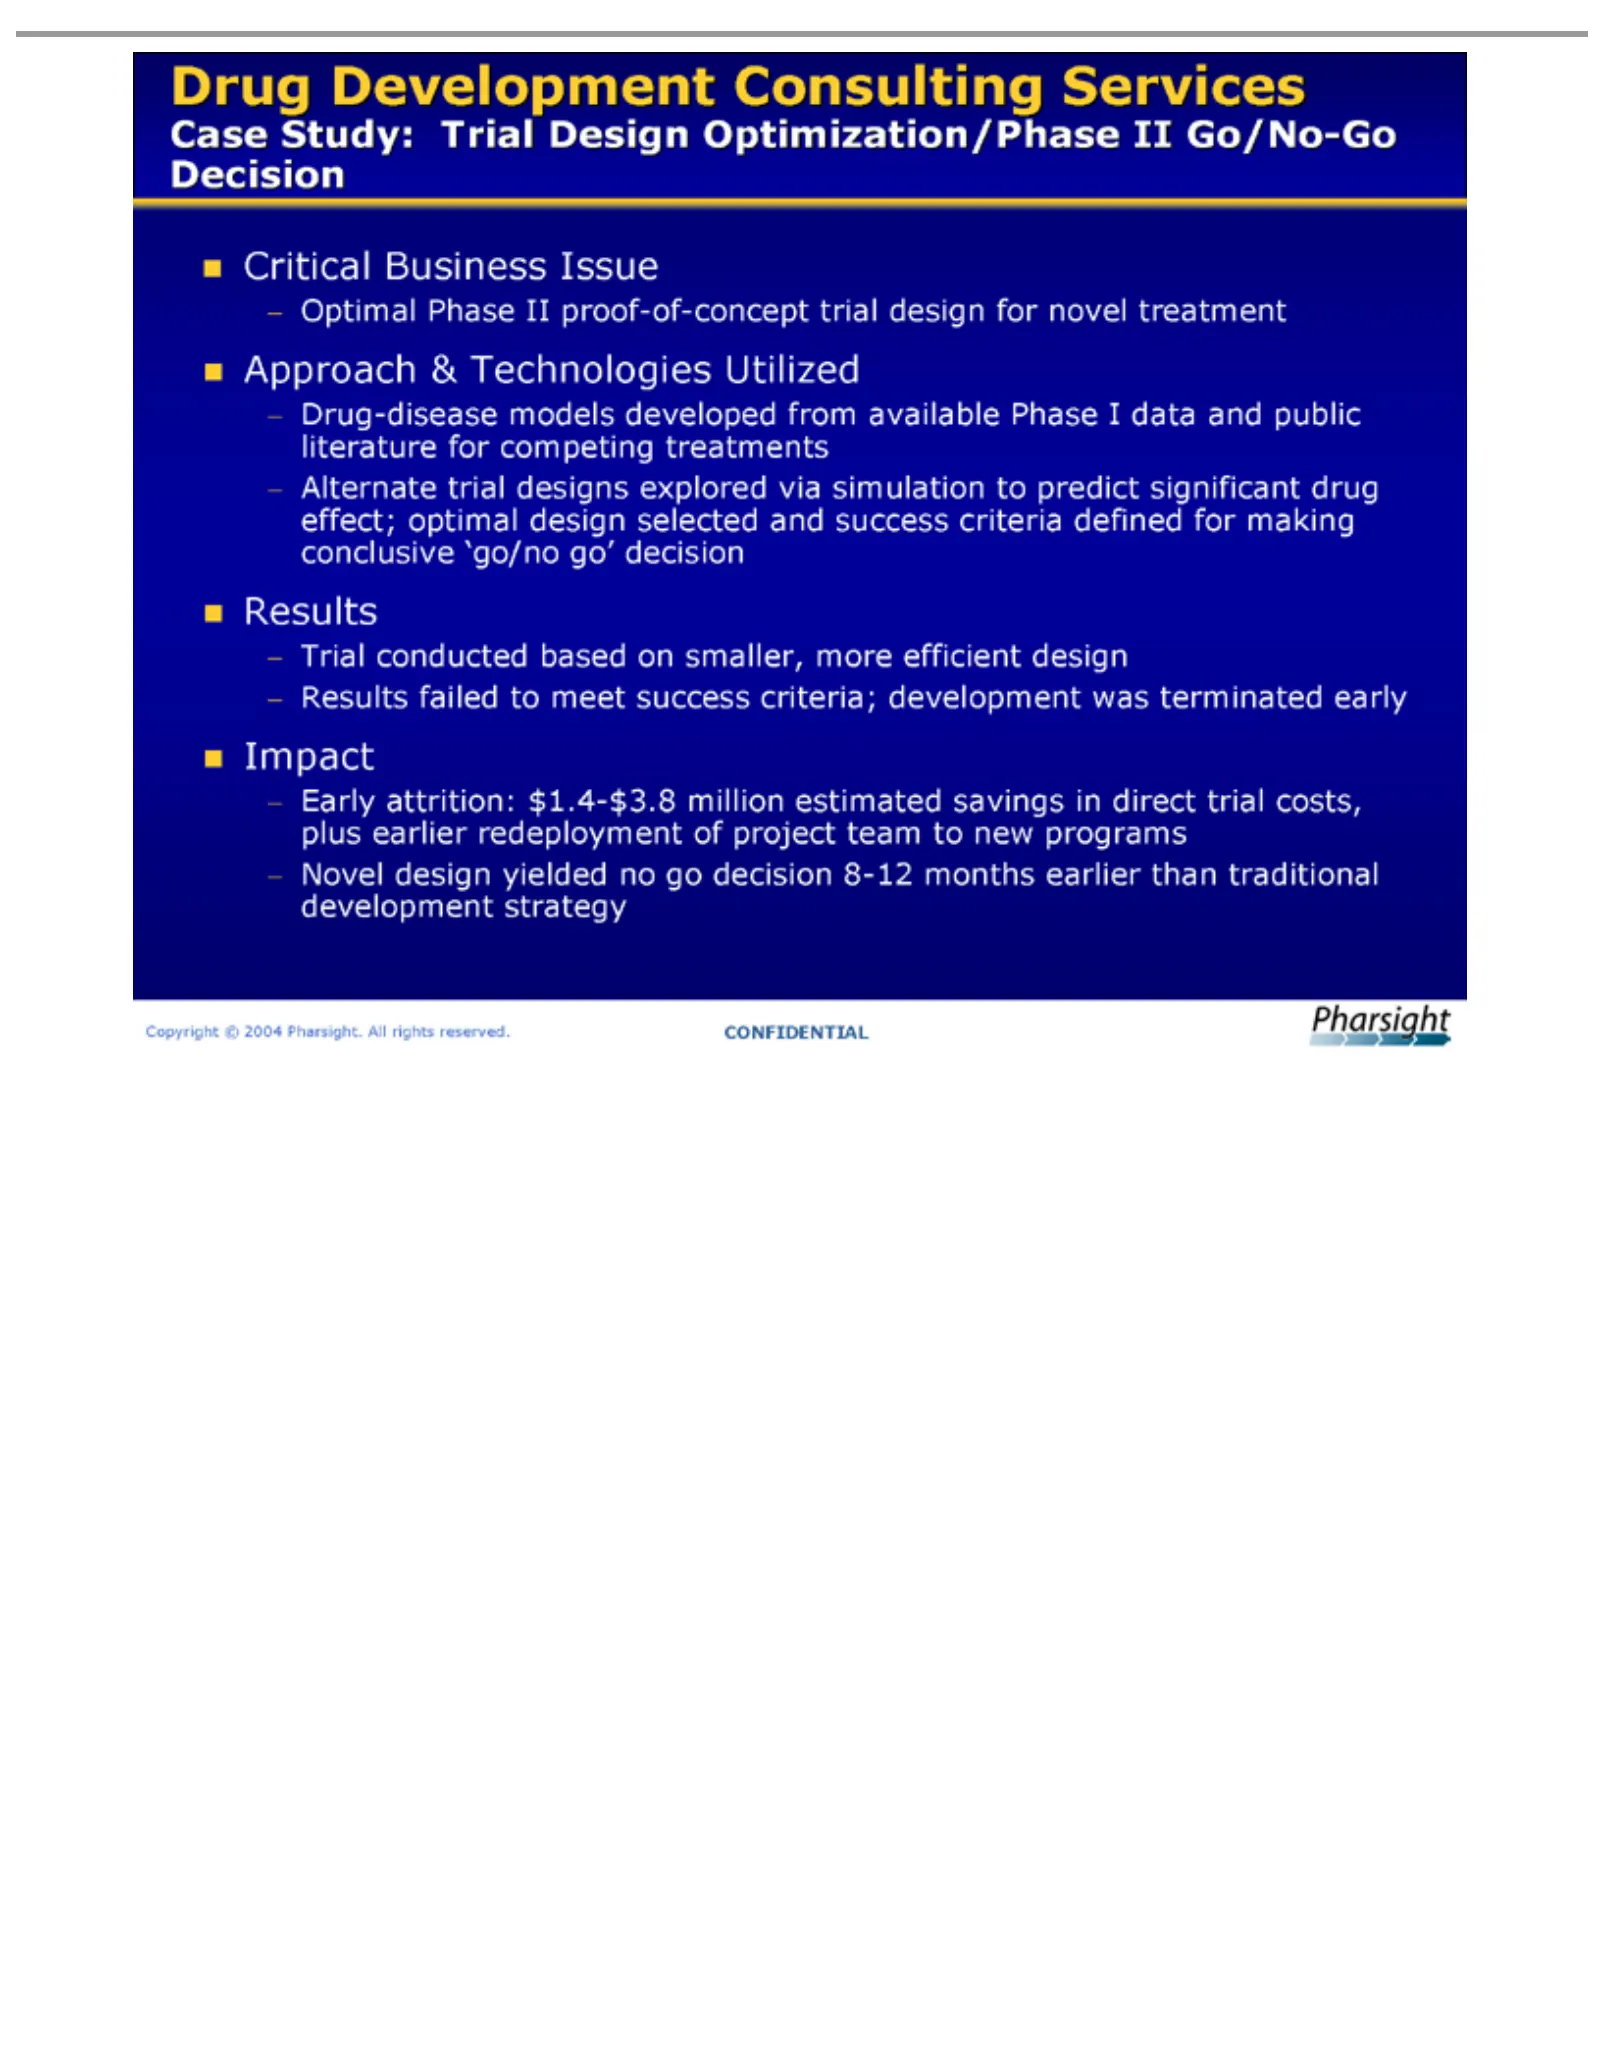
Slide 16: Case Study: Phase II Go/No-Go Decision
Drug conducted Case Critical Optimal ??Approach Drug-disease Alternate conclusive Trial ??Results Results Early ??Impact Novel Copyright Study: Development attrition: design failed Business Phase trial ©‘go/no Trial &2004 models yielded to designs Technologies $1.4-$3.8 IIbased meet proof-of-concept
Slide 17: Case Study: Program Decision Support
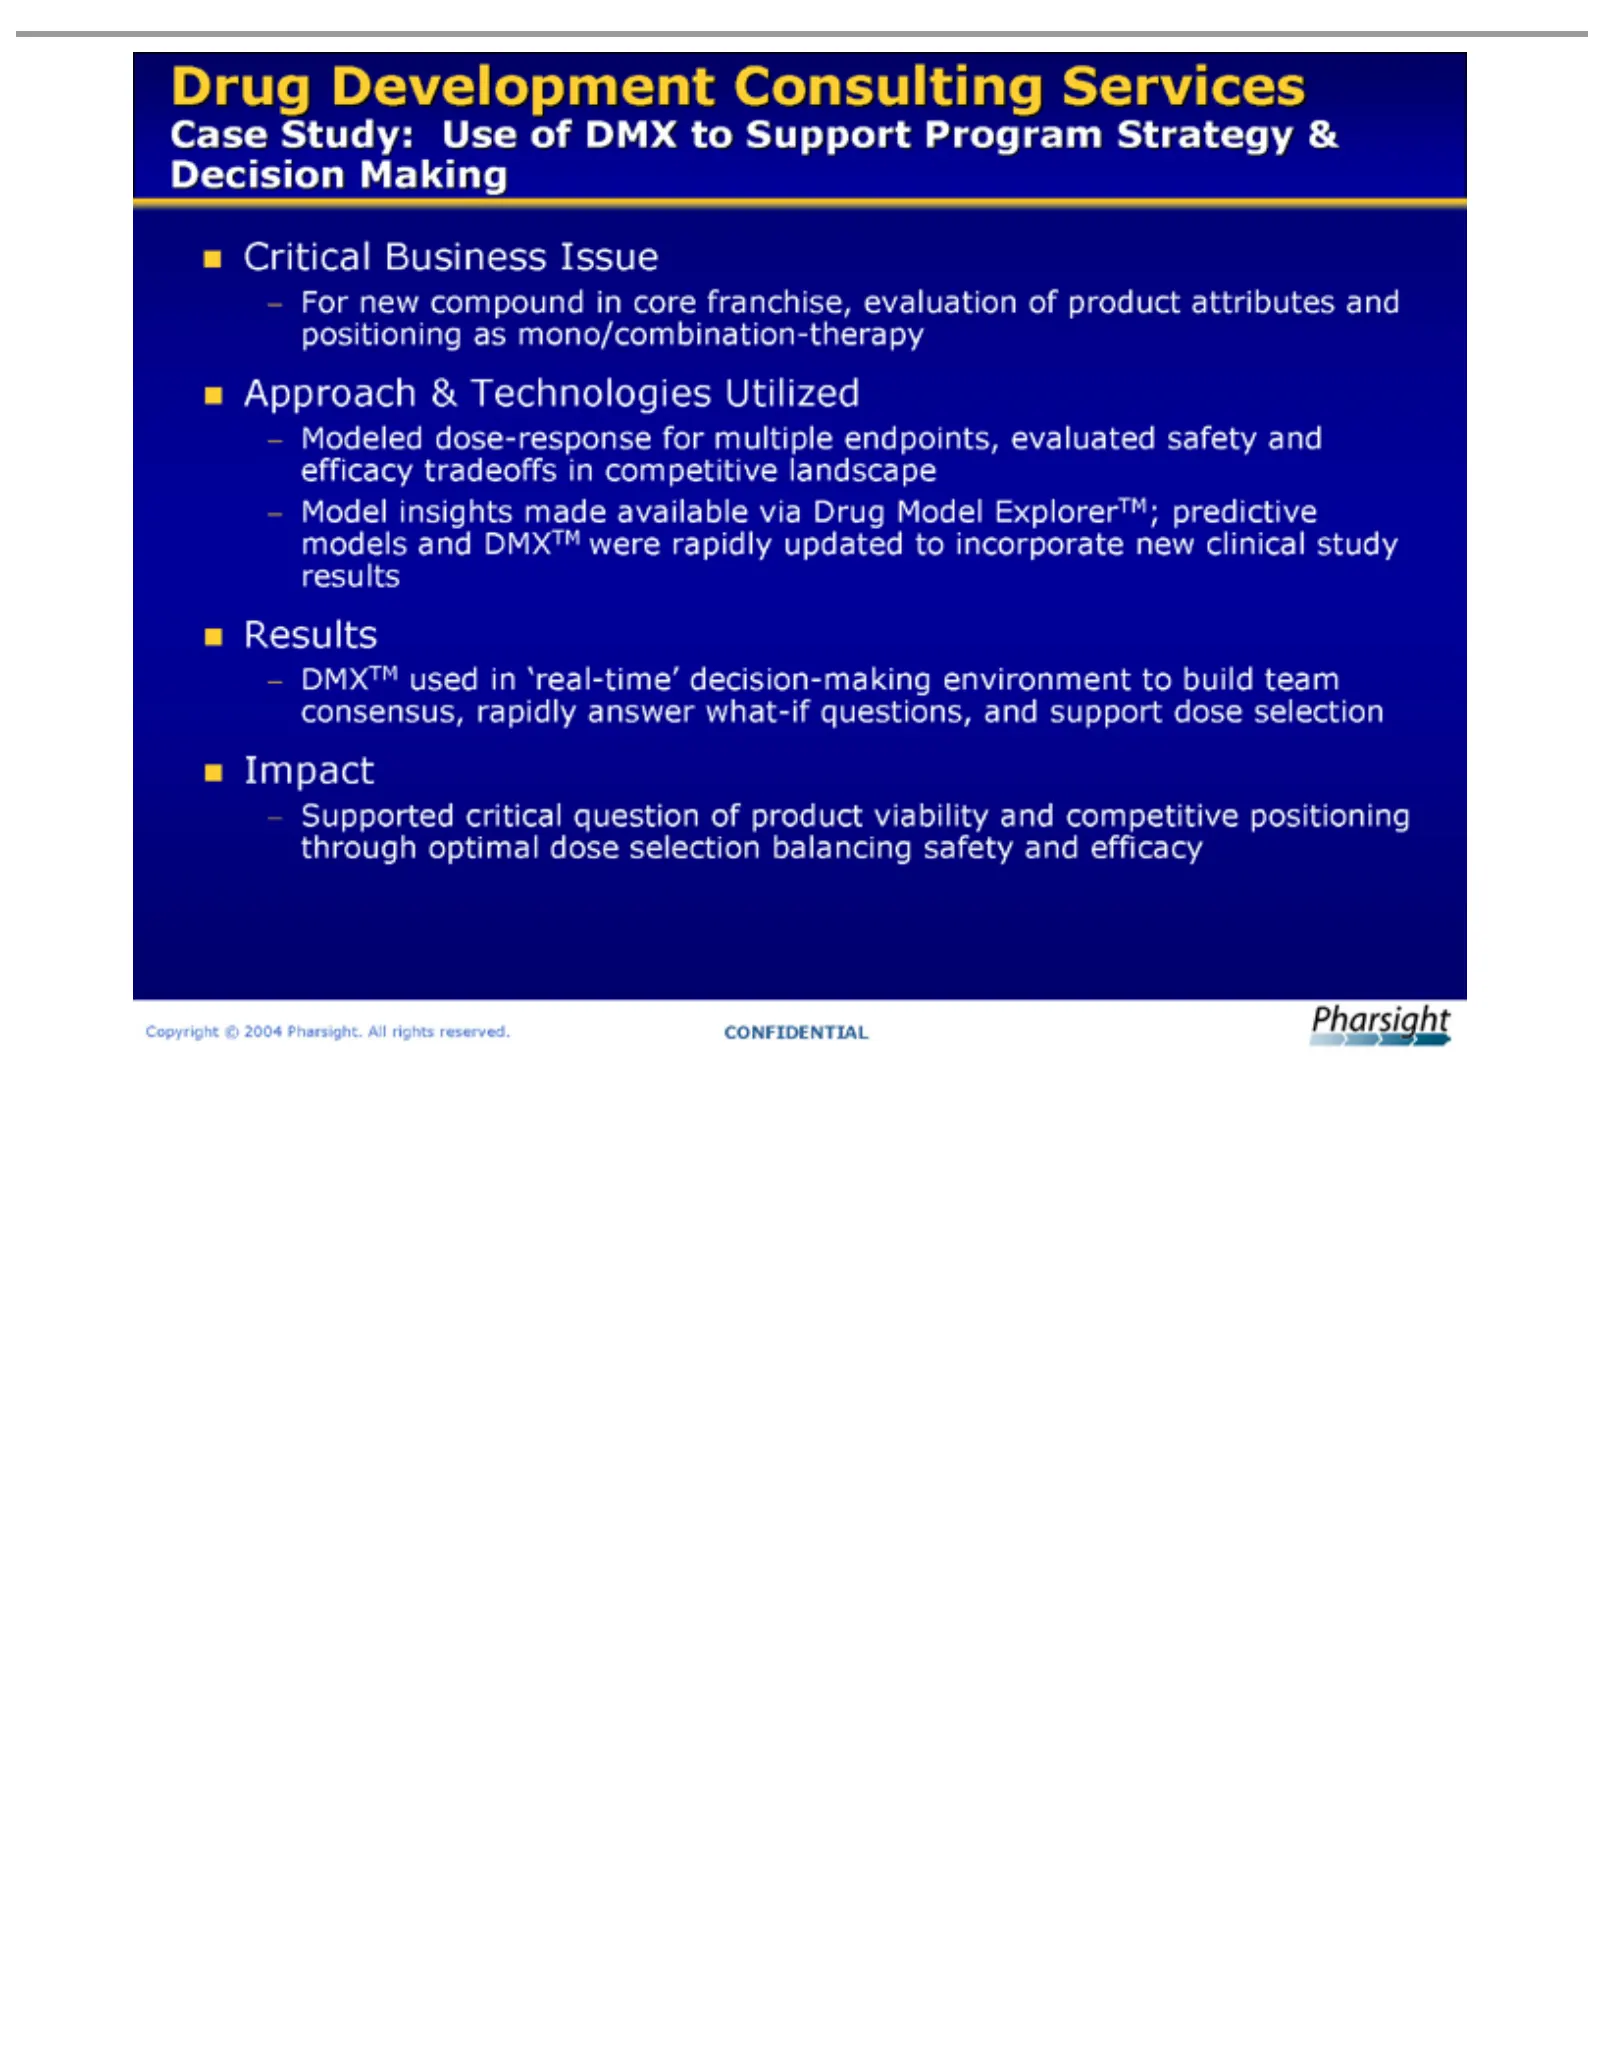
Drugnew Case Program Critical For ??Approach Modeled Model DMXTM ??Results results Supported ??Impact Copyright Study: Development insights Business compound Strategy dose-response used ©critical Use &2004 Technologies in made of Issue ‘real-time’ &question Pharsight. Consulting DMX in Decision avai
Slide 18: Case Study: Product Positioning Go/No-Go Decision
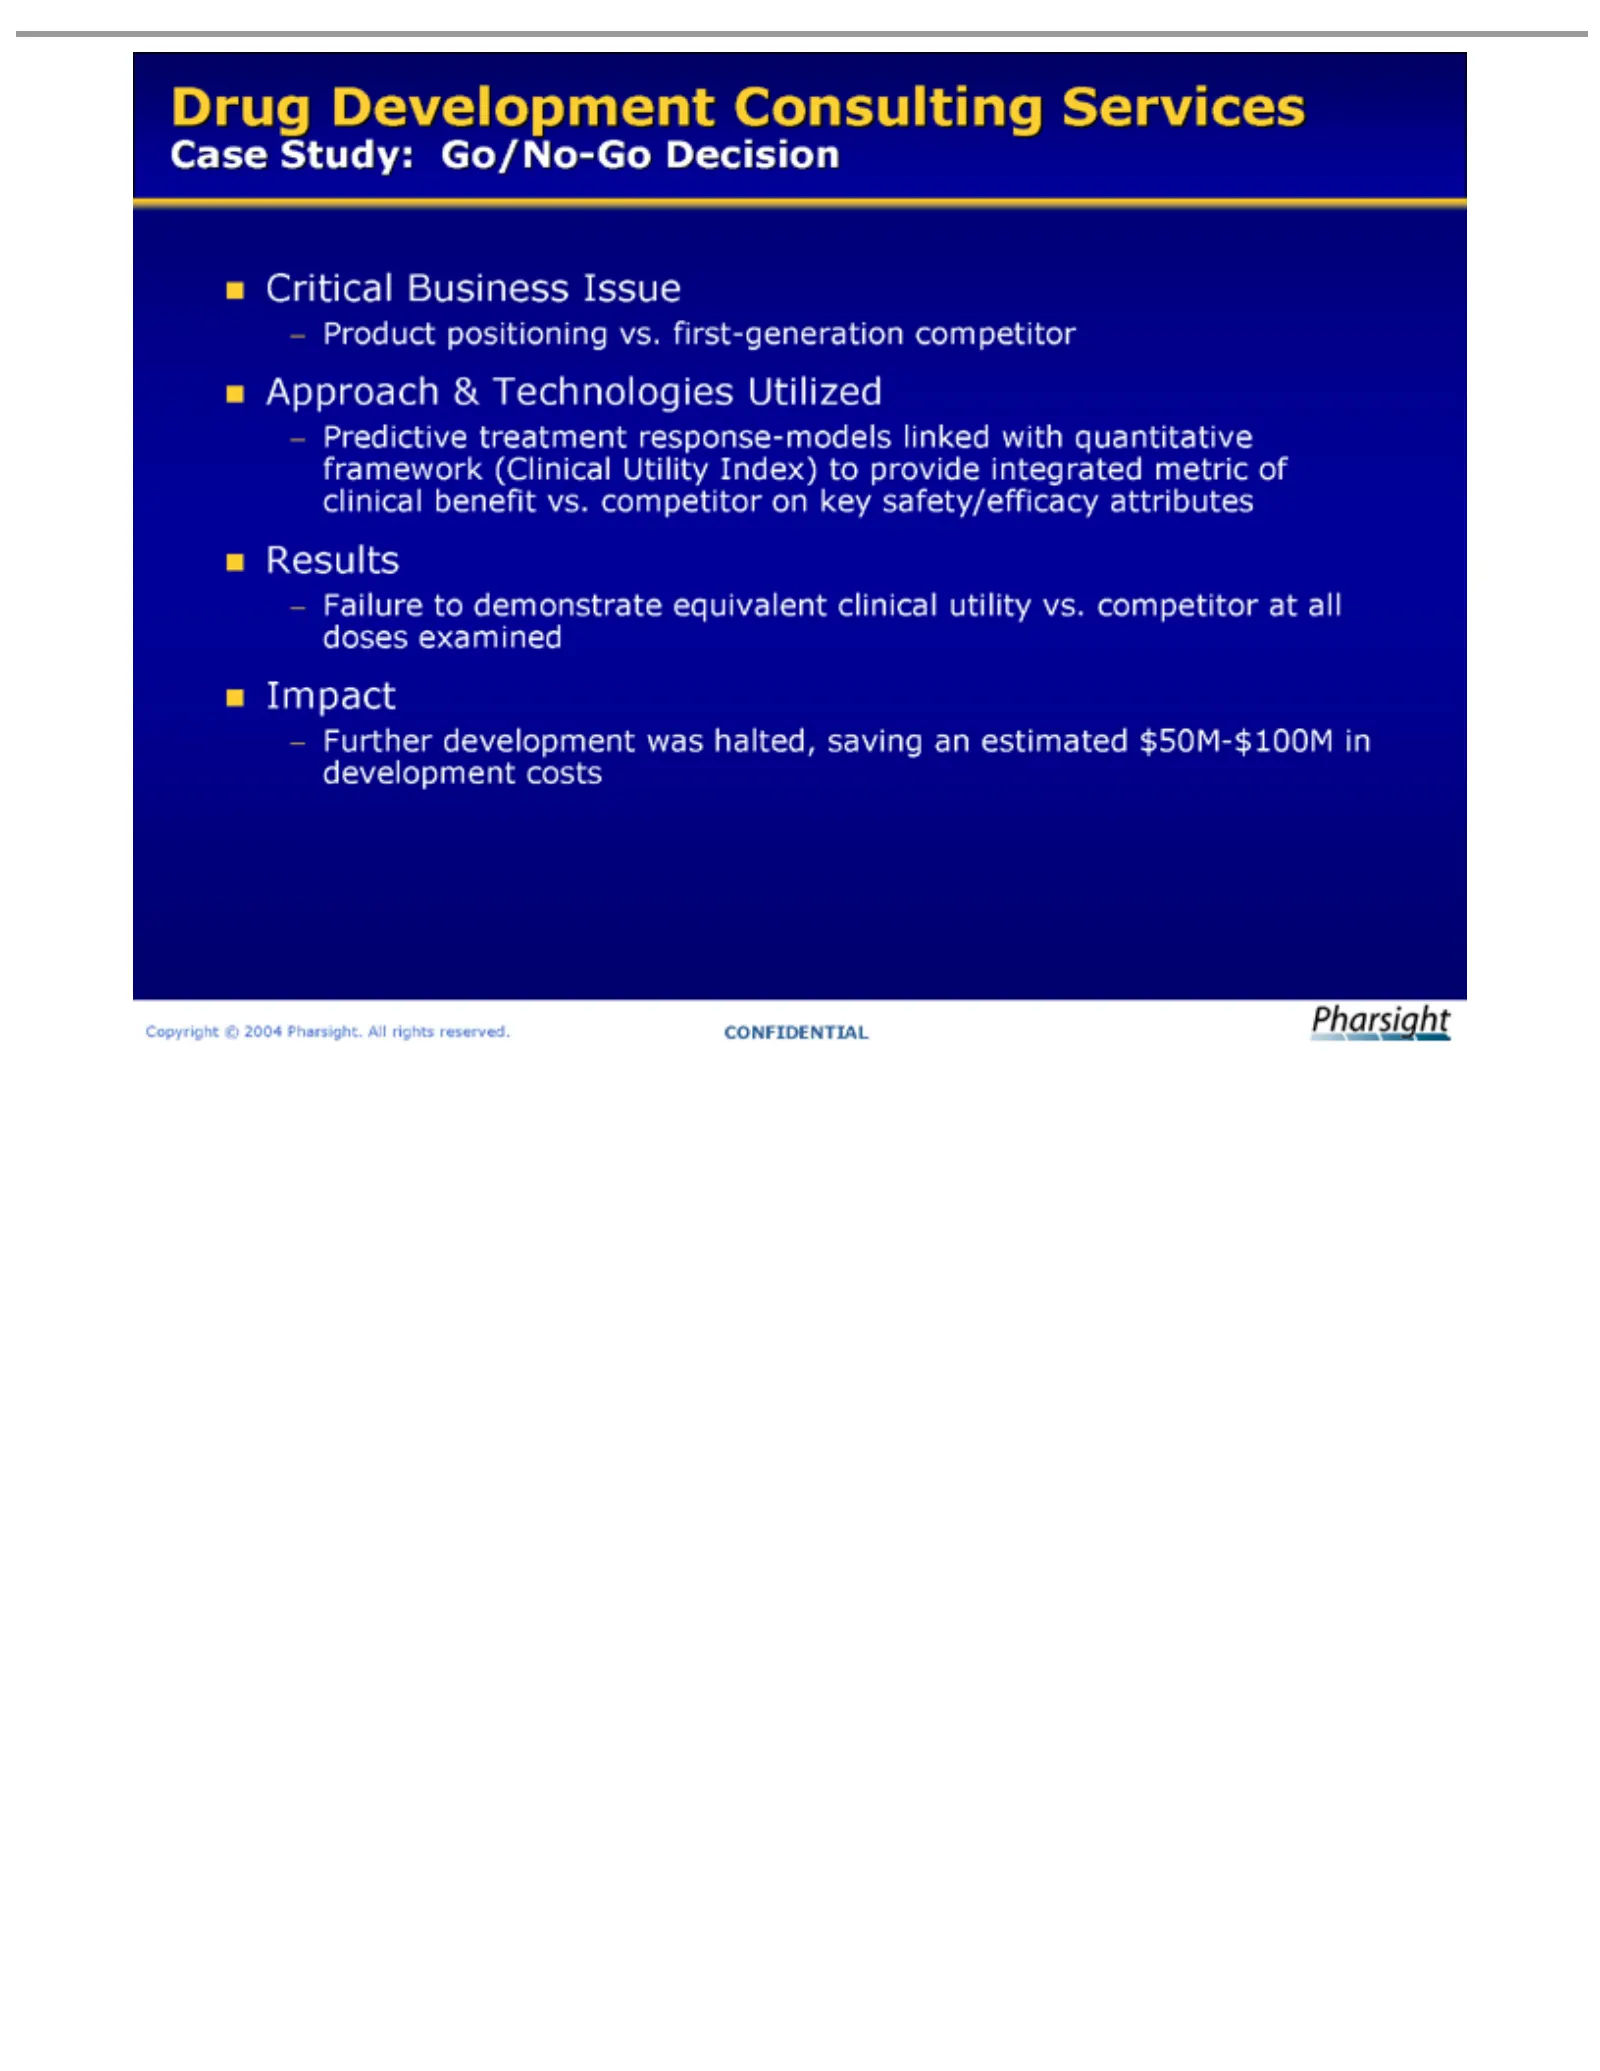
Drug Study: Case Critical Product ??Approach Predictive Failure ??Results Further ??Impact Copyright Development to development Business positioning demonstrate treatment ©Go/No-Go &2004 Technologies Issue Pharsight. Consulting vs. response-models was equivalent first-generation Decision halted, Uti
Slide 19: Aventis testimonial (Forbes ASAP)
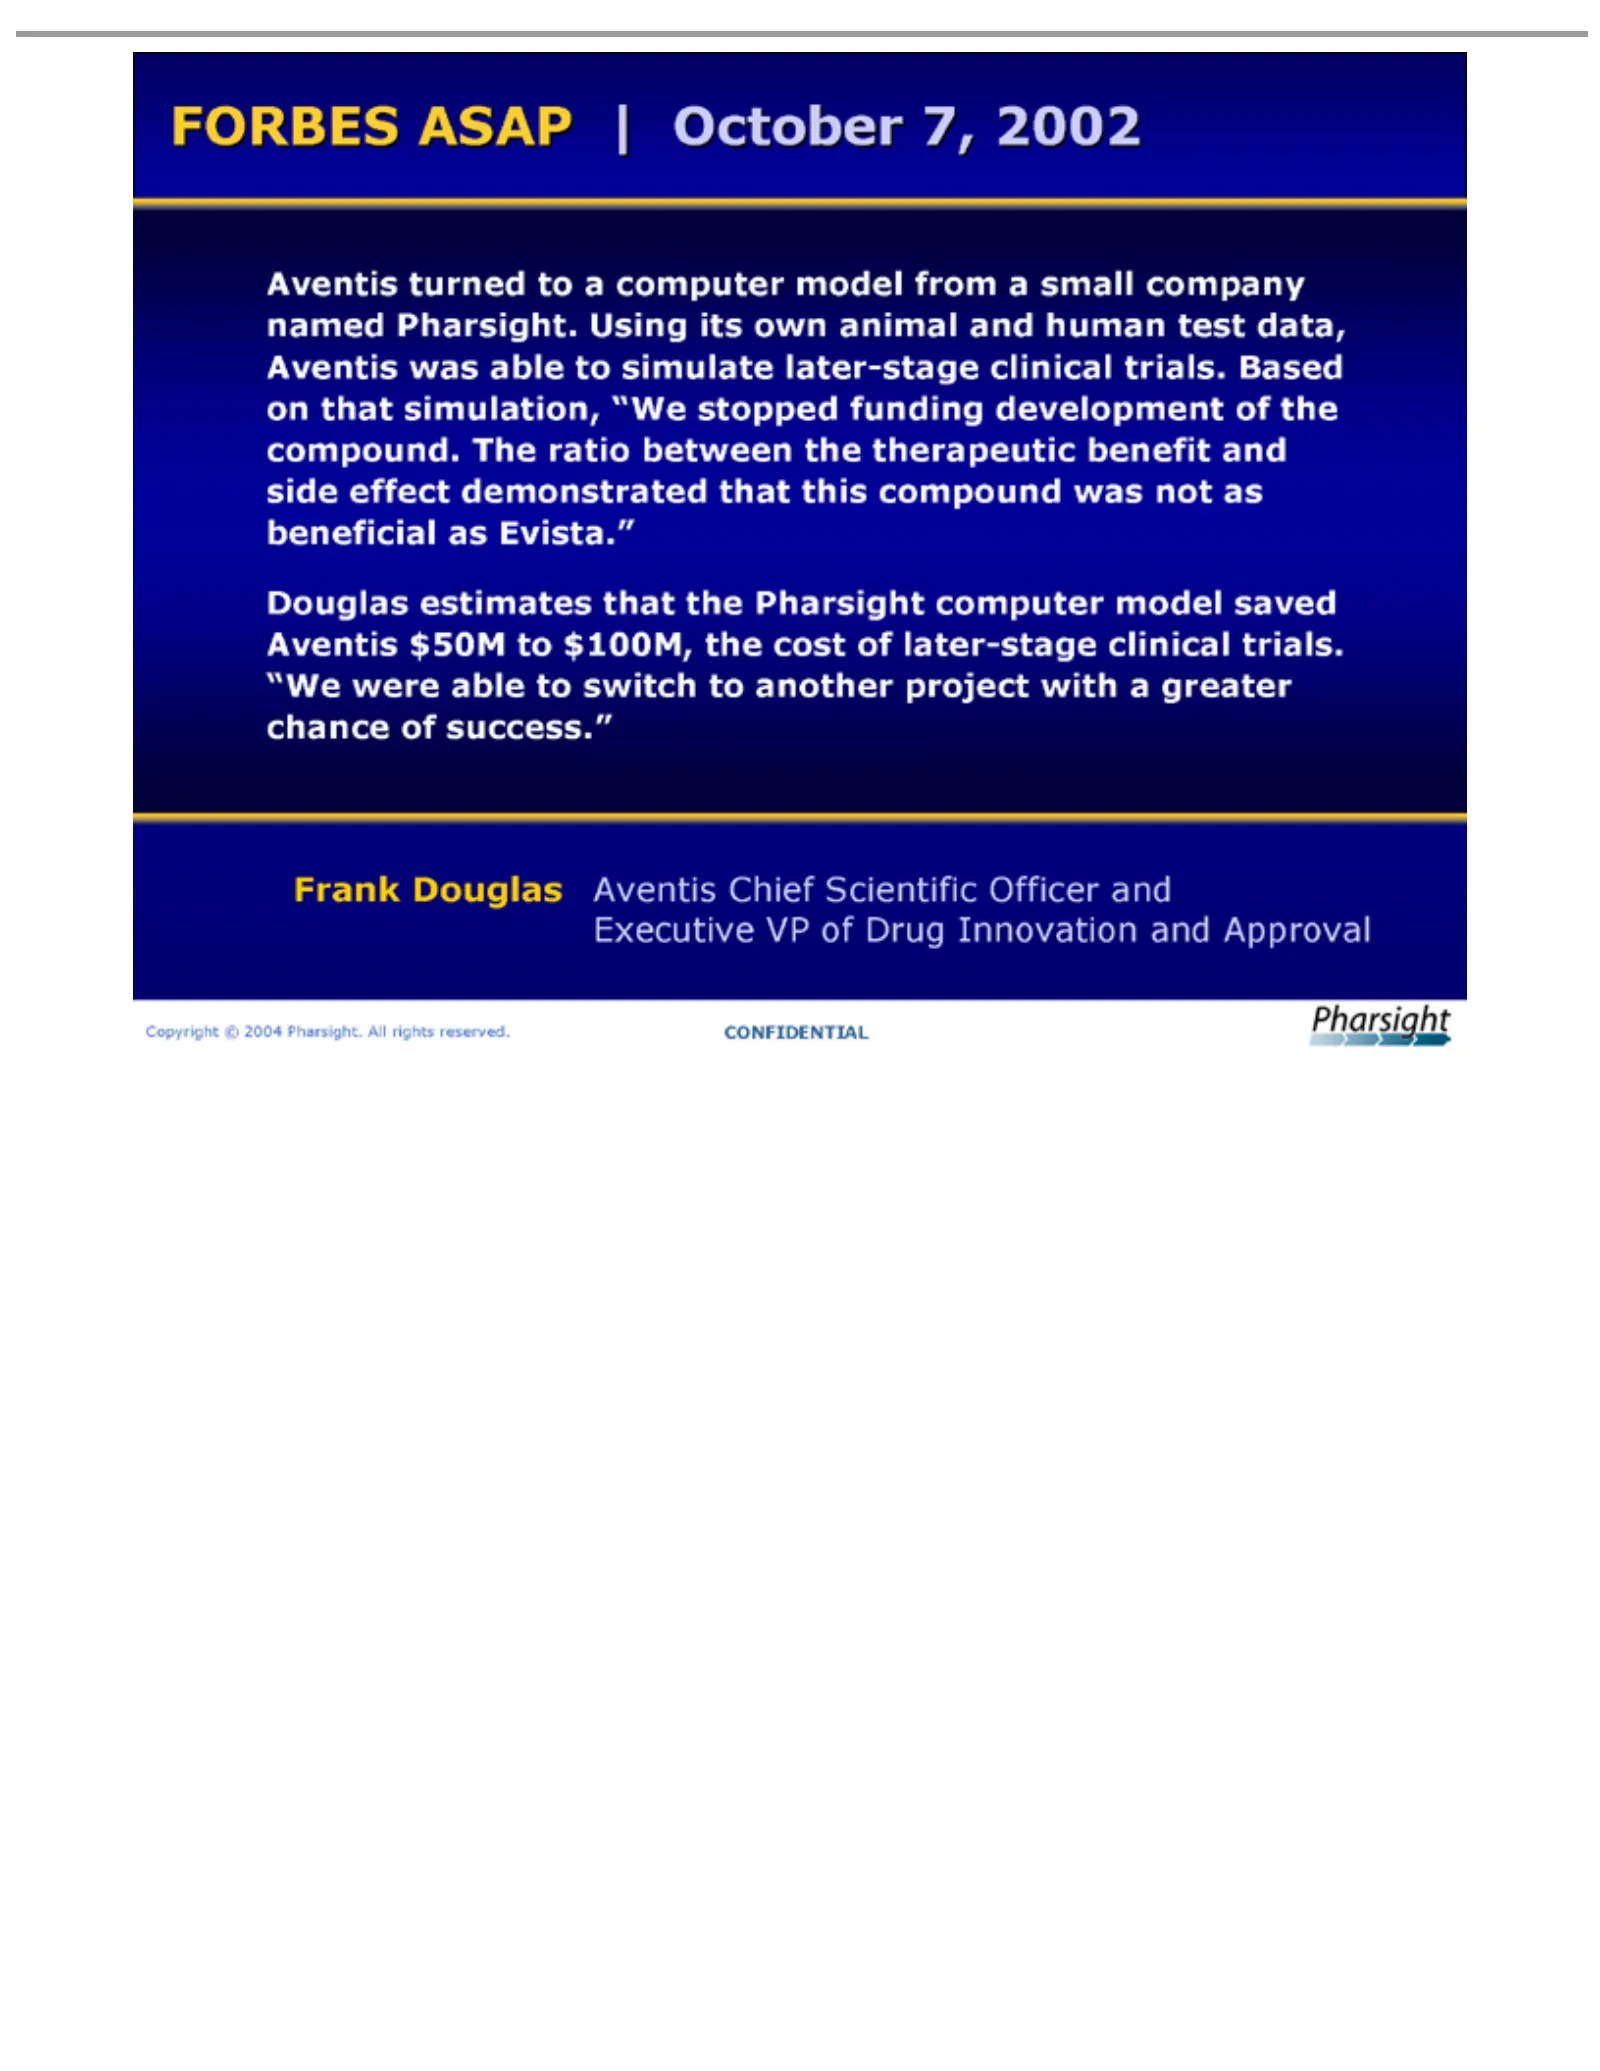
FORBES Aventis simulation, estimates Frank Executive Copyright Douglas turned that ASAP VP ©“We 2004 the ofto Aventis stopped |Drug aPharsight October Pharsight. computer Innovation Chief funding 7,computer 2002 All model Scientific rights development and from model Approval reserved. Officer a smal
Slide 20: Consulting Services Potential Growth Drivers
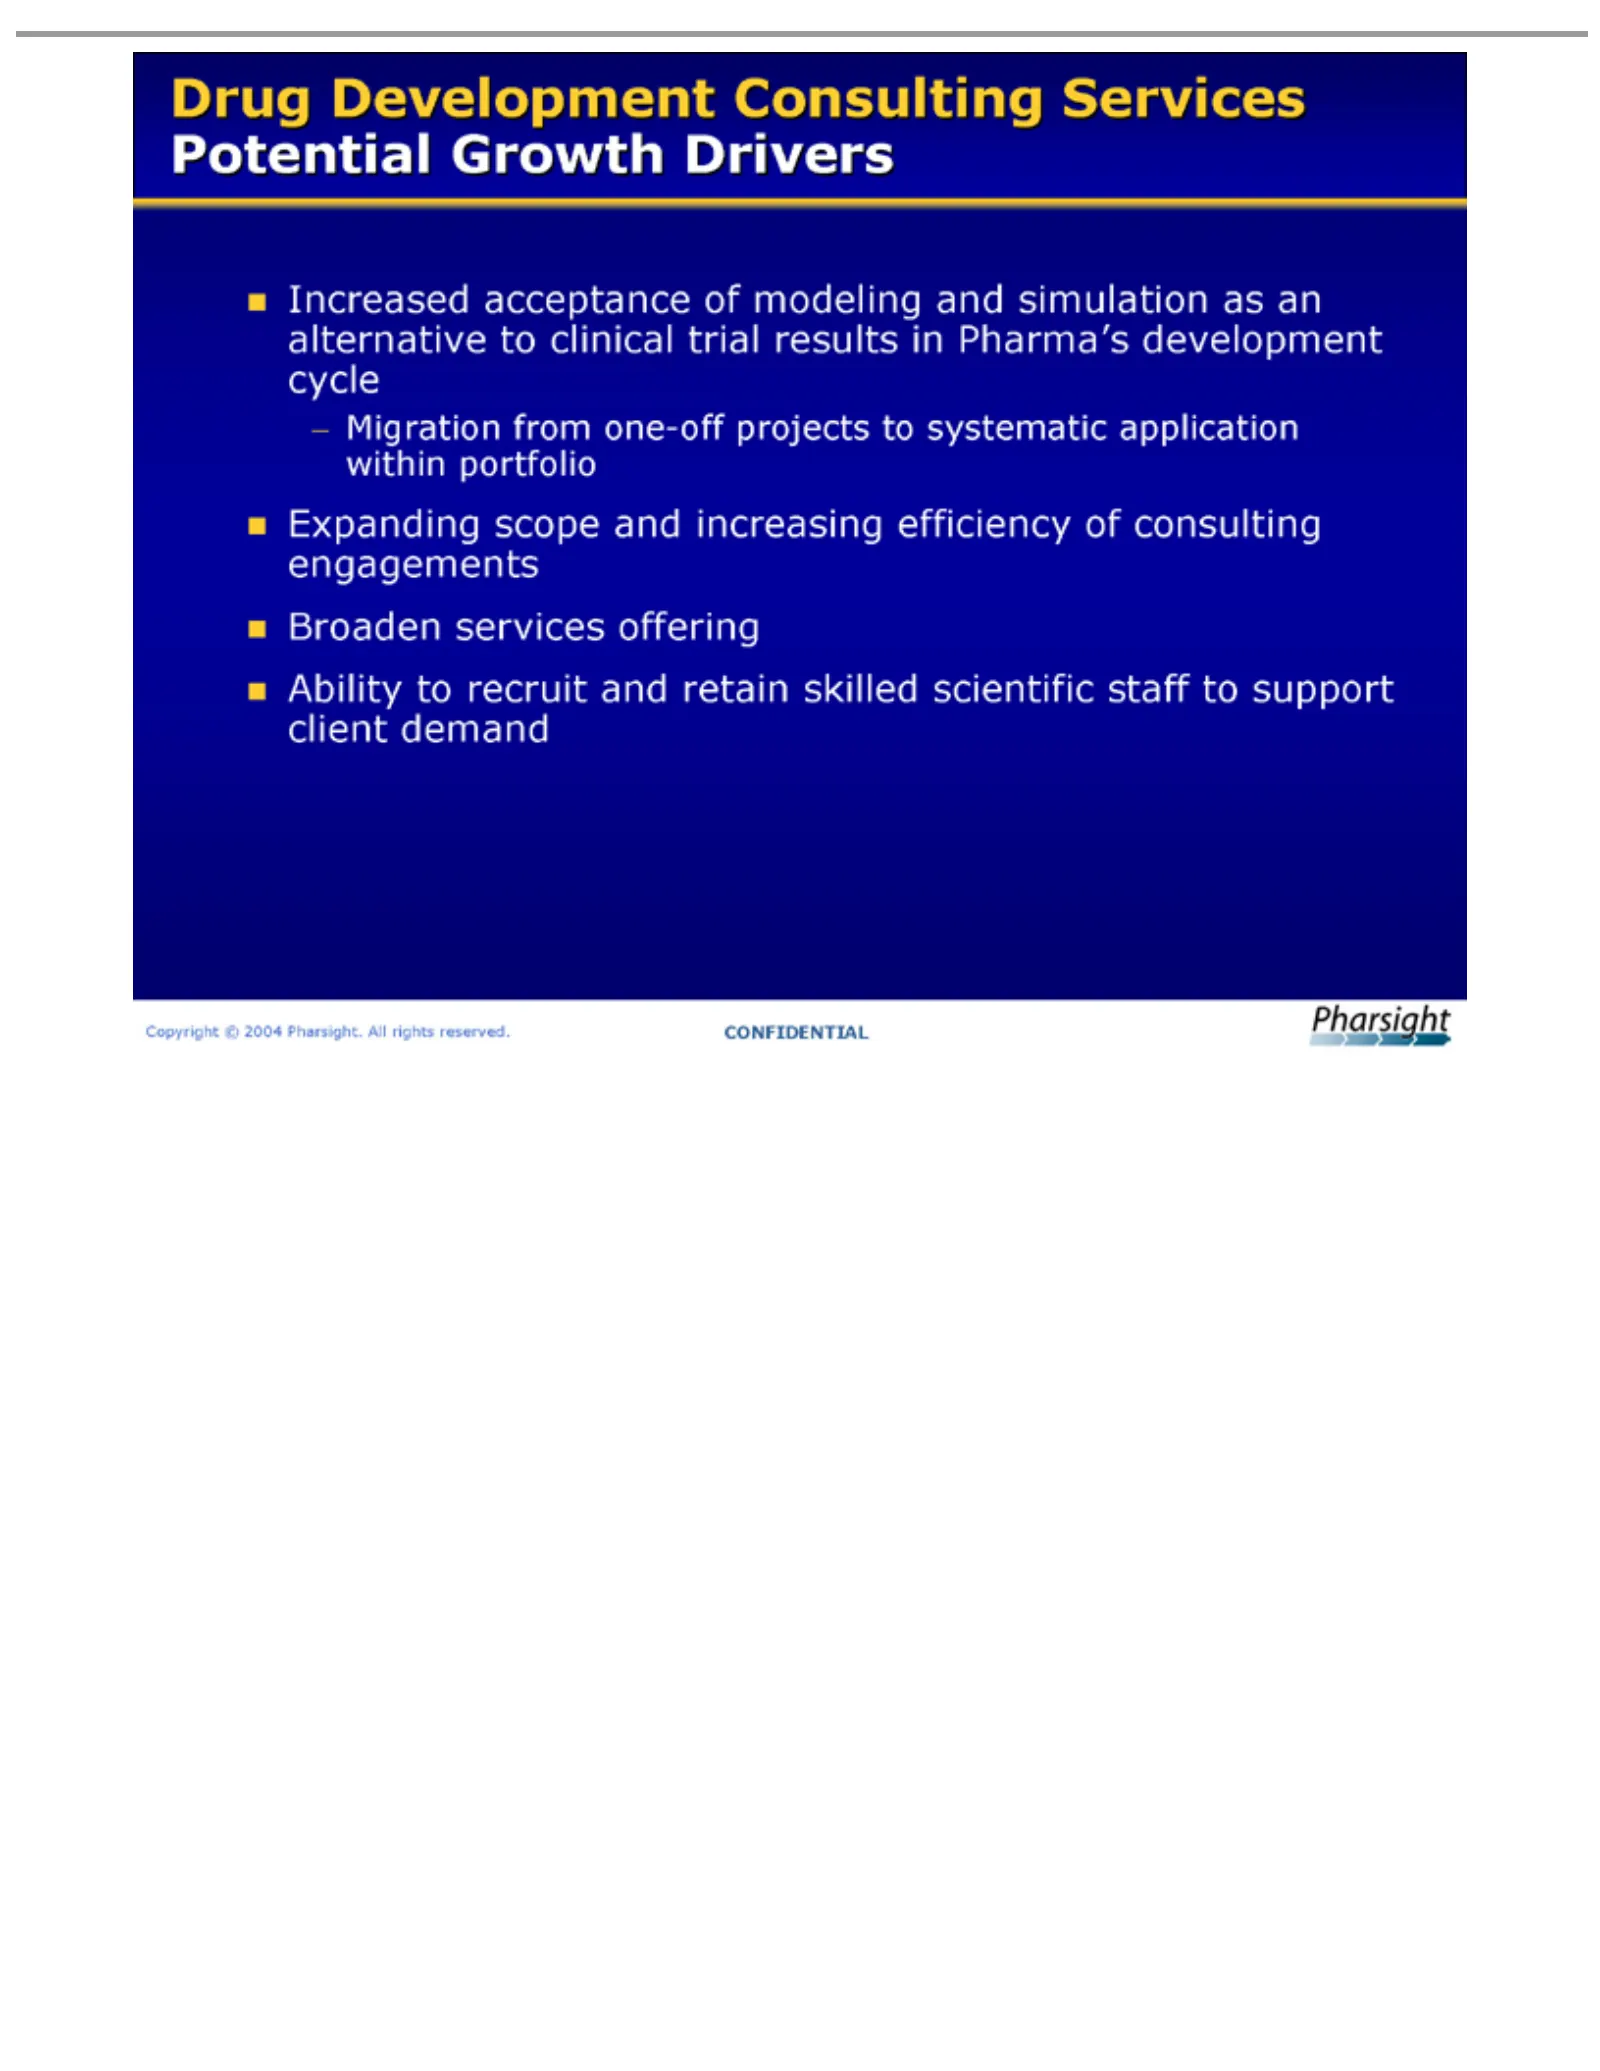
Drug Development ??Increased Migration ??Expanding ??Broaden ??Ability Copyright tofrom ©services acceptance recruit 2004 scope one-off Pharsight. and Consulting offering and retain of projects increasing modeling All skilled Services torights efficiency systematic and scientific reserved. Potential
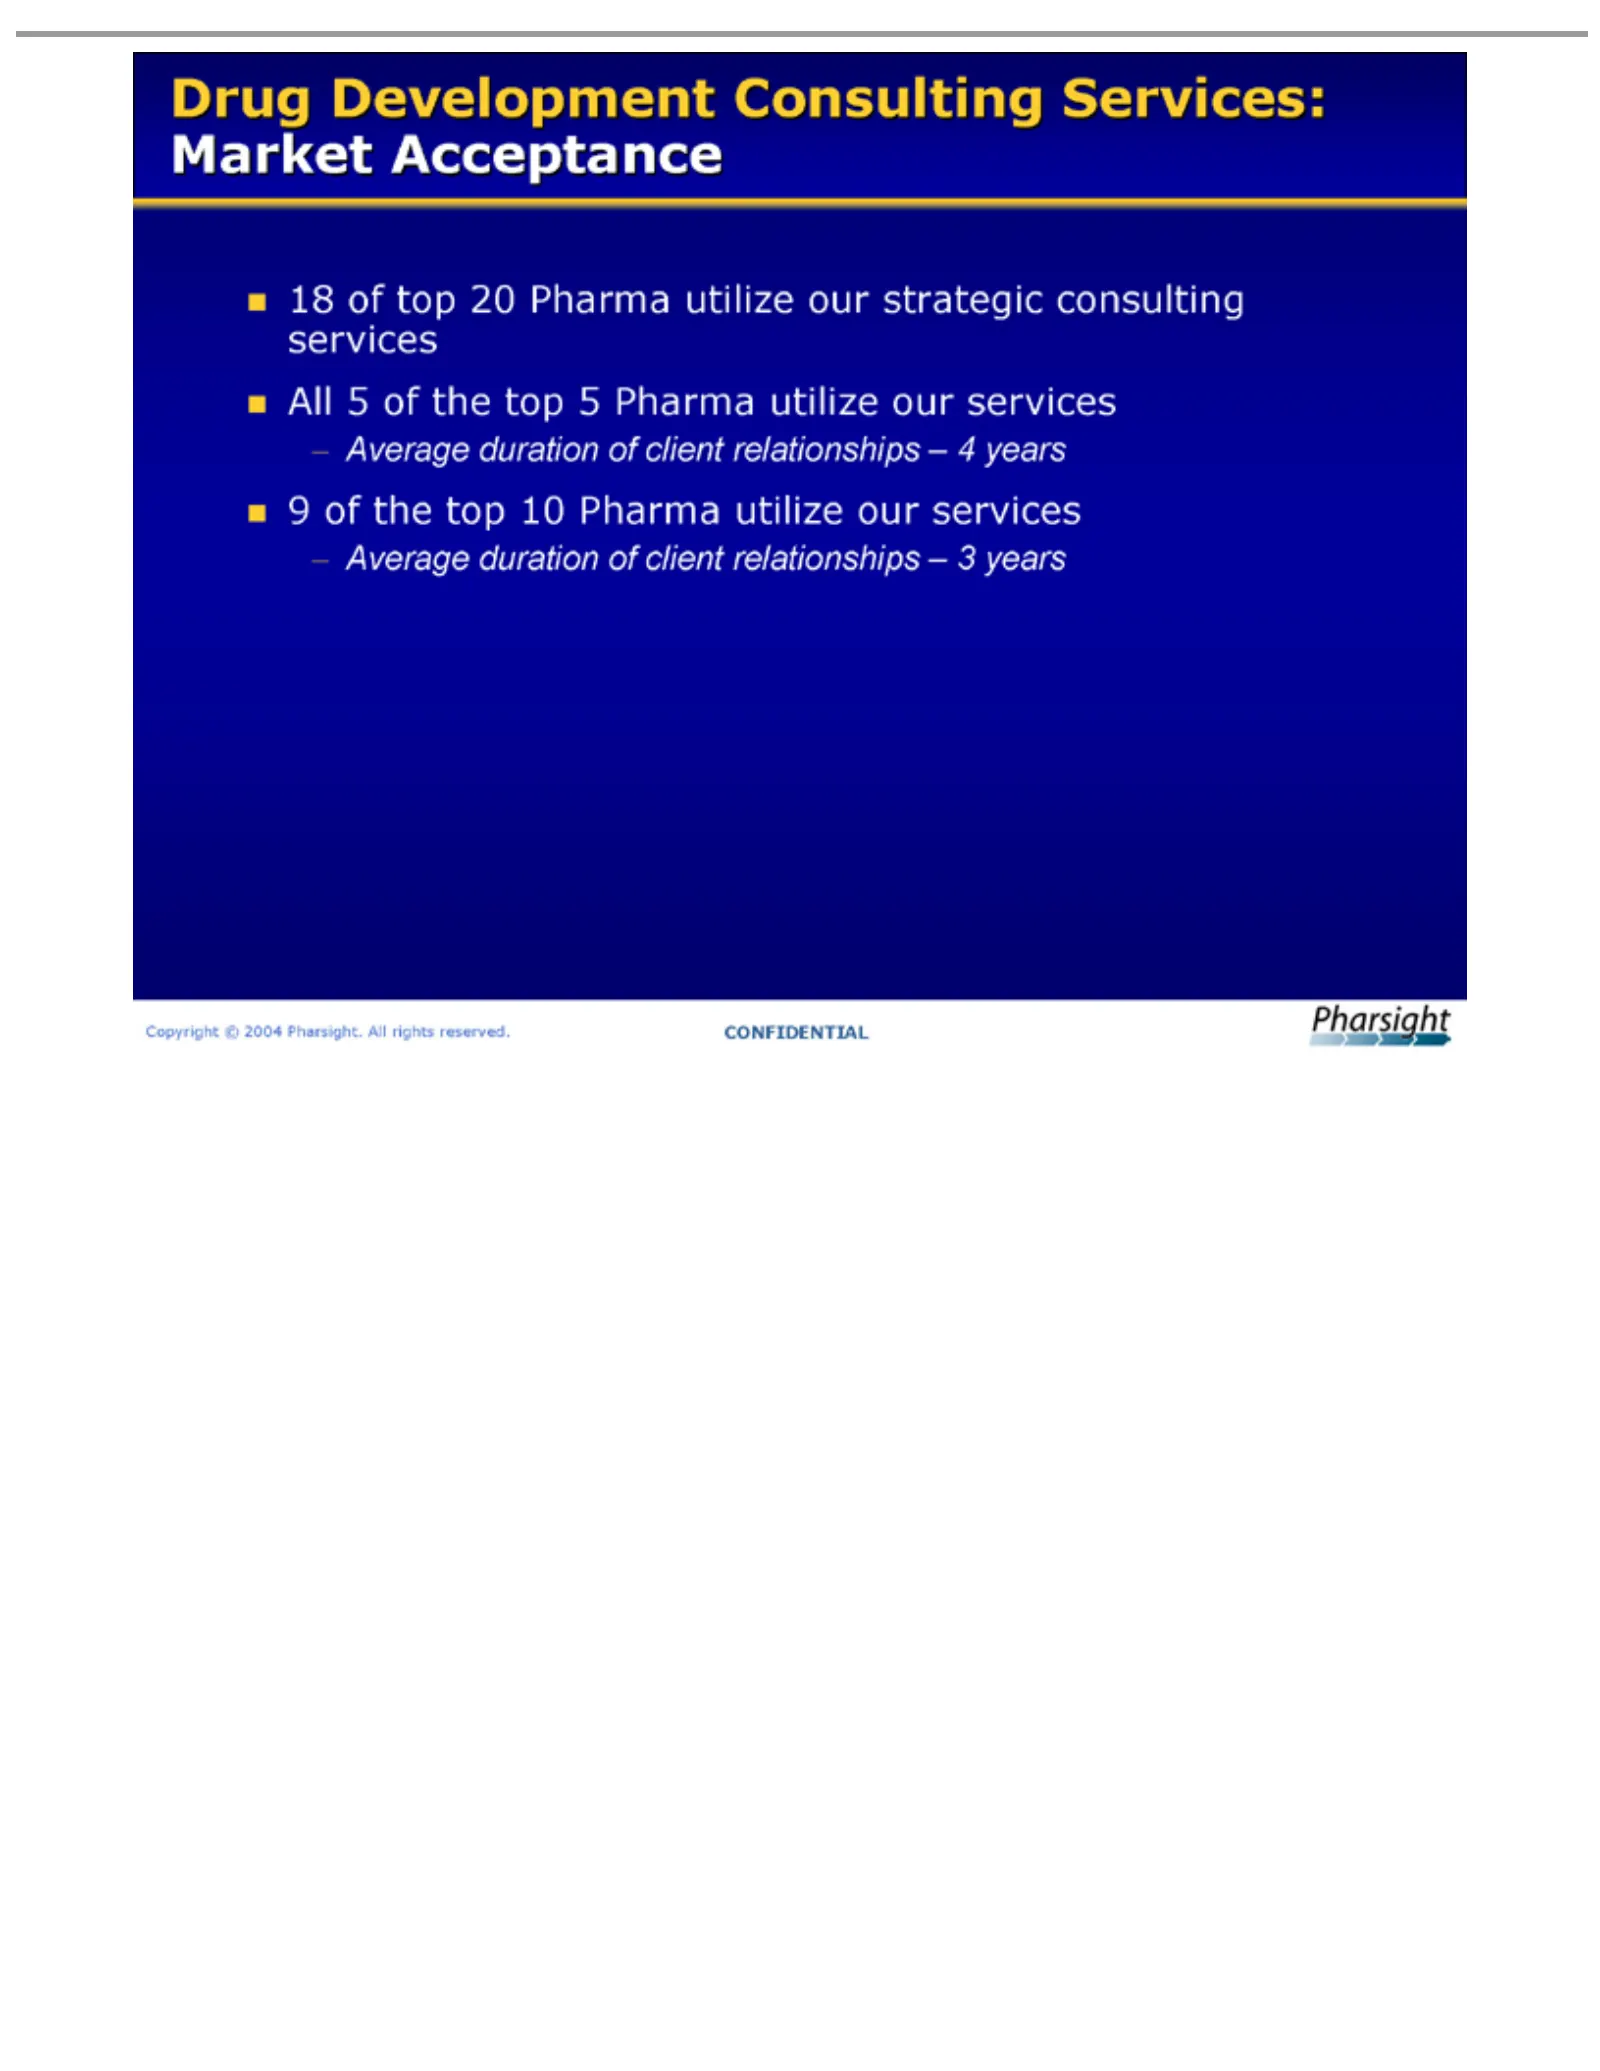
Slide 21: Consulting Services Market Acceptance
Drug ??18 ??All 9 Average Copyright of the of Development 5 of top duration the ©20 10 2004 top Pharma of 5Pharsight. Consulting Pharma client utilize relationships utilize All our Services: rights strategic services our services reserved. –Market 4consulting 3 yearsAcceptance CONFIDENTIAL services
Slide 22: Financial Overview
Financial Overview Copyright © 2004 Pharsight. All rights reserved.
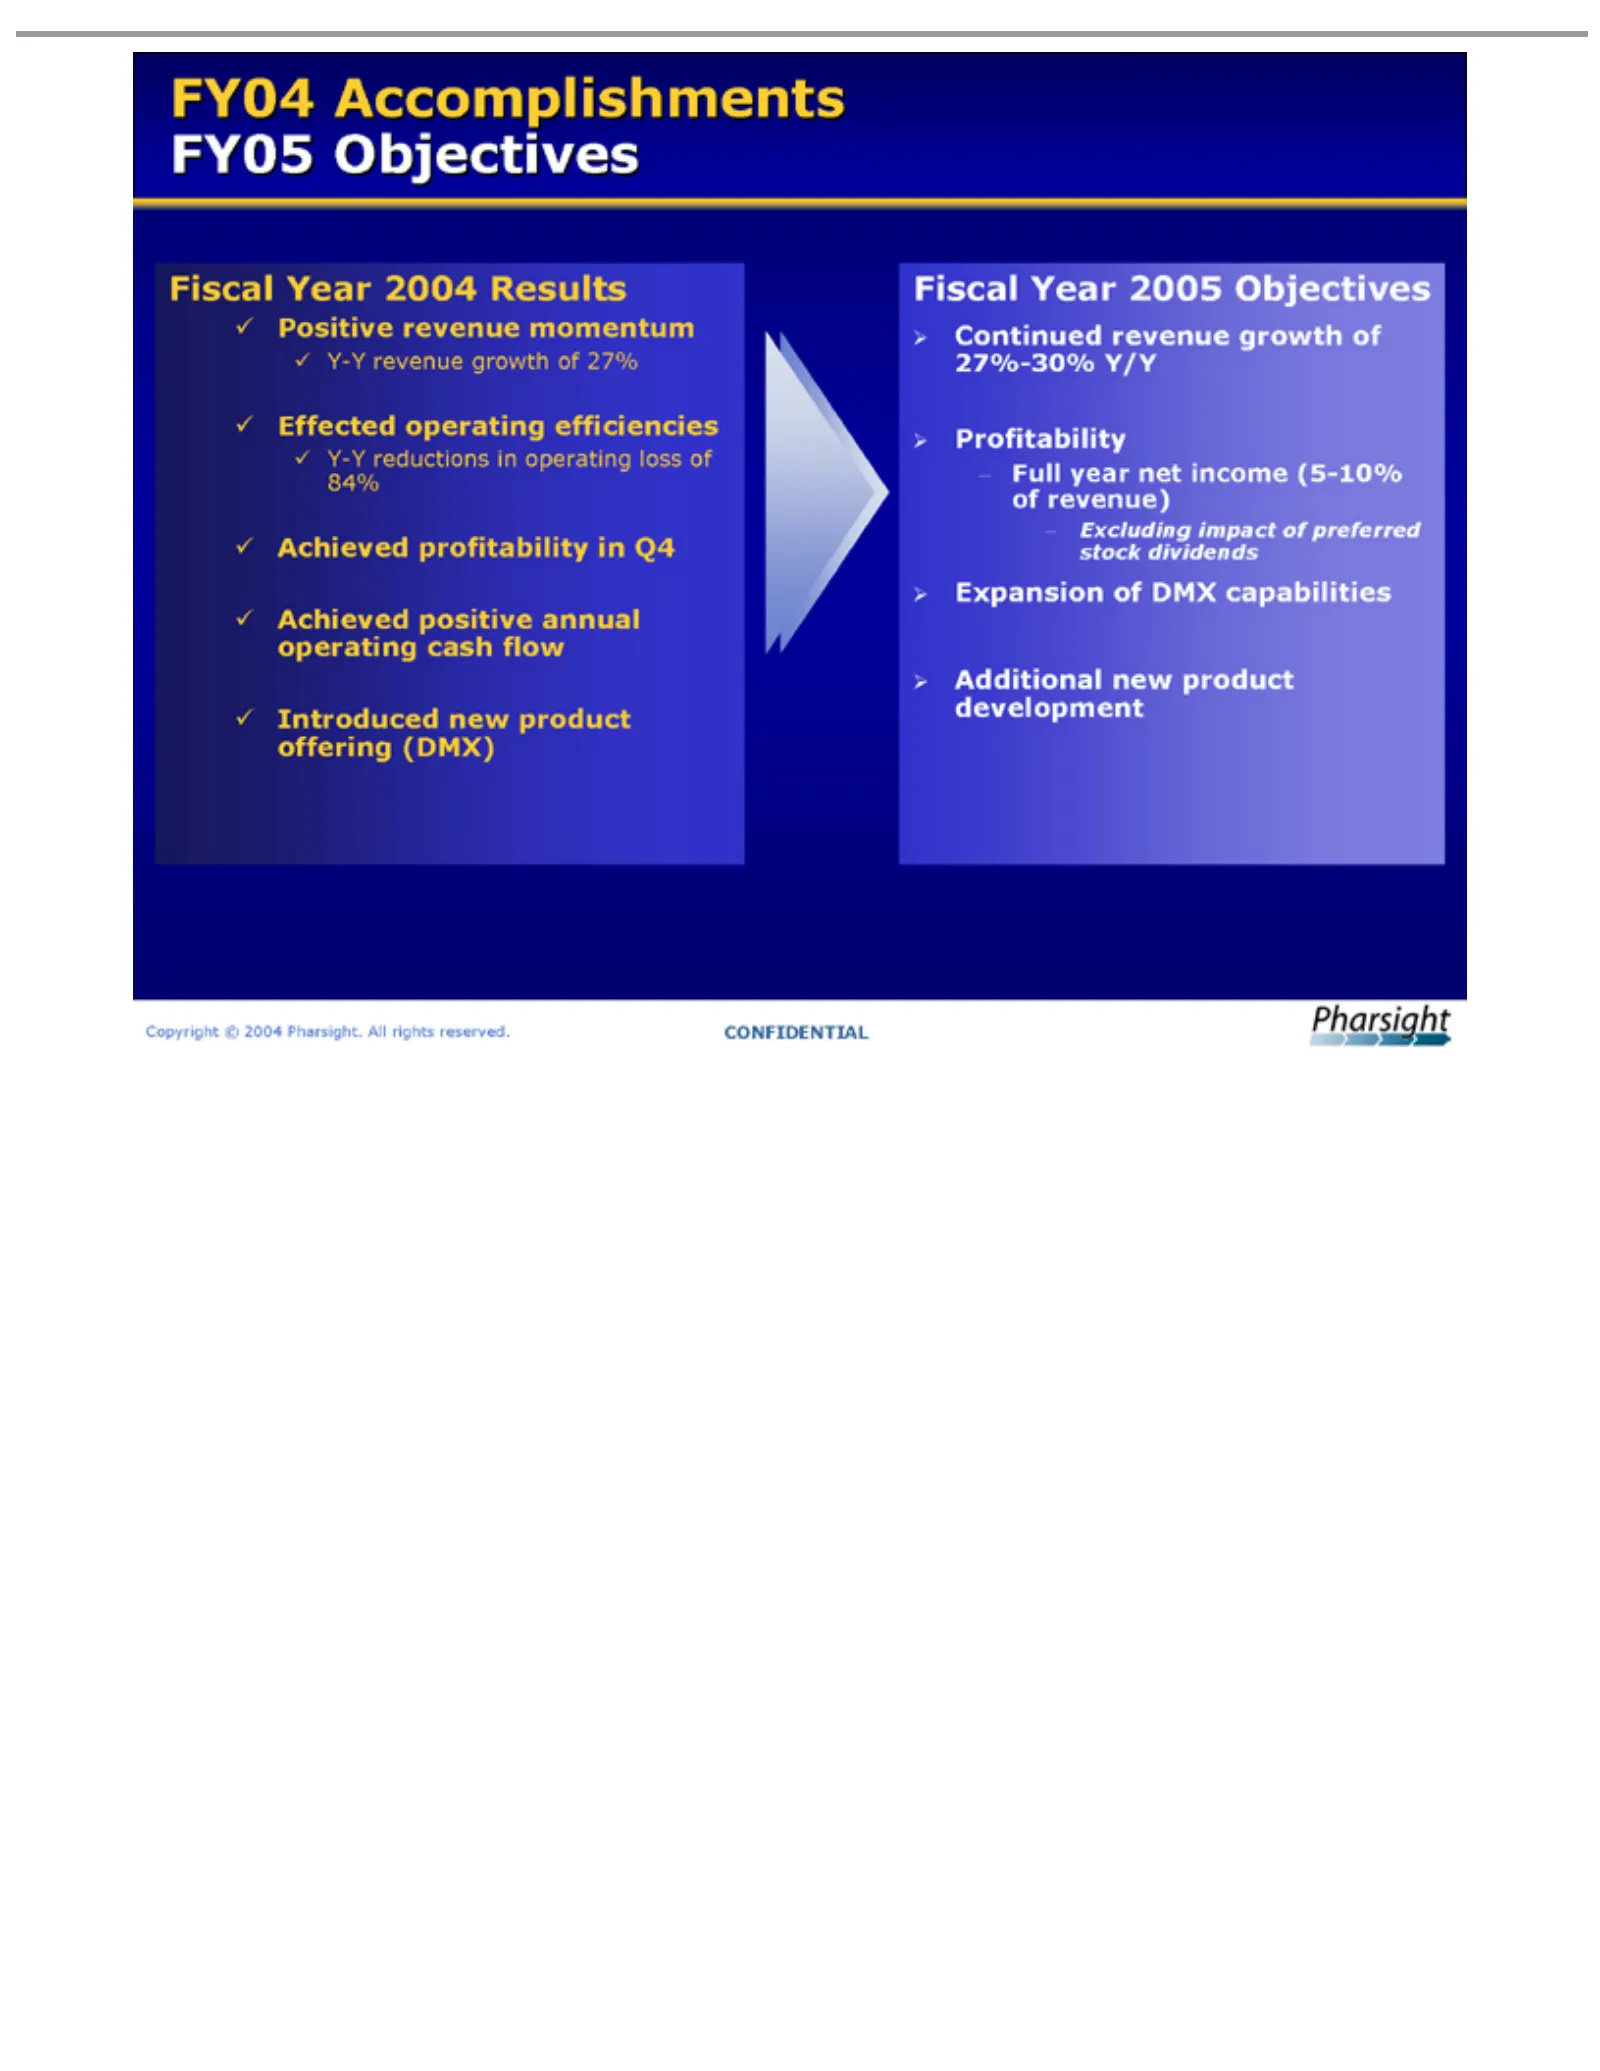
Slide 23: FY04 Accomplishments and FY05 Objectives
FY04year Positive Effected ?Y-Y Achieved Introduced Fiscal Continued Full Profitability Excluding Expansion Additional Copyright revenue reductions Accomplishments Year revenue operating net profitability positive © impact revenue of new 2004 2005 income 2004 DMX growth product in momentum Results O
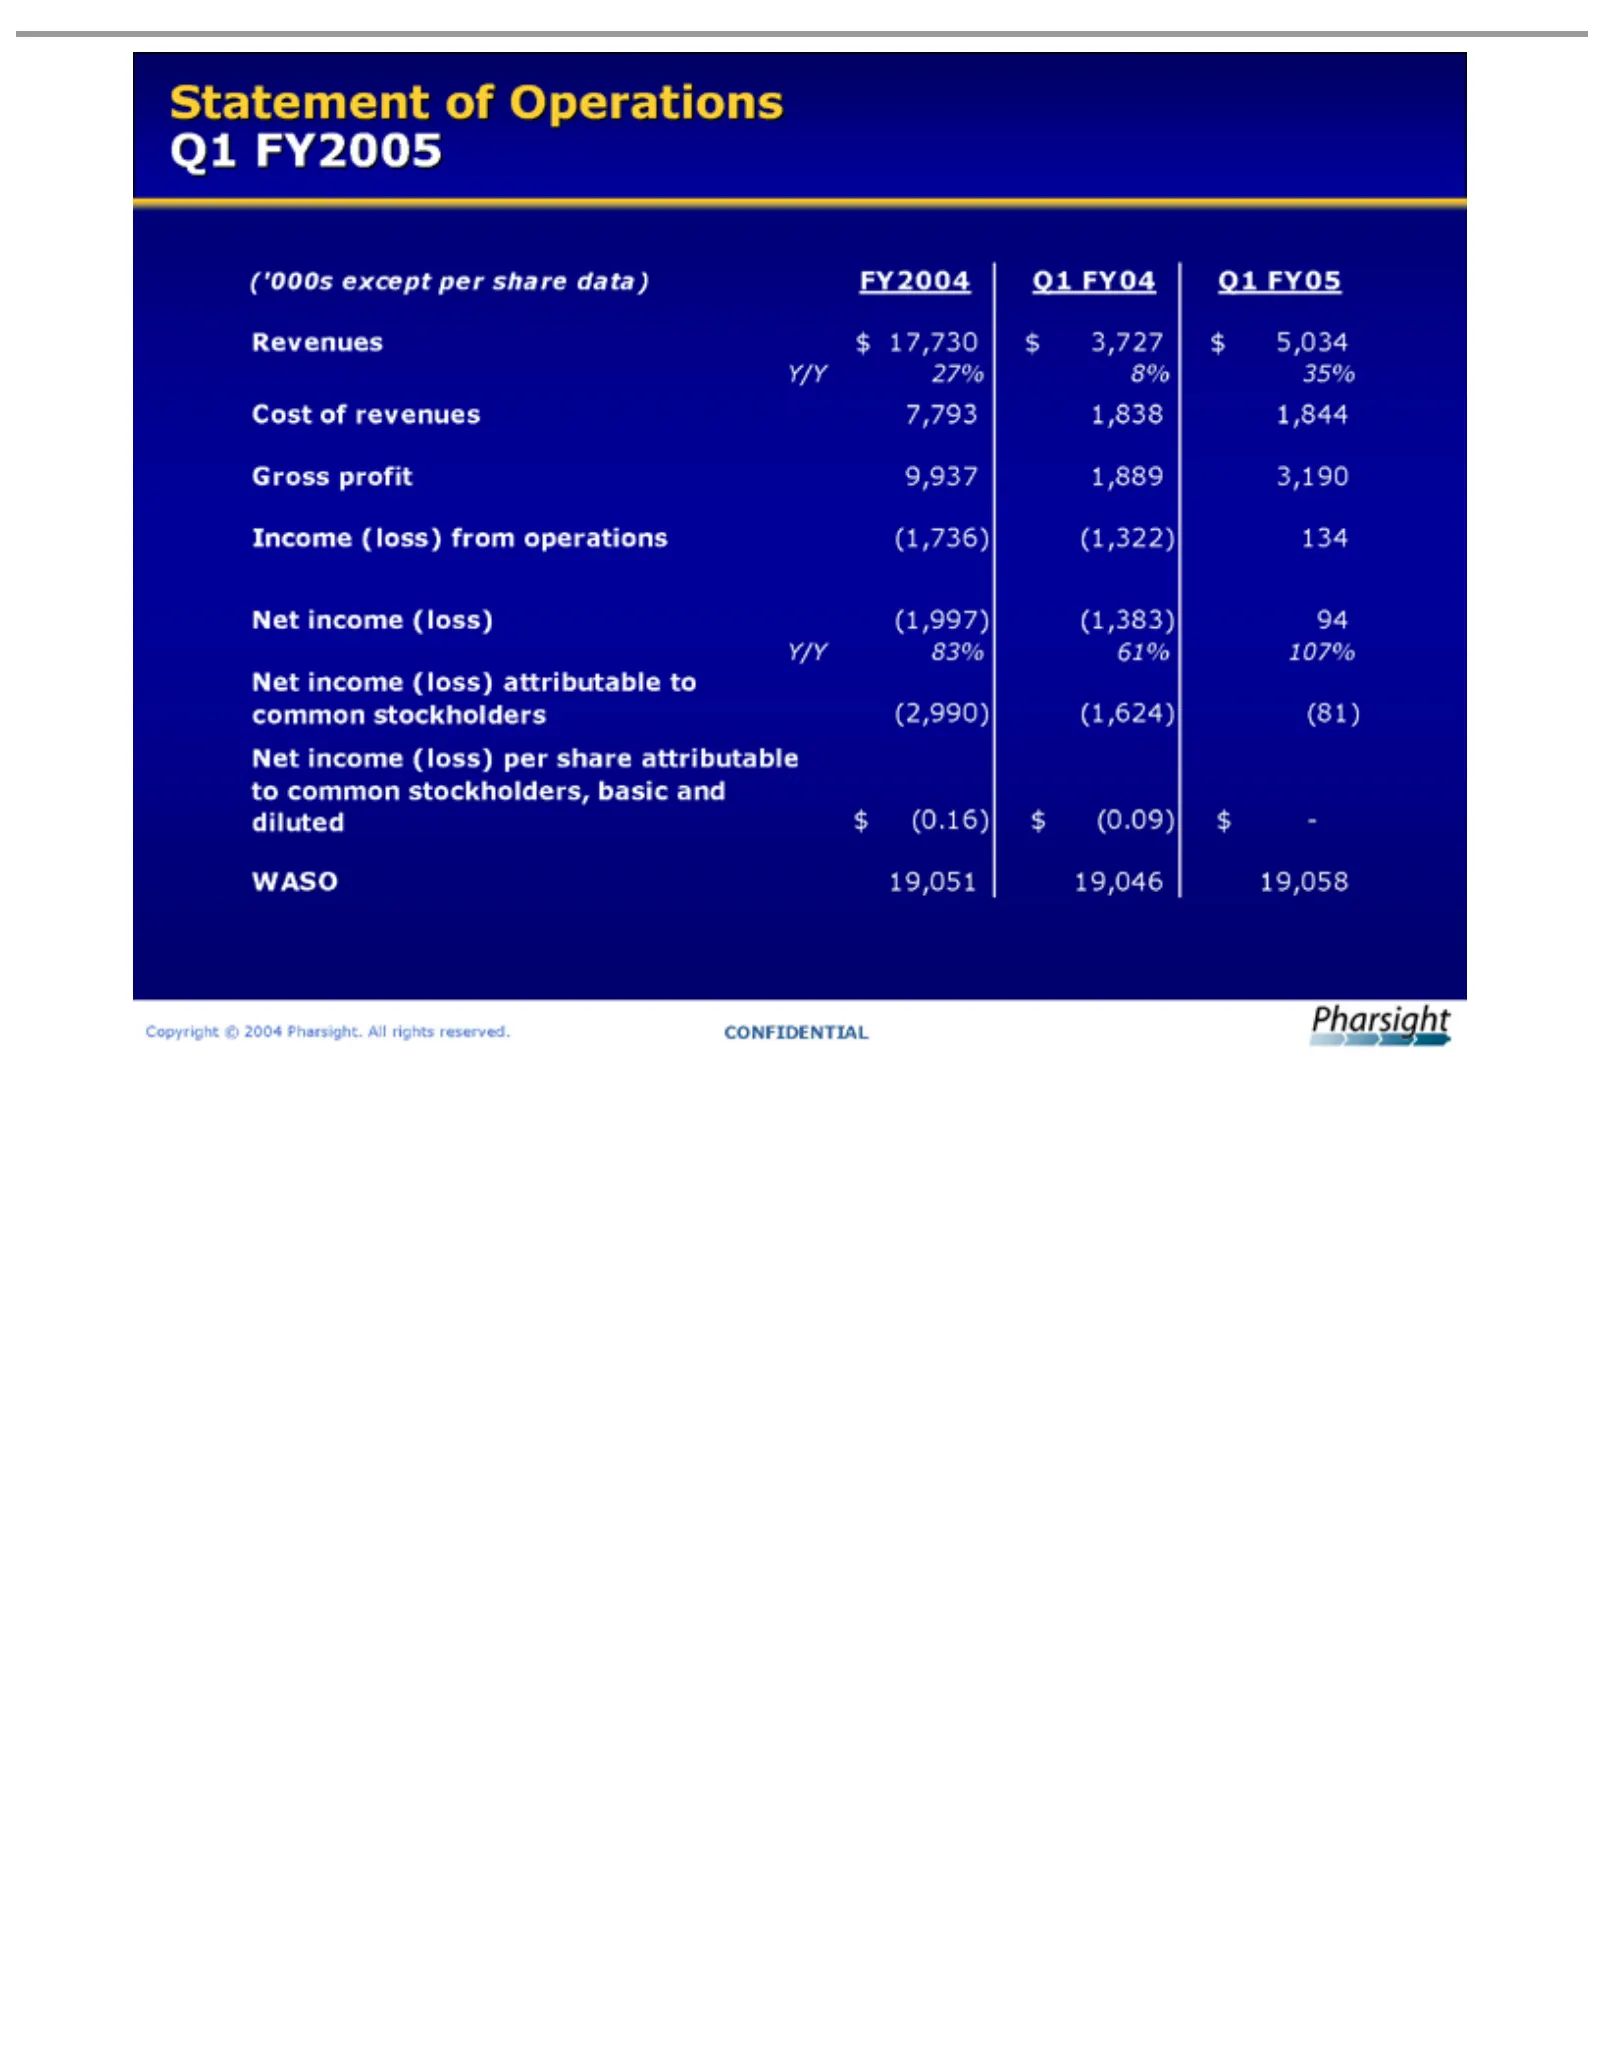
Slide 24: Income Statement
Statement (‘000s Revenues Cost Gross Income Y/Y Net WASO Copyright income 27% 83% ofprofit except 19,051 revenues (loss) 8% 61% $of ©(loss) 17,730 9,937 2004 Operations 35% per from 19,046 107% 7,793 share (1,997) attributable per 1,889 Pharsight. $operations 3,727 share 19,058 1,838 data) Q1 3,190
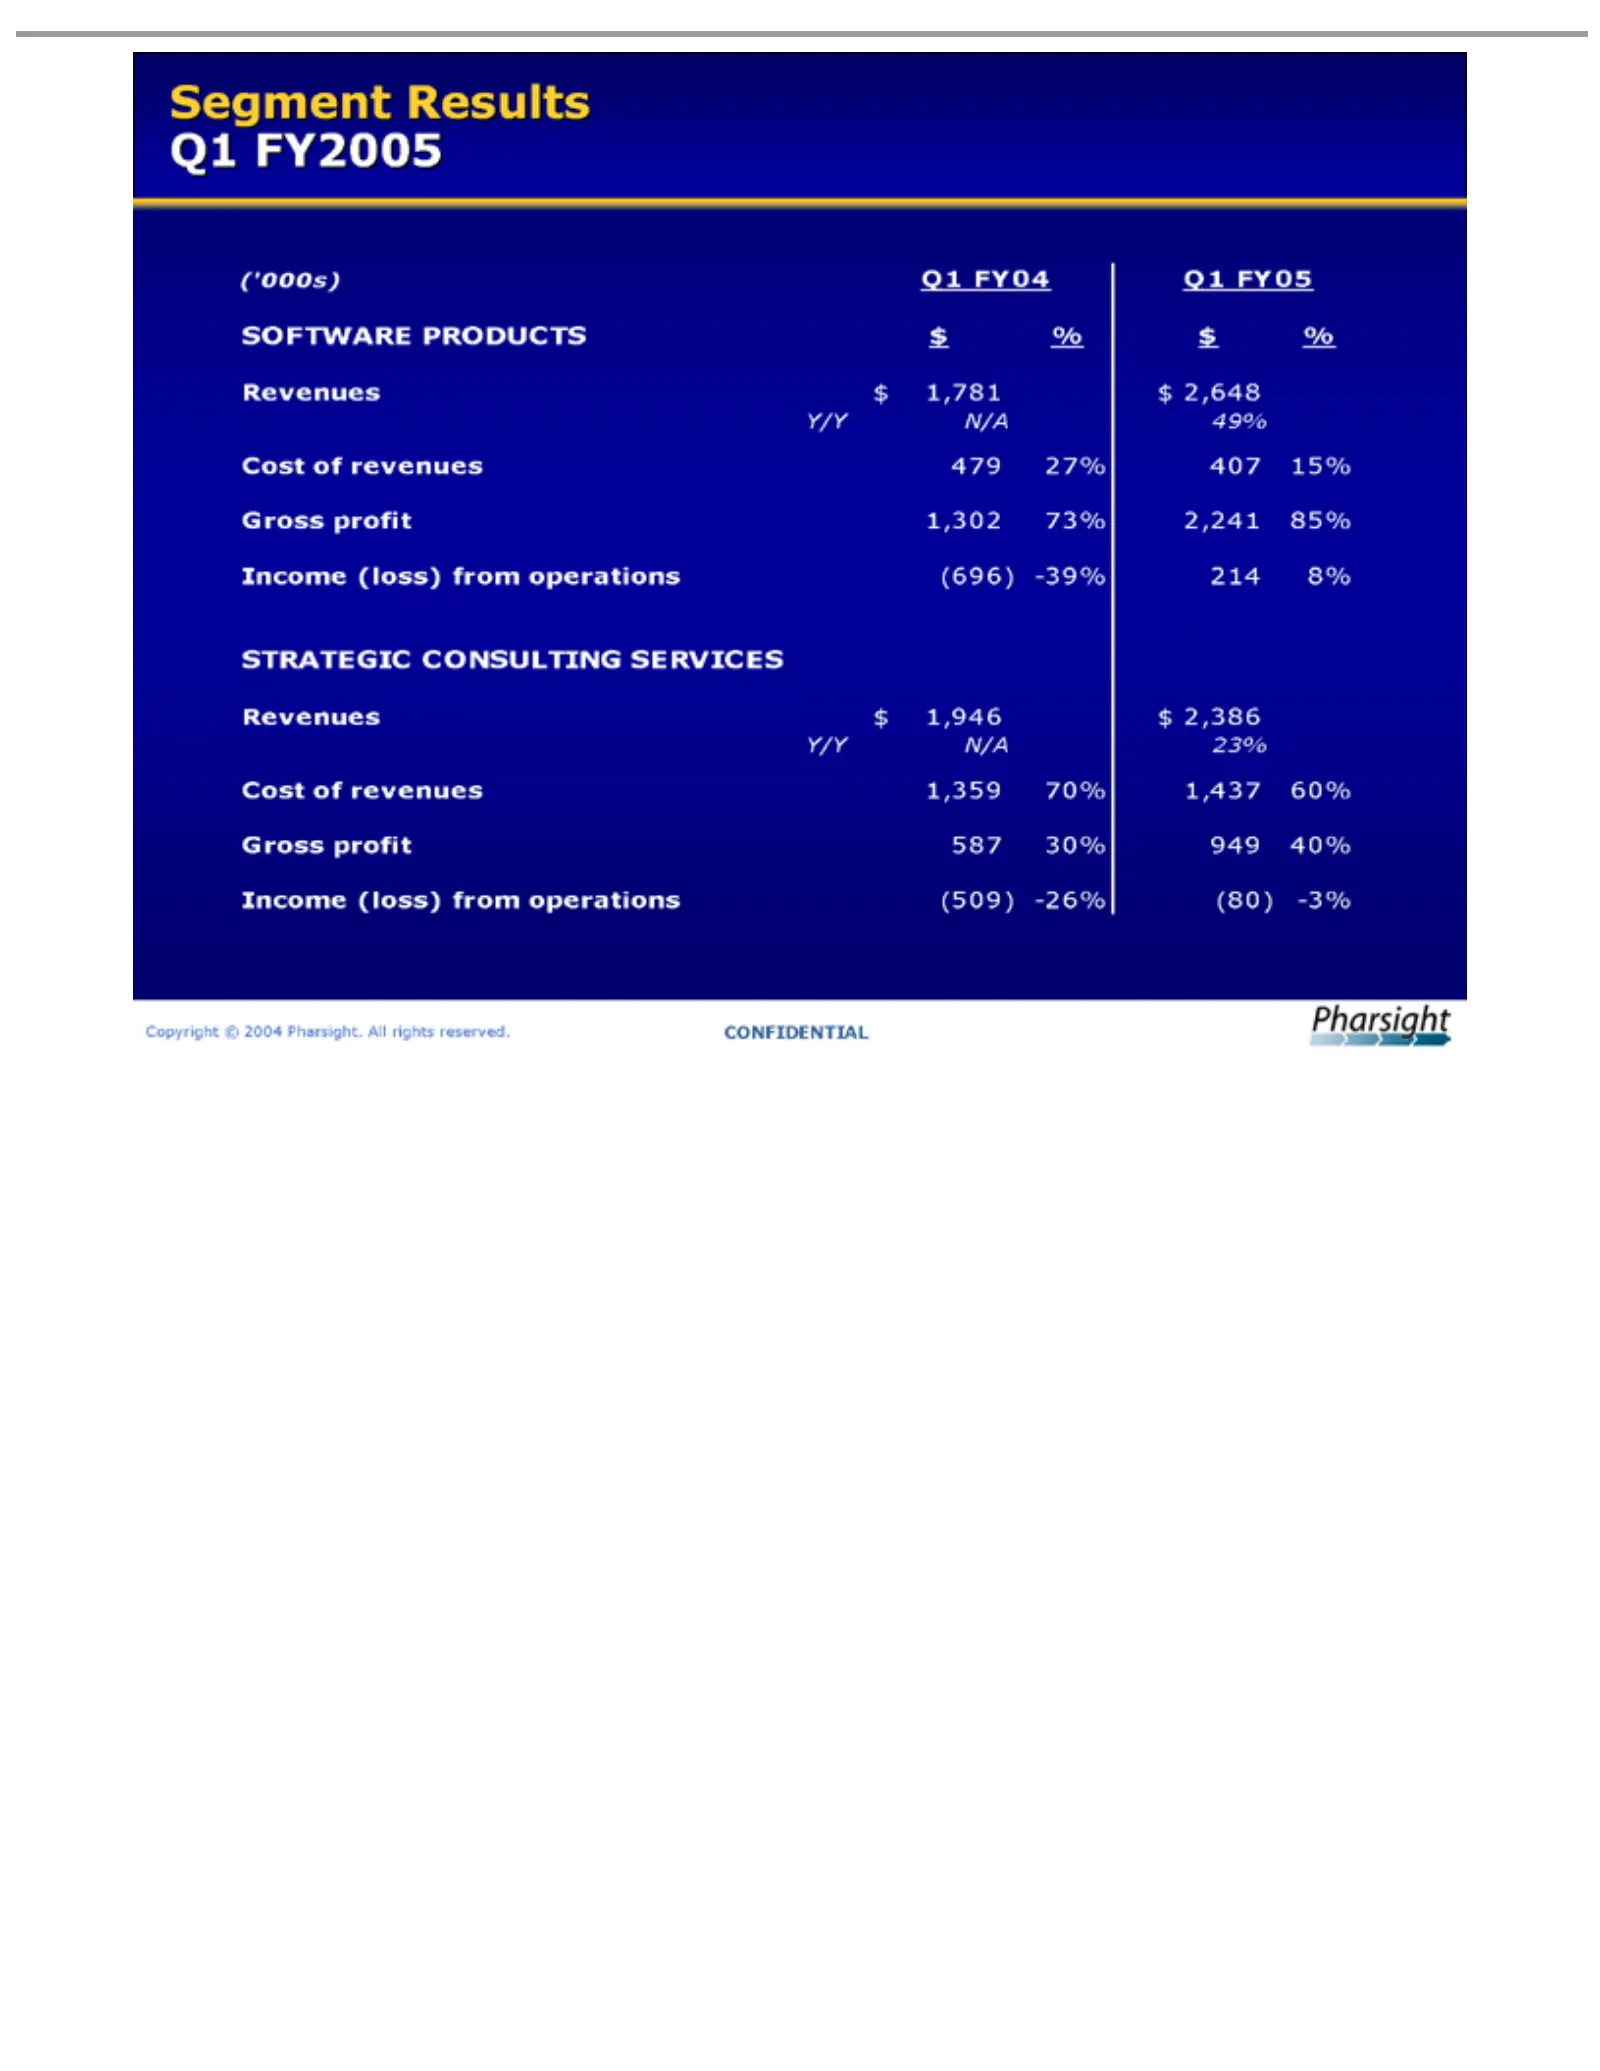
Slide 25: Segment Results
Segment (‘000s) SOFTWARE STRATEGIC Revenues Y/Y Cost Gross Income Copyright N/A ofprofit Q1 revenues (loss) Results 49% 23% $©FY04 1,781 1,946 1,302 587 2004 PRODUCTS CONSULTING from 30% Q1 479 1,359 Q1 $73% Pharsight. operations 2,648 2,386 FY2005 FY05 27% 949 70% 2,241 40% 407 $ 1,437 % All 85% SE
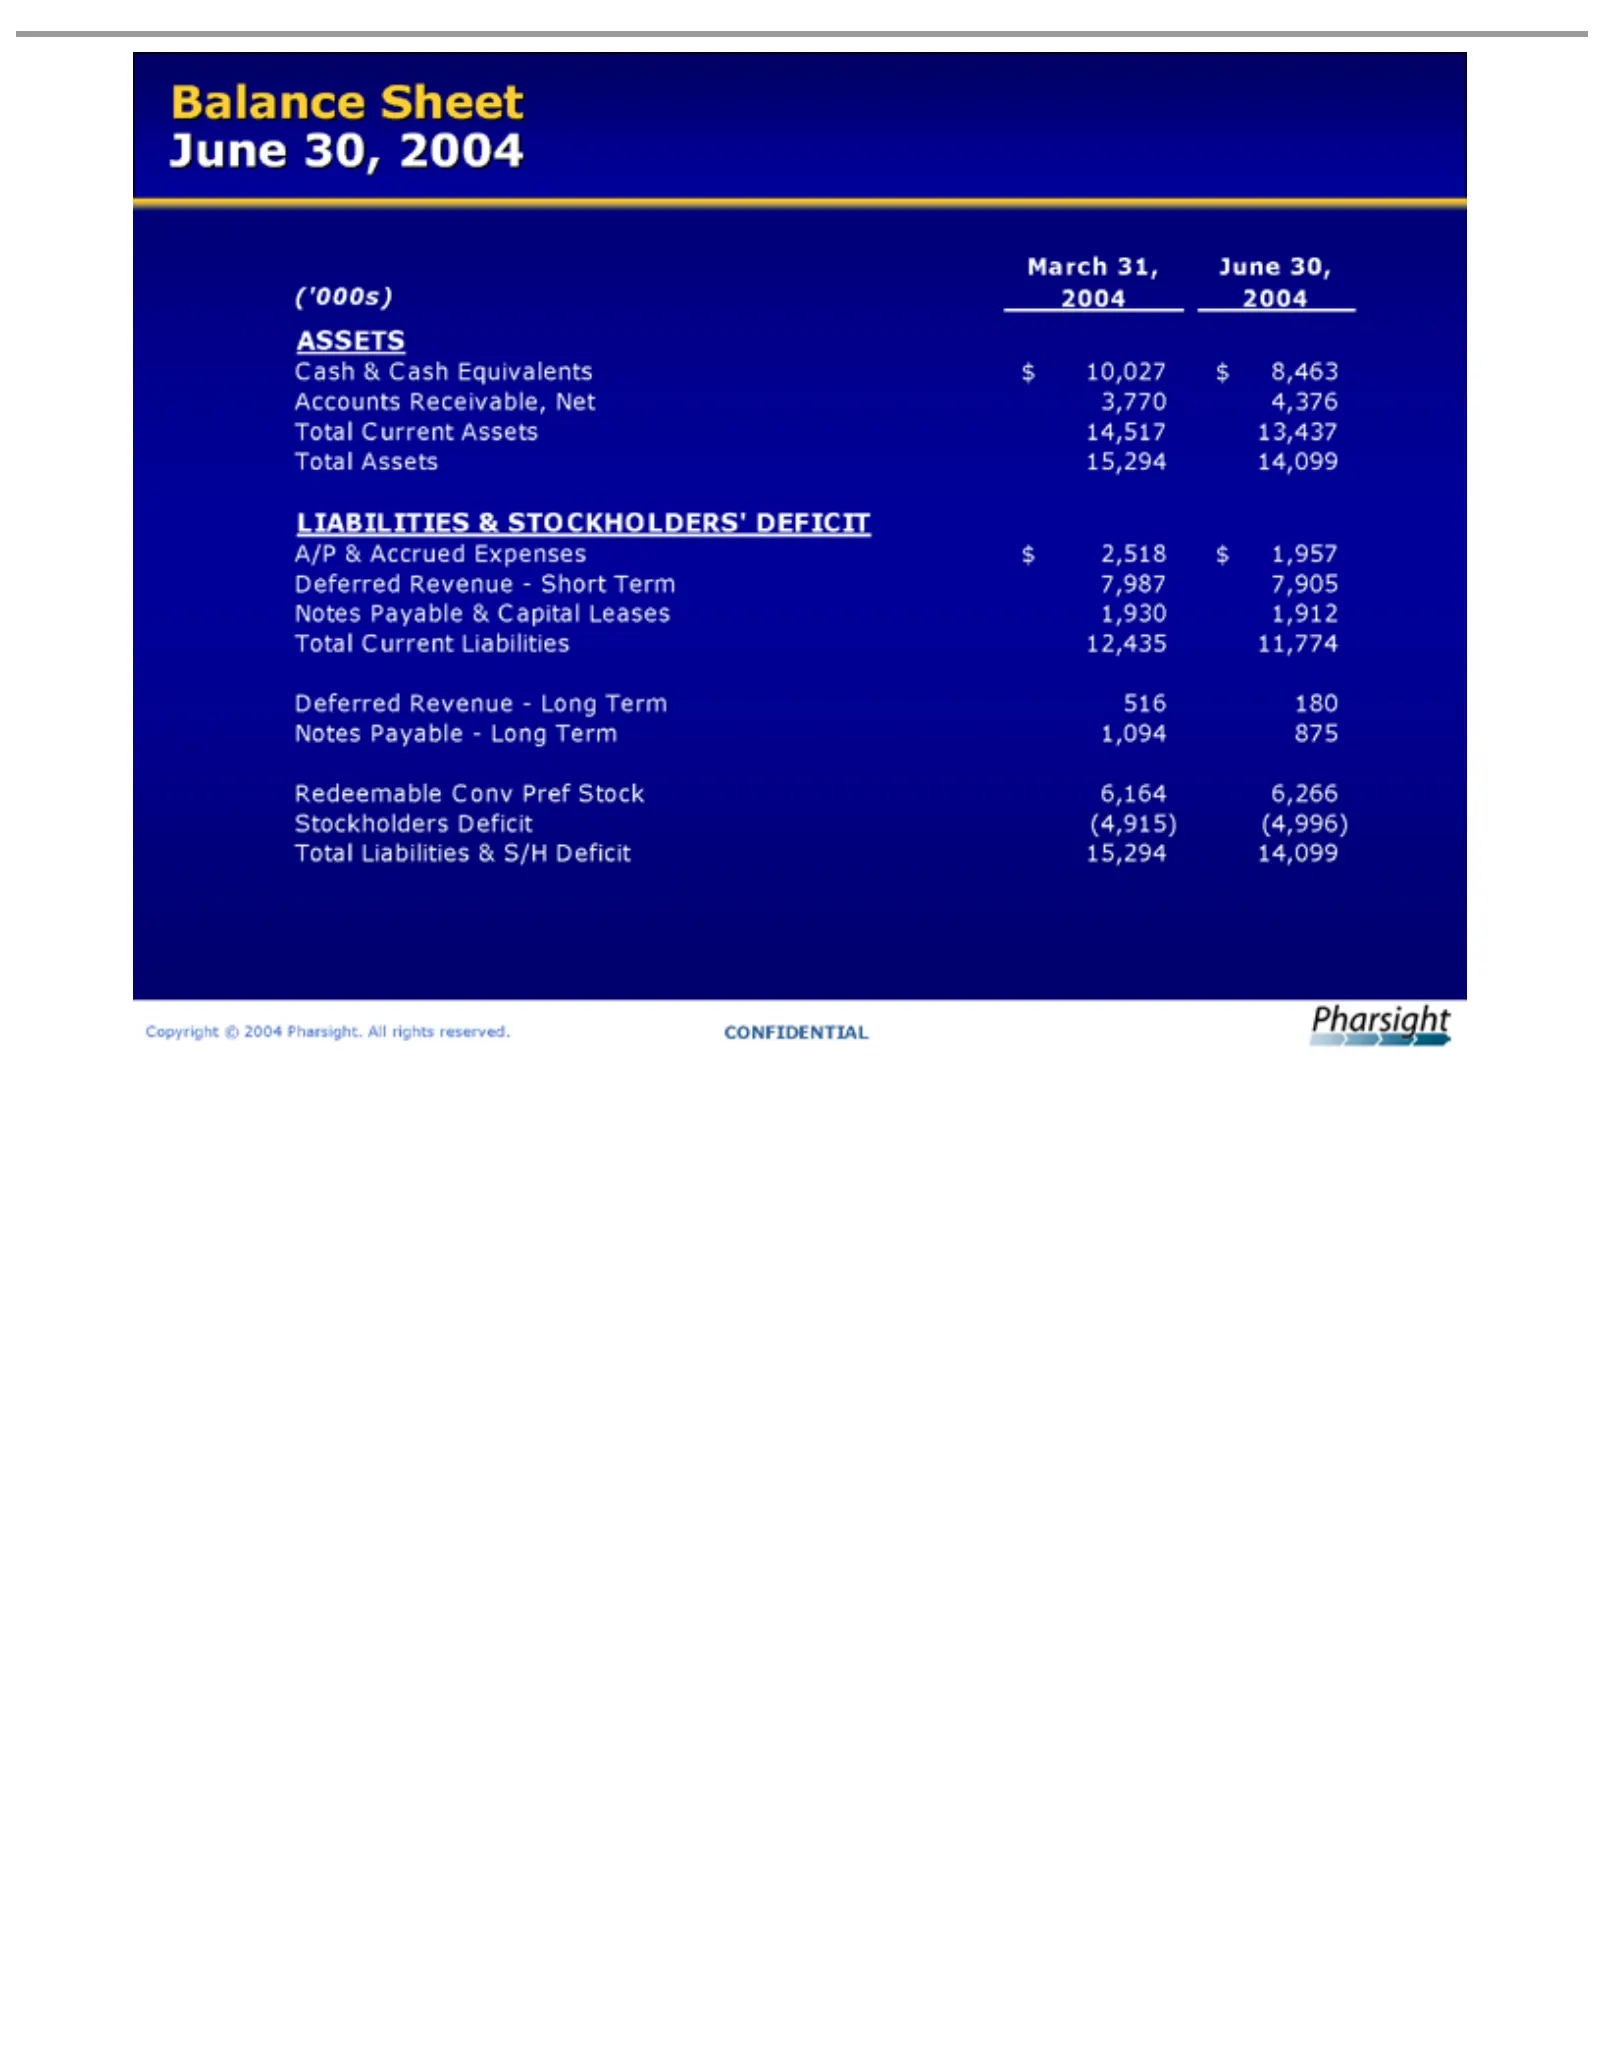
Slide 26: Balance Sheet
Balance (‘000s) Cash ASSETS Accounts LIABILITIES A/P Deferred Notes Redeemable Stockholders Total Copyright &Assets & Current Liabilities Payable Payable—Long Accrued March Cash Sheet Revenue—Short Revenue—Long Receivable, © 15,294 Conv 2004 Deficit Equivalents Assets Liabilities June & 31, Expenses
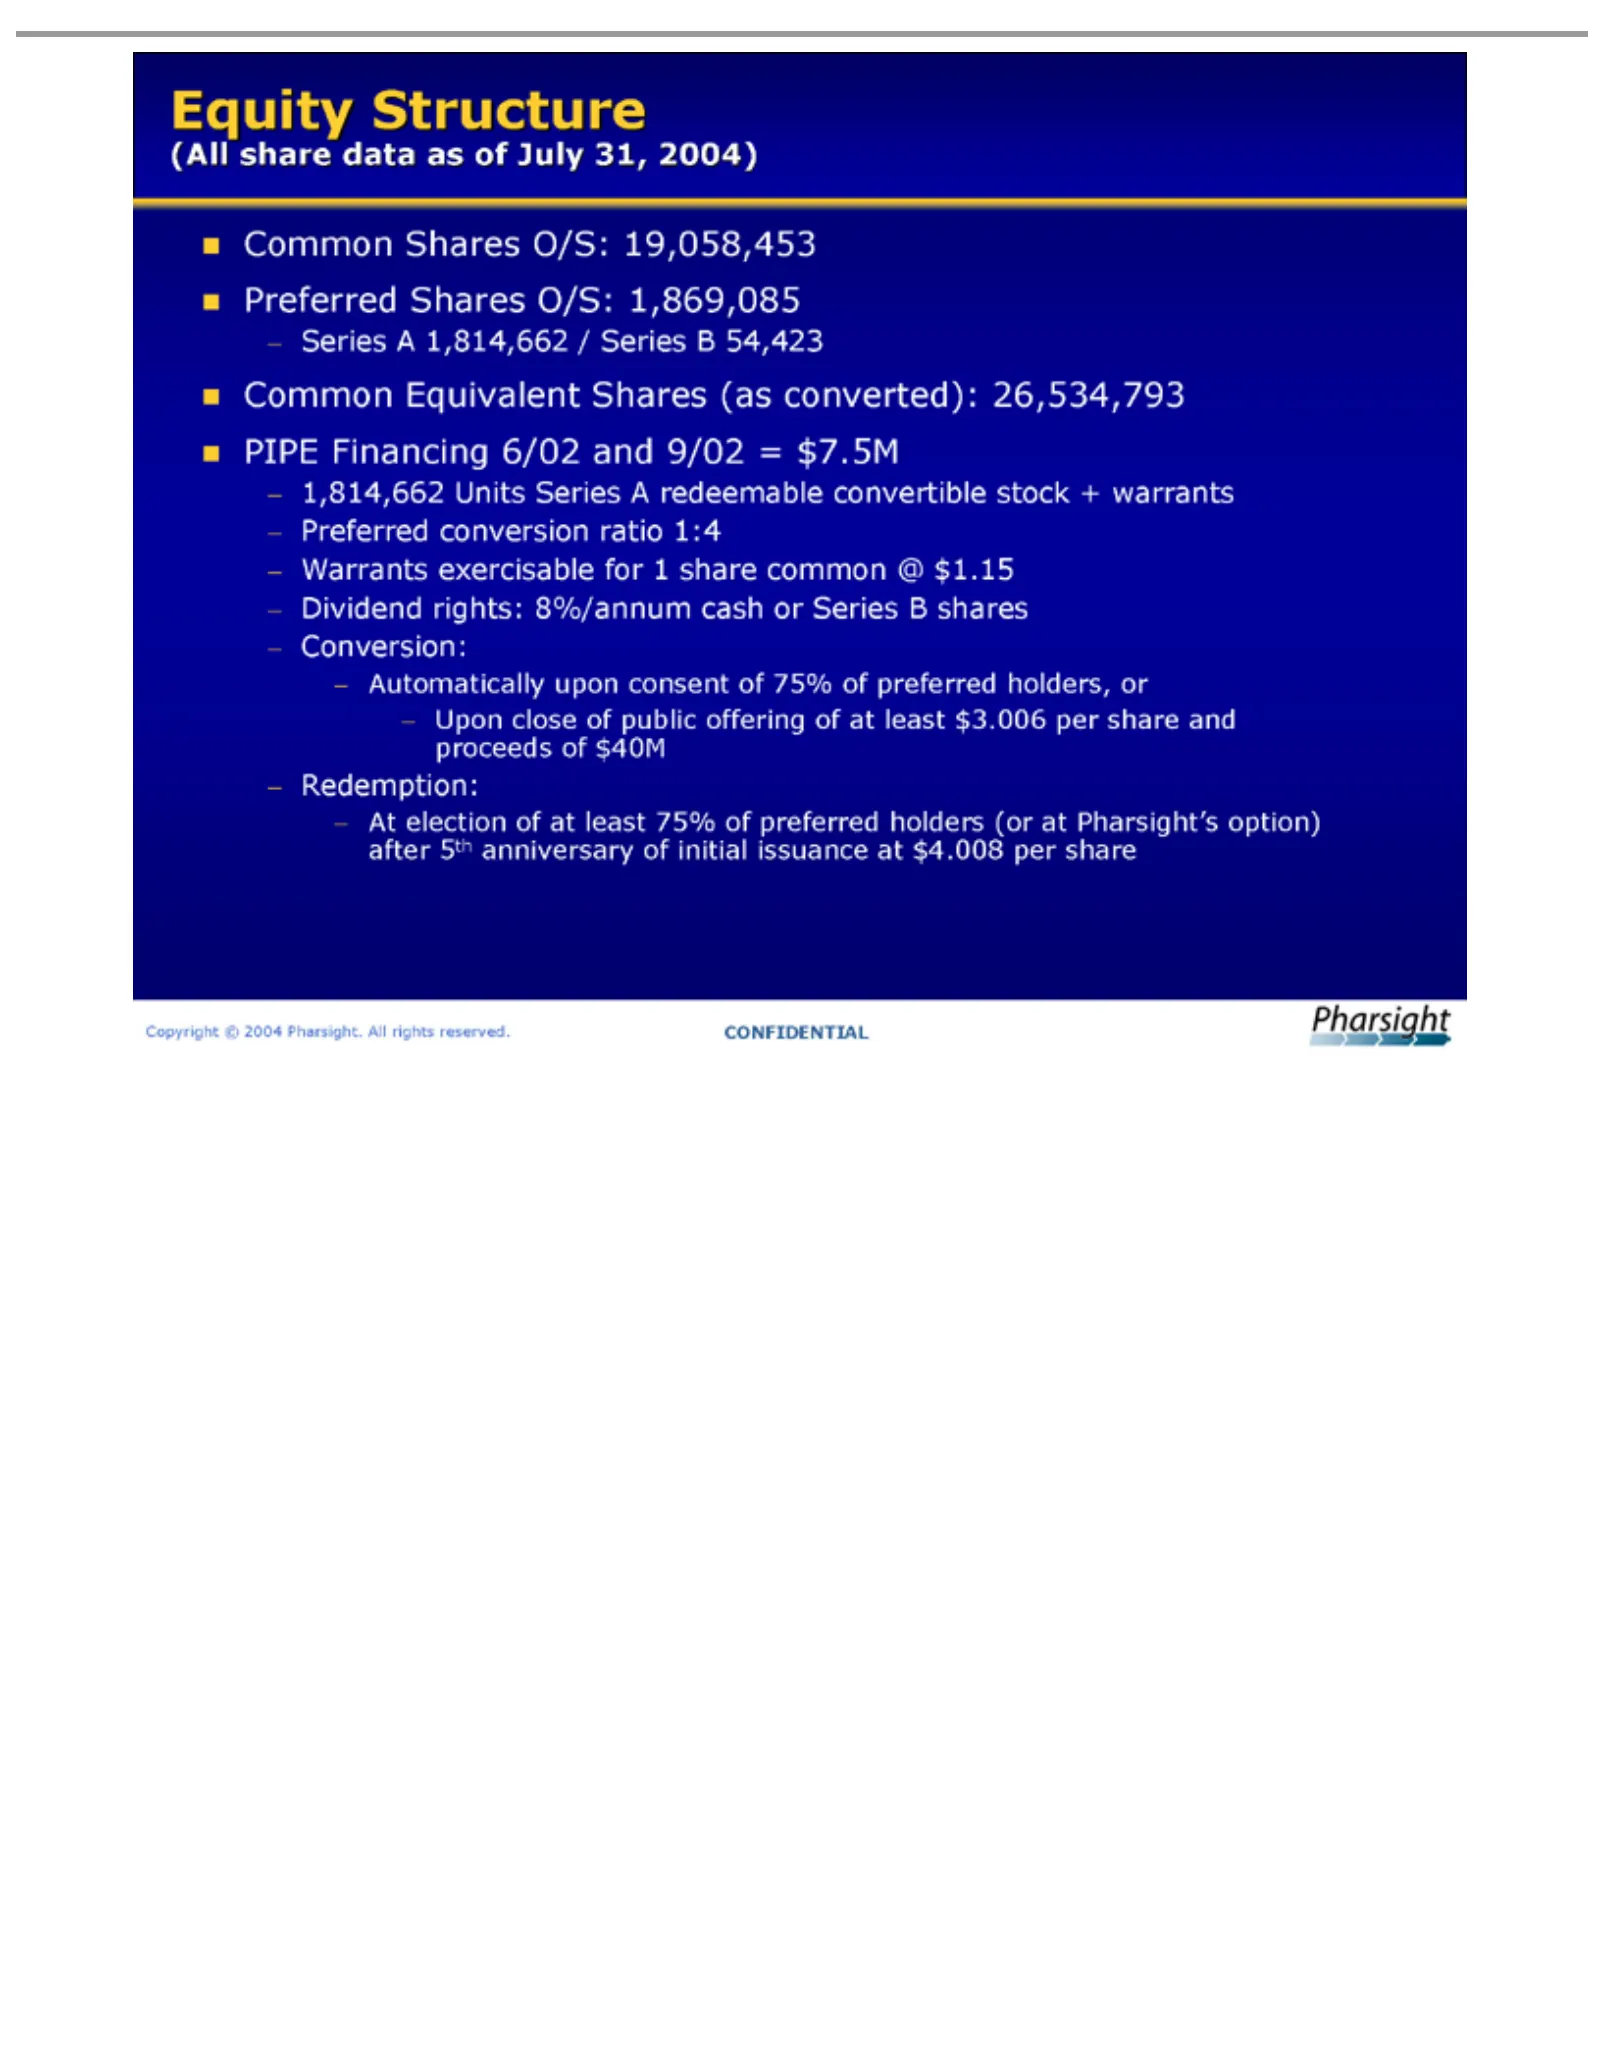
Slide 27: Equity Structure
Equity (All Common ?Preferred Series ?Common PIPE 1,814,662 stock Preferred Warrants Dividend Automatically Conversion: Upon At Redemption: Copyright election share Financing +close AStructure warrants 1,814,662 exercisable conversion rights: Shares data Units © Shares Equivalent of of2004 at public
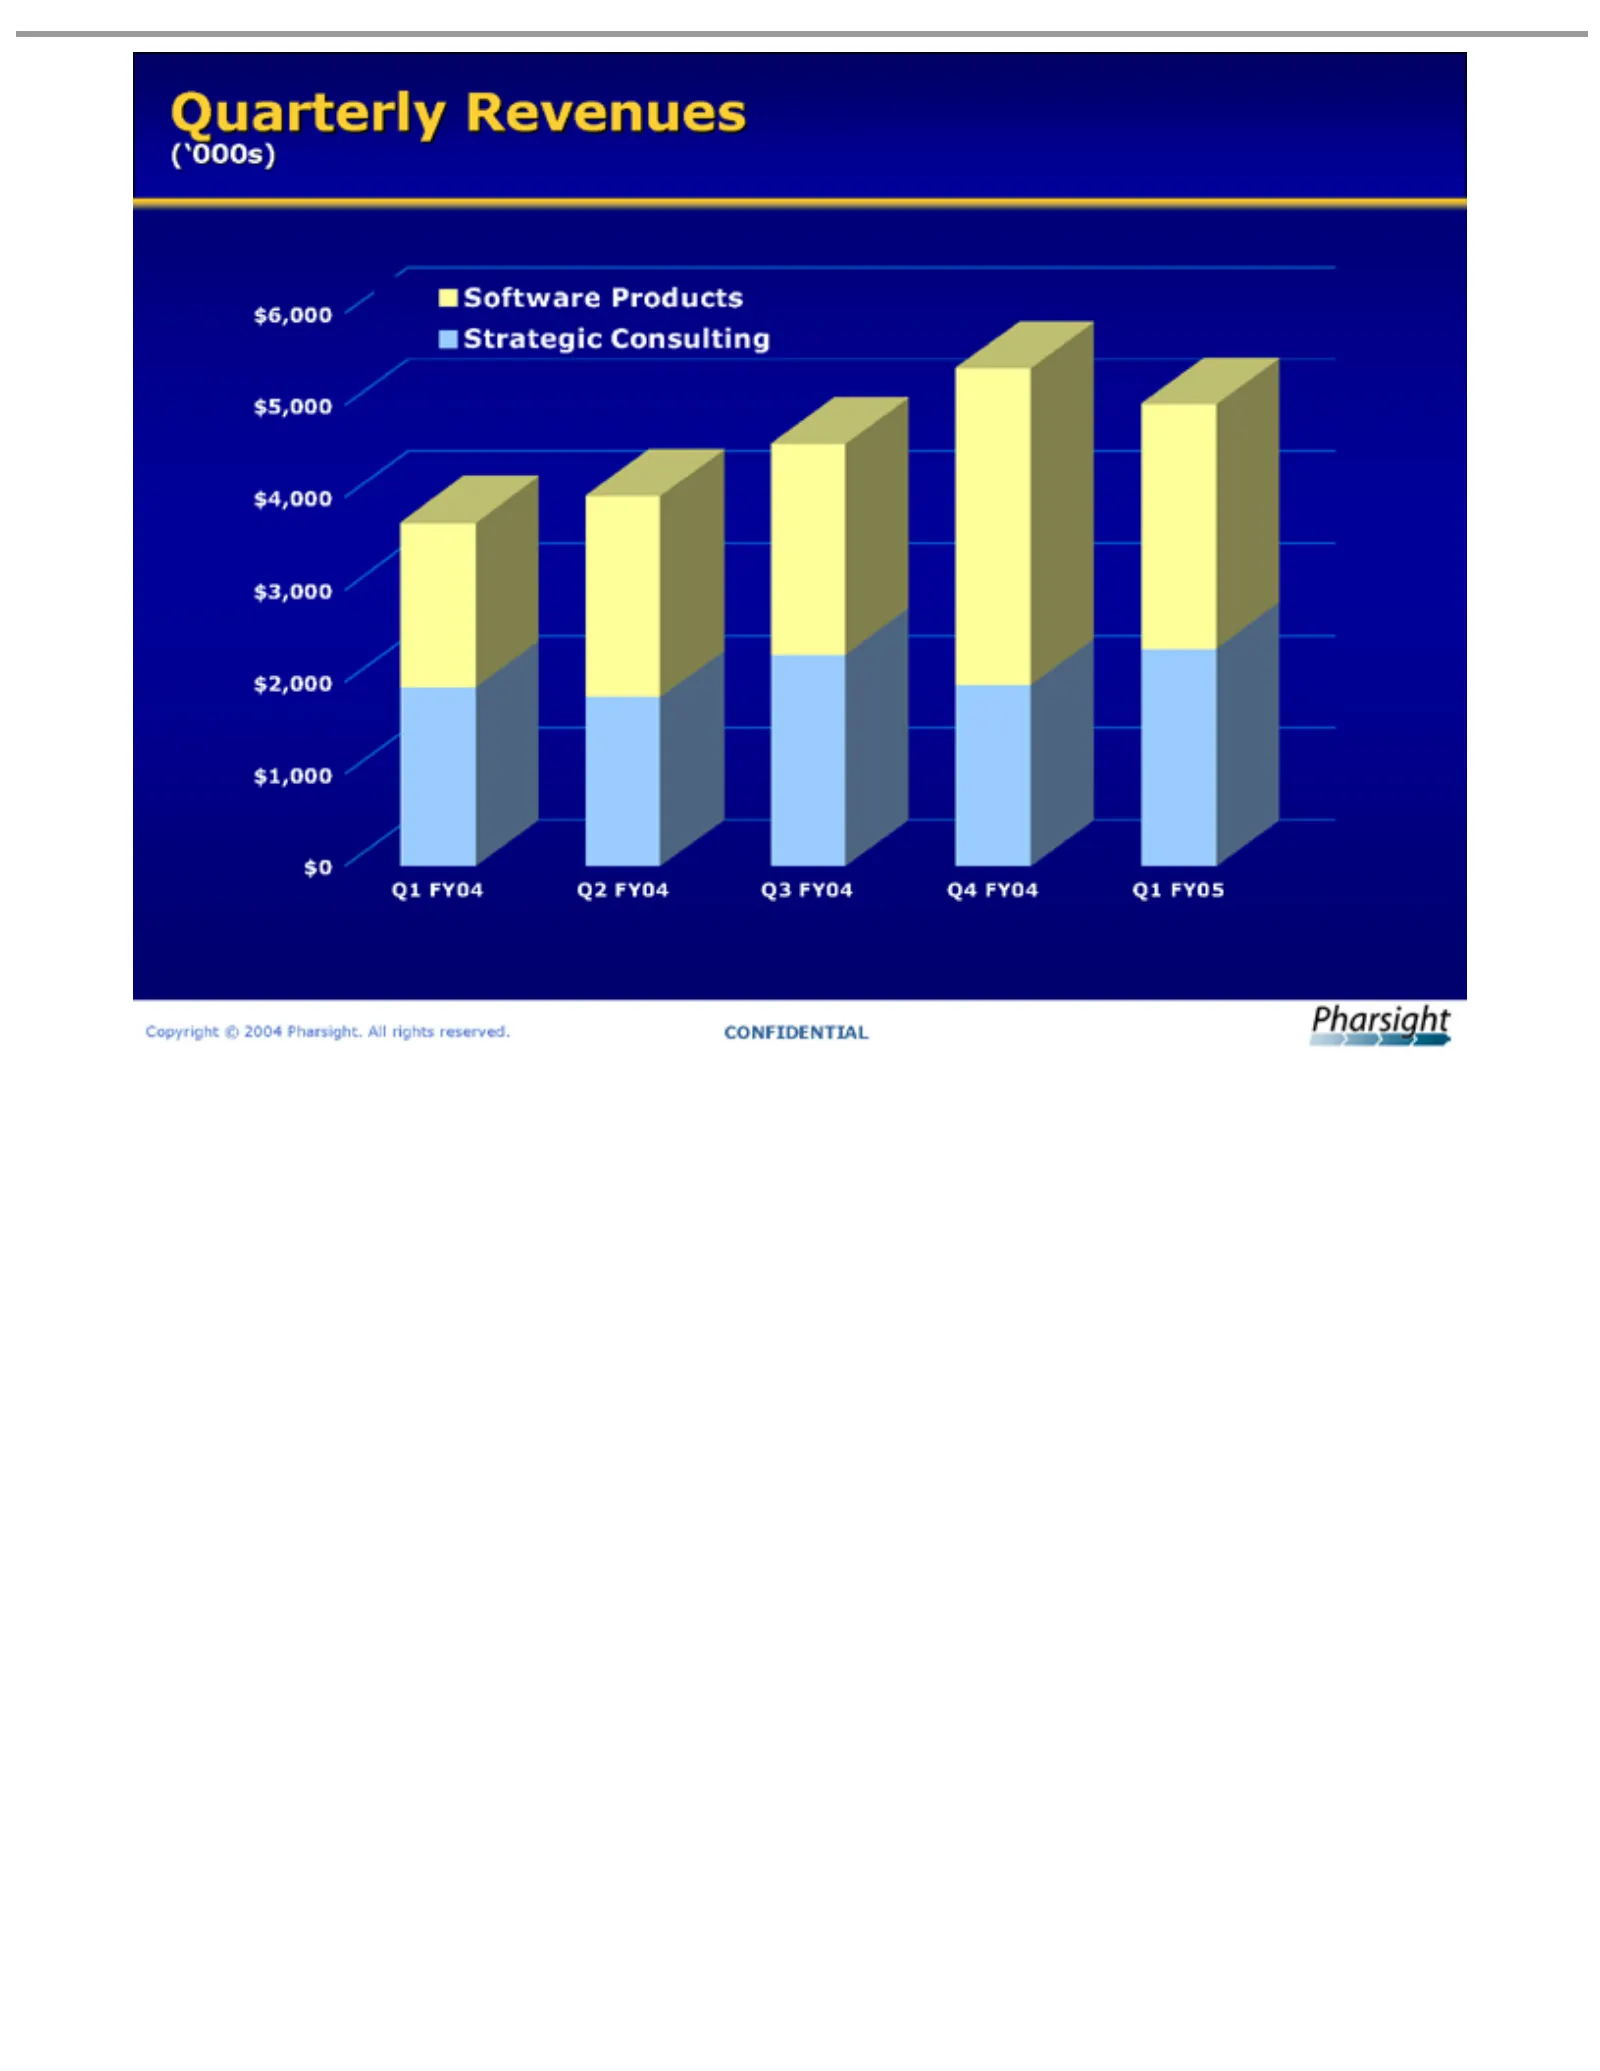
Slide 28: Quarterly Revenues by Segment
Quarterly Software (‘000s) Q1 $0 $1,000 $2,000 $3,000 $4,000 $5,000 $6,000 Copyright FY04 Products Q2 Revenues © 2004 FY04Pharsight. Strategic Q3 FY04Consulting All Q4 rights FY04 reserved. Q1 FY05CONFIDENTIAL
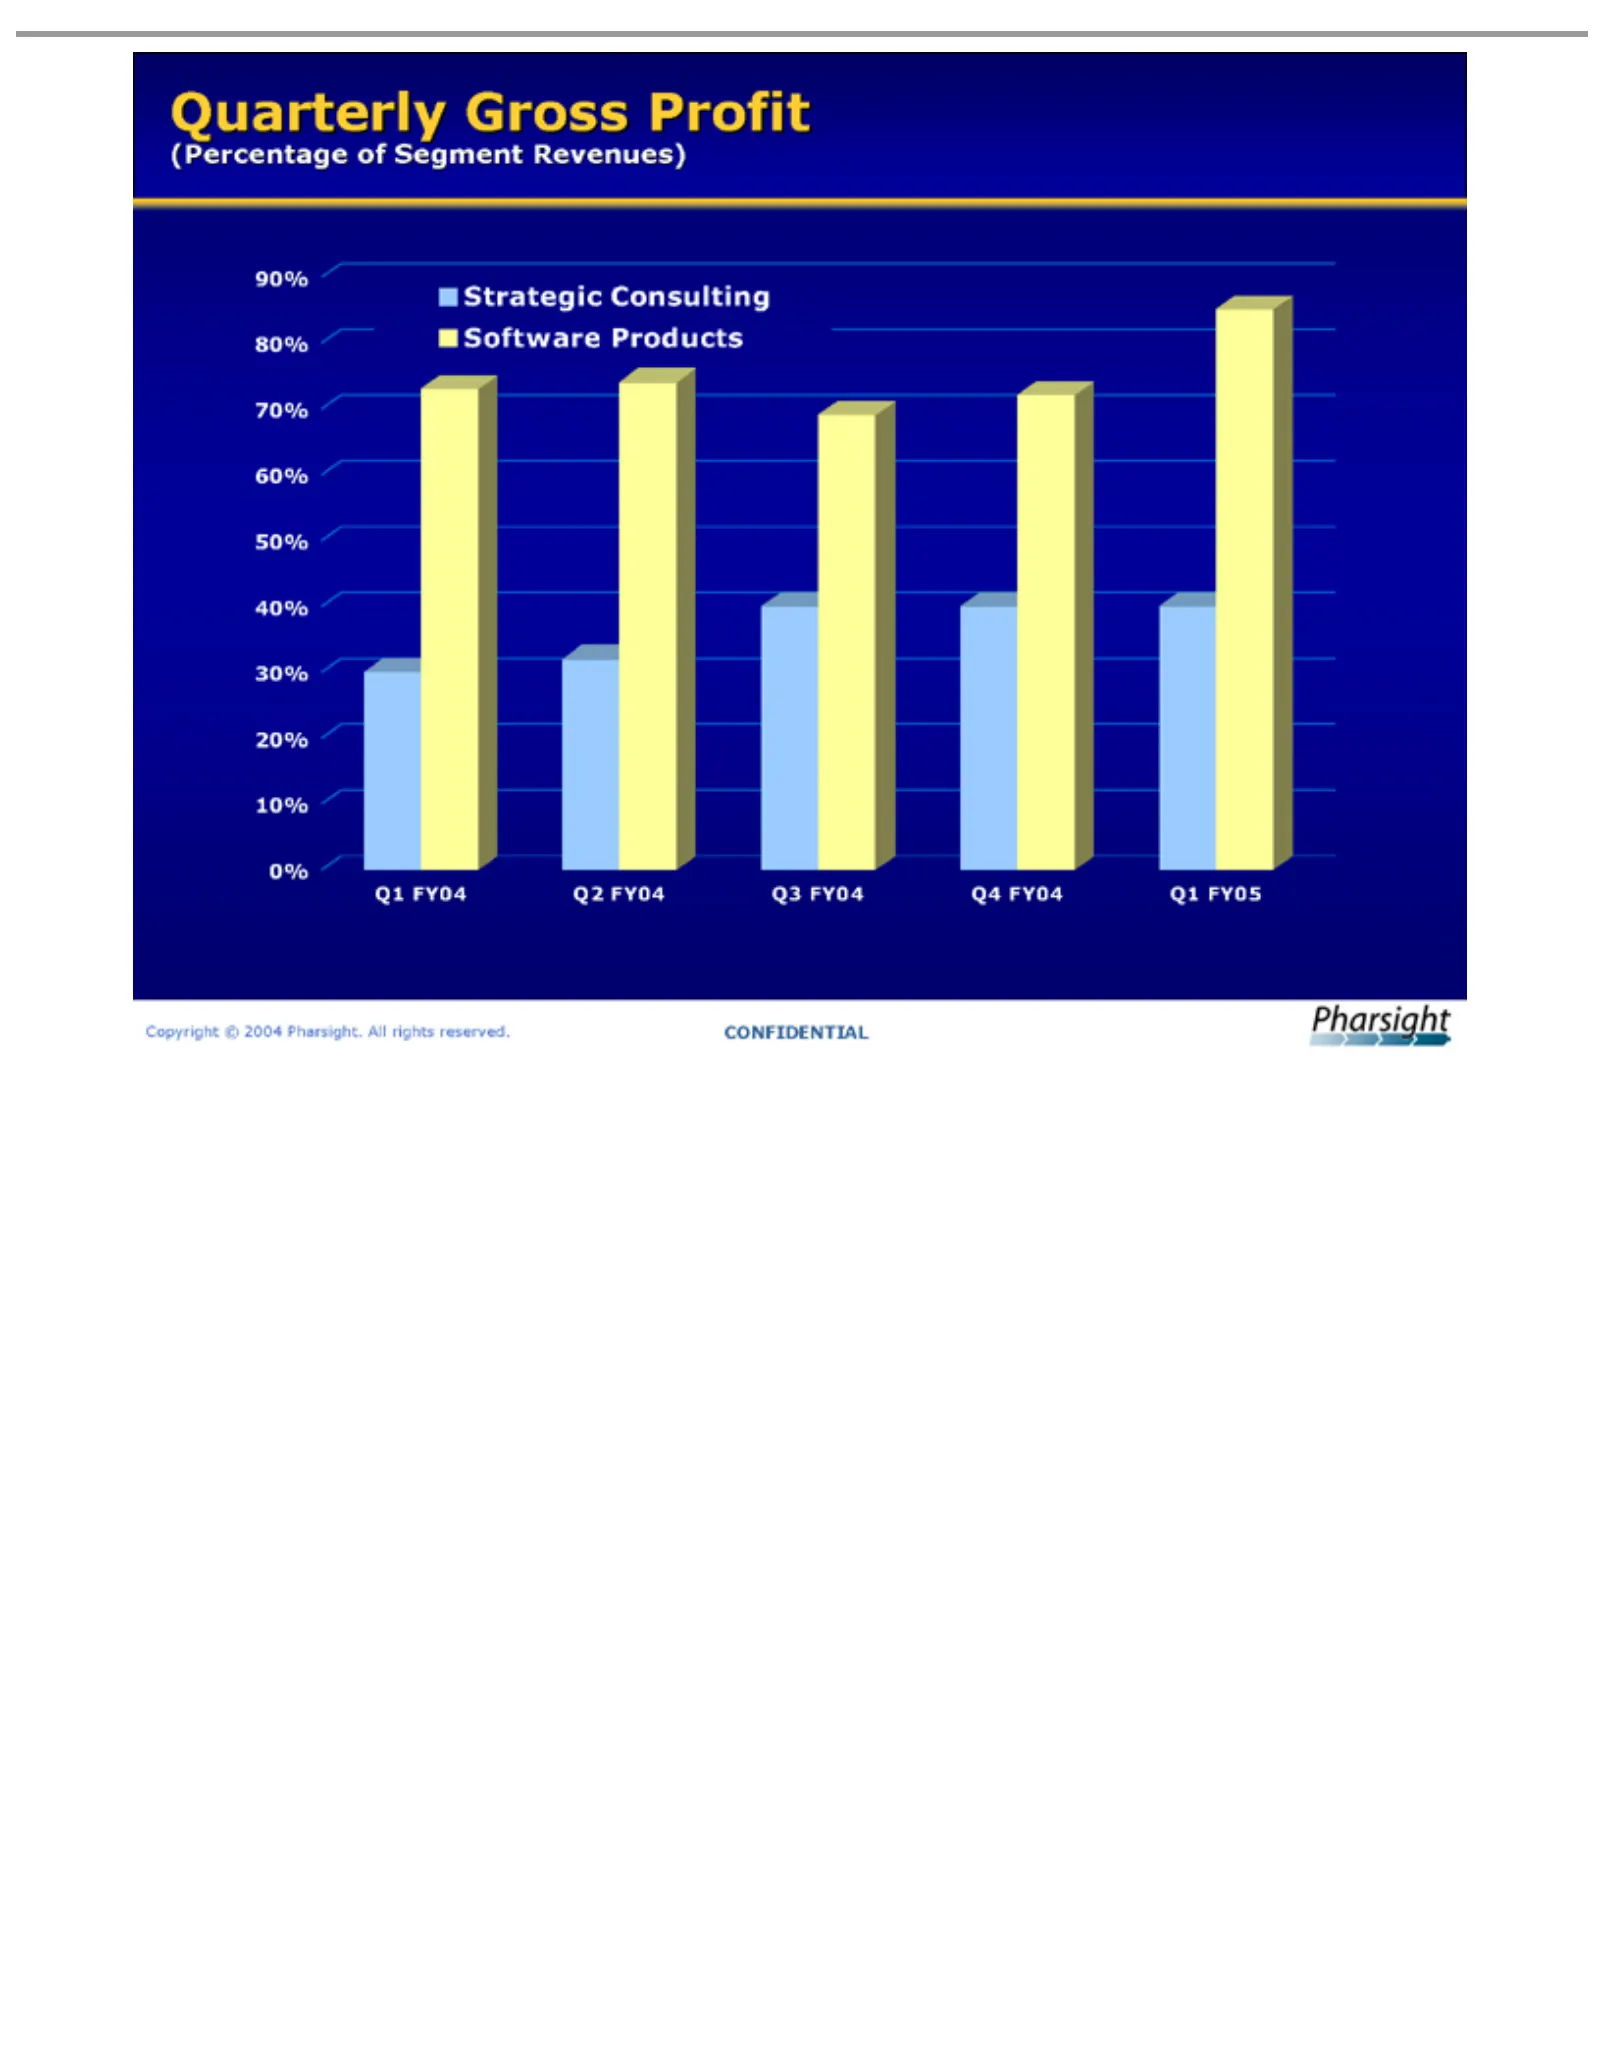
Slide 29: Quarterly Gross Profit by Segment
Quarterly (Percentage Strategic 90% Q1 0% Copyright FY04 80%Consulting Q2 Gross 70% ©of2004 FY04 Segment 60% Profit Pharsight. Q3 50% Software FY04 Revenues) 40%All Q4 Products 30% rights FY04 20% reserved. Q110% FY05CONFIDENTIAL
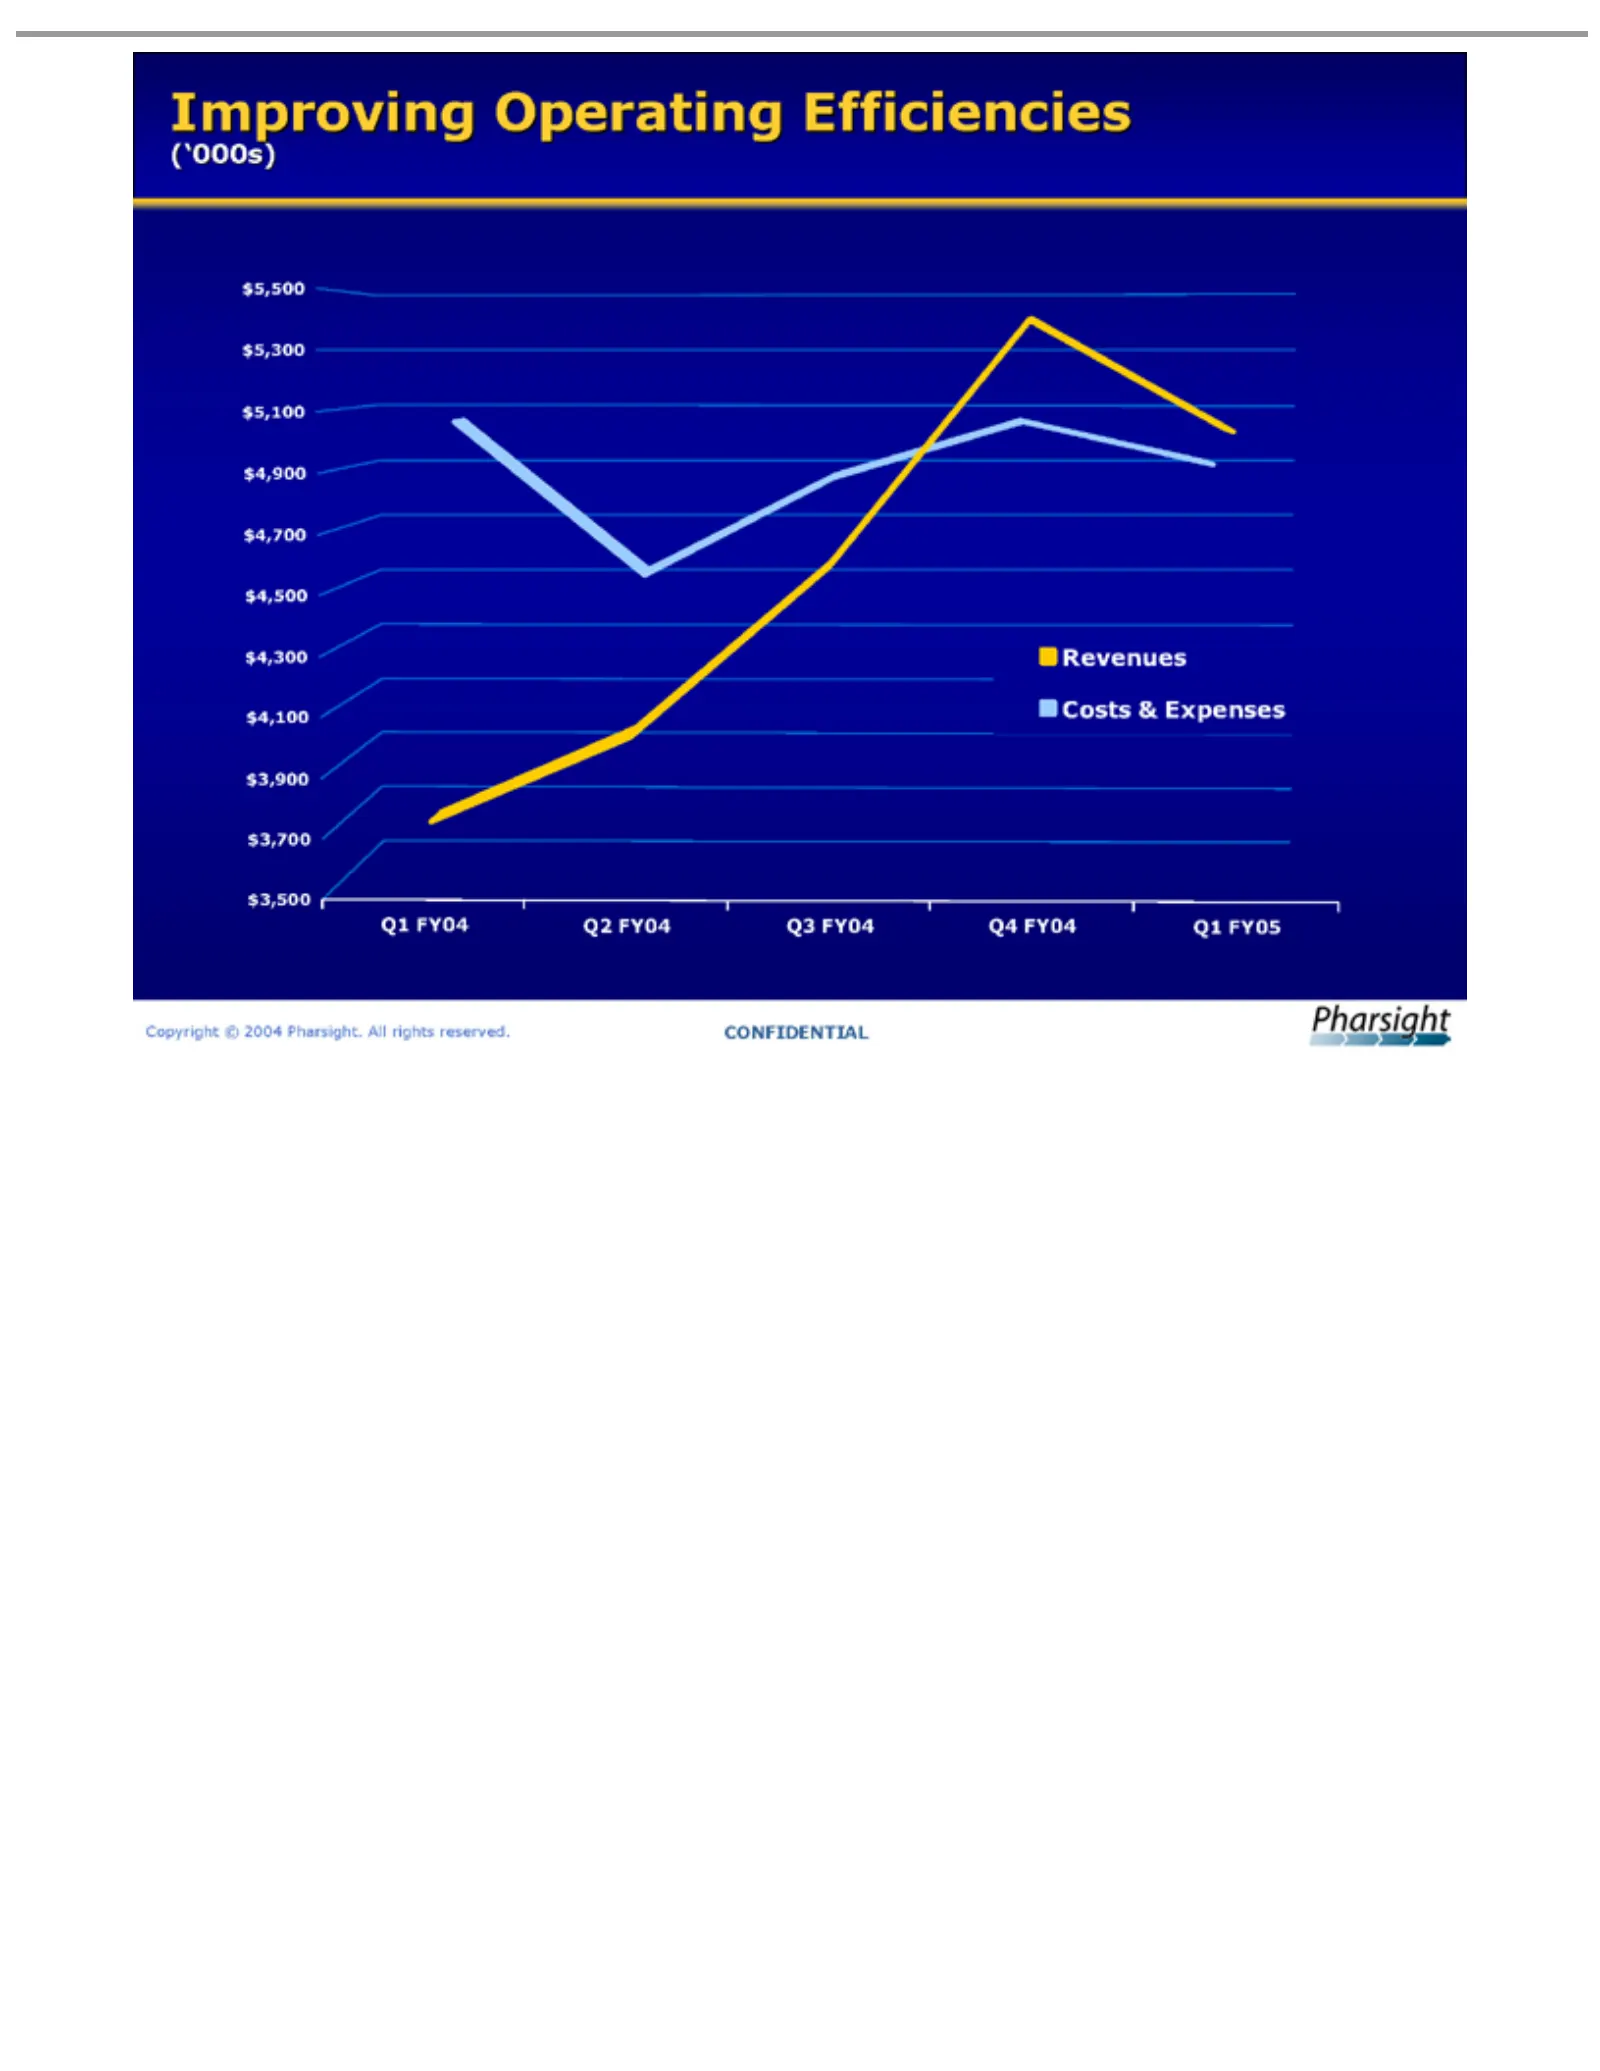
Slide 30: Improving Operating Efficiencies
Improving Revenues (‘000s) Q1 $3,500 $3,700 $3,900 $4,100 $4,300 $4,500 $4,700 $4,900 $5,100 $5,300 $5,500 Copyright FY04 Q2 Costs ©Operating 2004 FY04 & Pharsight. Expenses Q3Efficiencies FY04 All Q4 rights FY04 reserved. Q1 FY05CONFIDENTIAL
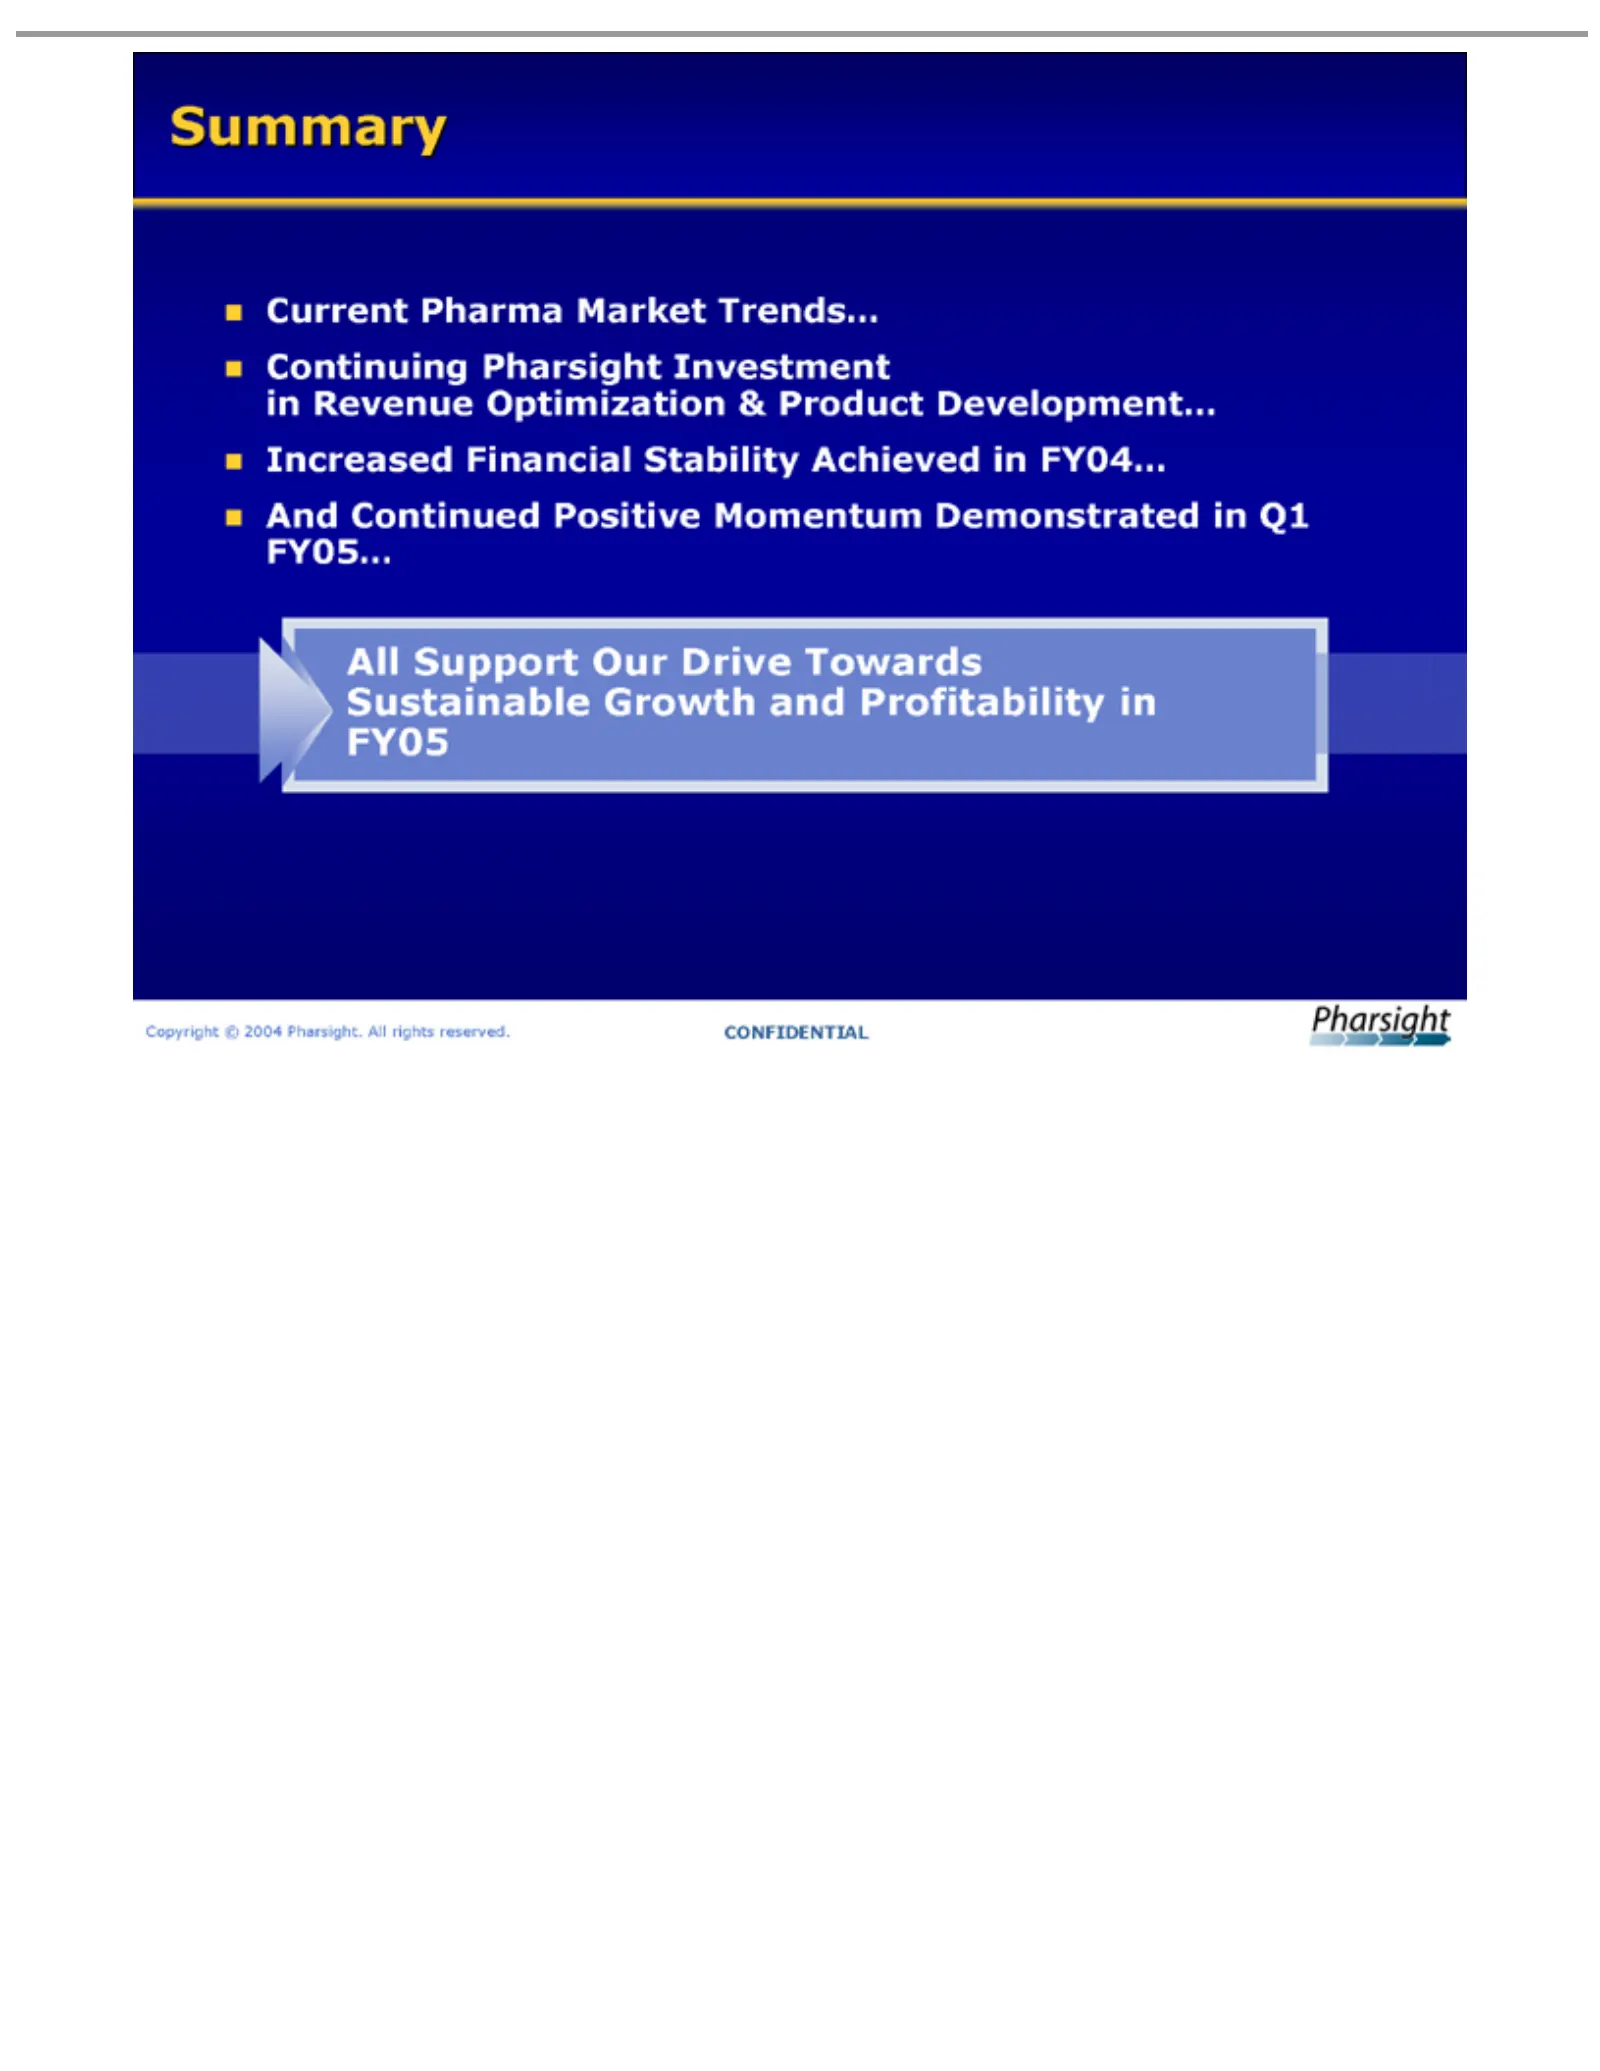
Slide 31: Summary
Current Summary Continuing Increased And All Sustainable Copyright FY05Support Continued Pharma Financial ©Pharsight Growth Our 2004 Positive Market Drive Pharsight. Stability and Investment Towards Trends… Profitability Momentum Achieved All rights in Revenue Demonstrated inin reserved. FY04… Optim
Slide 32: Proprietary Notices
Proprietary Notices No Pharsight TM, All Copyright part contents other DMX ofbrand Corporation. © this TM Notice Copyright 2004 document andPharsight. Trial product WinNonLin® ©2004 Simulator may names All be Pharsight rights reproduced are TMand trademarks reserved. are Corporation. Pharsight® trad

Slide 33: Pharsight
Pharsight
Source: SEC EDGAR · 8-K filed Aug 17, 2004
More decks from Pharsight Corp
 Q4 2007 Earnings Presentation45 slides · May 14, 2007
 Investor Presentation (January 2007)41 slides · Jan 26, 2007
 Q2 2007 Earnings Presentation33 slides · Nov 30, 2006
 Q1 FY2007 Earnings Presentation37 slides · Aug 3, 2006
 Investor Presentation (June 2006)36 slides · Jun 6, 2006
 Investor Presentation (February 2006)31 slides · Feb 2, 2006