Teppco Partners LP — Investor Presentation (February 2005)
33 slides from Teppco Partners LP's investor presentation, Feb 14, 2005
Slide 1: TEPPCO Partners, L.P. Analyst and Investor Presentation
TEPPCO Partners, L.P. Analyst and Investor Presentation February 2005
Slide 2: Forward-looking Statements
Forward-looking Statements m= The material and information furnished in this presentation contains forward-looking statements as such are described within various provisions of the Federal Securities Laws. Forward-looking statements include projections, estimates, forecasts, plans and objectives and
Slide 3: TEPPCO Partners, L.P.
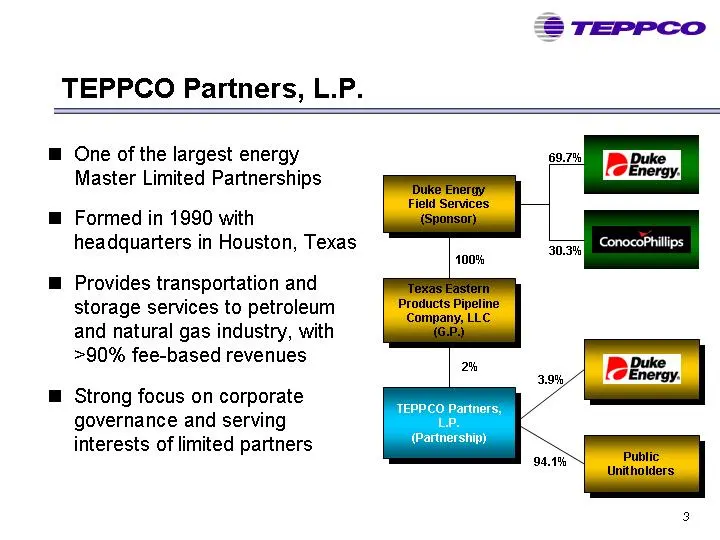
TEPPCO Partners, L.P. m@ One of the largest energy Master Limited Partnerships m@ Formed in 1990 with headquarters in Houston, Texas ™@ Provides transportation and storage services to petroleum and natural gas industry, with >90% fee-based revenues ™@ Strong focus on corporate governance and serving
Slide 4: 2004 Achievements
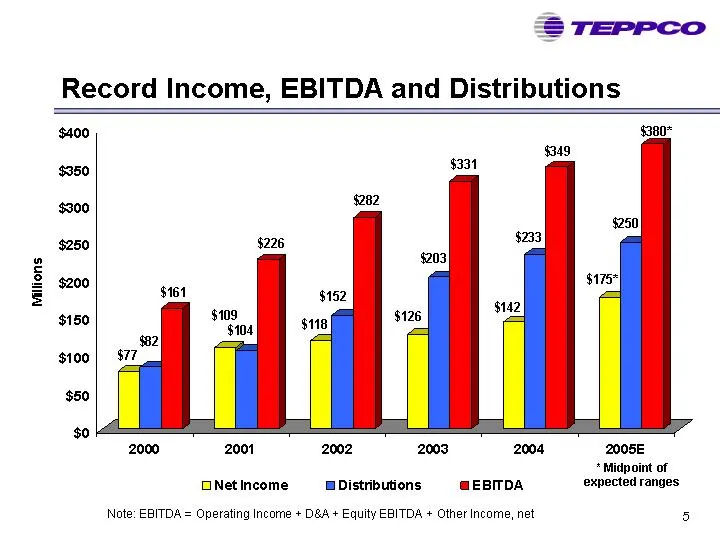
2004 Achievements Solid performance across all business segments EBITDA growth to $349 million, 6% above prior year Distribution increase to $2.65/unit; 5.6% growth in distributions paid Organic growth projects in 2004 position TEPPCO for further growth — Upstream: completion of Genesis integration
Slide 5: Record Income, EBITDA and Distributions
Record Income, EBITDA and Distributions Millions $400 $349 $350 $300 $250 $200 $150 $100 $50 $0 2000 2001 2002 2003 2004 2005E * Midpoint of DNetincome = WDistributions = @ EBITDA expected ranges Note: EBITDA = Operating Income + D&A + Equity EBITDA + Other Income, net 5
Slide 6: Substantial Asset Growth
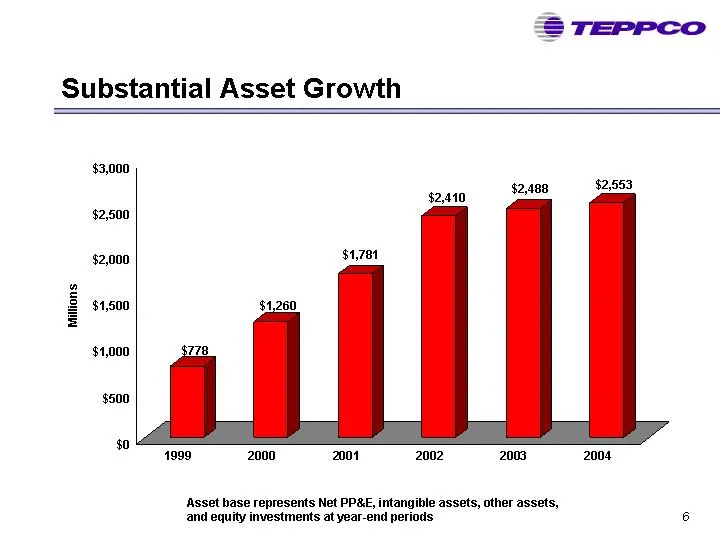
Substantial Asset Growth $3,000 $2,500 $2,000 $1,500 $1,000 $500 $0 1999 2000 2001 2002 2008 2004 Asset hase represents Net PP&E, intangible assets, other assets, ‘and equity investments at year-end periods 6
Slide 7: Volume Growth & Diversification
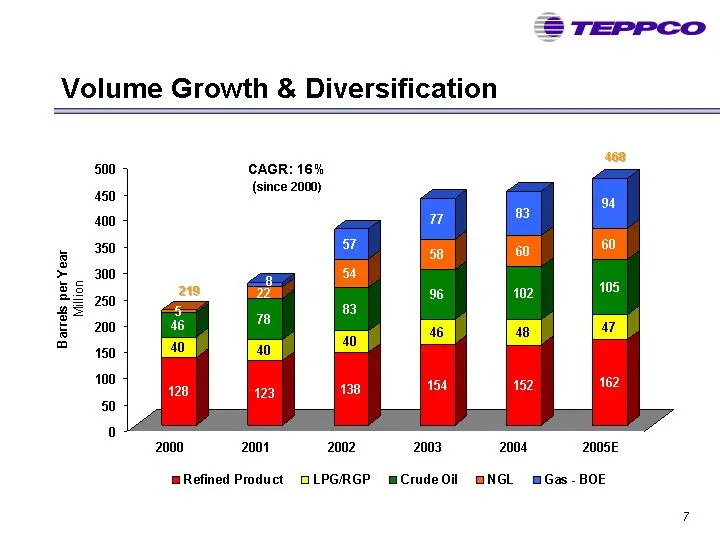
Volume Growth & Diversification CAGR: 16% (since 2000) Barrels per Year Million 2000 2001 2002 2003 2004 2005E Refined Product GLPGRGP mCrudeOil NGL mGas-BOE
Slide 8: The TEPPCO Systems
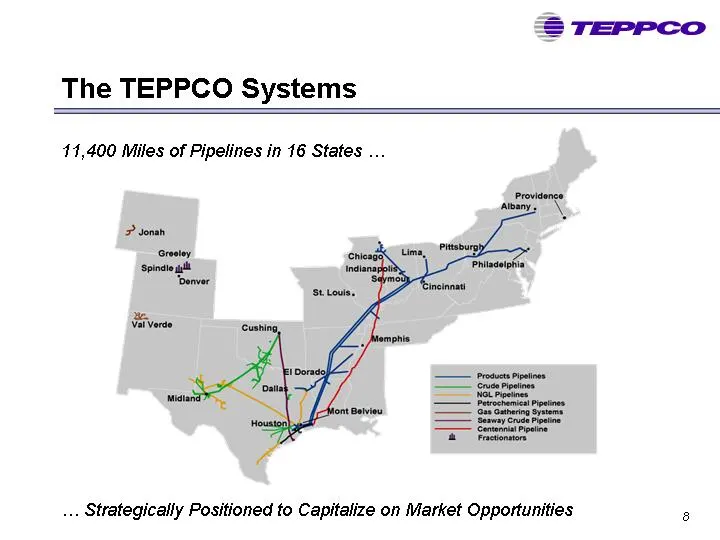
The TEPPCO Systems 11,400 Miles of Pipelines in 16 States ... ... Strategically Positioned to Capitalize on Market Opportunities 8
Slide 9: TEPPCO's Three Business Segments
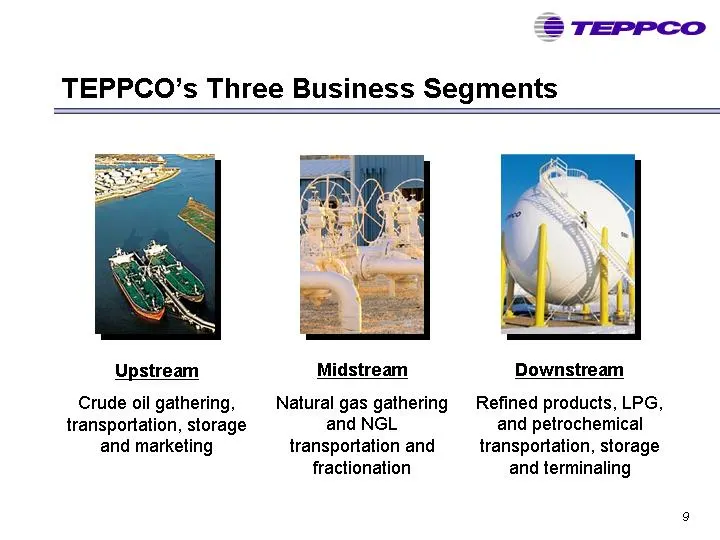
TEPPCO’s Three Business Segments Upstream Midstream Downstream Crude oil gathering, Natural gas gathering Refined products, LPG, transportation, storage and NGL and petrochemical and marketing transportation and transportation, storage fractionation and terminaling
Slide 10: TEPPCO Corporate Strategy
TEPPCO Corporate Strategy @ Focus on internal growth prospects — Increase throughput on our pipeline systems — Expand/upgrade existing assets and construct new pipeline and gathering systems ™ Target accretive acquisitions in our core businesses that provide attractive growth potential — Utilize com
Slide 11: TEPPCO's Upstream Business
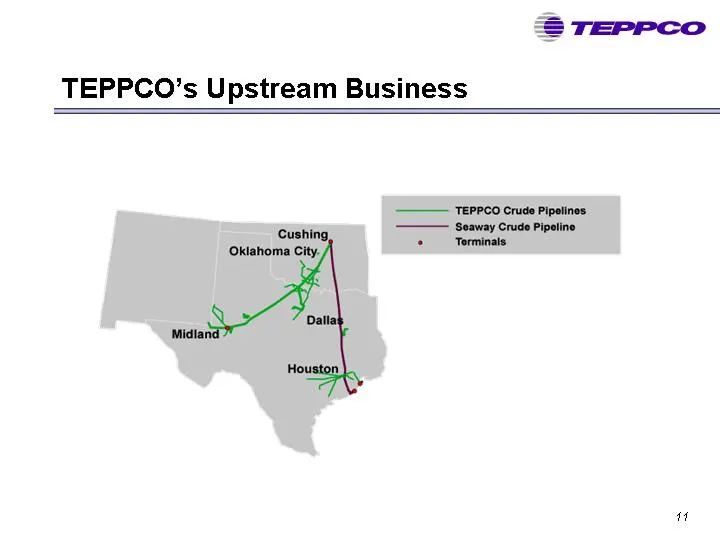
TEPPCO’s Upstream Business —— TEPPCO Crude Pipelines Seaway Crude Pipeline © Terminals f
Slide 12: Upstream EBITDA Contribution
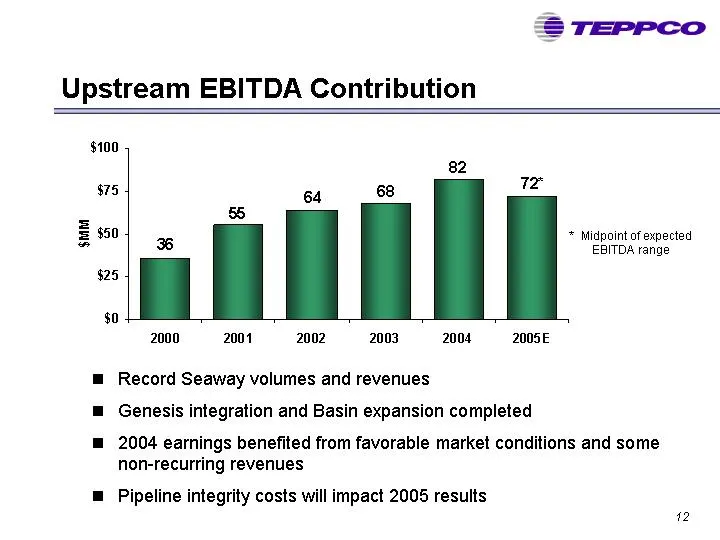
, Upstream EBITDA Contribution $100 82 7 $75 64 68 a 5 5 $50 * Midpoint of expected * 36 EBITDA range $25 $0 2000 2001 2002 2003 2004 2005E m@ Record Seaway volumes and revenues ™ Genesis integration and Basin expansion completed ™ 2004 earnings benefited from favorable market conditions and some no
Slide 13: Upstream Strategy
Upstream Strategy m@ Improve and expand services around existing asset base — Focus activity in West Texas, South Texas and Red River areas @ Realize full potential of Seaway assets — Aggressively market Seaway mainline capacity, with focus on alignment with key refiners and suppliers — Maximize val
Slide 14: TEPPCO's Midstream Business
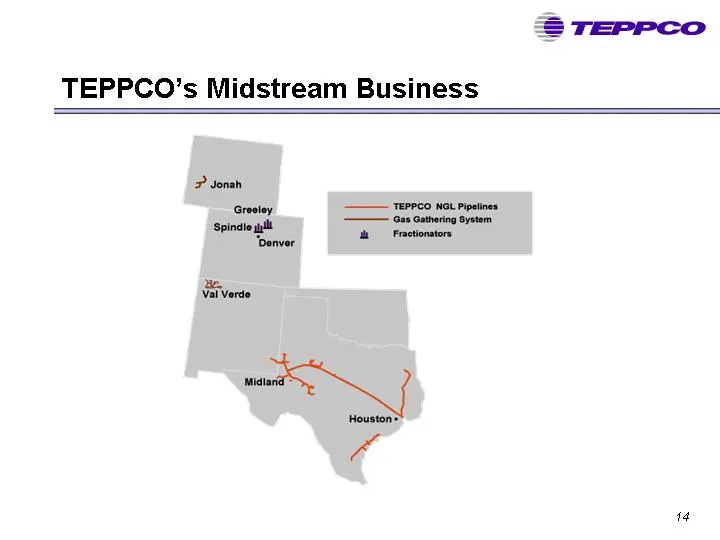
TEPPCO’s Midstream Business P Jonah - FESS = Sein 7 2 Be 14
Slide 15: Midstream EBITDA Contribution
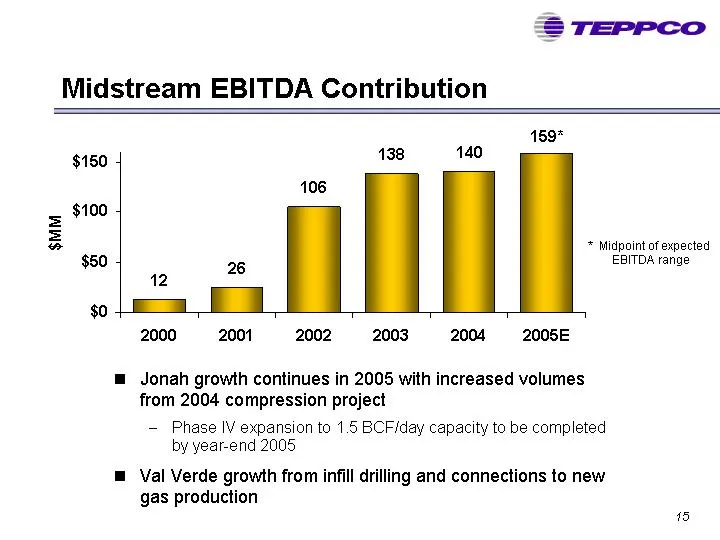
Midstream EBITDA Contribution 159* $150 $100 * Midpoint of expected $50 EBITDA range $0 | — = 2000 2001 2002 2003 2004 2005E $MM @ Jonah growth continues in 2005 with increased volumes from 2004 compression project — Phase IV expansion to 1.5 BCF/day capacity to be completed by year-end 2005 ™ Val V
Slide 16: Midstream Strategy
Midstream Strategy @ Strong portfolio of high quality assets in prolific gas producing basins — Assets positioned in basins playing an increasingly vital role in domestic gas supply @ Realize full potential of existing assets — Increase throughput on Val Verde, Jonah and Chaparral systems — Prudentl
Slide 17: Val Verde Gas Gathering System
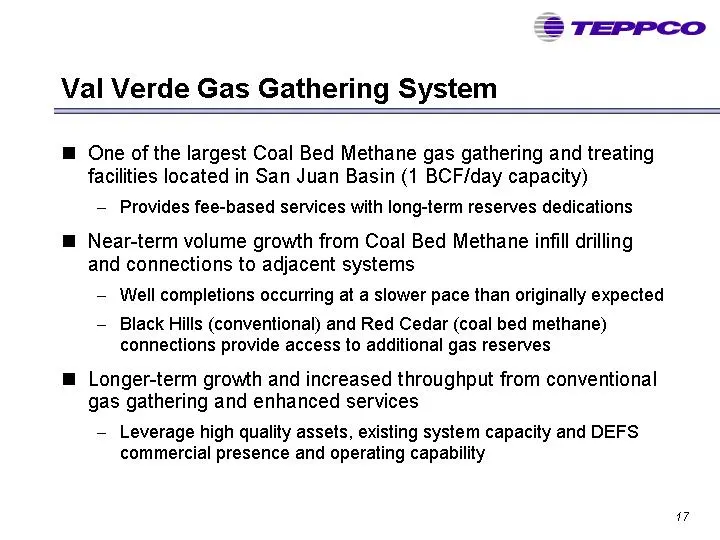
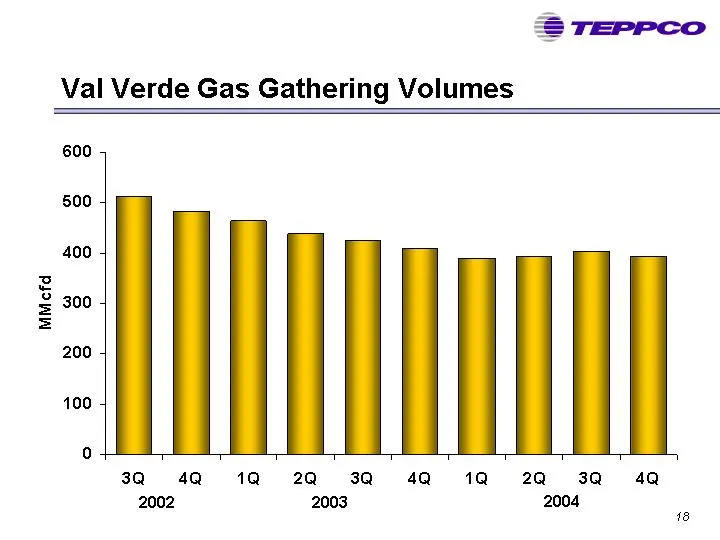
Val Verde Gas Gathering System m@ One of the largest Coal Bed Methane gas gathering and treating facilities located in San Juan Basin (1 BCF/day capacity) — Provides fee-based services with long-term reserves dedications @ Near-term volume growth from Coal Bed Methane infill drilling and connections
Slide 18: Val Verde Gas Gathering Volumes
MMcfd Val Verde Gas Gathering Volumes 600 500 400 300 3Q 4Q 2002 1Q 2Q 2003 2004 3Q 4Q 1Q 2Q = 3Q 4Q 18
Slide 19: Jonah Gas Gathering System
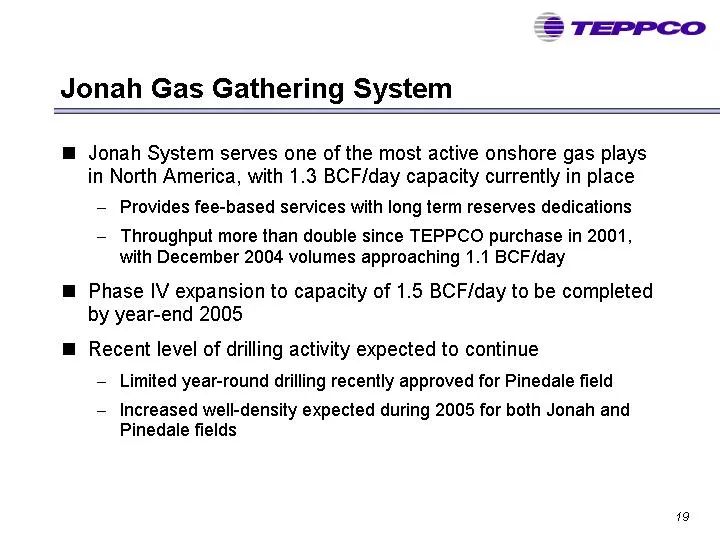
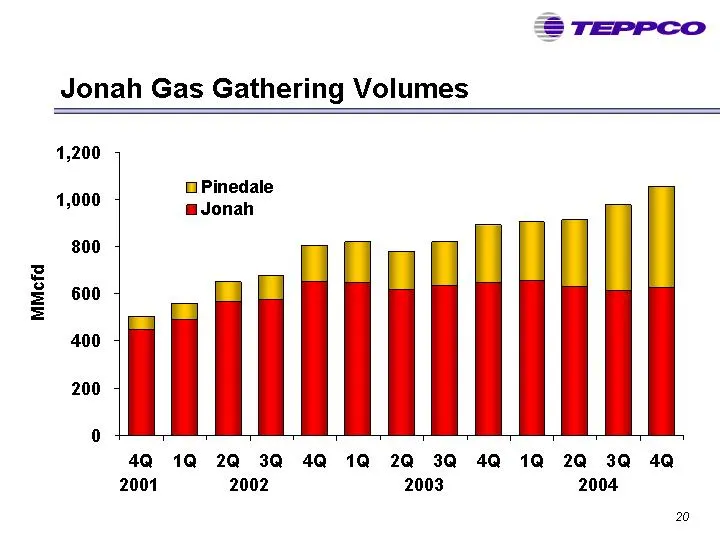
Jonah Gas Gathering System m@ Jonah System serves one of the most active onshore gas plays in North America, with 1.3 BCF/day capacity currently in place — Provides fee-based services with long term reserves dedications — Throughput more than double since TEPPCO purchase in 2001, with December 2004
Slide 20: Jonah Gas Gathering Volumes
Jonah Gas Gathering Volumes 1,200 G Pinedale Jonah 1,000 800 600 MMcfd 400 200 0 4Q 1Q 2Q 3Q 4@ 1Q 2Q 3Q 4Q 1Q@ 2Q 3Q 4Q 2001 2002 2003 2004 20
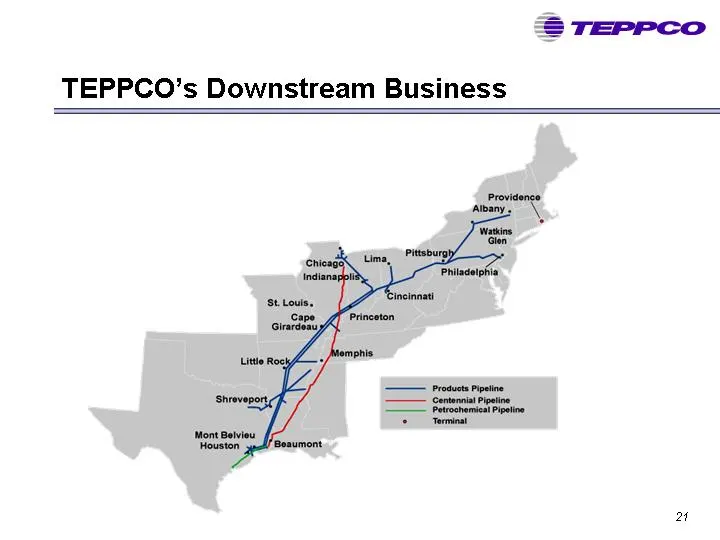
Slide 21: TEPPCO's Downstream Business
TEPPCO’s Downstream Business Mont Bolview ‘Houston 2t
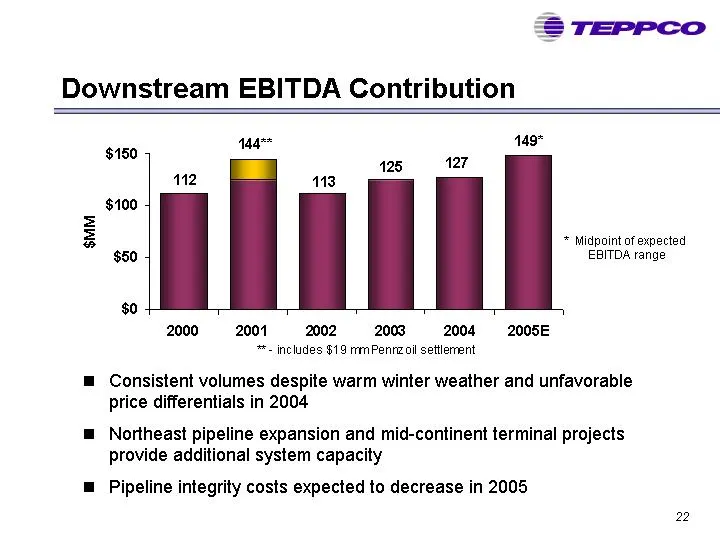
Slide 22: Downstream EBITDA Contribution
Downstream EBITDA Contribution 14a" 149" $150 105 0 112 113 $100 = 3 * Midpoint of expected $50 EBITDA range $0 2000 =. 2001 «2002, 2003«S 2004 = 2005E *- includes §19 mmPenrzcil settlerrent = Consistent volumes despite warm winter weather and unfavorable price differentials in 2004 @ Northeast pipe
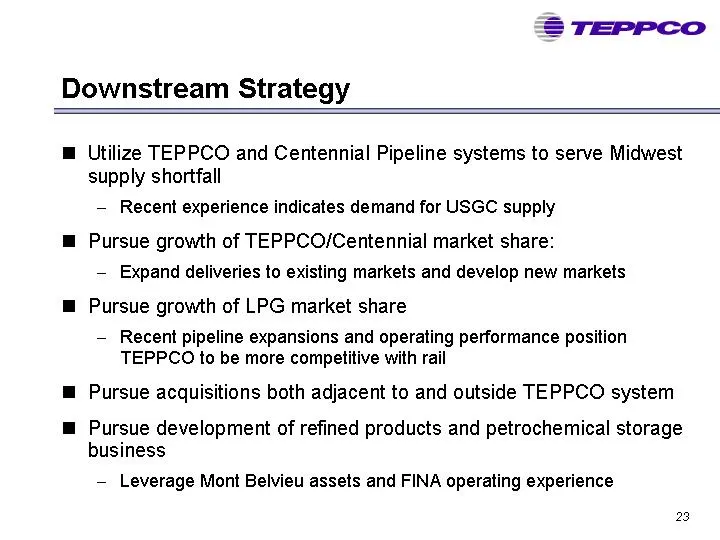
Slide 23: Downstream Strategy
Downstream Strategy m@ Utilize TEPPCO and Centennial Pipeline systems to serve Midwest supply shortfall — Recent experience indicates demand for USGC supply @ Pursue growth of TEPPCO/Centennial market share: — Expand deliveries to existing markets and develop new markets @ Pursue growth of LPG marke
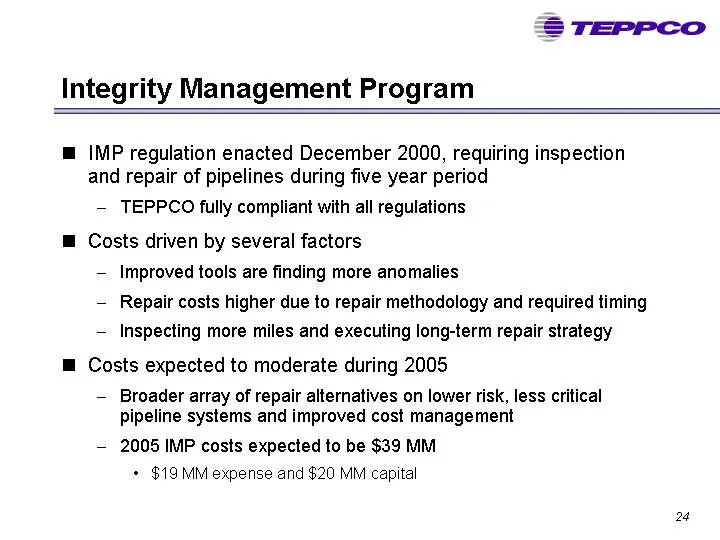
Slide 24: Integrity Management Program
Integrity Management Program @ IMP regulation enacted December 2000, requiring inspection and repair of pipelines during five year period — TEPPCO fully compliant with all regulations ™@ Costs driven by several factors — Improved tools are finding more anomalies — Repair costs higher due to repair m
Slide 25: 2004 Performance / 2005 Outlook
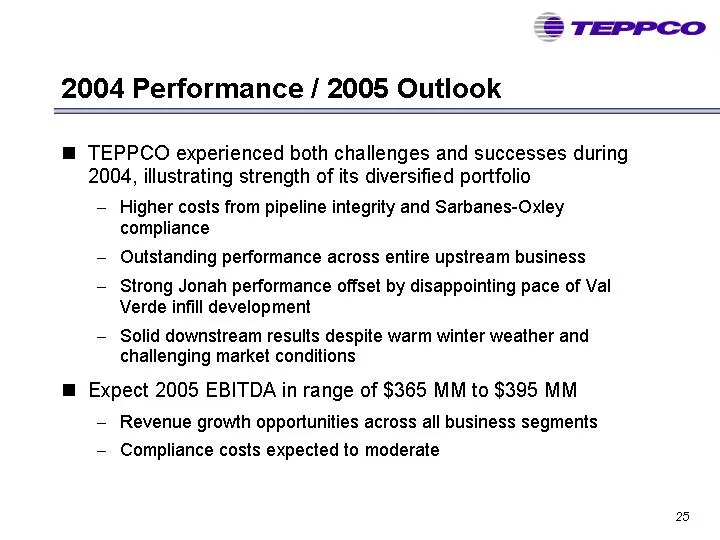
2004 Performance / 2005 Outlook m@ TEPPCO experienced both challenges and successes during 2004, illustrating strength of its diversified portfolio Higher costs from pipeline integrity and Sarbanes-Oxley compliance Outstanding performance across entire upstream business Strong Jonah performance offs
Slide 26: Balance Sheet and Distribution Coverage
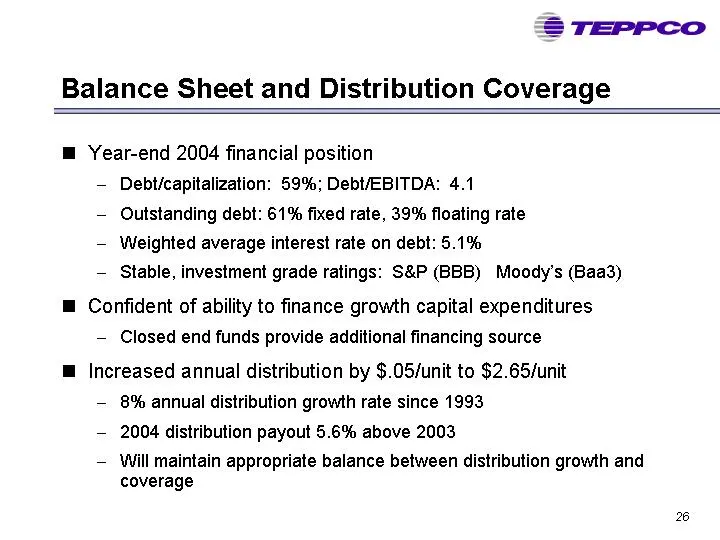
Balance Sheet and Distribution Coverage @ Year-end 2004 financial position Debt/capitalization: 59%; Debt/EBITDA: 4.1 Outstanding debt: 61% fixed rate, 39% floating rate — Weighted average interest rate on debt: 5.1% — Stable, investment grade ratings: S&P (BBB) Moody's (Baa3) ™@ Confident of abilit
Slide 27: Consistent distribution growth
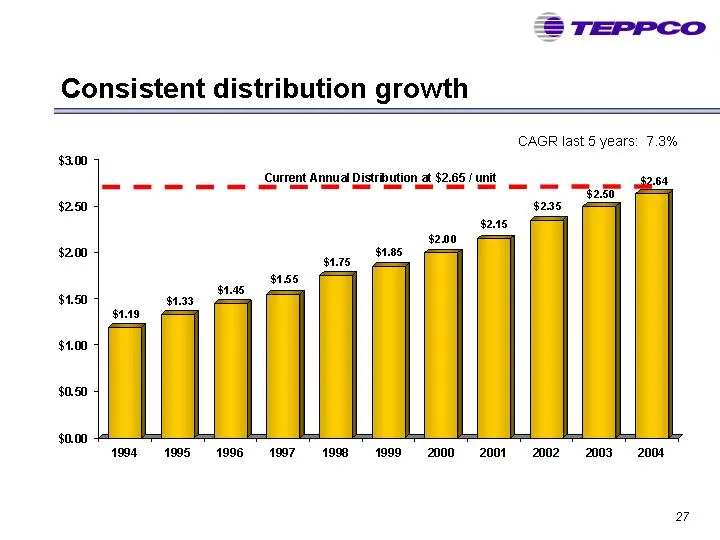
Consistent distribution growth CAGR last § years: 7.3% Current Annual 1904 1905 1996. 1907 1998 1999002001 nz 203.2004 27
Slide 28: TEPPCO unitholders have realized a 19% average annual return
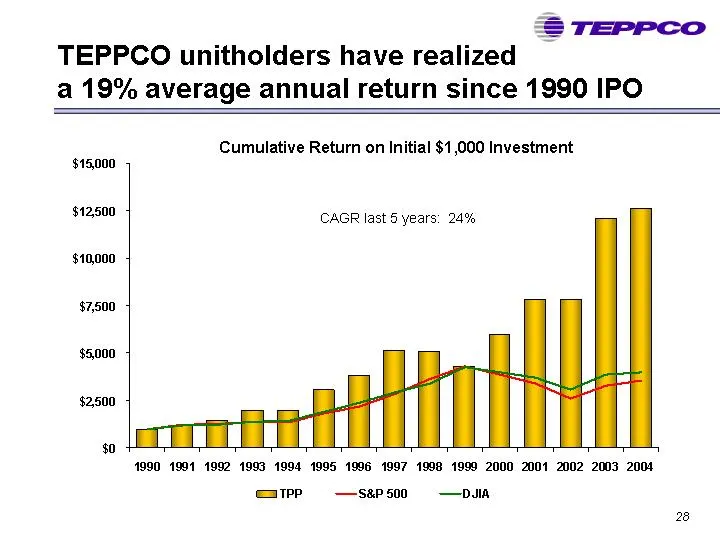
TEPPCO TEPPCO unitholders have realized a 19% average annual return since 1990 IPO Cumulative Return on Initial $1,000 Investment $15,000 $12,500 CAGR last 5 years: 24% $10,000 $7,500 $5,000 $2500 $0 1990 1991 1992 1993 1994 1995 1996 1997 1998 1999 2000 2001 2002 2003 2004 aTpPp —sapsoo = —DuA 28
Slide 29: Summary
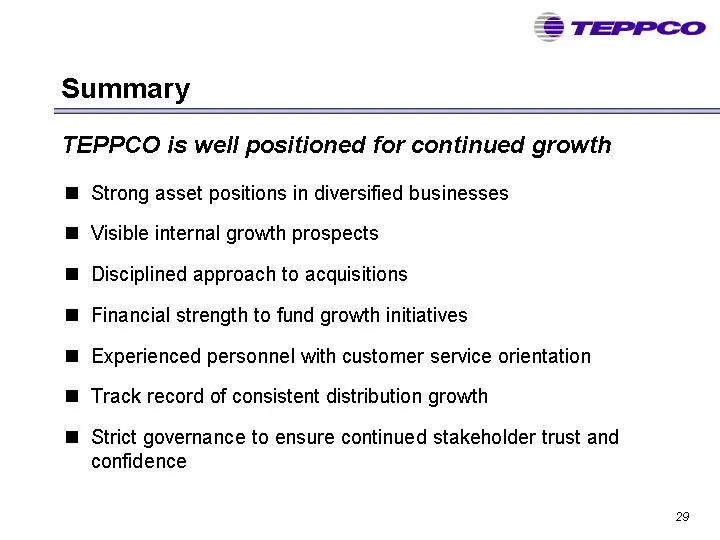
Summary TEPPCO is well positioned for continued growth Strong asset positions in diversified businesses Visible internal growth prospects Disciplined approach to acquisitions Financial strength to fund growth initiatives Experienced personnel with customer service orientation Track record of consist
Slide 30: Reconciliation of Non-GAAP Measures
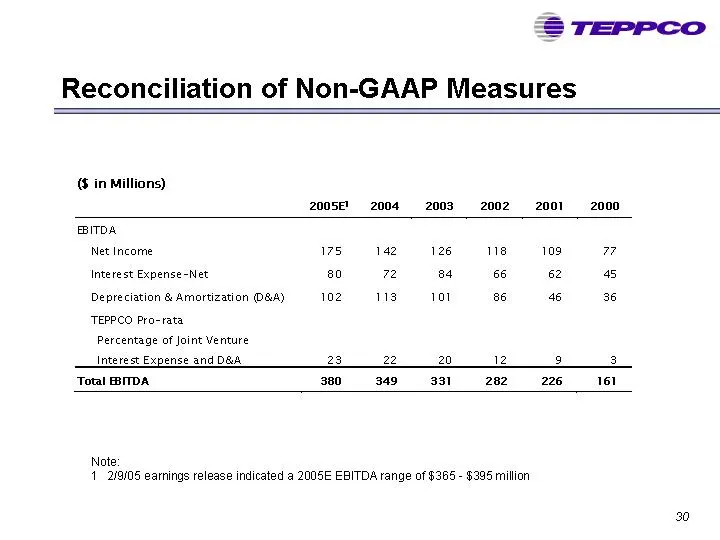
Reconciliation of Non-GAAP Measures TEPPCO @ in Millions) 2o0se 2004 2003 200220012000 EBITDA Net income W750 142126 18109 77 Interest Expense -Net 80 72 84 66 62 45 Depreciation & Amortization @@A) «102,113,101 86 46 36 TEPPCO Pro-rata Percentage of Joint Venture Interest Expense and D&A 23 22 20 2
Slide 31: Reconciliation of Non-GAAP Measures
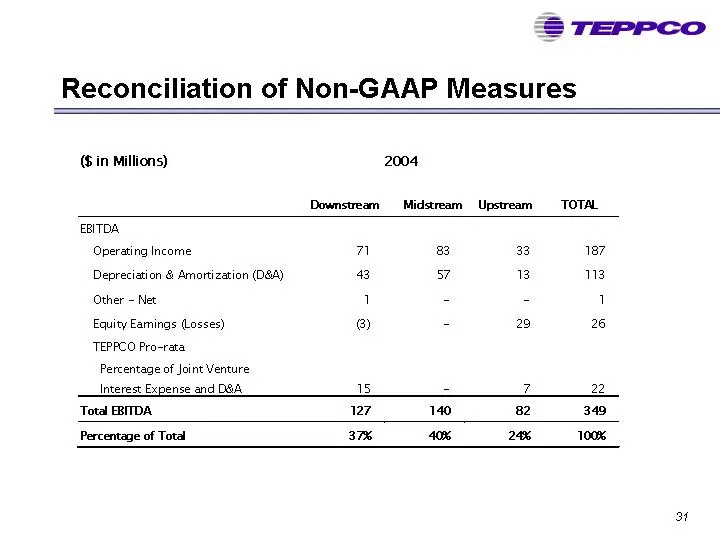
Reconciliation of Non-GAAP Measures (Sin Millions) 2004 Downstream Midstream Upstream TOTAL EBITDA Operating Income 7 8 33 187 Depreciation & Amortization (D&A) 8 7 3 113 Other ~ Net 1 = = 1 Equity Eamings Losses) ®@ - 29 26 TEPPCO Pro-rata Percentage of Joint Venture Interest Expense and D&A 15 - z
Slide 32: Reconciliation of Non-GAAP Measures
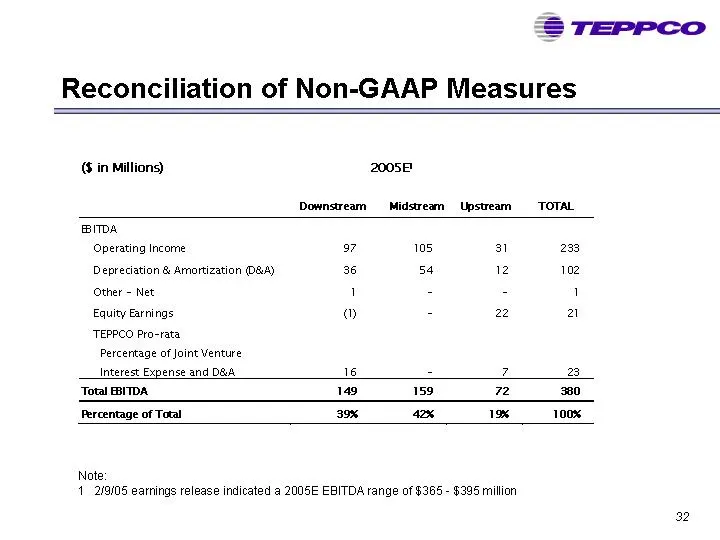
TEPPCO Reconciliation of Non-GAAP Measures G in Millions) 2005E1 Downstream Midstream Upstream TOTAL BITDA Operating Income 97 105 31 238 Depreciation & Amortization O88) 36 84 12 102 Other - Net 1 - - 1 Equity Earrings o - 22 21 ‘TEPPCO Pro-rata Percentage of Joint Venture Interest Expense and D&A
Slide 33: Searchable text section of graphics
Searchable text section of graphics shown above [ LOG O] TEPPCO Partners, L.P. Analyst and Investor Presentation February 2005 For ward-looking Statements • The material and information furnished in this presentation contains forward-looking statements as such are described within various provisions
Source: SEC EDGAR · 8-K filed Feb 14, 2005
More decks from Teppco Partners LP
 Morgan Stanley MLP Reception (October 2009)26 slides · Oct 7, 2009
 Master Limited Partnerships Investor Conference (September 2009)27 slides · Sep 16, 2009
 Wells Fargo Retail Meeting (September 2009)27 slides · Sep 15, 2009
 Barclays Capital CEO Energy/Power Conference 200929 slides · Sep 9, 2009
 Merger or Acquisition (August 2009)29 slides · Aug 26, 2009
 Wachovia Securities Investor Presentation (June 2007)51 slides · Jun 1, 2007