
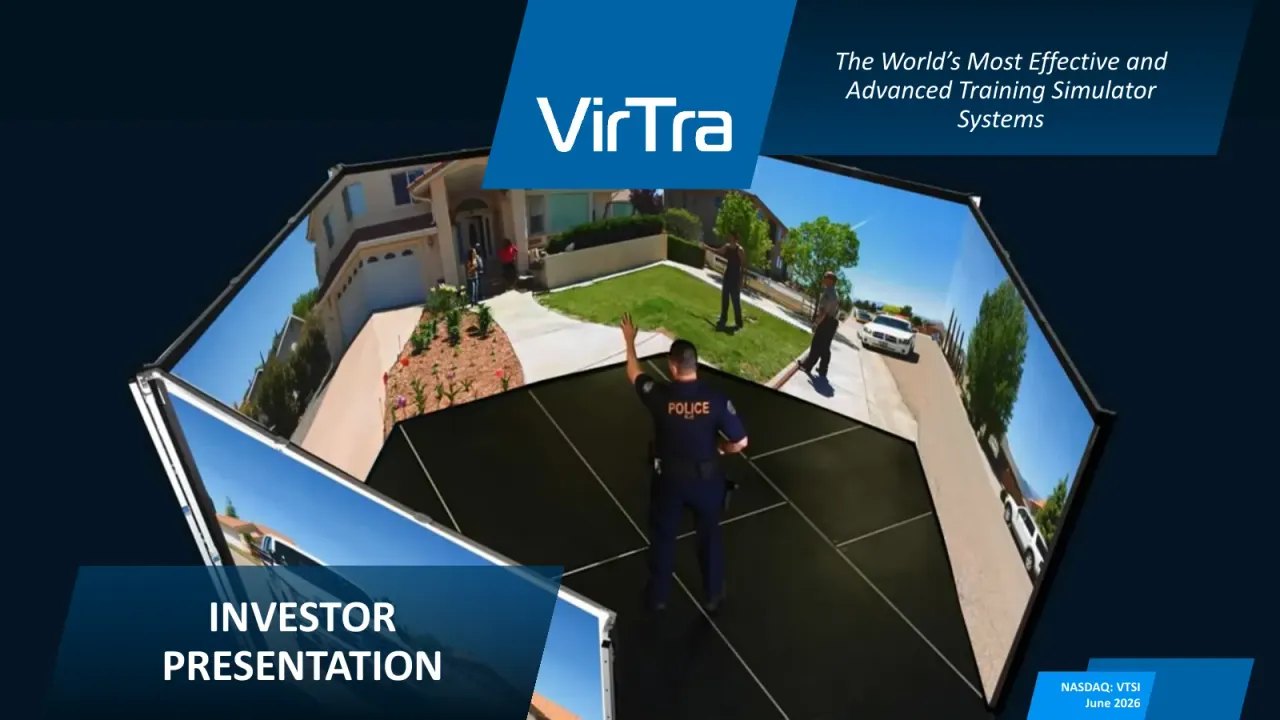
TEMPE, Ariz. , Nov. 12, 2019 (GLOBE NEWSWIRE) -- VirTra, Inc. (NASDAQ: VTSI) (“VirTra”), a global provider of training simulators for the law enforcement, military, educational and commercial markets, reported results for the third quarter and nine months ended September 30, 2019. The unaudited financial statements and notes thereto are available on VirTra’s website and here.
Third Quarter 2019 and Recent Highlights:
- Awarded $5.0 million IDIQ contract in addition to a $1.7 million expansion order from the Department of Homeland Security for Customs and Border Protection
- Received $2.3 million follow-on order from the Arizona Department of Public Safety
- Received $1.1 million expansion order from the U.S. Secret Service
- Launched the world’s first ultra-high-definition 4k training simulators and received initial order from the Federal Law Enforcement Training Centers (FLETC)
- Awarded patents for TASER® training and simulating firearms and malfunctions, which strengthens VirTra’s competitive moat and enhances the realism of simulation training
- Launched driving simulators for U.S. law enforcement and debuted additional new products at IACP 2019
- Partnered with Force Science Institute to develop additional advanced simulation training for law enforcement officers
- Engaged JL O’Connell & Associates, a highly regarded business development consultancy, to expand VirTra’s sales and marketing efforts in the military market
Third Quarter and Nine Month 2019 Financial Highlights:
| All figures in millions, except per share data | Q3 2019 | Q3 2018 | % Δ | YTD 2019 | YTD 2018 | % Δ | |||||||||||
| Total Revenue | $ | 6.71 | $ | 3.55 | 89 | % | $ | 12.82 | $ | 15.55 | -18 | % | |||||
| Gross Profit | $ | 3.76 | $ | 2.09 | 80 | % | $ | 7.07 | $ | 10.09 | -30 | % | |||||
| Gross Margin | 55.9 | % | 58.8 | % | -5 | % | 55.2 | % | 64.9 | % | -15 | % | |||||
| Net Income/(Loss) | $ | 0.94 | $ | 0.06 | 1436 | % | ($ | 0.01 | ) | $ | 2.09 | N/A | |||||
| Diluted EPS | $ | 0.12 | $ | 0.01 | 1100 | % | $ | 0.00 | $ | 0.25 | N/A | ||||||
Management Commentary
“In the third quarter of 2019, we saw much of our work from prior quarters come to fruition as we achieved the second most successful quarter in our company’s history in terms of recognized revenue and our best third quarter to date,” said Bob Ferris, Chairman and CEO of VirTra. “Financially, the quarter was highlighted by $6.7 million revenue, $937,000 in net income, $1.4 million in adjusted EBITDA, and a record backlog of $11.3 million. When combined with the results of the prior few quarters, Q3 highlights the importance of continuing to evaluate our business on an annual rather than a quarterly basis.
“The results of the third quarter were in large part driven by the operational progress we’ve made throughout the year, including launching upgraded recoil kits, introducing driving simulators, developing new certified curriculum, and bolstering our competitive moat with new patents, all of which have led to increasing VirTra’s status in the market as the most trusted name for effective simulation training. Given our ability to add to our pipeline while fulfilling orders, we are cautiously optimistic that we will be able to continue this momentum for the rest of the year and enter 2020 from a position of strength.”
Third Quarter 2019 Financial Results
Total revenue increased by 89% to $6.7 million from $3.5 million in the third quarter of 2018. The increase in total revenue was due to an increase in the number of simulators and accessories completed and delivered and revenue recognized compared to the same period in 2018.
Gross profit increased 80% to $3.8 million (55.9% of total revenue) from $2.1 million (58.8% of total revenue) in the third quarter of 2018. The increase in gross profit was primarily due to differences in the product mix and the varying quantity of systems, accessories, and services sold.
Net operating expense was $2.5 million compared to $2.0 million in the third quarter of 2018. The increase in net operating expense was due to an increase in selling, general, and administrative (SG&A) expense, costs for labor, benefits, professional services, sales and marketing expense, and research and development expense.
Income from operations was $1.2 million compared to income from operations of $80,000 in the third quarter of 2018.
Net income totaled $937,000, or $0.12 per diluted share, compared to net income of $61,000, or $0.01 per diluted share, in the third quarter of 2018.
Adjusted EBITDA, a non-GAAP financial measure, was $1.4 million compared to adjusted EBITDA of $174,000 in the same period a year-ago.
As of September 30, 2019, cash and cash equivalents and certificates of deposit totaled $5.3 million compared to $3.3 million at the end of the prior quarter. At the end of the quarter, the company had working capital of $6.4 million and no debt.
Financial Results for the Nine Months Ended September 30, 2019
Total revenue was $12.8 million compared to $15.5 million in the first nine months of 2018. The decrease in total revenue was due primarily to the delivery of a large, one-time $4.4 million simulator and accessories order in 2018 that helped equip the police force of Pakistan.
Gross profit was $7.1 million (55.2% of total revenue) compared to $10.1 million (64.9% of total revenue) in the first nine months of 2018. The decrease in gross profit was primarily due to differences in the product mix and the varying quantity of systems, accessories, and services sold.
Net operating expense was $7.2 million, which is consistent with the first nine months of 2018.
Loss from operations was $94,000 compared to income from operations of $2.9 million in the first nine months of 2018.
Net loss totaled $10,000, or $(0.00) per diluted share, compared to net income of $2.1 million, or $0.25 per diluted share, in the comparable period a year ago.
Adjusted EBITDA was $339,000 compared to adjusted EBITDA of $3.3 million in the first nine months of 2018.
Deferred revenue totaled $4.6 million as of September 30, 2019, compared to $2.7 million as of September 30, 2018. The current portion of deferred revenue was $3.0 million as of September 30, 2019, compared to $1.9 million as of September 30, 2018. The increase in deferred revenue was primarily due to customer deposits received on new orders, new service agreements, and new STEP agreements received.
Conference Call
VirTra management will hold a conference call today (November 12, 2019) at 4:30 p.m. Eastern time (1:30 p.m. Pacific time) to discuss these results. VirTra’s Chairman and CEO, Bob Ferris, and CFO, Judy Henry, will host the call, followed by a question and answer period.
U.S. dial-in number: 844-369-8770International number: 862-298-0840
Please call the conference telephone number 5-10 minutes prior to the start time. An operator will register your name and organization. If you have any difficulty connecting with the conference call, please contact VirTra’s IR team at 949-574-3860.
The conference call will be broadcast live and available for replay here and via the investor relations section of VirTra’s website.
A replay of the conference call will be available after 7:30 p.m. Eastern time on the same day through November 26, 2019.
Toll-free replay number: 877-481-4010International replay number: 919-882-2331Replay ID: 56432
About VirTraVirTra (NASDAQ: VTSI) is a global provider of judgmental use of force training simulators, firearms training simulators and driving simulators for the law enforcement, military, educational and commercial markets. The company’s patented technologies, software, and scenarios provide intense training for de-escalation, judgmental use-of-force, marksmanship and related training that mimics real-world situations. VirTra’s mission is to save and improve lives worldwide through practical and highly-effective virtual reality and simulator technology. Learn more about the company at www.VirTra.com.
About the Presentation of Adjusted EBITDAAdjusted earnings before interest, income taxes, depreciation and amortization and before other non-operating costs and income (“Adjusted EBITDA”) is a non-GAAP financial measure. Adjusted EBITDA also includes non-cash stock option expense and other than temporary impairment loss on investments. Other companies may calculate Adjusted EBITDA differently. VirTra calculates its Adjusted EBITDA to eliminate the impact of certain items it does not consider to be indicative of its performance and its ongoing operations. Adjusted EBITDA is presented herein because management believes the presentation of Adjusted EBITDA provides useful information to VirTra’s investors regarding VirTra’s financial condition and results of operations and because Adjusted EBITDA is frequently used by securities analysts, investors and other interested parties in the evaluation of companies in VirTra’s industry, several of which present a form of Adjusted EBITDA when reporting their results. Adjusted EBITDA has limitations as an analytical tool and should not be considered in isolation or as a substitute for analysis of VirTra’s results as reported under accounting principles generally accepted in the United States of America (“GAAP”). Adjusted EBITDA should not be considered as an alternative for net income, cash flows from operating activities and other consolidated income or cash flows statement data prepared in accordance with GAAP or as a measure of profitability or liquidity. A reconciliation of net loss to Adjusted EBITDA is provided in the following table:
| Reconciliation of net income (loss) to adjusted EBITDA | |||||||||||||||||||||||||||
| Three Months Ended | Nine Months Ended | ||||||||||||||||||||||||||
| September 30, | September 30, | Increase | % | September 30, | September 30, | Increase | % | ||||||||||||||||||||
| 2019 | 2018 | (Decrease) | Change | 2019 | 2018 | (Decrease) | Change | ||||||||||||||||||||
| Net income (loss) | $ | 937,107 | $ | 61,000 | $ | 876,107 | 1436 | % | $ | (9,526 | ) | $ | 2,088,150 | $ | (2,097,676 | ) | -100 | % | |||||||||
| Adjustments: | |||||||||||||||||||||||||||
| Provision for income taxes | 347,787 | 36,000 | 311,787 | 866 | % | 23,539 | 871,747 | (848,208 | ) | -97 | % | ||||||||||||||||
| Depreciation and amortization | 77,259 | 74,746 | 2,513 | 3 | % | 222,471 | 217,952 | 4,519 | 2 | % | |||||||||||||||||
| EBITDA | $ | 1,362,153 | $ | 171,746 | $ | 1,190,407 | 693 | % | $ | 236,484 | $ | 3,177,849 | $ | (2,941,365 | ) | -93 | % | ||||||||||
| Impairment loss on That's Eatertainment, related party | - | - | - | - | % | - | 134,140 | (134,140 | ) | -100 | % | ||||||||||||||||
| Non-cash stock option compensation | - | 1,796 | (1,796 | ) | -100 | % | - | 6,656 | (6,656 | ) | -100 | % | |||||||||||||||
| Reserve for note receivable | - | - | - | - | % | 102,473 | - | 102,473 | 100 | % | |||||||||||||||||
| Adjusted EBITDA | $ | 1,362,153 | $ | 173,542 | $ | 1,188,611 | 685 | % | $ | 338,957 | $ | 3,318,645 | $ | (2,979,688 | ) | -90 | % | ||||||||||
Forward-Looking StatementsThe information in this discussion contains forward-looking statements and information within the meaning of Section 27A of the Securities Act of 1933, as amended, and Section 21E of the Securities Exchange Act of 1934, as amended, which are subject to the “safe harbor” created by those sections. The words “anticipates,” “believes,” “estimates,” “expects,” “intends,” “may,” “plans,” “projects,” “will,” “should,” “could,” “predicts,” “potential,” “continue,” “would” and similar expressions are intended to identify forward-looking statements, although not all forward-looking statements contain these identifying words. We may not actually achieve the plans, intentions or expectations disclosed in our forward-looking statements and you should not place undue reliance on our forward-looking statements. Actual results or events could differ materially from the plans, intentions and expectations disclosed in the forward-looking statements that we make. The forward-looking statements are applicable only as of the date on which they are made, and we do not assume any obligation to update any forward-looking statements. All forward-looking statements in this document are made based on our current expectations, forecasts, estimates and assumptions, and involve risks, uncertainties and other factors that could cause results or events to differ materially from those expressed in the forward-looking statements. In evaluating these statements, you should specifically consider various factors, uncertainties and risks that could affect our future results or operations. These factors, uncertainties and risks may cause our actual results to differ materially from any forward-looking statement set forth in the reports we file with or furnish to the SEC. You should carefully consider these risk and uncertainties described and other information contained in the reports we file with or furnish to the Securities and Exchange Commission before making any investment decision with respect to our securities. All forward-looking statements attributable to us or persons acting on our behalf are expressly qualified in their entirety by this cautionary statement. Investor Relations Contact:Matt Glover or Charlie Schumacher VTSI@gatewayir.com949-574-3860
VIRTRA, INC.CONDENSED BALANCE SHEETS
| September 30, 2019 | December 31, 2018 | |||||||||||
| (Unaudited) | ||||||||||||
| ASSETS | ||||||||||||
| Current assets: | ||||||||||||
| Cash and cash equivalents | $ | 3,377,712 | $ | 2,500,381 | ||||||||
| Certificates of deposit | 1,915,000 | 3,490,000 | ||||||||||
| Accounts receivable, net | 1,431,408 | 1,302,010 | ||||||||||
| Interest receivable | 18,490 | 21,385 | ||||||||||
| That's Eatertainment note receivable, net, related party | - | 292,138 | ||||||||||
| Trade note receivable, net | - | 96,282 | ||||||||||
| Inventory, net | 2,818,100 | 1,612,002 | ||||||||||
| Unbilled revenue | 2,111,374 | 689,153 | ||||||||||
| Prepaid expenses and other current assets | 498,162 | 377,520 | ||||||||||
| Total current assets | 12,170,246 | 10,380,871 | ||||||||||
| Long-term assets: | ||||||||||||
| Property and equipment, net | 948,588 | 678,245 | ||||||||||
| Operating lease right-of-use asset | 1,462,922 | - | ||||||||||
| Intangible assets, net | 154,074 | - | ||||||||||
| That's Eatertainment note receivable, long term, related party | 291,110 | - | ||||||||||
| Trade note receivable, long term | - | 6,843 | ||||||||||
| Security deposits, long-term | 19,712 | 339,756 | ||||||||||
| Other assets, long-term | 340,438 | 292,298 | ||||||||||
| Deferred tax asset, net | 2,383,000 | 2,400,000 | ||||||||||
| Investment in That's Eatertainment, related party | 1,120,000 | 1,120,000 | ||||||||||
| Total long-term assets | 6,719,844 | 4,837,142 | ||||||||||
| Total assets | $ | 18,890,090 | $ | 15,218,013 | ||||||||
| LIABILITIES AND STOCKHOLDERS' EQUITY | ||||||||||||
| Current liabilities: | ||||||||||||
| Accounts payable | $ | 1,047,334 | $ | 429,949 | ||||||||
| Accrued compensation and related costs | 950,429 | 613,691 | ||||||||||
| Accrued expenses and other current liabilities | 478,398 | 632,606 | ||||||||||
| Note payable, current | - | 11,250 | ||||||||||
| Operating lease liability, short-term | 291,373 | - | ||||||||||
| Deferred revenue, short-term | 3,005,372 | 1,924,307 | ||||||||||
| Total current liabilities | 5,772,906 | 3,611,803 | ||||||||||
| Long-term liabilities: | ||||||||||||
| Deferred revenue, long-term | 1,601,169 | 962,356 | ||||||||||
| Deferred rent liability | - | 46,523 | ||||||||||
| Operating lease liability, long-term | 1,251,098 | - | ||||||||||
| Total long-term liabilities | 2,852,267 | 1,008,879 | ||||||||||
| Total liabilities | 8,625,173 | 4,620,682 | ||||||||||
| Commitments and contingencies (See Note 10) | ||||||||||||
| Stockholders' equity: | ||||||||||||
| Preferred stock $0.0001 par value; 2,500,000 authorized; no shares issued | ||||||||||||
| or outstanding | - | - | ||||||||||
| Common stock $0.0001 par value; 50,000,000 shares authorized; 7,745,030 shares | ||||||||||||
| issued and outstanding as of September 30, 2019 and 7,827,651 shares issued | 775 | 783 | ||||||||||
| and 7,816,944 shares outstanding as of December 31, 2018 | ||||||||||||
| Class A common stock $0.0001 par value; 2,500,000 shares authorized; no shares | ||||||||||||
| issued or outstanding | - | - | ||||||||||
| Class B common stock $0.0001 par value; 7,500,000 shares authorized; no shares | ||||||||||||
| issued or outstanding | - | - | ||||||||||
| Treasury stock at cost; nil shares outstanding as of September 30, 2019 and | - | (37,308 | ) | |||||||||
| 10,707 shares outstanding as of December 31, 2018. | ||||||||||||
| Additional paid-in capital | 13,912,646 | 14,272,834 | ||||||||||
| Accumulated deficit | (3,648,504 | ) | (3,638,978 | ) | ||||||||
| Total stockholders' equity | 10,264,917 | 10,597,331 | ||||||||||
| Total liabilities and stockholders' equity | $ | 18,890,090 | $ | 15,218,013 | ||||||||
| See accompanying notes to unaudited condensed financial statements. | ||||||||||||
VIRTRA, INC.CONDENSED STATEMENTS OF OPERATIONS(Unaudited)
| Three Months Ended | Nine Months Ended | |||||||||||||||
| September 30, 2019 | September 30, 2018 | September 30, 2019 | September 30, 2018 | |||||||||||||
| Revenues: | ||||||||||||||||
| Net sales | $ | 6,682,728 | $ | 3,506,179 | $ | 12,696,810 | $ | 15,027,580 | ||||||||
| That's Eatertainment royalties/licensing fees, related party | 28,561 | 41,038 | 100,993 | 512,545 | ||||||||||||
| Other royalties/licensing fees | 2,120 | 1,680 | 21,257 | 5,755 | ||||||||||||
| Total revenue | 6,713,409 | 3,548,897 | 12,819,060 | 15,545,880 | ||||||||||||
| Cost of sales | 2,957,865 | 1,461,754 | 5,748,001 | 5,452,906 | ||||||||||||
| Gross profit | 3,755,544 | 2,087,143 | 7,071,059 | 10,092,974 | ||||||||||||
| Operating expenses: | ||||||||||||||||
| General and administrative | 2,127,422 | 1,683,979 | 6,074,213 | 6,218,135 | ||||||||||||
| Research and development | 381,654 | 323,626 | 1,090,960 | 996,908 | ||||||||||||
| Net operating expense | 2,509,076 | 2,007,605 | 7,165,173 | 7,215,043 | ||||||||||||
| Income (loss) from operations | 1,246,468 | 79,538 | (94,114 | ) | 2,877,931 | |||||||||||
| Other income (expense) | ||||||||||||||||
| Other income | 38,426 | 21,032 | 114,158 | 86,508 | ||||||||||||
| Other expense | - | (3,570 | ) | (6,031 | ) | (4,542 | ) | |||||||||
| Net other income | 38,426 | 17,462 | 108,127 | 81,966 | ||||||||||||
| Income before provision for income taxes | 1,284,894 | 97,000 | 14,013 | 2,959,897 | ||||||||||||
| Provision for income taxes | 347,787 | 36,000 | 23,539 | 871,747 | ||||||||||||
| Net income (loss) | $ | 937,107 | $ | 61,000 | $ | (9,526 | ) | $ | 2,088,150 | |||||||
| Net income (loss) per common share: | ||||||||||||||||
| Basic | $ | 0.12 | $ | 0.01 | $ | (0.00 | ) | $ | 0.26 | |||||||
| Diluted | $ | 0.12 | $ | 0.01 | $ | (0.00 | ) | $ | 0.25 | |||||||
| Weighted average shares outstanding: | ||||||||||||||||
| Basic | 7,745,030 | 7,911,807 | 7,748,543 | 7,907,864 | ||||||||||||
| Diluted | 7,721,574 | 8,247,841 | 7,748,543 | 8,256,098 | ||||||||||||
| See accompanying notes to unaudited condensed financial statements. | ||||||||||||||||
VIRTRA, INC.CONDENSED STATEMENTS OF CASH FLOWS
| Nine Months Ended | ||||||||||
| September 30, 2019 | September 30, 2018 | |||||||||
| Cash flows from operating activities: | ||||||||||
| Net (loss) income | $ | (9,526 | ) | $ | 2,088,150 | |||||
| Adjustments to reconcile net income (loss) to net cash provided by operating activities: | ||||||||||
| Depreciation and amortization | 434,405 | 217,952 | ||||||||
| Deferred taxes | 17,000 | 860,181 | ||||||||
| Impairment of investment in That's Eatertainment, related party | - | 134,140 | ||||||||
| Stock compensation | - | 6,656 | ||||||||
| Reserve for note receivable | 102,473 | - | ||||||||
| Changes in operating assets and liabilities: | ||||||||||
| Accounts receivable, net | (129,398 | ) | (1,072,594 | ) | ||||||
| Trade note receivable, net | 652 | - | ||||||||
| Interest receivable | 3,923 | - | ||||||||
| Inventory | (1,206,098 | ) | (147,609 | ) | ||||||
| Unbilled revenue | (1,422,221 | ) | 751,042 | |||||||
| Prepaid expenses and other current assets | (120,642 | ) | (149,890 | ) | ||||||
| Other assets | (48,140 | ) | - | |||||||
| Security deposits, long-term | 320,044 | - | ||||||||
| Accounts payable and other accrued expenses | 799,915 | 776,795 | ||||||||
| Payments on operating lease liability | (178,909 | ) | - | |||||||
| Deferred revenue | 1,719,878 | (345,711 | ) | |||||||
| Net cash provided by operating activities | 283,356 | 3,119,112 | ||||||||
| Cash flows from investing activities: | ||||||||||
| Purchase of certificates of deposit | (3,560,000 | ) | - | |||||||
| Redemption of certificates of deposit | 5,135,000 | - | ||||||||
| Purchase of intangible assets | (160,000 | ) | - | |||||||
| Purchase of property and equipment | (489,518 | ) | (292,827 | ) | ||||||
| Proceeds from sale of property and equipment | 2,631 | - | ||||||||
| Net cash provided by (used in) investing activities | 928,113 | (292,827 | ) | |||||||
| Cash flows from financing activities: | ||||||||||
| Repurchase of stock options | (16,110 | ) | (32,000 | ) | ||||||
| N/P Payable -Profiles | (11,250 | ) | (11,250 | ) | ||||||
| Stock options exercised | 11,426 | 10,500 | ||||||||
| Purchase of treasury stock | (318,204 | ) | - | |||||||
| Net cash used in financing activities | (334,138 | ) | (32,750 | ) | ||||||
| Net increase in cash | 877,331 | 2,793,535 | ||||||||
| Cash, beginning of period | 2,500,381 | 5,080,445 | ||||||||
| Cash, end of period | $ | 3,377,712 | $ | 7,873,980 | ||||||
| Supplemental disclosure of cash flow information: | ||||||||||
| Cash paid: | ||||||||||
| Taxes | $ | 6,539 | $ | 102,543 | ||||||
| Supplemental disclosure of non-cash investing and financing activities: | ||||||||||
| Conversion of accounts to note receivable | - | 693,044 | ||||||||
| Conversion of That's Eatertainment note receivable to long term, related party | 292,138 | - | ||||||||
| See accompanying notes to unaudited condensed financial statements. | ||||||||||