
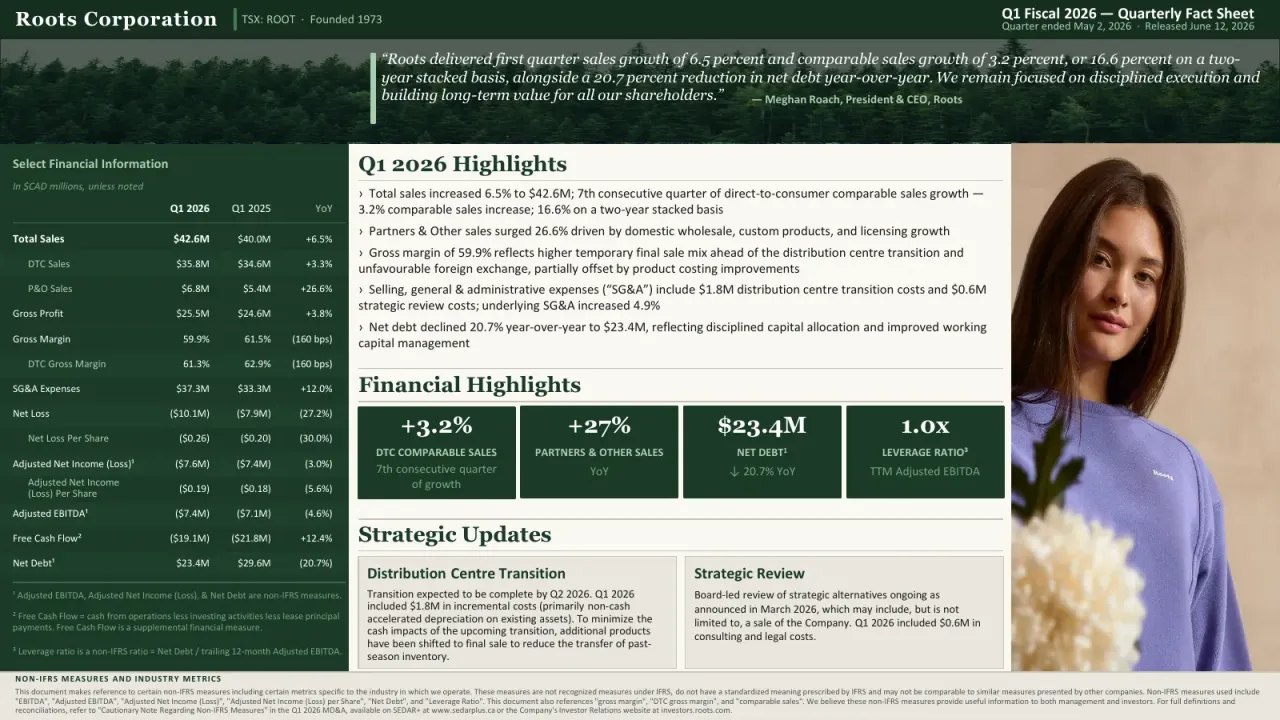
Total sales up 6.5% year-over-year with Comparable Sales Growth of 1.5%
TORONTO, June 12, 2019 /CNW/ - Roots ("Roots," "Roots Canada" or the "Company") (TSX: ROOT), a premium outdoor lifestyle brand, today announced its financial results for its first quarter ended May 4, 2019 ("Q1 2019"). All financial results are reported in Canadian dollars unless otherwise stated. Certain metrics, including those expressed on an adjusted or comparable basis, are non-IFRS measures. See "Non-IFRS Measures and Industry Metrics".

First Quarter Fiscal 2019 Highlights
- Total sales of $54.4 million, up 6.5% from $51.0 million in the first quarter of fiscal 2018 ("Q1 2018")
- Direct-to-Consumer ("DTC") sales of $46.6 million, up 5.5% from $44.2 million in Q1 2018
- Comparable Sales Growth of 1.5% on top of Comparable Sales Growth of 6.8% in Q1 2018
- Gross margin of 52.5%, down from 57.0% in Q1 2018
- DTC Gross Margin of 54.7%, down from 59.1% in Q1 2018
- Selling, general and administrative expenses of $38.2 million, up 8.1% from $35.3 million in Q1 2018
- Adjusted EBITDA of ($6.2) million, compared to ($3.1) million in Q1 2018
- Basic loss per share of ($0.23), compared to ($0.13) per share in Q1 2018, and Adjusted Net Loss Per Share of ($0.17), compared to ($0.11) per share in Q1 2018
- Ended the quarter with 114 stores in Canada and seven in the United States
- Opened three partner-operated stores in China and one partner-operated store in Hong Kong along with an online launch on Zalora.com, ending the quarter with 115 stores in Taiwan, 39 in China and one in Hong Kong
"Our sales growth in the quarter reflects our strength as a seamless omni-channel retailer, the continued success of our renovation and relocation strategy and growth in our partner-operated business in Asia," said Jim Gabel, President and Chief Executive Officer of Roots. "Increased traffic and higher conversion drove Comparable Sales Growth of 1.5% for the quarter, or 8.3% on a two-year stacked basis. In addition, we saw positive consumer response to both new products and our recently launched brand campaign. While we realized short-term pressure on DTC gross margin, it was a result of our meaningful progress in improving our overall inventory position in advance of our move to our new integrated distribution centre in Q2 2019."
Mr. Gabel added: "We are further expanding our global reach, with our partner increasing our footprint in Asia, most notably opening a store and launching an online presence in Hong Kong in the quarter, as well as the exciting opening of our Chicago store in late May and plans to add a third location in the Washington D.C. area in fall 2019. eCommerce continues its accelerated growth; we have plans for another two to four renovation and relocation projects and expect increasing product and marketing excitement as we move through the year. As a result, we remain confident we will achieve our fiscal 2019 financial targets."
Summary of First Quarter Fiscal 2019 Financial Results
Sales
Total Q1 2019 sales increased 6.5% to $54.4 million from $51.0 million in Q1 2018, largely driven by an increase in DTC segment sales (corporate retail store and eCommerce sales) which grew 5.5% to $46.6 million from $44.2 million in Q1 2018. Comparable Sales Growth for Q1 2019 was 1.5%, reflecting increased traffic, higher conversion, positive consumer response to new products and benefits from store renovations and relocations (the renovation of five stores, as well as the relocation and expansion of seven stores since Q1 2018). The Company's Q1 2019 DTC sales also reflect the opening of one net new corporate retail store since Q1 2018.
Sales in the Partners and Other segment (wholesale Roots-branded products, royalties on partner retail sales, licensing to select manufacturing partners and the sale of certain custom Roots-branded products) for Q1 2019 were $7.7 million, up 12.8% from $6.9 million in Q1 2018, primarily as a result of sales growth in Asia. The Company also realized a $0.2 million foreign exchange benefit related to Partners and Other sales in Q1 2019 relative to Q1 2018.
Gross Profit
Total gross profit for Q1 2019 decreased 1.9% to $28.5 million from $29.1 million in Q1 2018. Q1 2019 gross profit in the DTC segment decreased 2.3% to $25.5 million from $26.1 million in Q1 2018. Q1 2019 DTC Gross Margin was 54.7%, down 440 basis points from a Q1 2018 DTC Gross Margin of 59.1%. The year-over-year gross margin decline reflects deeper discounting in Q1 2019 to improve the Company's overall inventory position in connection with the move to its new integrated distribution centre in Q2 2019, and to sell through higher levels of seasonal inventory. While Roots anticipates continued short-term pressure on DTC gross margin as it works to further improve its inventory position during Q2 2019, the Company does not expect the full-year impact to be of the same magnitude as Q1 2019.
Q1 2019 gross profit in the Partners and Other segment of $3.0 million was essentially flat with Q1 2018.
Selling, general and administrative expenses
Selling, general and administrative expenses for Q1 2019 were $38.2 million, up 8.1% from $35.3 million in Q1 2018. The year-over-year increase was predominantly driven by incremental costs to support a larger retail store footprint, costs resulting from higher omni-channel sales, strategic investments in the business and costs related to the Company's transition to its new distribution centre.
Adjusted EBITDA, Net Loss & Adjusted Net Loss
Adjusted EBITDA (excluding impact of IFRS 16) for Q1 2019 was ($6.2) million, down from ($3.1) million in Q1 2018.
Q1 2019 net loss was ($9.8) million, or ($0.23) basic loss per share, compared to ($5.6) million, or ($0.13) basic loss per share, in Q1 2018. In the quarter, the Company recorded an income tax recovery of $3.4 million, compared to a recovery of $1.8 million in Q1 2018, with an effective income tax recovery rate of 26.1%, up from 24.3% in Q1 2018.
Q1 2019 Adjusted Net Loss (excluding impact of IFRS 16) was ($7.2) million, or ($0.17) per share, compared to ($4.5) million, or ($0.11) per share, in Q1 2018.
Adoption of IFRS 16
As of Q1 2019, Roots is reporting lease obligations according to IFRS 16, with leases reflected on the Company's balance sheet and rent expense being replaced with interest and depreciation in the Company's income statement. The Q1 2019 IFRS 16 impact to SG&A was a decrease of $0.9 million; the impact to interest expense was an increase of $2.2 million; and the increase to deferred tax recovery was $0.3 million, resulting in a $0.9 million increase in net loss. Both Adjusted EBITDA and Adjusted Net Loss for Q1 2019 exclude the impact of IFRS 16. Through the remainder of fiscal 2019, Roots will continue to provide adjusted results to accurately compare fiscal 2019 quarterly and annual performance to the same periods in fiscal 2018.
Outlook
Roots believes the Company remains on track to achieve its Fiscal 2019 targets of:
- Sales between $358 million and $375 million,
- Adjusted EBITDA between $46 million and $50 million, and
- Adjusted net income between $20 million and $24 million.
Conference Call and Webcast Information
Roots will hold a conference call to discuss the Company's fiscal 2019 first quarter results on June 12, 2019 at 8:00 a.m. ET. All interested parties can join the call by dialing 647-427-7450 or 1-888-231-8191 and using conference ID: 5791399. Please dial-in 15 minutes prior to the call to secure a line. The conference call will be archived for replay until June 19, 2019 at midnight and can be accessed by dialing 416-849-0833 or 1-855-859-2056 and entering replay passcode 5791399.
A live audio webcast of the conference call will be available on the Events and Presentations section of the Company's investor website at http://investors.roots.com or by following the link here. Please connect at least 15 minutes prior to the conference call to ensure adequate time for any software download that may be required to join the webcast. An archived replay of the webcast will be available on the Company's website for one-year.
See Roots Interim Consolidated Financial Statements and the Company's Management's Discussion and Analysis of Financial Condition and Results of Operations for the First Quarter ended May 4, 2019 on the Company's investor website at https://investors.roots.com and on SEDAR at www.SEDAR.com.
About Roots
Established in 1973, Roots is a premium outdoor lifestyle brand. We unite the best of cabin and city through unmistakable style built with uncompromising comfort and quality. We offer a broad range of products that embody a comfortable cabin-meets-city style including: women's and men's apparel, leather goods, footwear, accessories, and kids, toddler and baby apparel. Starting from a little cabin in Algonquin Park, Canada, Roots has grown to become a global brand. As of May 4, 2019, we had 114 corporate retail stores in Canada, seven corporate retail stores in the United States, 115 partner-operated stores in Taiwan, 39 partner-operated stores in China, one partner-operated store in Hong Kong and a global eCommerce platform. Roots Corporation is a Canadian corporation doing business as "Roots" and "Roots Canada".
Non-IFRS Measures and Industry Metrics
This press release makes reference to certain non-IFRS measures including certain metrics specific to the industry in which we operate. These measures are not recognized measures under IFRS, do not have a standardized meaning prescribed by IFRS and, therefore, may not be comparable to similar measures presented by other companies. Rather, these measures are provided as additional information to complement those IFRS measures by providing further understanding of our results of operations from management's perspective. Accordingly, these measures are not intended to represent, and should not be considered as alternatives to net income or other performance measures derived in accordance with IFRS as measures of operating performance or operating cash flows or as a measure of liquidity. In addition to our results determined in accordance with IFRS, we use non-IFRS measures including EBITDA, Adjusted EBITDA, Adjusted Net Income (Loss), and Adjusted Net Income (Loss) per Share. This press release also refers to Comparable Sales Growth (Decline), a commonly used metric in our industry but that may be calculated differently compared to other companies. We believe these non-IFRS measures and industry metrics provide useful information to both management and investors in measuring our financial performance and condition and highlight trends in our core business that may not otherwise be apparent when relying solely on IFRS measures. Definitions and reconciliations of non-IFRS measures to the relevant reported measures can be found in our MD&A under "Cautionary Note Regarding Non-IFRS Measures and Industry Metrics", which is available on SEDAR at www.sedar.com or the Company's Investor Relations website at https://investors.roots.com.
Forward-Looking Information
Certain information in this press release contains forward-looking information. This information is based on management's reasonable assumptions and beliefs in light of the information currently available to us and are made as of the date of this press release. Actual results and the timing of events may differ materially from those anticipated in the forward-looking information as a result of various factors. Information regarding our expectations of future results, performance, achievements, prospects or opportunities or the markets in which we operate is forward-looking information. Statements containing forward-looking information are not facts but instead represent management's expectations, estimates and projections regarding future events or circumstances. Many factors could cause our actual results, level of activity, performance or achievements or future events or developments to differ materially from those expressed or implied by the forward-looking statements.
See "Forward-Looking Information" and "Risk Factors" in the Company's current Annual Information Form for a discussion of the uncertainties, risks and assumptions associated with these statements. Readers are urged to consider the uncertainties, risks and assumptions carefully in evaluating the forward-looking information and are cautioned not to place undue reliance on such information. We have no intention and undertake no obligation to update or revise any forward-looking statements, whether as a result of new information, future events or otherwise, except as required by applicable securities law.
ROOTS CORPORATION | ||||||
As at May 4, | As at February 2, | |||||
2019 | 2019 | |||||
Assets | ||||||
Current assets: | ||||||
Cash | $ | 495 | $ | 1,991 | ||
Accounts receivable | 5,384 | 6,627 | ||||
Inventories | 45,391 | 49,533 | ||||
Prepaid expenses | 6,615 | 6,443 | ||||
Derivative assets | 1,429 | 366 | ||||
Total current assets | 59,314 | 64,960 | ||||
Non-current assets: | ||||||
Loan receivable | 562 | 562 | ||||
Lease receivable | 1,721 | – | ||||
Fixed assets | 69,388 | 64,163 | ||||
Right-of-use assets | 134,239 | – | ||||
Intangible assets | 195,668 | 198,724 | ||||
Goodwill | 52,705 | 52,705 | ||||
Total non-current assets | 454,283 | 316,154 | ||||
Total assets | $ | 513,597 | $ | 381,114 | ||
Liabilities and Shareholders' Equity | ||||||
Current liabilities: | ||||||
Bank indebtedness | $ | 9,131 | $ | 12,409 | ||
Accounts payable and accrued liabilities | 18,847 | 22,291 | ||||
Deferred revenue | 4,660 | 5,498 | ||||
Income taxes payable | 1,556 | 6,445 | ||||
Current portion of lease liabilities | 28,512 | – | ||||
Current portion of long-term debt | 4,984 | 4,984 | ||||
Total current liabilities | 67,690 | 51,627 | ||||
Non-current liabilities: | ||||||
Deferred tax liabilities | 22,761 | 22,761 | ||||
Deferred lease costs | – | 10,063 | ||||
Finance lease obligation | – | 504 | ||||
Long-term portion of lease liabilities | 119,648 | – | ||||
Long-term debt | 98,775 | 80,031 | ||||
Other non-current liabilities | – | 1,424 | ||||
Total non-current liabilities | 241,184 | 114,783 | ||||
Total liabilities | 308,874 | 166,410 | ||||
Shareholders' equity: | ||||||
Share capital | 196,853 | 196,853 | ||||
Contributed surplus | 4,249 | 3,975 | ||||
Accumulated other comprehensive income | 1,048 | 268 | ||||
Retained earnings | 2,573 | 13,608 | ||||
Total shareholders' equity | 204,723 | 214,704 | ||||
Total liabilities and shareholders' equity | $ | 513,597 | $ | 381,114 | ||
On behalf of the Board of Directors:
"Erol Uzumeri" | Director |
"Richard P. Mavrinac" | Director & Audit Committee Chair |
ROOTS CORPORATION Interim Condensed Consolidated Statement of Net Income (Loss) (In thousands of Canadian dollars, except per share amounts) (Unaudited) For the 13 week periods ended May 4, 2019 and May 5, 2018 | ||||
May 4, 2019 | May 5, 2018 | |||
(13 weeks) | (13 weeks) | |||
Sales | $ | 54,352 | $ | 51,029 |
Cost of goods sold | 25,841 | 21,959 | ||
Gross profit | 28,511 | 29,070 | ||
Selling, general and administrative expenses | 38,164 | 35,304 | ||
Loss before interest expense and | (9,653) | (6,234) | ||
income taxes recovery | ||||
Interest expense | 3,559 | 1,152 | ||
Loss before income taxes | (13,212) | (7,386) | ||
Income taxes recovery | (3,444) | (1,796) | ||
Net loss | $ | (9,768) | $ | (5,590) |
Basic and diluted loss per share | $ | (0.23) | $ | (0.13) |
ROOTS CORPORATION For the 13 week periods ended May 4, 2019 and May 5, 2018 | ||||
May 4, 2019 | May 5, 2018 | |||
(13 weeks) | (13 weeks) | |||
Net loss | $ | (9,768) | $ | (5,590) |
Other comprehensive income, net of taxes: | ||||
Items that may be subsequently | ||||
reclassified to profit or loss: | ||||
Effective portion of changes in fair | 1,362 | 2,435 | ||
value of cash flow hedges | ||||
Cost of hedging excluded from | 86 | (14) | ||
cash flow hedges | ||||
Tax impact of cash flow hedges | (386) | (645) | ||
Total comprehensive loss | $ | (8,706) | $ | (3,814) |
ROOTS CORPORATION Interim Condensed Consolidated Statement of Changes in Shareholders' Equity (In thousands of Canadian dollars, except per share amounts) (Unaudited) For the 13 week periods ended May 4, 2019 and May 5, 2018 | ||||||||||
May 4, 2019 (13 weeks) | Share | Contributed | Retained | Accumulated | Total | |||||
Balance, February 2, 2019 | $ | 196,853 | $ | 3,975 | $ | 13,608 | $ | 268 | $ | 214,704 |
Adjustment on adoption of IFRS 16 | – | – | (1,267) | – | (1,267) | |||||
Balance, February 3, 2019 | $ | 196,853 | $ | 3,975 | $ | 12,341 | $ | 268 | $ | 213,437 |
Net loss | – | – | (9,768) | – | (9,768) | |||||
Net gain from change | – | – | – | 1,062 | 1,062 | |||||
in fair value of cash flow hedges, | ||||||||||
net of income taxes | ||||||||||
Transfer of realized gain on cash | – | – | – | (282) | (282) | |||||
flow hedges to inventories, net | ||||||||||
of income taxes | ||||||||||
Share-based compensation | – | 274 | – | – | 274 | |||||
Balance, May 4, 2019 | $ | 196,853 | $ | 4,249 | $ | 2,573 | $ | 1,048 | $ | 204,723 |
May 5, 2018 (13 weeks) | Share | Contributed | Retained | Accumulated | Total | |||||
Balance, February 4, 2018 | $ | 195,994 | $ | 1,675 | $ | 2,208 | $ | (904) | $ | 198,973 |
Net loss | – | – | (5,590) | – | (5,590) | |||||
Net gain from change | – | – | – | 1,776 | 1,776 | |||||
in fair value of cash flow hedges, | ||||||||||
net of income taxes | ||||||||||
Transfer of realized loss on cash | – | – | – | 8 | 8 | |||||
flow hedges to inventories, net | ||||||||||
of income taxes | ||||||||||
Share-based compensation | – | 610 | – | – | 610 | |||||
Balance, May 5, 2018 | $ | 195,994 | $ | 2,285 | $ | (3,382) | $ | 880 | $ | 195,777 |
ROOTS CORPORATION Interim Condensed Consolidated Statement of Cash Flows (In thousands of Canadian dollars, except per share amounts) (Unaudited) For the 13 week periods ended May 4, 2019 and May 5, 2018 | ||||||
May 4, 2019 | May 5, 2018 | |||||
(13 weeks) | (13 weeks) | |||||
Cash provided by (used in): | ||||||
Operating activities: | ||||||
Net loss | $ | (9,768) | $ | (5,590) | ||
Items not involving cash: | ||||||
Depreciation and amortization | 9,019 | 2,752 | ||||
Share-based compensation expense | 274 | 610 | ||||
Deferred lease recovery | – | (588) | ||||
Amortization of lease intangibles | – | 136 | ||||
Interest expense | 3,559 | 1,152 | ||||
Income taxes recovery | (3,444) | (1,796) | ||||
Interest paid | (1,227) | (1,011) | ||||
Payment of interest on lease liabilities | (2,177) | – | ||||
Taxes paid | (1,268) | (982) | ||||
Change in working capital: | ||||||
Accounts receivable | 1,243 | 1,071 | ||||
Inventories | 4,142 | (3,924) | ||||
Prepaid expenses | (172) | 23 | ||||
Accounts payable and accrued liabilities | (3,444) | 886 | ||||
Deferred revenue | (838) | (481) | ||||
(4,101) | (7,742) | |||||
Financing activities: | ||||||
Issuance of long-term debt | 20,000 | 10,000 | ||||
Long-term debt financing costs | (163) | – | ||||
Repayment of long-term debt | (1,246) | (1,246) | ||||
Payment of principal on lease liabilities | (4,523) | (85) | ||||
14,068 | 8,669 | |||||
Investing activities: | ||||||
Additions to fixed assets | (8,185) | (5,153) | ||||
Tenant allowance received | – | 471 | ||||
(8,185) | (4,682) | |||||
Increase (decrease) in cash | 1,782 | (3,755) | ||||
Cash and bank indebtedness, beginning of period | (10,418) | 1,809 | ||||
Cash and bank indebtedness, end of period | $ | (8,636) | $ | (1,946) | ||
SOURCE Roots Corporation
View original content to download multimedia: http://www.newswire.ca/en/releases/archive/June2019/12/c7524.html
Investor Relations, Kristen Davies, kdavies@roots.com, 416-781-3574 Ext. 4116; Public Relations: Elyse Goody, egoody@roots.com, 416-781-3574 Ext. 4332Copyright CNW Group 2019