

13 May 2025
MARSTON'S PLC
("Marston's" or "the Group")
INTERIM RESULTS FOR THE 26 WEEKS ENDED 29 MARCH 2025
STRONG PROFIT GROWTH, SIGNIFICANT STRATEGIC PROGRESS, CONFIDENT IN
FULL-YEAR OUTLOOK
Marston's, a leading local pub business with an estate of 1,333 pubs across the UK, today announces its Interim Results for the 26 weeks ended 29 March 2025. The period under review commenced on 29 September 2024.
|
Underlying |
Statutory / Total |
|||||
|
H1 2025 |
H1 2024 |
Change |
H1 2025 |
H1 2024 |
Change |
|
|
Total revenue (£m) |
427.4 |
428.1 |
(0.2)% |
427.4 |
428.1 |
(0.2)% |
|
EBITDA1 (£m) |
85.9 |
75.5 |
13.8% |
- |
- |
- |
|
Pub operating profit (£m) |
63.3 |
52.7 |
20.1% |
61.3 |
51.8 |
18.3% |
|
Profit before tax1 (£m) |
19.0 |
(0.2) |
£19.2m |
19.5 |
(26.9) |
£46.4m |
|
Earnings per share1 (pence) |
2.2 |
0.0 |
2.2p |
2.3 |
(3.2) |
5.5p |
|
NAV per share (£) |
- |
- |
- |
1.07 |
0.95 |
12.6% |
|
EBITDA margin1 (%) |
20.1 |
17.6 |
250bps |
- |
- |
- |
|
Underlying operating margin1 (%) |
14.8 |
12.3 |
250bps |
- |
- |
- |
|
Capex (£m) |
- |
- |
- |
31.0 |
21.7 |
42.9% |
|
Recurring free cash flow (£m) |
- |
- |
- |
5.9 |
7.1 |
(16.9)% |
|
Net debt excluding IFRS 16 (£m) |
- |
- |
- |
881.1 |
1,160.9 |
(24.1)% |
1 - Results from continuing operations.
Strong performance underpins confidence in full-year outlook
• Like-for-like (LFL) sales were up 2.9% in the 31 weeks to 3 May, with strong growth of 10.5% in the 5 weeks since the period end. In H1 2025, LFL sales grew by 1.3% reflecting timing of Easter & Mothers Day which fell in H1 in 2024 and in H2 2025
• Total revenue stable at £427.4 million (H1 2024: £428.1 million) despite c.£50 million of disposals in FY2024, demonstrating the strength of the core estate
• Underlying pub operating profit increased by 20.1% to £63.3 million (H1 2024: £52.7 million), underpinned by strong operational delivery and strategic cost-saving measures
• EBITDA margin1 expanded by approximately 250bps supported by data and technology-led improvements in labour deployment and procurement efficiency which form a core part of our refreshed strategy
• Underlying profit before tax1 of £19.0 million (H1 2024: £0.2 million loss), driven by robust revenue performance and operational discipline
Strategic investment and debt reduction on-track
• Recurring free cash flow of £5.9 million (H1 2024: £7.1 million), reflecting the timing of working capital in H1, which we expect to largely unwind by the year end, and increased investment capex aligned to our strategic growth priorities
• Capex of £31.0 million (H1 2024: £21.7 million)
• Net debt2 reduced to £881.1 million (H1 2024: £1,160.9 million), as CMBC sale supported a stronger balance sheet and increased financial flexibility; leverage ratio2 of 4.9x, down from 5.2x at FY2024
• In line with net debt reduction, net interest costs have reduced to £42.8 million (H1 2024: £48.3 million)
Significant strategic and operational progress
• Guest satisfaction remained high, with a Reputation score of 800 (H1 2024: 787), maintained during a period of significant transformation. Further improvement is targeted as initiatives continue to embed
• Demand-driving events delivered enhanced customer engagement, with H1 highlights including Paddington in Peru partnership and the Luke Humphries Cool Hand Cup darts tournament
• Pub format rollout progressing well, supporting broader appeal across guest segments. Of the 30 new openings planned for FY2025, 18 have already been delivered on time and on budget, with strong early trading and guest feedback
• Cost efficiency benefits accelerating, following full rollout of labour planning dashboards which deliver improved productivity through real-time, data-led scheduling, helping offset inflationary cost pressures
• Enhanced Order & Pay live across more than 750 pubs, supporting upselling, premiumisation and higher spend per guest. Full estate rollout expected by the end of the financial year
Outlook
• LFL sales in the 5 weeks since 29 March up 10.5%, demonstrating the Group's strategic progress and the growing impact of revenue-driving initiatives
• Strong trading across key occasions - including Christmas, Mother's Day, and Easter - alongside the continued rollout of strategic initiatives with a strong pipeline of demand driving events, such as Trivial Pursuit 'Win a Wedge', reinforces confidence in encouraging H2 outlook
• Capex expected to total c.£60 million for FY2025
• Confident in delivering recurring free cash flow of over £50 million a year in the near-to-medium term, supporting further investment and deleveraging
• On track to deliver targets outlined at the October 2024 Capital Markets Day, with FY2025 performance expected to be in line with current market expectations3
Justin Platt, CEO of Marston's PLC, commented:
"The first half has been a period of significant momentum for Marston's, with the execution of a market leading pub operating model, investment in our differentiated pub formats and progress in our digital transformation driving strong margin and profit growth.
"Through our impactful calendar of demand-driving events and the dedication of our passionate, local teams, we continue to deliver great guest experiences every day, powering our industry-leading guest reputation scores. With strong recent trading across our nationwide estate of great local pubs, we are excited for the summer months ahead.
"We remain confident in achieving our financial goals for the full year and focused on executing our strategy as a pure play hospitality company to deliver sustainable growth and increasing returns for our shareholders."
Results Call:
An analyst and investor presentation will be held on 13 May 2025 at 09.00am UK time.
Participants need to register using the link below.
https://brrmedia.news/MARS_HY25
Enquiries:Investors
Marston's PLC
Justin Platt, CEO Tel: 01902 329516
Hayleigh Lupino, CFO
Matthew Lee, Investor Relations matthew.lee@marstons.co.uk
Rebecca Jamieson, Investor Relations rebecca.jamieson@marstons.co.uk
Media
Marston's PLC
Giles Robinson, Director of Corporate Affairs giles.robinson@marstons.co.uk
Sodali & Co
Ben Foster Tel: 020 7250 1446
Russ Lynch
Oliver Banks marstons@sodali.com
Notes
1 - Results from continuing operations.
2 - Net debt excluding IFRS 16 lease liabilities. Leverage on a pre-IFRS 16 basis.
3 - External market consensus for FY2025 for underlying PBT is £66.8 million.
Notes to Editors
Marston's PLC, listed on the London Stock Exchange under the ticker MARS, is a leading local pub business with an estate of 1,333 pubs nationally, comprising managed, partnership ('franchised') and tenanted and leased pubs. Marston's employs around 10,000 people. More information is available at: https://www.marstonspubs.co.uk/.
The Group uses a number of alternative performance measures (APMs) to enable management and users of the financial statements to better understand elements of financial performance in the period. APMs are explained and reconciled in Note 15 to the financial statements.
Strategic delivery
As laid out at the October 2024 Capital Markets Day (CMD), focus during the first half of the year has primarily been on the first three of the five core value drivers which form our long-term strategy:
· Executing a market-leading pub operating model;
· Rolling out differentiated capex-backed pub formats; and,
· Advancing our digital transformation.
These areas are central to driving near-term performance and in establishing the foundations for sustainable growth over the long-term. We are very pleased with the tangible progress made across each during H1.
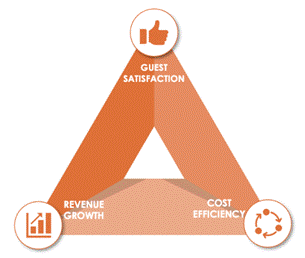
Delivering a market-leading operating model is central to the Group's strategy and underpins our progress across all areas of performance.
The model is built around balancing three core pillars: revenue growth, cost efficiency, and guest satisfaction - all of which work together to create a more consistent, profitable, and scalable business and each of which are covered in detail below.
Revenue growth
Our focus remains on growing footfall and visitation through well-executed, demand-driving events.
In the first half of the year, we delivered a nationally curated calendar of events, including Cheers to Heroes, Marston's Magical Christmas, Paddington in Peru, and the launch of the Luke Humphries Cool Hand Cup. These events drove strong engagement and customer visitation across the estate. In addition, Christmas Day and Mother's Day both delivered record trading performances for their respective occasions, underlining the strength of our proposition and reinforcing our appeal as a go-to destination for celebratory occasions.
Looking ahead, we have an exciting calendar of events planned for H2, including Trivial Pursuit 'Win a Wedge' and a pub quiz series with Paddy McGuinness - building on current momentum and continuing to attract guests into our pubs.
Cost efficiency
We retain a relentless focus on driving cost efficiency across the business.
A key development in the first half has been the rollout of our labour scheduling tool, which we anticipate being live across all managed pubs by Q4 2025. This real-time planning tool enables rota optimisation based on actual trading patterns, ensuring the right team is in place at the right time - driving productivity, improving the guest experience, and supporting operational flexibility.
Alongside labour optimisation, menu re-design, targeted product placement and further food and drink simplification are supporting more efficient, margin accretive operations, while maintaining guest choice and quality. Additionally, we have made further progress on energy efficiency with smart metering now live across the estate and fixed electricity contracts to the end of the financial year.
Importantly, the combined effect of our efficiency programme will enable the Group to fully offset the financial impact of recent increases to National Insurance and the National Minimum Wage - an outcome that reflects the effectiveness of our model and the pace at which we are embedding smarter, more efficient ways of working.
Guest satisfaction
At the end of H1, our Reputation Score was 800 points, up from 787 at the same period last year. This progress is particularly encouraging given the scale of transformation delivered across the business over the past six months - including accelerated capex, the rollout of Order & Pay, smarter labour deployment, and menu re-design and simplification. Maintaining consistently high guest satisfaction during this level of internal change is a strong indicator of the robustness of our offer and our team's focus on operational delivery.
As these initiatives embed and gain traction, we are targeting further improvement in guest satisfaction. Moreover, we continue to see a clear correlation between guest satisfaction and revenue performance, underlining the commercial value of delivering consistently high standards across the estate.
Capex to create differentiated pub formats
Our format-led strategy is focused on creating a more balanced and guest-centric pub portfolio through the development of five distinct propositions: Locals Pub, Family Pub, Grandstand, Two-Door, and Adult Dining. These formats are designed to meet evolving guest needs and cater to a wide range of occasions - from midweek meals and family outings to casual drinks and big sporting moments.
We plan to deliver 30 new site launches in FY2025, with 18 completed in H1, all delivered on-time and within budget. These pubs are trading well and receiving strong guest feedback reinforcing both the appeal of our tailored formats and quality of execution.
The Two-Door format - designed to appeal to both regular drinkers and family diners by providing two distinct and separated environments under one roof - has delivered very encouraging early results. Following successful pilots in FY2024, it has been a key focus of the FY2025 rollout and further expansion is planned for H2.
Advancing digital transformation through Order & Pay
Digital transformation is critical to enhancing both the guest experience and operational efficiency across the estate. Central to this agenda is the rollout of our new Order & Pay platform, which launched in March 2025 and is now live across more than 750 pubs, with full estate coverage expected by the end of the financial year.
Initial results have been extremely encouraging. The platform supports upselling and premiumisation and already we are seeing over 10% uplift in revenue per transaction. It also improves speed of service and convenience, particularly in high-volume venues, further strengthening guest satisfaction. With the peak trading period ahead, Order & Pay is especially well-suited to summer months, offering guests a more seamless experience in pub gardens and outdoor areas, where trips to the bar are naturally less convenient.
Sustainability
We have continued to make strong progress across our ESG agenda in the first half of FY2025. Our focus on reducing food waste has seen 1,312 tonnes saved - equating to c.76% of our 2030 target already achieved.
In support of our environmental commitments, 39 sites are now solar enabled, including our Pub Support Centre, and we have expanded our electric vehicle charging network to 459 rapid and ultra-rapid chargers across 193 sites. This remains the largest private network of its kind in UK hospitality, having now powered over 100 million miles of cleaner transport.
We were proud to be named the UK pub industry's Best Employer by the Financial Times and ranked among the Top 100 employers nationally - a testament to our ongoing investment in team development, wellbeing and engagement.
Outlook
Following a strong first half, we are looking ahead to a positive summer trading period, supported by a compelling calendar of events, our fantastic outdoor spaces, and the growing impact of Order & Pay.
Despite inflationary pressures, we are in a strong position thanks to our relentless focus on driving efficiencies and delivering margin improvement, which will allow us to offset these headwinds. The second half will see continued progress across our strategic value drivers, including further rollout of our pub formats and digital tools.
We remain well-placed to deliver targets outlined at the October 2024 CMD, with FY2025 performance expected to be in line with current market expectations.
Financial Review
Revenue
Total revenue was consistent at £427.4 million (H1 2024: £428.1 million), despite c.£50 million of strategic disposals in the prior year. Like-for-like sales were up 1.3% versus H1 2024 and both food and drink sales were in growth, with Mother's Day and Easter holidays displaced into H2 in FY2025. Our expertise in managing local pubs along with our strategic commitment to delivering exceptional guest experiences and enhancing our Reputation score has supported this growth.
Total retail sales in the Group's managed and partnership pubs for the 26-week period increased by 0.7% to £399.5 million (H1 2024: £396.6 million). We operated 151 pubs under the tenanted and leased model generating revenues of £12.3 million (H1 2024: £17.1 million). As outlined at our CMD, it remains our intention to strategically expand our managed and partnership models over the medium-term.
Accommodation sales were broadly stable at £14.7 million (H1 2024: £14.9 million), with continued demand for UK staycations, and machine income was £15.6 million (H1 2024: £14.4 million).
Profit
Underlying operating profit from continuing operations increased by 20.1% to £63.3 million (H1 2024: £52.7 million). Underlying operating margins grew by 250 basis points compared to the last half-year, resulting in an enhanced margin of 14.8% (H1 2024: 12.3%). Total operating profit from continuing operations was £61.3 million (H1 2024: £51.8 million).
Underlying EBITDA from continuing operations increased by 13.8% to £85.9 million (H1 2024: £75.5 million). The EBITDA margin was 20.1%, marking a significant increase on last year (H1 2024: 17.6%) from growth in executing our market-leading operating model together with relentless focus on driving savings in energy, simplification and labour costs, reflecting strong progress with our margin expansion strategy as set out in the CMD.
Underlying profit before tax from continuing operations increased by £19.2 million to £19.0 million (H1 2024: loss before tax of £(0.2) million) reflecting the impact of margin improvement. Statutory profit before tax from continuing operations was £19.5 million (H1 2024: loss before tax of £(26.9) million).
The difference between underlying profit before tax and profit before tax from continuing operations is a net non-underlying credit of £0.5 million, the details of which are set out below.
The statutory profit from continuing operations was £14.3 million (H1 2024: loss of £(20.0) million). The statutory profit from both continuing and discontinued operations was £14.3 million (H1 2024: loss of £(36.6) million).
Non-underlying items
There is a net non-underlying credit of £0.5 million before tax and £0.4 million after tax from continuing operations.
The £0.5 million credit relates to a £2.5 million net gain in respect of interest rate swap movements offset by £(2.0) million of reorganisation, restructuring and relocation costs.
The tax charge relating to these non-underlying items is £0.1 million.
Taxation
The estimated underlying tax rate is 26.8% (H1 2024 continuing operations: 100.0%, H1 2024 total operations: 25.0%) with an underlying tax charge of £5.1 million (H1 2024: credit of £0.2 million). The overall tax rate is 26.7% (H1 2024 continuing operations: 25.7%, H1 2024 total operations: 15.9%) with a total tax charge of £5.2 million (H1 2024: credit of £6.9 million) on total profit before tax of £19.5 million. The estimated rate is higher than the standard rate of corporation tax, mainly due to the impact of disallowed depreciation on non-qualifying assets, reduced by the positive impact of additional amounts upon which tax relief is available. The effective tax rate for prior years including discontinued operations was positively impacted by income from associates, now discontinued, recognised on a post-tax basis.
Earnings per share
Basic earnings per share from continuing operations were 2.3 pence (H1 2024: (3.2) pence loss per share). Basic underlying earnings per share from continuing operations were 2.2 pence per share (H1 2024: nil pence per share).
Capital expenditure
Our capital expenditure strategy was set out in the CMD, with a near-term target spend of 7-8% of revenue and projects to enhance the estate through differentiated formats. Making progress on this, capital expenditure was £31.0 million (H1 2024: £21.7 million). We expect that capital expenditure will be around £60 million in FY2025.
Property, net assets and disposals
The carrying value of the estate remains at £2.1 billion (H1 2024: £2.1 billion).
Net assets increased to £678.4 million (FY2024: £654.8 million, H1 2024: £601.5 million), with a net asset value per share of £1.07 (FY2024: £1.03, H1 2024: £0.95).
During the half year, the Group generated £4.5 million in net proceeds from non-core pub disposals, which were part of the FY2024 strategic disposal programme. Disposal proceeds were in line with book value.
Pensions
The balance on our final salary scheme was a £20.5 million surplus at 29 March 2025 (28 September 2024: £13.1 million surplus). Administrative and investment expenses associated with the scheme were £0.7 million; no other contributions were required.
Dividends
As set out at the CMD, our capital allocation framework is focused on delivering sustainable long-term value for shareholders. The Board confirms that no interim dividend will be paid in respect of FY2025, however, it remains cognisant of the importance of dividends to shareholders.
Cash flow
Operating cash inflow was £81.4 million (H1 2024: £77.1 million). The H1 2024 operating cash inflow excludes the CMBC dividend of £13.8 million. Operating cash flow for H1 2024 including the CMBC dividend was £90.9 million. Cash adjusted EBITDA was £85.1 million (H1 2024: £74.8 million).
Net interest paid, including bank fees and swap termination costs, together with purchase of own shares were £44.5 million (H1 2024: £48.3 million) and capital expenditure was £31.0 million (H1 2024: £21.7 million), resulting in recurring free cash flow of £5.9 million (H1 2024: £7.1 million). Recurring free cash flow in FY2025 includes higher levels of capital expenditure as per our strategic plans and working capital timing differences. Going forwards, we are confident in our plans to meet our target of over £50 million a year in recurring free cash flow in the near-to-medium term.
Taking into account net disposal proceeds received of £4.5 million (H1 2024: £9.6 million), CMBC dividend of £nil (H1 2024: £13.8 million) and costs in respect of last year's CMBC disposal of £(2.8) million (H1 2024: £nil), net cash flow for the period was £7.6 million (H1 2024: £30.5 million).
Debt and financing
Net debt, excluding IFRS 16 lease liabilities, was £881.1 million, a reduction of £2.6 million from last year-end (FY2024: £883.7 million). Total net debt of £1,252.4 million (FY2024: £1,257.4 million) includes IFRS 16 lease liabilities of £371.3 million (FY2024: £373.7 million).
The Group has continued to make progress in debt reduction during the year; pre-IFRS debt/EBITDA leverage reduced to 4.9x (FY2024: 5.2x). Leverage including IFRS 16 reduced to 6.2x (FY2024: 6.5x).
During the half year, we successfully secured the extension to our banking facility, which was due to expire in July 2026. The revised bank facility to July 2027 is for £200.0 million, of which £40.0 million was drawn at the half-year.
There are one-off transaction costs of £0.9 million and the costs of the facilities are variable: to be determined by the level of leverage, or drawings, from time-to-time alongside changes in the SONIA rate. £60 million of the facilities are hedged.
The Group's financing, providing an appropriate level of flexibility and liquidity for the medium term, comprises:
· £200.0 million bank facility to July 2027 - at the half-year £40.0 million was drawn providing headroom of £160.0 million and non-securitised cash balances of £11.2 million
· Seasonal overdraft with a limit of £5.0-£20.0 million depending on dates - unused at the half-year. The overdraft limit is expected to reduce to a flat £5.0 million in the near future
· Long-term securitisation debt of £538.8 million - at the half-year none of the £120.0 million securitisation liquidity facility was utilised. Securitised cash balances were £21.1 million
· Long-term other lease-related borrowings of £338.7 million
· £371.3 million of IFRS 16 leases
The vast majority of our borrowings are long-dated and asset-backed, including the securitisation debt of £538.8 million. The weighted average fixed interest rate payable by the Group on its securitised debt at 29 March 2025 was 6.44%. The loan to value of the debt, which is improving year-on-year, is currently 50% for debt excluding IFRS 16 lease liabilities and 47% for the securitisation debt.
The securitisation is fully hedged to 2035. Other lease-related borrowings are index-linked capped and collared at 1% and 4%. There is a £60 million floating-to-fixed interest rate swap against the bank facility: £60 million is fixed at 3.45% until 2029.
In summary, we have adequate cash headroom in our bank facility to provide operational liquidity. Importantly, 100% of our medium to long-term financing is hedged for interest rate risk, thereby minimising any exposure to market interest rate movements.
Going concern
Having considered the Group's forecast financial position and exposure to principal risks and uncertainties, including cost and inflationary pressures, the Directors have a reasonable expectation that the Group has adequate resources to continue to operate within its borrowing facilities and covenants for a period of at least 12 months from the date of signing the financial statements. Accordingly, the financial statements have been prepared on the going concern basis. Full details are included in Note 1 of the financial statements.
Key estimates and significant judgements
Under IFRS the Group is required to make estimates and assumptions that affect the application of policies and reported amounts. Details are provided in Note 1 to the 2024 Annual Report and Accounts.
Notes:
· Prior period was a 26-week period to 30 March 2024.
· The Group uses a number of alternative performance measures (APMs) to enable management and users of the financial statements to better understand elements of financial performance in the period. APMs are explained and reconciled in Note 15 to the financial statements.
Responsibility Statement of the Directors in respect of the Interim Results
The Directors confirm that these condensed consolidated interim financial statements have been prepared in accordance with UK-adopted IAS 34 'Interim Financial Reporting' and that the interim management report includes a fair review of the information required by DTR 4.2.7R and DTR 4.2.8R of the United Kingdom Financial Conduct Authority, namely:
· an indication of important events that have occurred during the first six months of the financial year and their impact on the condensed set of financial statements, and a description of the principal risks and uncertainties for the remaining six months of the financial year; and
· material related party transactions in the first six months of the financial year and any material changes in the related party transactions described in the last Annual Report and Accounts.
The Directors of Marston's PLC are listed in the Marston's PLC Annual Report and Accounts for 28 September 2024. A list of current Directors is maintained on the Marston's PLC website: www.marstonspubs.co.uk.
By order of the Board:
Justin Platt Hayleigh Lupino
Chief Executive Officer Chief Financial Officer
13 May 2025 13 May 2025
GROUP INCOME STATEMENT (UNAUDITED)
For the 26 weeks ended 29 March 2025
|
26 weeks to 29 March 2025 |
26 weeks to 30 March 2024 (restated)2 |
52 weeks to 28 September 2024 |
||||||
|
Note |
Underlying1 £m |
Non- underlying1 £m |
Total £m |
Underlying1 £m |
Non- underlying1 £m |
Total £m |
Total £m |
|
|
Revenue |
3 |
427.4 |
- |
427.4 |
428.1 |
- |
428.1 |
898.6 |
|
Net operating expenses |
4 |
(364.1) |
(2.0) |
(366.1) |
(375.4) |
(0.9) |
(376.3) |
(746.9) |
|
Operating profit/(loss) |
63.3 |
(2.0) |
61.3 |
52.7 |
(0.9) |
51.8 |
151.7 |
|
|
Finance costs |
5 |
(45.1) |
- |
(45.1) |
(53.5) |
- |
(53.5) |
(106.5) |
|
Finance income |
5 |
0.8 |
- |
0.8 |
0.6 |
- |
0.6 |
1.4 |
|
Interest rate swap movements |
4, 5 |
- |
2.5 |
2.5 |
- |
(25.8) |
(25.8) |
(32.2) |
|
Net finance (costs)/income |
4, 5 |
(44.3) |
2.5 |
(41.8) |
(52.9) |
(25.8) |
(78.7) |
(137.3) |
|
Profit/(loss) before taxation |
19.0 |
0.5 |
19.5 |
(0.2) |
(26.7) |
(26.9) |
14.4 |
|
|
Taxation |
4, 6 |
(5.1) |
(0.1) |
(5.2) |
0.2 |
6.7 |
6.9 |
3.1 |
|
Profit/(loss) for the period from continuing operations |
13.9 |
0.4 |
14.3 |
- |
(20.0) |
(20.0) |
17.5 |
|
|
Discontinued operations |
||||||||
|
Loss for the period from discontinued operations |
7 |
- |
- |
- |
(0.6) |
(16.0) |
(16.6) |
(36.0) |
|
Profit/(loss) for the period attributable to equity shareholders |
13.9 |
0.4 |
14.3 |
(0.6) |
(36.0) |
(36.6) |
(18.5) |
|
|
Earnings/(loss) per share: |
Note |
26 weeks to 29 March 2025 p |
26 weeks to 30 March 2024 (restated)2 p |
52 weeks to 28 September 2024 p |
||||
|
Basic earnings/(loss) per share |
8 |
|||||||
|
Total |
2.3 |
(5.8) |
(2.9) |
|||||
|
Continuing |
2.3 |
(3.2) |
2.8 |
|||||
|
Discontinued |
- |
(2.6) |
(5.7) |
|||||
|
Basic underlying1 earnings/(loss) per share |
8 |
|||||||
|
Total |
2.2 |
(0.1) |
5.3 |
|||||
|
Continuing |
2.2 |
- |
5.2 |
|||||
|
Discontinued |
- |
(0.1) |
0.1 |
|||||
|
Diluted earnings/(loss) per share |
8 |
|||||||
|
Total |
2.1 |
(5.8) |
(2.8) |
|||||
|
Continuing |
2.1 |
(3.2) |
2.7 |
|||||
|
Discontinued |
- |
(2.6) |
(5.5) |
|||||
|
Diluted underlying1 earnings/(loss) per share |
8 |
|||||||
|
Total |
2.1 |
(0.1) |
5.1 |
|||||
|
Continuing |
2.1 |
- |
5.0 |
|||||
|
Discontinued |
- |
(0.1) |
0.1 |
|||||
1 Alternative performance measures (APMs) are reconciled to the interim financial information in note 15.
2 Following the disposal of the Group's 40% investment in Carlsberg Marston's Limited, the comparative information for the 26 weeks ended 30 March 2024 has been restated to show discontinued operations separately from continuing operations.
GROUP STATEMENT OF COMPREHENSIVE INCOME (UNAUDITED)
For the 26 weeks ended 29 March 2025
|
26 weeks to 29 March 2025 |
26 weeks to 30 March 2024 |
52 weeks to 28 September 2024 |
||
|
£m |
£m |
£m |
||
|
Profit/(loss) for the period |
14.3 |
(36.6) |
(18.5) |
|
|
Items of other comprehensive income that may subsequently be reclassified to profit or loss |
||||
|
Gains/(losses) arising on cash flow hedges |
1.9 |
(2.6) |
(2.8) |
|
|
Transfers to the income statement on cash flow hedges |
3.4 |
4.0 |
7.6 |
|
|
Other comprehensive income/(expense) of associates relating to discontinued operations |
- |
0.2 |
(0.1) |
|
|
Tax on items that may subsequently be reclassified to profit or loss |
(1.3) |
(0.4) |
(1.2) |
|
|
4.0 |
1.2 |
3.5 |
||
|
Items of other comprehensive income that will not be reclassified to profit or loss |
||||
|
Remeasurement of retirement benefits |
7.0 |
(4.9) |
(6.9) |
|
|
Unrealised surplus on revaluation of properties |
- |
- |
80.8 |
|
|
Reversal of past revaluation surplus |
- |
- |
(39.8) |
|
|
Tax on items that will not be reclassified to profit or loss |
(1.8) |
0.4 |
(8.1) |
|
|
5.2 |
(4.5) |
26.0 |
||
|
Other comprehensive income/(expense) for the period |
9.2 |
(3.3) |
29.5 |
|
|
Total comprehensive income/(expense) for the period attributable to equity shareholders |
23.5 |
(39.9) |
11.0 |
|
GROUP CASH FLOW STATEMENT (UNAUDITED)
For the 26 weeks ended 29 March 2025
|
26 weeks to 29 March 2025 |
26 weeks to 30 March 2024 (restated)3 |
52 weeks to 28 September 2024 |
||
|
Note |
£m |
£m |
£m |
|
|
Operating activities |
||||
|
Profit/(loss) for the period |
14.3 |
(36.6) |
(18.5) |
|
|
Taxation |
5.2 |
(6.9) |
(3.1) |
|
|
Net finance costs |
41.8 |
78.7 |
137.3 |
|
|
Depreciation and amortisation |
22.6 |
22.8 |
45.3 |
|
|
Working capital movement |
(3.0) |
6.0 |
8.2 |
|
|
Non-cash movements |
1.3 |
17.1 |
32.7 |
|
|
Decrease in provisions and other non-current liabilities |
(0.1) |
(0.4) |
(0.9) |
|
|
Difference between defined benefit pension contributions paid and amounts charged |
(0.7) |
(3.7) |
(7.5) |
|
|
Dividends from associates |
- |
13.8 |
13.8 |
|
|
Income tax received |
- |
0.1 |
0.1 |
|
|
Net cash inflow from operating activities |
81.4 |
90.9 |
207.4 |
|
|
Investing activities |
||||
|
Interest received |
0.9 |
0.8 |
1.7 |
|
|
Sale of property, plant and equipment and assets held for sale |
4.5 |
9.6 |
46.9 |
|
|
Purchase of property, plant and equipment and intangible assets |
(31.0) |
(21.7) |
(46.2) |
|
|
Disposal of associate |
(2.8) |
- |
205.5 |
|
|
Finance lease capital repayments received |
0.6 |
1.1 |
2.0 |
|
|
Net transfer (to)/from other cash deposits |
11 |
- |
(0.1) |
2.0 |
|
Net cash (outflow)/inflow from investing activities |
(27.8) |
(10.3) |
211.9 |
|
|
Financing activities |
||||
|
Interest paid |
(44.3) |
(50.2) |
(101.9) |
|
|
Arrangement costs of bank facilities |
(0.9) |
- |
(3.6) |
|
|
Swap termination costs |
- |
- |
(2.0) |
|
|
Purchase of own shares |
(0.8) |
- |
- |
|
|
Repayment of securitised debt |
(21.5) |
(20.4) |
(41.5) |
|
|
Repayment of bank borrowings |
(90.0) |
(132.0) |
(419.0) |
|
|
Advance of bank borrowings |
95.0 |
135.0 |
225.0 |
|
|
Net repayment of capital element of lease liabilities |
(4.3) |
(4.3) |
(8.4) |
|
|
Repayment of other borrowings |
- |
(10.0) |
(50.0) |
|
|
Net cash outflow from financing activities |
(66.8) |
(81.9) |
(401.4) |
|
|
Net (decrease)/increase in cash and cash equivalents |
11 |
(13.2) |
(1.3) |
17.9 |
3 Following the publication of the FRC Thematic Review on 'Offsetting in the financial statements' in September 2024, the Group has reassessed the classification of cash flows arising from its bank borrowing facilities as presented in the cash flow statement and has concluded that advance/(repayment) of bank borrowings should be reported on a gross basis, where the maturity periods were greater than three months. Prior period information has been restated on an equivalent basis. The net advance of bank borrowings in the current period was £5.0 million (26 weeks to
30 March 2024: £3.0 million). The presentational adjustment does not have any impact on net increase/(decrease) in cash and cash equivalents, the balance sheet, the Group's profit, or earnings per share in any of the periods presented.
GROUP BALANCE SHEET (UNAUDITED)
As at 29 March 2025
|
29 March 2025 |
30 March 2024 |
28 September 2024 |
|||
|
Note |
£m |
£m |
£m |
||
|
Non-current assets |
|||||
|
Intangible assets |
27.6 |
30.7 |
29.3 |
||
|
Property, plant and equipment |
9 |
2,078.5 |
2,053.4 |
2,069.0 |
|
|
Interests in associates |
- |
220.7 |
- |
||
|
Other non-current assets |
13.9 |
15.2 |
14.4 |
||
|
Deferred tax assets |
- |
7.7 |
- |
||
|
Retirement benefit surplus |
20.5 |
11.4 |
13.1 |
||
|
Derivative financial instruments |
10 |
1.2 |
0.8 |
0.4 |
|
|
2,141.7 |
2,339.9 |
2,126.2 |
|||
|
Current assets |
|||||
|
Inventories |
13.4 |
14.7 |
14.4 |
||
|
Trade and other receivables |
23.7 |
29.6 |
25.9 |
||
|
Current tax assets |
- |
0.4 |
- |
||
|
Other cash deposits |
11 |
1.1 |
3.2 |
1.1 |
|
|
Cash and cash equivalents |
11 |
31.2 |
25.2 |
44.4 |
|
|
69.4 |
73.1 |
85.8 |
|||
|
Assets held for sale |
0.9 |
1.4 |
1.3 |
||
|
70.3 |
74.5 |
87.1 |
|||
|
Current liabilities |
|||||
|
Borrowings4 |
11 |
(60.0) |
(329.3) |
(58.2) |
|
|
Derivative financial instruments |
10 |
- |
(1.4) |
- |
|
|
Trade and other payables |
(170.9) |
(177.9) |
(179.5) |
||
|
Current tax liabilities |
(3.9) |
- |
(2.8) |
||
|
Provisions for other liabilities and charges |
(0.6) |
(1.0) |
(0.6) |
||
|
(235.4) |
(509.6) |
(241.1) |
|||
|
Non-current liabilities |
|||||
|
Borrowings4 |
11 |
(1,224.7) |
(1,235.6) |
(1,244.7) |
|
|
Derivative financial instruments |
10 |
(52.4) |
(57.4) |
(59.4) |
|
|
Other non-current liabilities |
(8.9) |
(7.7) |
(8.3) |
||
|
Provisions for other liabilities and charges |
(2.6) |
(2.6) |
(2.6) |
||
|
Deferred tax liabilities |
(9.6) |
- |
(2.4) |
||
|
(1,298.2) |
(1,303.3) |
(1,317.4) |
|||
|
Net assets |
678.4 |
601.5 |
654.8 |
||
|
Shareholders' equity |
|||||
|
Equity share capital |
48.7 |
48.7 |
48.7 |
||
|
Share premium account |
334.0 |
334.0 |
334.0 |
||
|
Revaluation reserve |
430.9 |
409.7 |
431.6 |
||
|
Capital redemption reserve |
6.8 |
6.8 |
6.8 |
||
|
Hedging reserve |
(36.8) |
(43.4) |
(40.8) |
||
|
Own shares |
(110.0) |
(110.5) |
(110.2) |
||
|
Retained earnings |
4.8 |
(43.8) |
(15.3) |
||
|
Total equity |
678.4 |
601.5 |
654.8 |
4 There was a period of less than 12 months outstanding on the previous bank facilities as the prior period end of 30 March 2024 resulting in a temporary reclassification of the bank borrowings from non-current to current liabilities.
GROUP STATEMENT OF CHANGES IN EQUITY (UNAUDITED)
For the 26 weeks ended 29 March 2025
|
Equity share capital |
Share premium account |
Revaluation reserve |
Capital redemption reserve |
Hedging reserve |
Own shares |
Retained earnings |
Total equity |
||
|
£m |
£m |
£m |
£m |
£m |
£m |
£m |
£m |
||
|
At 29 September 2024 |
48.7 |
334.0 |
431.6 |
6.8 |
(40.8) |
(110.2) |
(15.3) |
654.8 |
|
|
Profit for the period |
- |
- |
- |
- |
- |
- |
14.3 |
14.3 |
|
|
Remeasurement of retirement benefits |
- |
- |
- |
- |
- |
- |
7.0 |
7.0 |
|
|
Tax on remeasurement of retirement benefits |
- |
- |
- |
- |
- |
- |
(1.8) |
(1.8) |
|
|
Gains on cash flow hedges |
- |
- |
- |
- |
1.9 |
- |
- |
1.9 |
|
|
Transfers to the income statement on cash flow hedges |
- |
- |
- |
- |
3.4 |
- |
- |
3.4 |
|
|
Tax on hedging reserve movements |
- |
- |
- |
- |
(1.3) |
- |
- |
(1.3) |
|
|
Total comprehensive income |
- |
- |
- |
- |
4.0 |
- |
19.5 |
23.5 |
|
|
Share-based payments |
- |
- |
- |
- |
- |
- |
0.9 |
0.9 |
|
|
Purchase of own shares |
- |
- |
- |
- |
- |
(0.8) |
- |
(0.8) |
|
|
Sale of own shares |
- |
- |
- |
- |
- |
1.0 |
(1.0) |
- |
|
|
Transfer disposals to retained earnings |
- |
- |
(0.8) |
- |
- |
- |
0.8 |
- |
|
|
Transfer tax to retained earnings |
- |
- |
0.1 |
- |
- |
- |
(0.1) |
- |
|
|
Total transactions with owners |
- |
- |
(0.7) |
- |
- |
0.2 |
0.6 |
0.1 |
|
|
At 29 March 2025 |
48.7 |
334.0 |
430.9 |
6.8 |
(36.8) |
(110.0) |
4.8 |
678.4 |
For the 26 weeks ended 30 March 2024
|
Equity share capital |
Share premium account |
Revaluation reserve |
Capital redemption reserve |
Hedging reserve |
Own shares |
Retained earnings |
Total equity |
||
|
£m |
£m |
£m |
£m |
£m |
£m |
£m |
£m |
||
|
At 1 October 2023 |
48.7 |
334.0 |
412.1 |
6.8 |
(44.4) |
(110.6) |
(6.5) |
640.1 |
|
|
Loss for the period |
- |
- |
- |
- |
- |
- |
(36.6) |
(36.6) |
|
|
Remeasurement of retirement benefits |
- |
- |
- |
- |
- |
- |
(4.9) |
(4.9) |
|
|
Tax on remeasurement of retirement benefits |
- |
- |
- |
- |
- |
- |
0.4 |
0.4 |
|
|
Losses on cash flow hedges |
- |
- |
- |
- |
(2.6) |
- |
- |
(2.6) |
|
|
Transfers to the income statement on cash flow hedges |
- |
- |
- |
- |
4.0 |
- |
- |
4.0 |
|
|
Tax on hedging reserve movements |
- |
- |
- |
- |
(0.4) |
- |
- |
(0.4) |
|
|
Other comprehensive income of associates |
- |
- |
- |
- |
- |
- |
0.2 |
0.2 |
|
|
Total comprehensive income/(expense) |
- |
- |
- |
- |
1.0 |
- |
(40.9) |
(39.9) |
|
|
Share-based payments |
- |
- |
- |
- |
- |
- |
1.3 |
1.3 |
|
|
Sale of own shares |
- |
- |
- |
- |
- |
0.1 |
(0.1) |
- |
|
|
Transfer disposals to retained earnings |
- |
- |
(2.7) |
- |
- |
- |
2.7 |
- |
|
|
Transfer tax to retained earnings |
- |
- |
0.3 |
- |
- |
- |
(0.3) |
- |
|
|
Total transactions with owners |
- |
- |
(2.4) |
- |
- |
0.1 |
3.6 |
1.3 |
|
|
At 30 March 2024 |
48.7 |
334.0 |
409.7 |
6.8 |
(43.4) |
(110.5) |
(43.8) |
601.5 |
NOTES
1 BASIS OF PREPARATION OF INTERIM FINANCIAL INFORMATION
Marston's PLC (the 'Company') is a company domiciled in the UK. The consolidated interim financial information for the 26 weeks ended 29 March 2025 incorporates the financial statements of Marston's PLC and all of its subsidiary undertakings (the 'Group'). The Group is primarily an operator of pubs and bars across the UK.
This interim financial information has been prepared in accordance with UK-adopted IAS 34 'Interim Financial Reporting' in conformity with the requirements of the Companies Act 2006. The same accounting policies, presentation and methods of computation are followed in the interim financial information as applied in the Group's audited financial statements for the 52 weeks ended 28 September 2024 with the exception of the classification of items as non-underlying1 (note 4) and the new standards and interpretations that were only applicable from the beginning of the current financial year. The audited financial statements for the 52 weeks ended 28 September 2024 contain details of the new standards and interpretations now applicable to the Group. The adoption of these standards and interpretations has had no material impact on the interim financial information.
The financial information for the 52 weeks ended 28 September 2024 is extracted from the audited accounts for that period, which have been delivered to the Registrar of Companies. The Auditor's report was unqualified and did not contain a statement under section 498 (2) or (3) of the Companies Act 2006.
The interim financial information does not constitute statutory accounts within the meaning of section 434 of the Companies Act 2006. Accordingly, this report should be read in conjunction with the Annual Report and Accounts for the 52 weeks ended 28 September 2024. The interim financial information for the 26 weeks ended 29 March 2025 and the comparatives to 30 March 2024 are unaudited but have been reviewed by the Group's external Auditor.
The Group does not consider that any standards or interpretations issued by the International Accounting Standards Board, but not yet applicable, will have a significant impact on the financial statements for the 52 weeks ending 27 September 2025.
Going concern
The Group successfully secured the extension of its bank facility, which was due to expire in July 2026. The revised funding comprises a £200.0 million bank facility available until July 2027 (of which £40.0 million was drawn at 29 March 2025) and a £5.0 million to £20.0 million seasonal overdraft facility (of which £nil was drawn at 29 March 2025), with a provisional agreement in place to fix the overdraft facility at £5.0 million going forward. The Group's sources of funding also include its securitised debt.
There are two covenants associated with the Group's securitised debt. The FCF DSCR is a measure of free cash flow to debt service for the group headed by Marston's Pubs Parent Limited and the Net Worth is derived from the net assets of that group of companies.
There are three covenants associated with the amended Group's bank borrowings for the non-securitised group of companies - Debt Cover, Interest Cover and Liquidity. The Debt Cover covenant is a measure of net borrowings to EBITDA, the Interest Cover covenant is a measure of EBITDA to finance charges, and the Liquidity covenant is a measure of headroom on the Group's bank borrowings. The covenant levels remain unchanged except for the Interest Cover covenant which does not step up to 2.0 times until 3 April 2027 (previously 28 March 2026).
The Directors have performed an assessment of going concern over the period of 12 months from the date of signing these interim financial statements, to assess the adequacy of the Group's financial resources. In performing their assessment, the Directors considered the Group's financial position and exposure to principal risks, including the uncertain economic and political outlook, with ongoing geopolitical conflicts and uncertainties and inflationary pressures including employment cost increases.
The Group's base case forecast assumes moderate sales price increases, operational costs (that have not already been secured) rising broadly in line with inflation together with continuing progress on the margin expansion programme. The conclusion of this assessment was that the Directors are satisfied that the Group has adequate liquidity, is not forecast to breach any covenants within its banking group or securitisation in its base case forecast, and has sufficient resources to continue in operational existence for a period of at least 12 months from the date of approval of these interim financial statements.
Due to the uncertain economic and political outlook, risk of further inflationary pressures and the potential impact of this on guest sentiment, the Group has analysed a downside scenario in which a lower level of sales are achieved compared to the base case forecast with additional costs beyond those forecast in the base case and variable costs flexing with the reduced volume, excluding any potential mitigating management actions other than the reduction of discretionary employee reward payments. The result of this downside scenario is that the Group would still have sufficient liquidity to settle liabilities as they fall due and headroom within its revised financial covenants throughout the going concern review period.
The Group has also performed a reverse stress test case, which analyses to what extent sales would need to decrease in order to breach revised financial covenants, with similar cost assumptions to that of the base case forecast and variable costs flexing with the reduced volume. This reverse stress test shows that the Group could withstand a reduction in sales of over 15% from those assessed in the base case throughout the going concern period, excluding any mitigating actions other than the removal of discretionary employee reward payments. The Directors consider this scenario to be remote as, other than when the business was closed during the pandemic, the Group has never experienced sales declines to this level. Additionally, the Group could take management actions within the Directors' control to partially mitigate the financial impact.
Accordingly, the interim financial statements have been prepared on the going concern basis.
2 SEGMENT REPORTING
The Group is considered to have one operating segment under IFRS 8 'Operating Segments' and no disclosures are presented. This is in line with the reporting to the chief operating decision maker and the operational structure of the business. The measure of profit or loss reviewed by the chief operating decision maker is underlying1 profit/loss before tax.
NOTES (CONTINUED)
3 REVENUE
|
29 March 2025 |
30 March 2024 |
|
|
Revenue |
£m |
£m |
|
Outlet sales |
415.1 |
411.0 |
|
Wholesale sales |
9.2 |
13.1 |
|
Revenue from contracts with customers |
424.3 |
424.1 |
|
Rental income |
3.1 |
4.0 |
|
Total revenue from continuing operations |
427.4 |
428.1 |
4 NON-underlying1 items
In order to illustrate the underlying1 performance of the Group, presentation has been made of performance measures excluding those items which it is considered would distort the comparability of the Group's results.
Non-underlying1 items are defined as those items of income and expense which, because of the size, nature and/or expected infrequency of the events giving rise to them, are considered material, and merit separate presentation to enable users of the financial statements to better understand elements of financial performance in the period, and to facilitate comparison with future and prior periods.
In determining whether an item should be presented as non-underlying1, the Group considers items which are significant either because of their size or their nature, and which may be non-recurring. For an item to be considered as non-underlying1, it must initially meet at least one of the following criteria:
· Its size is significant in the context of the element of the results or balance it relates to.
· The nature of the item is outside the normal or core business activities.
· It may span accounting periods but is not expected to recur routinely in future periods.
If an item meets at least one of the criteria, the Group then exercises judgement as to whether the item should be classified as non-underlying1. In exercising this judgement, the Group also takes into account consistency with any disclosures in prior periods.
Non-underlying1 items are one of the matters which involve significant judgment. Items of significant judgement are reviewed by the Board, through the Audit Committee.
|
29 March 2025 |
30 March 2024 (restated)2 |
|
|
£m |
£m |
|
|
Non-underlying1 operating items |
||
|
Reorganisation, restructuring and relocation costs |
2.0 |
0.5 |
|
Duplication costs |
- |
0.4 |
|
2.0 |
0.9 |
|
|
Non-underlying1 non-operating items |
||
|
Interest rate swap movements |
(2.5) |
25.8 |
|
(2.5) |
25.8 |
|
|
Total non-underlying1 items from continuing operations |
(0.5) |
26.7 |
|
Non-underlying1 items from discontinued operations |
||
|
Non-underlying1 loss from associates |
- |
16.0 |
|
- |
16.0 |
|
|
Total non-underlying1 items |
(0.5) |
42.7 |
Reorganisation, restructuring and relocation costs
During the current period the Group commenced a programme to align and resource teams against the Group's strategic priorities and reduce cost for future resilience of the business. The costs identified as non-underlying1 in the current period are one-off headcount related costs which are expected to be short term in nature and non-recurring. The cost of implementing this programme in the current period was £2.0 million (2024: £nil), which is a cash cost and has been recorded within non-underlying1 items in the income statement based on its significance, nature, expected infrequency and consistency with treatment of similar historic programmes.
During the 52-week period ended 30 September 2023, the Group commenced the implementation of an operational programme to simplify the business and drive efficiencies. Costs relating to this programme were also incurred in the 26-week period ended 30 March 2024. The costs identified were one-off headcount related costs and this element of the programme was expected to be short term in nature and non-recurring. The cost of implementing this programme in the prior period was £0.5 million (£2.9 million of costs were incurred in the 26 weeks ended 30 September 2023). Cumulatively, as at 30 March 2024 a cash cost of £3.4 million had been incurred, which was considered material to the Group. The reorganisation, restructuring and relocation costs were recorded within non-underlying1 items in the income statement based on their significance, nature and expected infrequency.
NOTES (CONTINUED)
4 NON-underlying1 items (CONTINUED)
Interest rate swap movements
The Group's interest rate swaps are revalued to fair value at each balance sheet date. These fair value gains/losses have been recognised in the hedging reserve or the income statement as appropriate. Reclassifications within the income statement and/or with the hedging reserve have also been made as required.
|
26 weeks to 29 March 2025 |
26 weeks to 30 March 2024 |
|||||
|
Hedging reserve |
Underlying1 finance costs |
Non-underlying1 finance costs |
Hedging reserve |
Underlying1 finance costs |
Non-underlying1 finance costs |
|
|
£m |
£m |
£m |
£m |
£m |
£m |
|
|
Interest rate swaps designated as part of a hedging relationship: |
||||||
|
Effective portion |
||||||
|
Gain/(loss) on change in fair value |
(1.9) |
- |
- |
2.6 |
- |
- |
|
Reclassification in respect of cash received |
0.1 |
(0.1) |
- |
0.2 |
(0.2) |
- |
|
(1.8) |
(0.1) |
- |
2.8 |
(0.2) |
- |
|
|
Ineffective portion |
||||||
|
(Gain)/loss on change in fair value |
- |
- |
0.6 |
- |
- |
- |
|
Reclassification in respect of cash paid |
- |
0.6 |
(0.6) |
- |
0.6 |
(0.6) |
|
- |
0.6 |
- |
- |
0.6 |
(0.6) |
|
|
Interest rate swaps not designated as part of a hedging relationship: |
||||||
|
(Gain)/loss on change in fair value |
- |
- |
(6.6) |
- |
- |
16.7 |
|
Reclassification in respect of cash paid/received |
- |
(0.6) |
0.6 |
- |
(5.5) |
5.5 |
|
- |
(0.6) |
(6.0) |
- |
(5.5) |
22.2 |
|
|
Reclassification in respect of discontinued cash flow hedges |
(3.5) |
- |
3.5 |
(4.2) |
- |
4.2 |
|
(3.5) |
- |
3.5 |
(4.2) |
- |
4.2 |
|
|
Total interest rate swap movements |
(5.3) |
(0.1) |
(2.5) |
(1.4) |
(5.1) |
25.8 |
Recognised within non-underlying1 items in the income statement is £3.5 million (2024: £4.2 million) of the balance remaining in the hedging reserve in respect of discontinued cash flow hedges which has been reclassified as a charge to the income statement within non-underlying1 items.
In addition, a loss of £0.6 million (2024: £nil) on the ineffective portion of the fair value movement of interest rate swaps designated as part of a hedging relationship and a fair value gain of £6.6 million (2024: loss of £16.7 million) on interest rate swaps not designated as part of a hedging relationship has also been recognised within non-underlying1 items in the income statement.
Finally, cash paid of £0.6 million (2024: £0.6 million) in respect of interest rate swaps designated as part of a hedging relationship and cash received of £0.6 million (2024: £5.5 million) in respect of interest rate swaps not designated as part of a hedging relationship were reclassified from non-underlying1 items to underlying1 finance costs to ensure that underlying1 finance costs reflect the fixed rate paid on the associated debt.
The treatment of the amounts as non-underlying1 has been made based on their significance, nature and consistency with previous classification. Unless specified, the movements have no cash impact.
Duplication costs
On 17 November 2023 Andrew Andrea stepped down from his role as CEO of the Group and, following an external process, Justin Platt was appointed as CEO from 10 January 2024. During the prior period duplicated costs were incurred as a result of the change in CEO which were unusual and one-off for the Group. The duplicated costs, which were cash costs, have been recorded within non-underlying1 items in the income statement based on their nature and expected infrequency.
Non-underlying1 loss from associates
The Group's associate, Carlsberg Marston's Limited, recognised an impairment (of which the Group's share was £12.5 million) during the prior period in relation to some of the ale brands that it held. The ale category had been severely impacted by the COVID-19 pandemic, secular trends, and the cost-of-living crisis, resulting in long-term expectations specifically for the ale brands being updated. The brand impairment of £12.5 million was material in the context of both the Group's total results and the underlying1 loss from associates of £0.6 million. The resulting brand impairment, which had no cash impact, was recorded within non-underlying1 items in the income statement based on its significance, nature and expected infrequency.
Carlsberg Marston's Limited also recognised an onerous contract provision (of which the Group's share was £3.5 million) during the prior period in relation to a specific porterage contract that it held. The significant cost inflation experienced from the cost-of-living crisis, alongside the increases in distribution costs over and above what was reasonably anticipated led to an acute and short-term (rather than business-as-usual) environment of cost inflation which required an onerous provision to be recorded for this specific contract. The onerous contract provision of £3.5 million was material in the context of the underlying1 loss from associates of £0.6 million. The resulting onerous contract provision, which had no cash impact, was recorded within non-underlying1 items in the income statement based on its significance, nature and expected infrequency.
Impact of taxation
The current tax credit relating to the above non-underlying1 items amounts to £0.5 million (2024: £0.1 million). The deferred tax charge relating to the above non-underlying1 items amounts to £0.6 million (2024: credit of £6.6 million).
NOTES (CONTINUED)
5 FINANCE COSTS AND INCOME
|
29 March 2025 |
30 March 2024 |
|
|
£m |
£m |
|
|
Finance costs |
||
|
Bank borrowings |
5.8 |
13.6 |
|
Securitised debt |
17.8 |
16.9 |
|
Lease liabilities |
9.5 |
9.6 |
|
Other lease related borrowings |
11.6 |
11.4 |
|
Other interest payable and similar charges |
0.4 |
2.0 |
|
Total finance costs |
45.1 |
53.5 |
|
Finance income |
||
|
Finance lease and other interest receivable |
(0.8) |
(0.6) |
|
Total finance income |
(0.8) |
(0.6) |
|
Interest rate swap movements |
||
|
Hedge ineffectiveness on cash flow hedges (net of cash paid) |
- |
(0.6) |
|
Change in carrying value of interest rate swaps |
(6.0) |
22.2 |
|
Transfer of hedging reserve balance in respect of discontinued hedges |
3.5 |
4.2 |
|
(2.5) |
25.8 |
|
|
Net finance costs from continuing operations |
41.8 |
78.7 |
6 TAXATION
The underlying1 taxation charge for the 26 weeks ended 29 March 2025 has been calculated by applying an estimate of the underlying1 effective tax rate for the 52 weeks ending 27 September 2025 of 26.8% (26 weeks ended 30 March 2024: 100.0%).
|
29 March 2025 |
30 March 2024 |
|
|
Continuing operations |
£m |
£m |
|
Current tax |
1.1 |
(0.1) |
|
Deferred tax |
4.1 |
(6.8) |
|
5.2 |
(6.9) |
The taxation charge includes a current tax credit of £0.5 million (2024: £0.1 million) and a deferred tax charge of £0.6 million (2024: credit of £6.6 million) relating to the tax on non-underlying1 items.
The Group set out in Note 7 of its 2024 Annual Report and Accounts that UK legislation adopting the Pillar Two rules will apply to the Group for the 52 weeks ended 27 September 2025 onwards. Based on the analysis derived from data in respect of current and prior periods, the Group's potential exposure to Pillar Two taxes is not expected to be material.
The Group has applied the temporary exception under IAS 12 'Income Taxes' in relation to the accounting for deferred taxes arising from the implementation of the Pillar Two rules.
NOTES (CONTINUED)
7 DISCONTINUED OPERATIONS
On 8 July 2024, the Group announced the sale of its remaining non-core brewing assets, with a binding agreement to sell the whole of its 40% interest in Carlsberg Marston's Limited to a subsidiary of Carlsberg A/S for £206.0 million in cash. The transaction subsequently completed on 31 July 2024.
The Directors considered that Carlsberg Marston's Limited constituted a separate major line of business that had been disposed of and as a result met the criteria to be classified as a discontinued operation. The interest in Carlsberg Marston's Limited was not previously classified as held for sale or within discontinued operations. As such the income statement for the 26 weeks ended 30 March 2024 has been restated to show discontinued operations separately from continuing operations.
Results of discontinued operations
|
26 weeks to 29 March 2025 |
26 weeks to 30 March 2024 |
52 weeks to 28 September 2024 |
|||||
|
Underlying1 £m |
Non- underlying1 £m |
Total £m |
Underlying1 £m |
Non- underlying1 £m |
Total £m |
Total £m |
|
|
Revenue |
- |
- |
- |
- |
- |
- |
- |
|
Net operating expenses |
- |
- |
- |
- |
- |
- |
- |
|
Loss from associates |
- |
- |
- |
(0.6) |
(16.0) |
(16.6) |
(16.1) |
|
Operating loss |
- |
- |
- |
(0.6) |
(16.0) |
(16.6) |
(16.1) |
|
Net finance costs |
- |
- |
- |
- |
- |
- |
- |
|
Loss before taxation |
- |
- |
- |
(0.6) |
(16.0) |
(16.6) |
(16.1) |
|
Taxation |
- |
- |
- |
- |
- |
- |
- |
|
Loss for the period attributable to equity shareholders |
- |
- |
- |
(0.6) |
(16.0) |
(16.6) |
(16.1) |
|
Impairment of investment in associates |
- |
- |
- |
- |
- |
- |
(8.0) |
|
Loss on disposal of associates |
- |
- |
- |
- |
- |
- |
(11.9) |
|
Loss from discontinued operations |
- |
- |
- |
(0.6) |
(16.0) |
(16.6) |
(36.0) |
Non-underlying1 operating items in the prior period relate to an impairment in relation to some of the ale brands and an onerous contract provision in relation to a specific porterage contract held by Carlsberg Marston's Limited.
Cash flows from discontinued operations
|
26 weeks to 29 March 2025 |
26 weeks to 30 March 2024 |
52 weeks to 28 September 2024 |
||
|
£m |
£m |
£m |
||
|
Net cash inflow from operating activities |
- |
13.8 |
13.8 |
|
|
Net cash (outflow)/inflow from investing activities |
(2.8) |
- |
205.5 |
|
|
Net cash outflow from financing activities |
- |
- |
- |
|
|
Net (decrease)/increase in cash and cash equivalents |
(2.8) |
13.8 |
219.3 |
During the 52 weeks to 28 September 2024, a loss on disposal of £11.9 million arose on the disposal of Carlsberg Marston's Limited, being the difference between the net disposal proceeds and the carrying amount of the investment in the associate of £214.5 million.
Details of related party transactions with Carlsberg Marston's Limited from 1 October 2023 to 31 July 2024 are as follows:
|
Transaction amount |
Balance outstanding |
|||
|
29 March 2025 |
30 March 2024 |
29 March 2025 |
28 September 2024 |
|
|
£m |
£m |
£m |
£m |
|
|
Purchase of goods |
- |
(85.1) |
- |
- |
|
Dividends from associate |
- |
13.8 |
- |
- |
NOTES (CONTINUED)
8 EARNINGS PER ORDINARY SHARE
Basic earnings/(loss) per share is calculated by dividing the profit/(loss) attributable to equity shareholders by the weighted average number of ordinary shares in issue during the period, excluding treasury shares and those held on trust for employee share schemes. Underlying1 earnings/(loss) per share figures are presented to exclude the effect of non-underlying1 items.
For diluted earnings per share, the weighted average number of ordinary shares in issue is adjusted to assume conversion of all dilutive potential ordinary shares. These represent share options granted to employees where the exercise price is less than the weighted average market price of the Company's shares during the period.
In the prior period in accordance with IAS 33 'Earnings per Share' the potential ordinary shares were not dilutive as their inclusion would reduce the loss per share for continuing operations.
|
29 March 2025 |
30 March 2024 (restated)2 |
|||
|
Earnings |
Per share amount |
Earnings |
Per share amount |
|
|
£m |
p |
£m |
p |
|
|
Basic earnings/(loss) per share |
||||
|
Total |
14.3 |
2.3 |
(36.6) |
(5.8) |
|
Continuing |
14.3 |
2.3 |
(20.0) |
(3.2) |
|
Discontinued |
- |
- |
(16.6) |
(2.6) |
|
Diluted earnings/(loss) per share |
||||
|
Total |
14.3 |
2.1 |
(36.6) |
(5.8) |
|
Continuing |
14.3 |
2.1 |
(20.0) |
(3.2) |
|
Discontinued |
- |
- |
(16.6) |
(2.6) |
|
Underlying1 earnings/(loss) per share figures |
||||
|
Basic underlying1 earnings/(loss) per share |
||||
|
Total |
13.9 |
2.2 |
(0.6) |
(0.1) |
|
Continuing |
13.9 |
2.2 |
- |
- |
|
Discontinued |
- |
- |
(0.6) |
(0.1) |
|
Diluted underlying1 earnings/(loss) per share |
||||
|
Total |
13.9 |
2.1 |
(0.6) |
(0.1) |
|
Continuing |
13.9 |
2.1 |
- |
- |
|
Discontinued |
- |
- |
(0.6) |
(0.1) |
|
29 March 2025 |
30 March 2024 |
|
|
m |
m |
|
|
Basic weighted average number of shares |
633.4 |
633.5 |
|
Dilutive potential ordinary shares |
31.8 |
- |
|
Diluted weighted average number of shares |
665.2 |
633.5 |
9 PROPERTY, PLANT AND EQUIPMENT
|
£m |
|
|
Net book amount at 29 September 2024 |
2,069.0 |
|
Additions |
32.3 |
|
Net transfers to assets held for sale and disposals |
(2.7) |
|
Depreciation and other movements |
(20.1) |
|
Net book amount at 29 March 2025 |
2,078.5 |
|
£m |
|
|
Net book amount at 1 October 2023 |
2,064.8 |
|
Additions |
23.5 |
|
Net transfers to assets held for sale and disposals |
(14.8) |
|
Depreciation and other movements |
(20.1) |
|
Net book amount at 30 March 2024 |
2,053.4 |
Capital expenditure authorised and committed at the period end but not provided for in this interim financial information was £1.3 million (at 28
September 2024: £1.0 million).
NOTES (CONTINUED)
9 PROPERTY, PLANT AND EQUIPMENT (CONTINUED)
The Group's effective freehold land and buildings are revalued by external independent qualified valuers on an annual basis using open market values so that the carrying value of an asset does not differ significantly from its fair value at the balance sheet date. The last external valuation of the Group's effective freehold land and buildings was performed at 30 June 2024. During the current period the Group has performed an assessment for significant changes that could impact the value of its effective freehold land and buildings at the balance sheet date. The Group's recent trading performance supports the forecasts which determined Fair Maintainable Trade at 30 June 2024. Disposal proceeds during the 26 weeks to 29 March 2025 were in line with book value and property multiples adopted in the prior period revaluation are supported by the current property market. As such, no internal valuation has been performed as at the balance sheet date.
A reasonably possible increase of 10% in the multiple would increase the fair value by £174.2 million and a reasonably possible decrease of 10% in the multiple would decrease the fair value by £174.2 million. A reasonably possible increase of 4% in the fair maintainable trade would increase the fair value by £69.7 million and a reasonably possible decrease of 4% in the fair maintainable trade would decrease the fair value by £69.7 million. These are based on the top ends of observable multiples achieved in the market and historic movements in the average fair maintainable trade.
Leasehold properties, comprising leasehold land and buildings and associated fixtures, fittings, tools and equipment and computer software, are held under the cost model. During the current period the Group has performed an assessment for indicators of impairment which concluded that the Group is not required to perform a further review of impairment. As set out on page 112 of the 2024 Annual Report and Accounts, the 2024 impairment charge/reversal exhibited minimal sensitivity to changes in key assumptions.
10 FINANCIAL INSTRUMENTS
The only financial instruments which the Group holds at fair value are derivative financial instruments, which are classified as at fair value through profit or loss or derivatives used for hedging.
Fair value hierarchy
IFRS 13 'Fair Value Measurement' requires fair value measurements to be recognised using a fair value hierarchy that reflects the significance of the inputs used in the measurements, according to the following levels:
Level 1 - unadjusted quoted prices in active markets for identical assets or liabilities.
Level 2 - inputs other than quoted prices included within Level 1 that are observable for the asset or liability, either directly or indirectly.
Level 3 - inputs for the asset or liability that are not based on observable market data.
The tables below show the levels in the fair value hierarchy within which fair value measurements have been categorised:
|
29 March 2025 |
28 September 2024 |
|||||||
|
Level 1 |
Level 2 |
Level 3 |
Total |
Level 1 |
Level 2 |
Level 3 |
Total |
|
|
Assets as per the balance sheet |
£m |
£m |
£m |
£m |
£m |
£m |
£m |
£m |
|
Derivative financial instruments |
- |
1.2 |
- |
1.2 |
- |
0.4 |
- |
0.4 |
|
29 March 2025 |
28 September 2024 |
|||||||
|
Level 1 |
Level 2 |
Level 3 |
Total |
Level 1 |
Level 2 |
Level 3 |
Total |
|
|
Liabilities as per the balance sheet |
£m |
£m |
£m |
£m |
£m |
£m |
£m |
£m |
|
Derivative financial instruments |
- |
52.4 |
- |
52.4 |
- |
59.4 |
- |
59.4 |
There were no transfers between Levels 1, 2 and 3 fair value measurements during the current or prior period. The Level 2 fair values of derivative financial instruments have been obtained using a market approach and reflect the estimated amount the Group would expect to pay or receive on termination of the instruments, adjusted for the Group's own credit risk. The Group utilises valuations from counterparties who use a variety of assumptions based on market conditions existing at each balance sheet date. The fair values are highly sensitive to the inputs to the valuations, such as discount rates, analysis of credit risk and yield curves.
The fair values of all the Group's other financial instruments are equal to their book values, with the exception of borrowings. The carrying amount less impairment provision of finance lease receivables, trade receivables and other receivables, and the carrying amount of other cash deposits, cash and cash equivalents, trade payables and other payables, are assumed to approximate their fair values. The carrying amount (excluding unamortised issue costs) and the fair value of the Group's borrowings are as follows:
|
Carrying amount |
Fair value |
|||
|
29 March 2025 |
28 September 2024 |
29 March 2025 |
28 September 2024 |
|
|
£m |
£m |
£m |
£m |
|
|
Bank borrowings |
40.0 |
35.0 |
40.0 |
35.0 |
|
Securitised debt |
540.8 |
562.3 |
499.9 |
502.9 |
|
Lease liabilities |
371.3 |
373.7 |
371.3 |
373.7 |
|
Other lease related borrowings |
361.7 |
361.7 |
361.7 |
361.7 |
|
Preference shares |
0.1 |
0.1 |
0.1 |
0.1 |
|
1,313.9 |
1,332.8 |
1,273.0 |
1,273.4 |
|
NOTES (CONTINUED)
11 NET DEBT
|
29 March 2025 |
28 September 2024 |
|||||
|
Analysis of net debt |
£m |
£m |
||||
|
Cash and cash equivalents |
||||||
|
Cash at bank and in hand |
31.2 |
44.4 |
||||
|
31.2 |
44.4 |
|||||
|
Financial assets |
||||||
|
Other cash deposits |
1.1 |
1.1 |
||||
|
1.1 |
1.1 |
|||||
|
Debt due within one year |
||||||
|
Bank borrowings |
1.8 |
2.5 |
||||
|
Securitised debt |
(44.7) |
(43.5) |
||||
|
Lease liabilities |
(17.6) |
(17.7) |
||||
|
Other lease related borrowings |
0.5 |
0.5 |
||||
|
(60.0) |
(58.2) |
|||||
|
Debt due after one year |
||||||
|
Bank borrowings |
(37.6) |
(33.0) |
||||
|
Securitised debt |
(494.1) |
(516.7) |
||||
|
Lease liabilities |
(353.7) |
(356.0) |
||||
|
Other lease related borrowings |
(339.2) |
(338.9) |
||||
|
Preference shares |
(0.1) |
(0.1) |
||||
|
(1,224.7) |
(1,244.7) |
|||||
|
Net debt |
(1,252.4) |
(1,257.4) |
|
29 March 2025 |
28 September 2024 |
|
|
£m |
£m |
|
|
Net debt excluding lease liabilities |
(881.1) |
(883.7) |
|
Lease liabilities |
(371.3) |
(373.7) |
|
Net debt |
(1,252.4) |
(1,257.4) |
Other cash deposits and cash and cash equivalents include comprises deposits securing letters of credit for reinsurance contracts. Included within cash and cash equivalents is an amount of £5.5 million (28 September 2024: £5.5 million), which relates to collateral held in the form of cash deposits. These amounts are considered to be restricted cash. In addition, any cash held in connection with the securitised business is governed by certain restrictions under the covenants associated with the securitisation.
|
29 March 2025 |
30 March 2024 |
|
|
Reconciliation of net cash flow to movement in net debt |
£m |
£m |
|
Decrease in cash and cash equivalents in the period |
(13.2) |
(1.3) |
|
Increase in other cash deposits |
- |
0.1 |
|
Cash outflow from movement in debt |
20.8 |
31.7 |
|
Net cash inflow |
7.6 |
30.5 |
|
Non-cash movements and deferred issue costs |
(2.6) |
(1.2) |
|
Movement in net debt in the period |
5.0 |
29.3 |
|
Net debt at beginning of the period |
(1,257.4) |
(1,565.8) |
|
Net debt at end of the period |
(1,252.4) |
(1,536.5) |
12 SIGNIFICANT EVENTS AND TRANSACTIONS
Detail regarding significant events and transactions that have taken place since 28 September 2024 is provided outside of the interim financial
statements in the Performance and Financial Review.
13 ORDINARY DIVIDENDS ON EQUITY SHARES
An interim dividend has not been proposed for the current period. No interim dividend was paid for the prior period.
NOTES (CONTINUED)
14 PRINCIPAL RISKS AND UNCERTAINTIES
The Group set out on pages 37 to 41 of its 2024 Annual Report and Accounts the principal risks and uncertainties that could impact its performance. These risks and uncertainties were as follows:
Uncertain Economic and Political Outlook
There is a risk that an uncertain economic or political outlook could adversely impact market demand and consumer confidence. Ongoing geopolitical
conflicts in Ukraine and the Middle East and the recent US election may also result in structural inflation which in turn may impact our cost base, including utilities, construction materials and food.
Wider legislative and policy changes can also impact our business, including increased taxes leading to a decrease in consumer spending and uncertainty in terms of both the cost of living and the wider economic outlook.
Strategy Delivery and Business Transformation
The Company strategy was developed following a forensic review of consumer trends and sector dynamics. Nevertheless, as with any business change, there is a risk of being unable to deliver major transformational projects on time or realising the full benefit due to the volume or pace of change. This particularly refers to the deployment of capital projects to deliver differentiated formats and upgrading technology to deliver digital transformation. Organisational capability and dependencies may also pose a risk which is linked to the speed of change and potential operational impact of business transformation. The Board recognises that the development of our leaders is critical to ensuring the right culture and behaviours are embedded and to ensure we have and maintain the right skills and capability to meet our strategic plan.
Strategy-related risks are elevated for the next 12 months due to the number of dependencies and number of changes in a relatively short timeframe.
Information Technology and Data Security
The effective operation of many aspects of our business depends upon the Company's IT network. All businesses are subject to continuously evolving
methods of cyber threat, including targeting vulnerable businesses with data theft, denial of service attacks, fraud and malware. The risks posed by
cyber-attacks are wide ranging and can include loss of revenue, reputation and consumer trust, regulatory fines and an adverse impact on the Company's share price.
Environment, Social and Governance
As a business we can be impacted by environmental issues such as climate change, water shortages, inability to meet carbon targets and social issues,
such as lack of diversity, and social trends such as changing lifestyle choices.
Our plans to achieve Net Zero are also fundamentally dependent upon the Government's ability to provide renewable energy at an affordable price.
Transition remains a challenge for our business, and those within our supply chain, if the cost to transition remains high and availability for renewable
energy and green technology are not improved. Uncertainty as to how these collective risks will evolve and any impact on delivering on our commitments and embedding them within our business model, could impact our reputation and our financial performance.
There is a risk that within our supply chain a third-party product is supplied which is unethical which in turn could impact our reputation and sustainability credentials.
Talent Attraction, Retention and Related Employment Costs
Whilst some of the structural challenges facing the labour market in hospitality have largely stabilised, organisational changes can lead to uncertainty and specific skills and experience are required to deliver our strategic priorities.
The National Minimum Wage and National Insurance increases recently announced by the Government will result in higher operating costs for both
the Company and our Pub Partners, which in turn has an impact on our profit and margin.
New legislation such as the Employment Rights Bill 2024 includes additional provisions which are likely to further increase our operating costs, and
significant regulatory change presents risks associated with adverse publicity and loss of revenue in the event of compliance failures.
Health and Safety, Food Safety
The safety of our guests and employees is our number one priority, and a major health and safety or food safety breach could lead to serious injury or loss of life. This could be due to a failure in safety standards, supply chain issues or poor hygiene standards, and could lead to adverse publicity, loss of revenue, reputational damage and criminal sanctions and fines.
Liquidity And Compliance with Financial Covenants
Whilst inflationary pressures have eased, interest rates remain high. Following the disposal of Carlsberg Marston's Limited in July 2024, the Group's net debt was reduced significantly, resulting in a relaxation of some of the financial covenants and, consequently, the risk of breach has also reduced.
Nevertheless, there remains a risk that financial covenants are breached due to circumstances beyond our control, for example, a change in the economic climate leading to reduced consumer confidence and Group liquidity. As documented in the Going Concern assessment the Board has
assessed a severe but plausible downside scenario with headroom against all covenants and there is sufficient liquidity, therefore the overall risk is decreasing.
Business Continuity
Business continuity can be threatened by unforeseen events impacting upon our ability to trade or compete effectively and reducing our operational
effectiveness. The risk could result from disruption to our IT systems or supply chain.
There is a possibility that another form of pandemic could occur in the future. The severity of such a pandemic upon human health and the duration and
impact of measures taken to reduce the circulation of infection are difficult to predict. Whilst the risk of pandemic in the short term is deemed low,
we recognise that this risk has the singular capability to shut all pubs with little warning.
NOTES (CONTINUED)
15 ALTERNATIVE PERFORMANCE MEASURES (APMs)
In addition to statutory financial measures, these interim results include financial measures that are not defined or recognised under IFRS, all of which the Group considers to be alternative performance measures (APMs). APMs should not be regarded as a complete picture of the Group's financial performance, which the Group presents within its total results.
The APMs are used by the Board and management to analyse operational and financial performance and track the Group's progress against long-term strategic plans. The APMs provide additional information to investors and other external shareholders to enhance their understanding of the Group's results and facilitate comparison with industry peers.
Definitions of APMs, along with the reconciliation of the APMs used to the Group's strategy, remain unchanged from the 2024 Annual Report and Accounts, commencing on page 141 of that report.
The Group's financial results and cash flows have historically been subject to seasonal trends between the first and second half of the financial year. Traditionally, the second half of the financial year sees higher revenue and profitability, as a result of better weather conditions. There is no assurance that this trend will continue in the future.
Condensed cash flow statement with APM subtotals
|
Interim financial information reference |
29 March 2025 £m |
30 March 2024 £m |
28 September 2024 |
|
|
Underlying1 EBITDA |
85.9 |
74.9 |
193.0 |
|
|
Non-underlying1 EBITDA |
(2.0) |
(16.9) |
(32.0) |
|
|
Total EBITDA |
83.9 |
58.0 |
161.0 |
|
|
Non-cash movements |
Cash flow statement |
1.3 |
17.1 |
32.7 |
|
Decrease in provisions and other non-current liabilities |
Cash flow statement |
(0.1) |
(0.4) |
(0.9) |
|
Cash adjusted total EBITDA |
85.1 |
74.7 |
192.8 |
|
|
Income tax received |
Cash flow statement |
- |
0.1 |
0.1 |
|
Working capital movement |
Cash flow statement |
(3.0) |
6.0 |
8.2 |
|
Difference between defined benefit pension contributions paid and amounts charged |
Cash flow statement |
(0.7) |
(3.7) |
(7.5) |
|
Net cash inflow from operating activities (excluding dividends from associates) |
81.4 |
77.1 |
193.6 |
|
|
Net interest paid and finance lease capital repayments received |
(42.8) |
(48.3) |
(98.2) |
|
|
Purchase of property, plant and equipment and intangible assets |
Cash flow statement |
(31.0) |
(21.7) |
(46.2) |
|
Arrangement costs of bank facilities and swap termination costs |
(0.9) |
- |
(5.6) |
|
|
Purchase of own shares |
Cash flow statement |
(0.8) |
- |
- |
|
Recurring free cash flow |
5.9 |
7.1 |
43.6 |
|
|
Dividends from associates |
Cash flow statement |
- |
13.8 |
13.8 |
|
Sale of property, plant and equipment and assets held for sale |
Cash flow statement |
4.5 |
9.6 |
46.9 |
|
Disposal of associate |
Cash flow statement |
(2.8) |
- |
205.5 |
|
Net cash flow |
7.6 |
30.5 |
309.8 |
|
|
Cash outflow from movement in debt |
Note 11 |
(20.8) |
(31.7) |
(293.9) |
|
(Increase)/decrease in other cash deposits |
Note 11 |
- |
(0.1) |
2.0 |
|
Net (decrease)/increase in cash and cash equivalents |
Cash flow statement |
(13.2) |
(1.3) |
17.9 |
Loan to value
|
Interim financial information reference |
29 March 2025 £m |
28 September 2024 |
||
|
Securitised pubs and lodges |
1,152.7 |
1,145.9 |
||
|
Non-securitised effective freehold pubs and lodges |
622.5 |
618.5 |
||
|
1,775.2 |
1,764.4 |
|||
|
Non-securitised leasehold pubs and lodges |
281.8 |
282.8 |
||
|
Other non-core properties and administration assets |
21.5 |
21.8 |
||
|
Property, plant and equipment total |
Note 9 |
2,078.5 |
2,069.0 |
|
|
Securitised debt due within one year |
Note 11 |
44.7 |
43.5 |
|
|
Securitised debt due after one year |
Note 11 |
494.1 |
516.7 |
|
|
538.8 |
560.2 |
|||
|
Loan to value of securitised debt |
47% |
49% |
||
|
Net debt excluding lease liabilities at end of the period |
Note 11 |
881.1 |
883.7 |
|
|
Loan to value of net debt excluding lease liabilities |
50% |
50% |
NOTES (CONTINUED)
15 ALTERNATIVE PERFORMANCE MEASURES (APMs) (CONTINUED)
Like-for-like (LFL) sales
|
Interim financial information reference |
26 weeks to 29 March 2025 |
26 weeks to 30 March 2024 |
LFL |
|
|
£m |
£m |
% |
||
|
LFL retail sales |
394.3 |
389.2 |
1.3 |
|
|
Non-LFL retail sales |
5.2 |
7.4 |
||
|
Retail sales |
399.5 |
396.6 |
||
|
Non-EPOS outlet revenue |
15.6 |
14.4 |
||
|
Outlet sales |
Note 3 |
415.1 |
411.0 |
|
5 weeks to 3 May 2025 |
5 weeks to 4 May 2024 |
LFL |
||
|
£m |
£m |
% |
||
|
LFL retail sales |
88.3 |
79.9 |
10.5 |
|
|
Non-LFL retail sales |
1.3 |
0.4 |
||
|
Retail sales |
89.6 |
80.4 |
Net asset value (NAV) per share
|
Interim financial information reference |
29 March 2025 |
30 March 2024 |
28 September 2024 |
|
|
Net assets (£m) |
Balance sheet |
678.4 |
601.5 |
654.8 |
|
Number of shares outstanding (m) |
632.8 |
633.5 |
633.8 |
|
|
NAV per share (£) |
1.07 |
0.95 |
1.03 |
Underlying1 operating margin and underlying1 EBITDA margin (from continuing operations)
|
26 weeks to 29 March 2025 |
26 weeks to 30 March 2024 |
52 weeks to 28 September 2024 |
|||||||
|
Non- |
Non- |
Non- |
|||||||
|
Underlying1 |
Underlying1 |
Total |
Underlying1 |
Underlying1 |
Total |
Underlying1 |
Underlying1 |
Total |
|
|
£m |
£m |
£m |
£m |
£m |
£m |
£m |
£m |
£m |
|
|
Continuing operations |
|||||||||
|
Operating profit |
63.3 |
(2.0) |
61.3 |
52.7 |
(0.9) |
51.8 |
147.2 |
4.5 |
151.7 |
|
Depreciation and amortisation |
22.6 |
- |
22.6 |
22.8 |
- |
22.8 |
45.3 |
- |
45.3 |
|
EBITDA |
85.9 |
(2.0) |
83.9 |
75.5 |
(0.9) |
74.6 |
192.5 |
4.5 |
197.0 |
|
Discontinued operations |
|||||||||
|
Loss for the period from discontinued operations |
- |
- |
- |
(0.6) |
(16.0) |
(16.6) |
0.5 |
(36.5) |
(36.0) |
|
- |
- |
- |
(0.6) |
(16.0) |
(16.6) |
0.5 |
(36.5) |
(36.0) |
|
|
EBITDA for continuing and discontinued operations |
85.9 |
(2.0) |
83.9 |
74.9 |
(16.9) |
58.0 |
193.0 |
(32.0) |
161.0 |
|
Interim financial information reference |
52 weeks to 29 March 2025 |
52 weeks to 28 September 2024 |
||
|
£m |
£m |
|||
|
Underlying EBITDA under IFRS 16 |
202.9 |
192.5 |
||
|
Net rental charge |
(21.9) |
(21.7) |
||
|
Underlying EBITDA pre IFRS 16 |
181.0 |
170.8 |
||
|
Net debt including lease liabilities at end of the period |
Note 11 |
1,252.4 |
1,257.4 |
|
|
Net debt to EBITDA leverage including lease liabilities |
6.2 |
6.5 |
||
|
Net debt excluding lease liabilities at end of the period |
Note 11 |
881.1 |
883.7 |
|
|
Net debt to EBITDA leverage excluding lease liabilities |
4.9 |
5.2 |
NOTES (CONTINUED)
15 ALTERNATIVE PERFORMANCE MEASURES (APMs) (CONTINUED)
Underlying1 operating margin and underlying1 EBITDA margin (from continuing operations) (continued)
|
Interim financial information reference |
26 weeks to 29 March 2025 |
26 weeks to 30 March 2024 (restated)2 |
52 weeks to 28 September 2024 |
|
|
£m |
£m |
£m |
||
|
Operating profit |
Income statement |
61.3 |
51.8 |
151.7 |
|
Non-underlying1 operating items |
Note 4 |
2.0 |
0.9 |
(4.5) |
|
Underlying1 operating profit |
63.3 |
52.7 |
147.2 |
|
|
Depreciation and amortisation |
Cash flow statement |
22.6 |
22.8 |
45.3 |
|
Underlying1 EBITDA |
85.9 |
75.5 |
192.5 |
|
|
Revenue |
Income statement |
427.4 |
428.1 |
898.6 |
|
Underlying1 operating margin |
14.8% |
12.3% |
16.4% |
|
|
Underlying1 EBITDA margin |
20.1% |
17.6% |
21.4% |
16 INTERIM RESULTS
The interim results were approved by the Board on 13 May 2025.
17 COPIES
Copies of these results are available on the Marston's PLC website (www.marstonspubs.co.uk) and on request from the General Counsel & Company Secretary, Marston's PLC, St Johns House, St Johns Square, Wolverhampton, WV2 4BH.
INDEPENDENT REVIEW REPORT TO MARSTON'S PLC
Conclusion
We have been engaged by Marston's PLC ('the Company') to review the condensed set of financial statements of the Company and its subsidiaries (the 'Group') in the half-yearly financial report for the period ended 29 March 2025 which comprises the Group Income Statement, Group Statement of Comprehensive Income, Group Cash Flow Statement, Group Balance Sheet, Group Statement of Changes in Equity and related notes. We have read the other information contained in the half-yearly financial report and considered whether it contains any apparent material misstatements of fact or material inconsistencies with the information in the condensed set of financial statements.
Based on our review, nothing has come to our attention that causes us to believe that the condensed set of financial statements in the half-yearly financial report for the period ended 29 March 2025 is not prepared, in all material respects, in accordance with International Accounting Standard 34, "Interim Financial Reporting" as contained in UK-adopted International Accounting Standards, and the Disclosure Guidance and Transparency Rules of the United Kingdom's Financial Conduct Authority.
Basis for Conclusion
We conducted our review in accordance with International Standard on Review Engagements (UK) 2410, "Review of Interim Financial Information Performed by the Independent Auditor of the Entity" ('ISRE (UK) 2410') issued for use in the United Kingdom. A review of interim financial information consists of making enquiries, primarily of persons responsible for financial and accounting matters, and applying analytical and other review procedures. A review is substantially less in scope than an audit conducted in accordance with International Standards on Auditing (UK) and consequently does not enable us to obtain assurance that we would become aware of all significant matters that might be identified in an audit. Accordingly, we do not express an audit opinion.
As disclosed in note 1, the annual financial statements of the Group are prepared in accordance with UK-adopted International Accounting Standards. The condensed set of financial statements included in this half-yearly financial report has been prepared in accordance with International Accounting Standard 34, "Interim Financial Reporting" as contained in UK-adopted International Accounting Standards.
Conclusions Relating to Going Concern
Based on our review procedures, which are less extensive than those performed in an audit as described in the Basis for Conclusion section of this report, nothing has come to our attention to suggest that management have inappropriately adopted the going concern basis of accounting or that management have identified material uncertainties relating to going concern that are not appropriately disclosed.
This conclusion is based on the review procedures performed in accordance with ISRE (UK) 2410, however future events or conditions may cause the Group and the Company to cease to continue as a going concern.
Responsibilities of Directors
The half-yearly financial report, is the responsibility of, and has been approved by, the directors. The directors are responsible for preparing the half-yearly financial report in accordance with International Accounting Standard 34, "Interim Financial Reporting" as contained in UK-adopted International Accounting Standards and the Disclosure Guidance and Transparency Rules of the United Kingdom's Financial Conduct Authority.
In preparing the half-yearly financial report, the directors are responsible for assessing the Group's and the Company's ability to continue as a going concern, disclosing, as applicable, matters related to going concern and using the going concern basis of accounting unless the directors either intend to liquidate the Group or the Company or to cease operations, or have no realistic alternative but to do so.
Auditor's Responsibilities for the Review of the Financial Information
In reviewing the half-yearly financial report, we are responsible for expressing to the Company a conclusion on the condensed set of financial statements in the half-yearly financial report. Our conclusion, including our Conclusions Relating to Going Concern, are based on procedures that are less extensive than audit procedures, as described in the Basis for Conclusion paragraph of this report.
Use of our report
This report is made solely to the Company in accordance with International Standard on Review Engagements (UK) 2410 "Review of Interim Financial Information performed by the Independent Auditor of the Entity". Our review work has been undertaken so that we might state to the Company those matters we are required to state to them in an independent review report and for no other purpose. To the fullest extent permitted by law, we do not accept or assume responsibility to anyone other than the Company, for our review work, for this report, or for the conclusions we have formed.
RSM UK Audit LLP
Chartered Accountants
103 Colmore Row
Birmingham
B3 3AG
12 May 2025