

HIGHLIGHTS
The Exploration Target, which was defined in 2024, has been significantly increased following detailed review and assessment.
The Belltopper Gold Project is located within the gold prolific Bendigo Tectonic Zone in Victoria and approximately 60 km SSW of the high-grade world-class Fosterville Gold Mine.
The updated 2026 Exploration Target brings in the Western Domain Fault as a new reef and encapsulates strike and depth extensions on four of the seven priority reefs included in the 2024 Exploration Target.
The evolving geology model continues to provide additional high priority, drill ready targets focussing on both near-surface reef systems and deeper conceptual targets.
Additional lightly tested historic gold reefs at Belltopper that currently sit outside of the updated 2026 Exploration Target highlight the upgrade potential of the project.
Preliminary planning has commenced for potential drilling in H2 2026, aimed to provide further confidence in the Exploration Target.
An updated Exploration Target is now presented for the Belltopper Gold Project area based on an in-depth review of the local geology, historical data, and previous drilling relevant to eight highly prospective reefs within the project area. The updated 2026 Exploration Target includes the addition of a new reef and increased strike and/or dip extents for four of the seven reefs documented in the 2024 Exploration Target (Table 1).
Table 1. Updated 2026 Exploration Target for the Belltopper Gold Project, Victoria.
Figures may not compute due to rounding.
Metric | Low case | High case |
Tonnage range | 2.1 Mt | 3.1 Mt |
Grade range | 6.7 g/t Au | 8.9 g/t Au |
Clarification statement: An Exploration Target as defined in the JORC Code (2012) is a statement or estimate of the exploration potential of a mineral deposit in a defined geological setting where the statement or estimate, quoted as a range of tonnes and a range of grade (or quality), relates to mineralisation for which there has been insufficient exploration to estimate a Mineral Resource. Accordingly, these figures are not Mineral Resource or Ore Reserve estimates as defined in the JORC Code (2012). The potential quantities and grades referred to above are conceptual in nature and there has been insufficient exploration to estimate a Mineral Resource, and it is uncertain if further exploration will result in the estimation of a Mineral Resource. These figures are based on the interpreted continuity of mineralisation and projection into unexplored ground often around historical workings. The Exploration Target has been reported in accordance with the JORC Code (2012).
PERTH, Australia, Feb. 11, 2026 (GLOBE NEWSWIRE) -- Novo Resources Corp. (Novo or the Company) (ASX: NVO) (TSX: NVO) (OTCQB: NSRPF) is pleased to provide an updated Exploration Target for the Belltopper Gold Project (‘Belltopper’) in Victoria.
Belltopper is located 120 km northwest of Melbourne and approximately 60 km south of Agnico Eagle’s Fosterville Gold Mine (Figure 1) in the Bendigo Zone, an area with historical gold production of more than 60 million ounces.
Kaiser Reef Limited’s Maldon processing plant is located some 40 km to the northwest of the project area and Alkane Resources Limited’s Costerfield’s operation is located some 50 km to the northeast of Belltopper.
2026 UPDATED EXPLORATION TARGET
The 2026 Exploration Target demonstrates significant growth in tonnage and grade when compared with the 2024 Exploration Target. Key improvements from the 2024 Exploration Target to the 2026 Exploration Target (Low and High Case) include:
Tonnage Growth: An increase of 40% (Low) to 48% (High)
Au Grade Improvement: An increase of 1.5% (Low) to 6% (High)
The increase has been driven by further interpretation of local geology, historical data and previous drilling.
This assessment brings in the Western Domain Fault as a new reef and encapsulates strike and depth extensions on four of the seven priority reefs included in the 2024 Exploration Target. The assignment of grade to the updated Exploration Target has also changed through accounting for historical metallurgical recovery and reinterpretation of Waste and Low Grade (LG) material.
Planning has commenced for potential drilling in H2 2026 aimed to provide further confidence in the Exploration Target.
Commenting on the Belltopper Gold Project, Mike Spreadborough, Executive Co-Chairman and Acting Chief Executive Officer, said: “We are very pleased to deliver this important and impressive upgrade to our Belltopper Gold Project Exploration Target.
“The team has been working extremely hard on Belltopper and have delivered an excellent result, with tonnage increasing by 40% and 48% and the already high-grade nature of Belltopper increasing by 1.5% and 6%. “
“The importance and price of gold since our 2024 Exploration Target has increased significantly and we look forward to completing our planning for the next phase of drilling, testing high-priority reefs that sit within and outside the Exploration Target and unlocking the exciting value opportunity of Belltopper when we potentially kick-off drilling in the second half of 2026.”
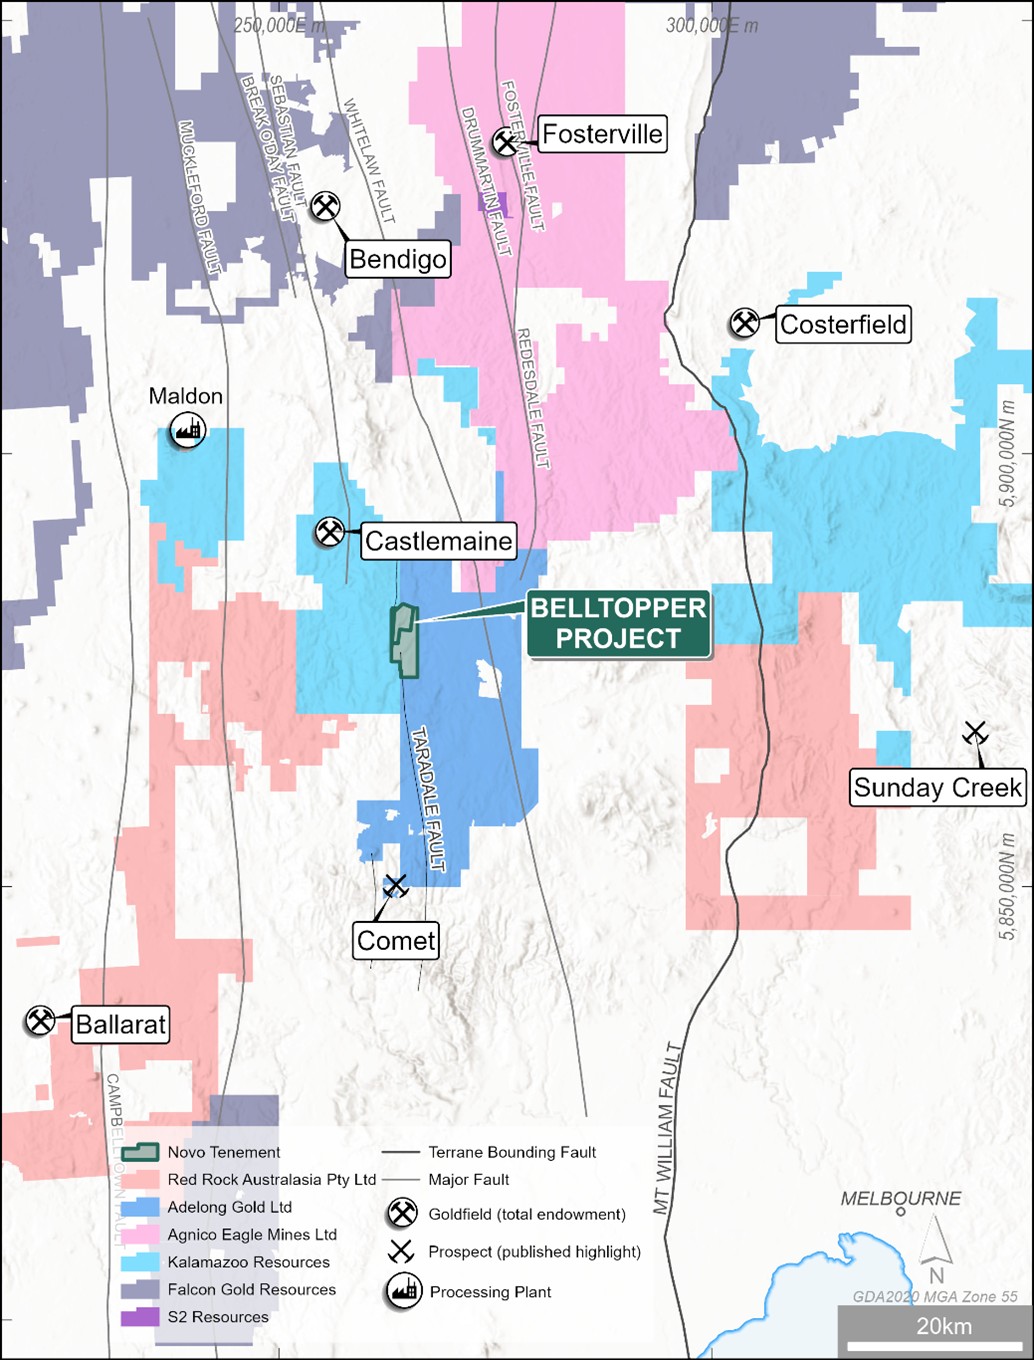
Figure 1. Belltopper Gold Project location map with regional mining centres and major structurea.
See endnotes for for source documents in relation to historical gold production figures for Bendigo, Fosterville, Costerfield, Castlemaine and Ballarat.
The mineralisation presented in the body of this announcement is not necessarily representative of mineralisation throughout the Belltopper Gold Project. Intercepts are expressed as down-hole intersections and should not be presumed to represent true widths, which vary from hole to hole and between reefs (refer JORC Table 1 in Appendix 4). In addition, all references in this announcement to tonnage and grade, and associated ranges are expressed as approximations.
Belltopper is characterised by a dense network of high-grade gold reefs that form a distinct cluster in the northwest quadrant of the project area adjacent the regional Taradale Fault. The 2024 Exploration Target included seven distinct reefs from this cluster that were considered to show the highest prospectivity based primarily on geological, drilling and/or historical mining data.
The 2024 Exploration Target at Belltopper was released on September 24, 2024 (TSX) and September 25, 2024 (ASX) and reported potential gold mineralisation ranging from 1.5 Mt @ 6.6 g/t Au (Low Case) to 2.1 Mt @ 8.4 g/t Au (High Case)b.
The updated 2026 Exploration Target demonstrates significant growth compared to the 2024 Exploration Target (Tables 1 and 2).
Table 2. Breakdown of tonnage and, grade for Low and High Cases (per reef) for the 2026 Exploration Target. Figures may not compute due to rounding.
Target Reefs | Reef No. on Figures | Low Case Tonnage (t) | High Case Tonnage (t) | Low case Grade Range (g/t Au) | High Grade Range (g/t Au) |
Leven Star | 1 | 580,000 | 810,000 | 4.6 | 5.1 |
Missing Link | 2 | 150,000 | 220,000 | 7.7 | 10.5 |
Never Despair | 3 | 180,000 | 270,000 | 7.7 | 10.5 |
O’Connor’s | 4 | 540,000 | 800,000 | 7.7 | 10.5 |
Queens /Egyptian | 5 | 170,000 | 230,000 | 7.7 | 10.5 |
Hanover | 6 | 120,000 | 170,000 | 7.7 | 10.5 |
Piezzi/Stackyards | 7 | 300,000 | 450,000 | 7.7 | 10.5 |
West Domain Fault | 10 | 90,000 | 140,000 | 4.4 | 6.3 |
TOTAL | - | 2,100,00 | 3,100,000 | 6.7 | 8.9 |
Clarification statement: An Exploration Target as defined in the JORC Code (2012) is a statement or estimate of the exploration potential of a mineral deposit in a defined geological setting where the statement or estimate, quoted as a range of tonnes and a range of grade (or quality), relates to mineralisation for which there has been insufficient exploration to estimate a Mineral Resource. Accordingly, these figures are not Mineral Resource or Ore Reserve estimates as defined in the JORC Code (2012). The potential quantities and grades referred to above are conceptual in nature and there has been insufficient exploration to estimate a Mineral Resource, and it is uncertain if further exploration will result in the estimation of a Mineral Resource. These figures are based on the interpreted continuity of mineralisation and projection into unexplored ground often around historical workings. The Exploration Target has been reported in accordance with the JORC Code (2012).
Eight reefs together form the 2026 Exploration Target (Figure 2), primarily defined by mapping, sampling, and 3D modelling of historic reef workings, supported by modern drilling and acquired LiDAR™ and high-resolution ortho-imagery across the project area.
Figure 3 and Figure 4 zoom-in to the northern and southern sectors of the field respectively to show more detail.
Figure 3 and Figure 4 also highlight historic and newly recognised high-grade gold reefs in the project area with significant intersections returned across all phases of drilling depicted (see Appendices 1,2 and 3 for all intersections > 2 gram meters).
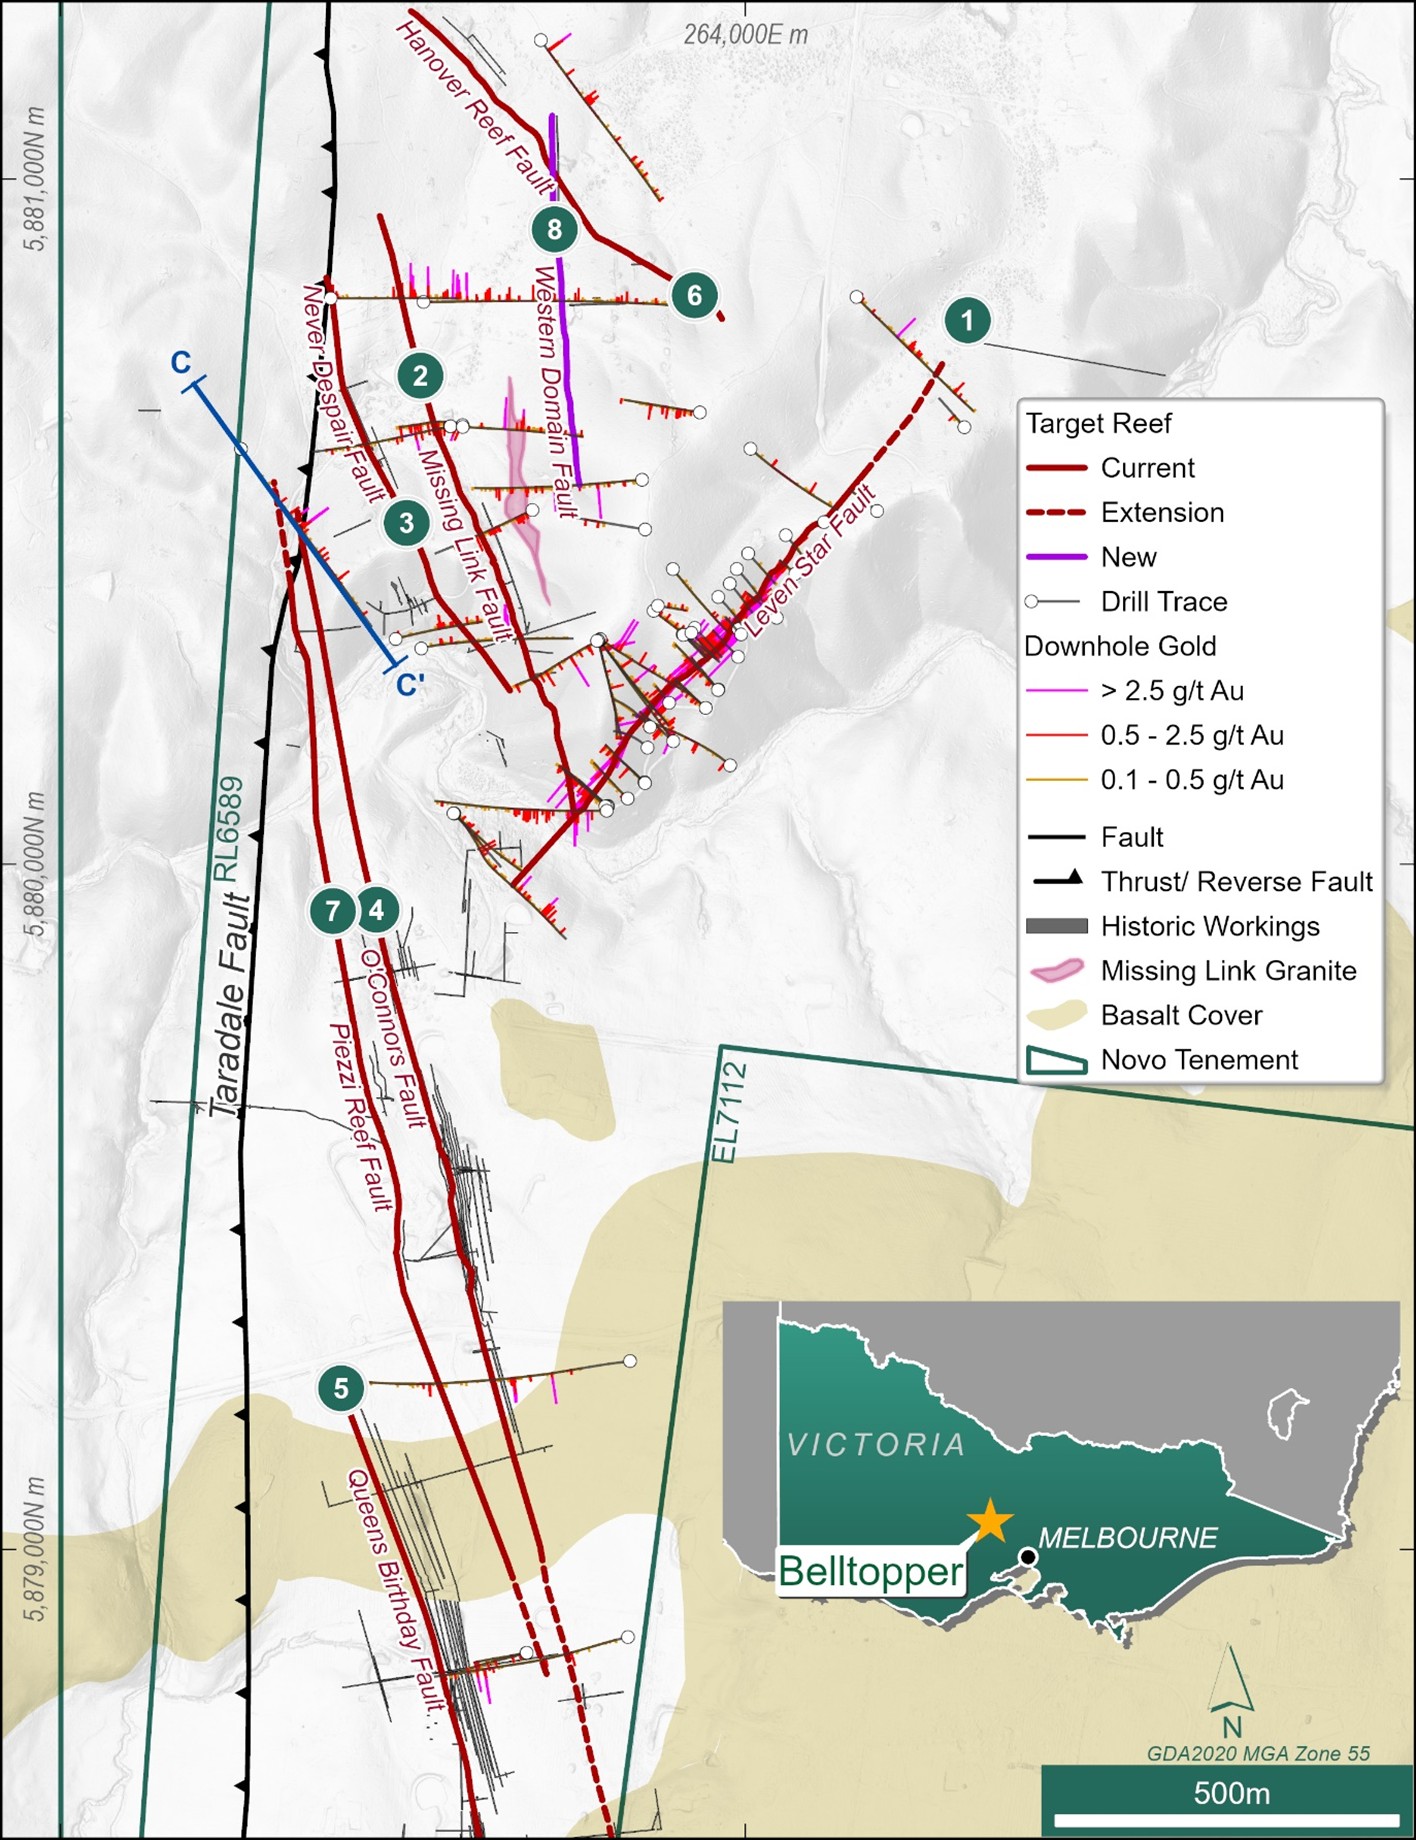
Figure 2, Overview Map of the Belltopper Gold Project showing location of the eight reefs included in the 2026 Exploration Target, downhole gold tenor, historical workings, important geological elements of the field and the location of Section C-C’ displayed in Figure 6.
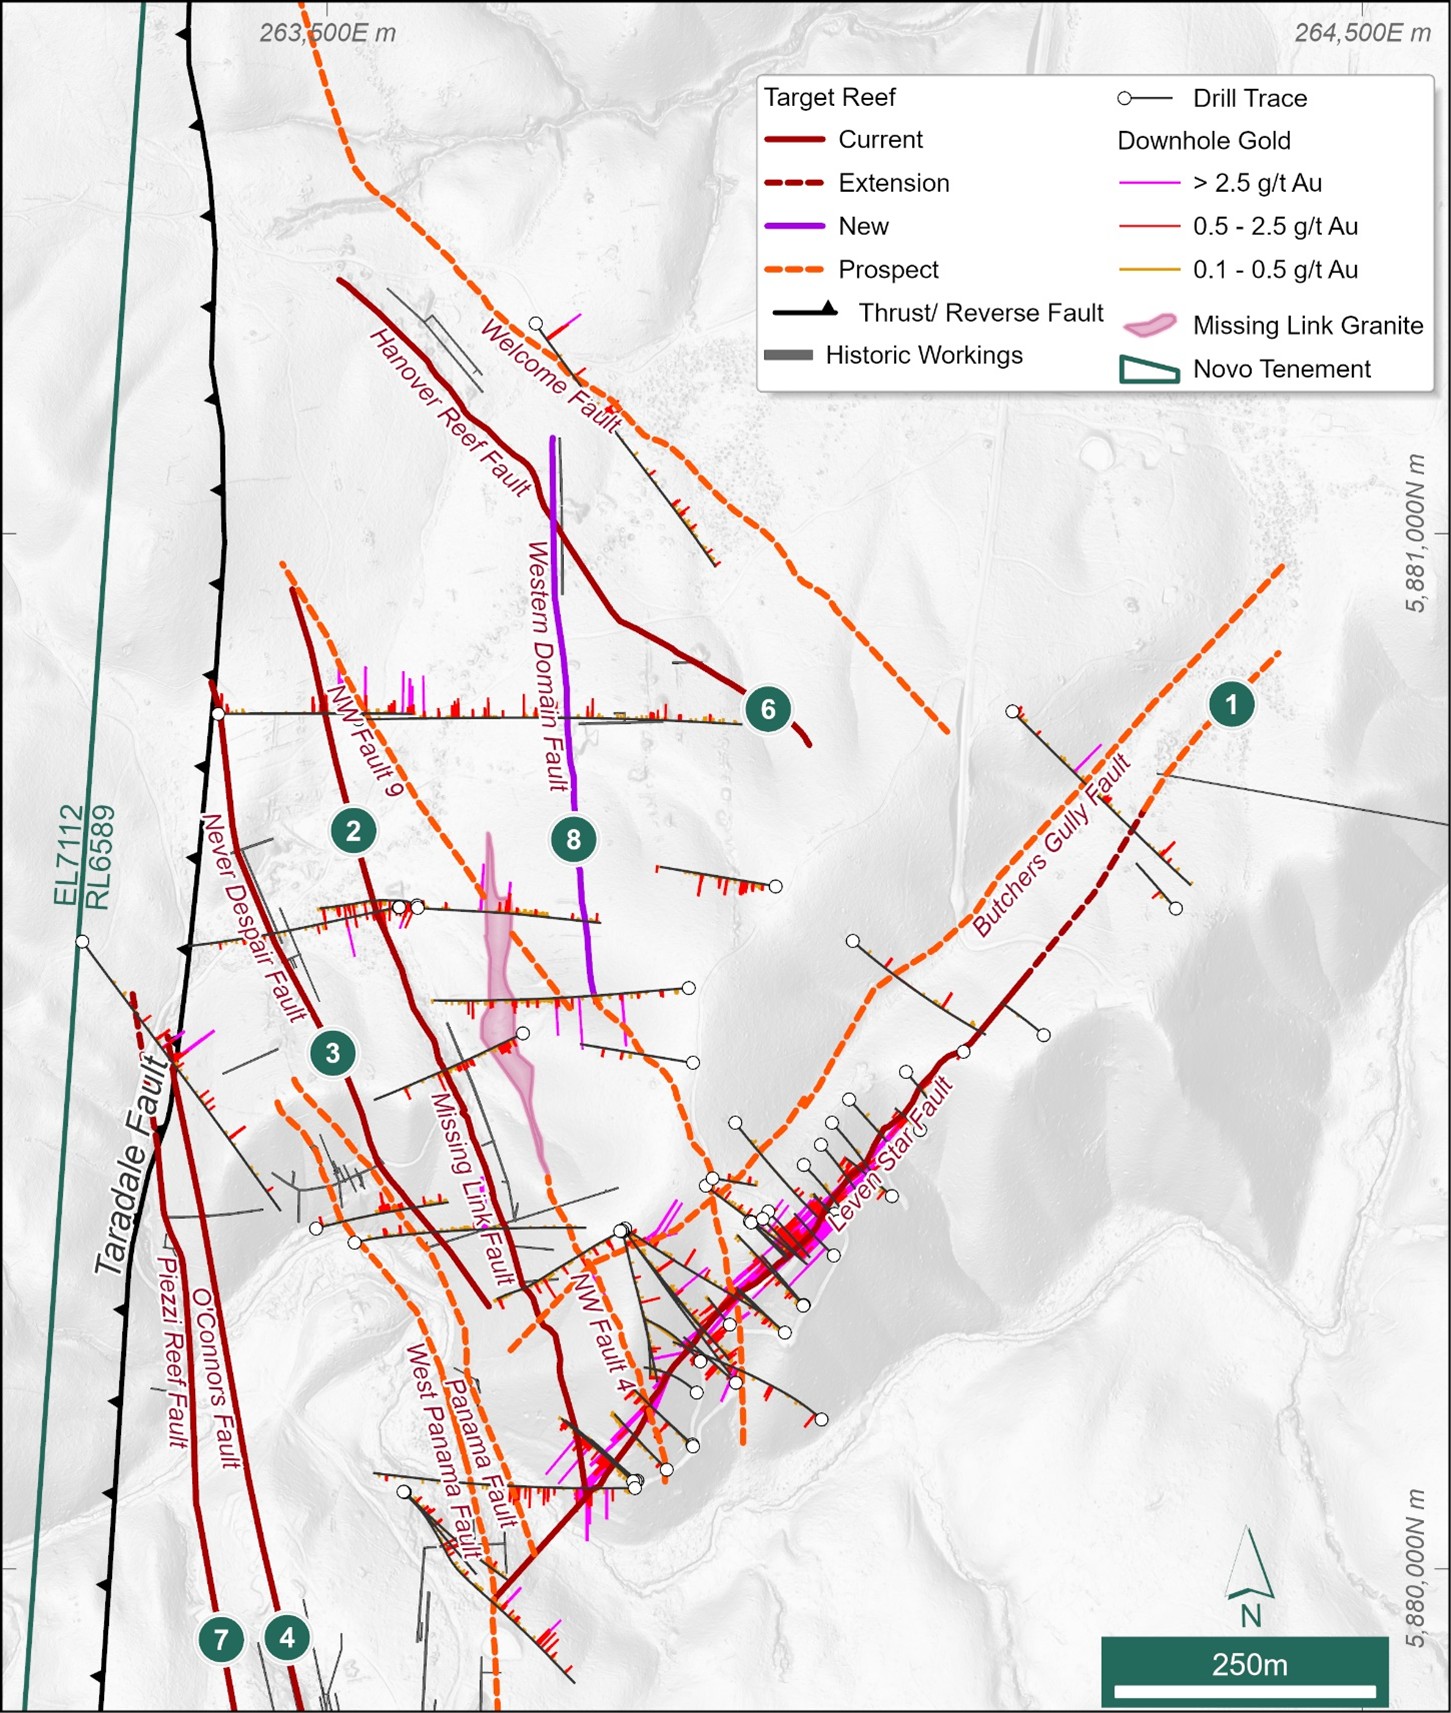
Figure 3, Location map for northern 2026 Exploration Target reefs labelled #1 through #8. Refer to Table 4 for characteristics of individual reefs and Table 2 for breakdown of the 2026 Exploration Target per reef. For a full list of all significant >2 m.g/t Auc intercepts with corresponding drill collar details and location map refer to Appendices 1, 2 and 3.
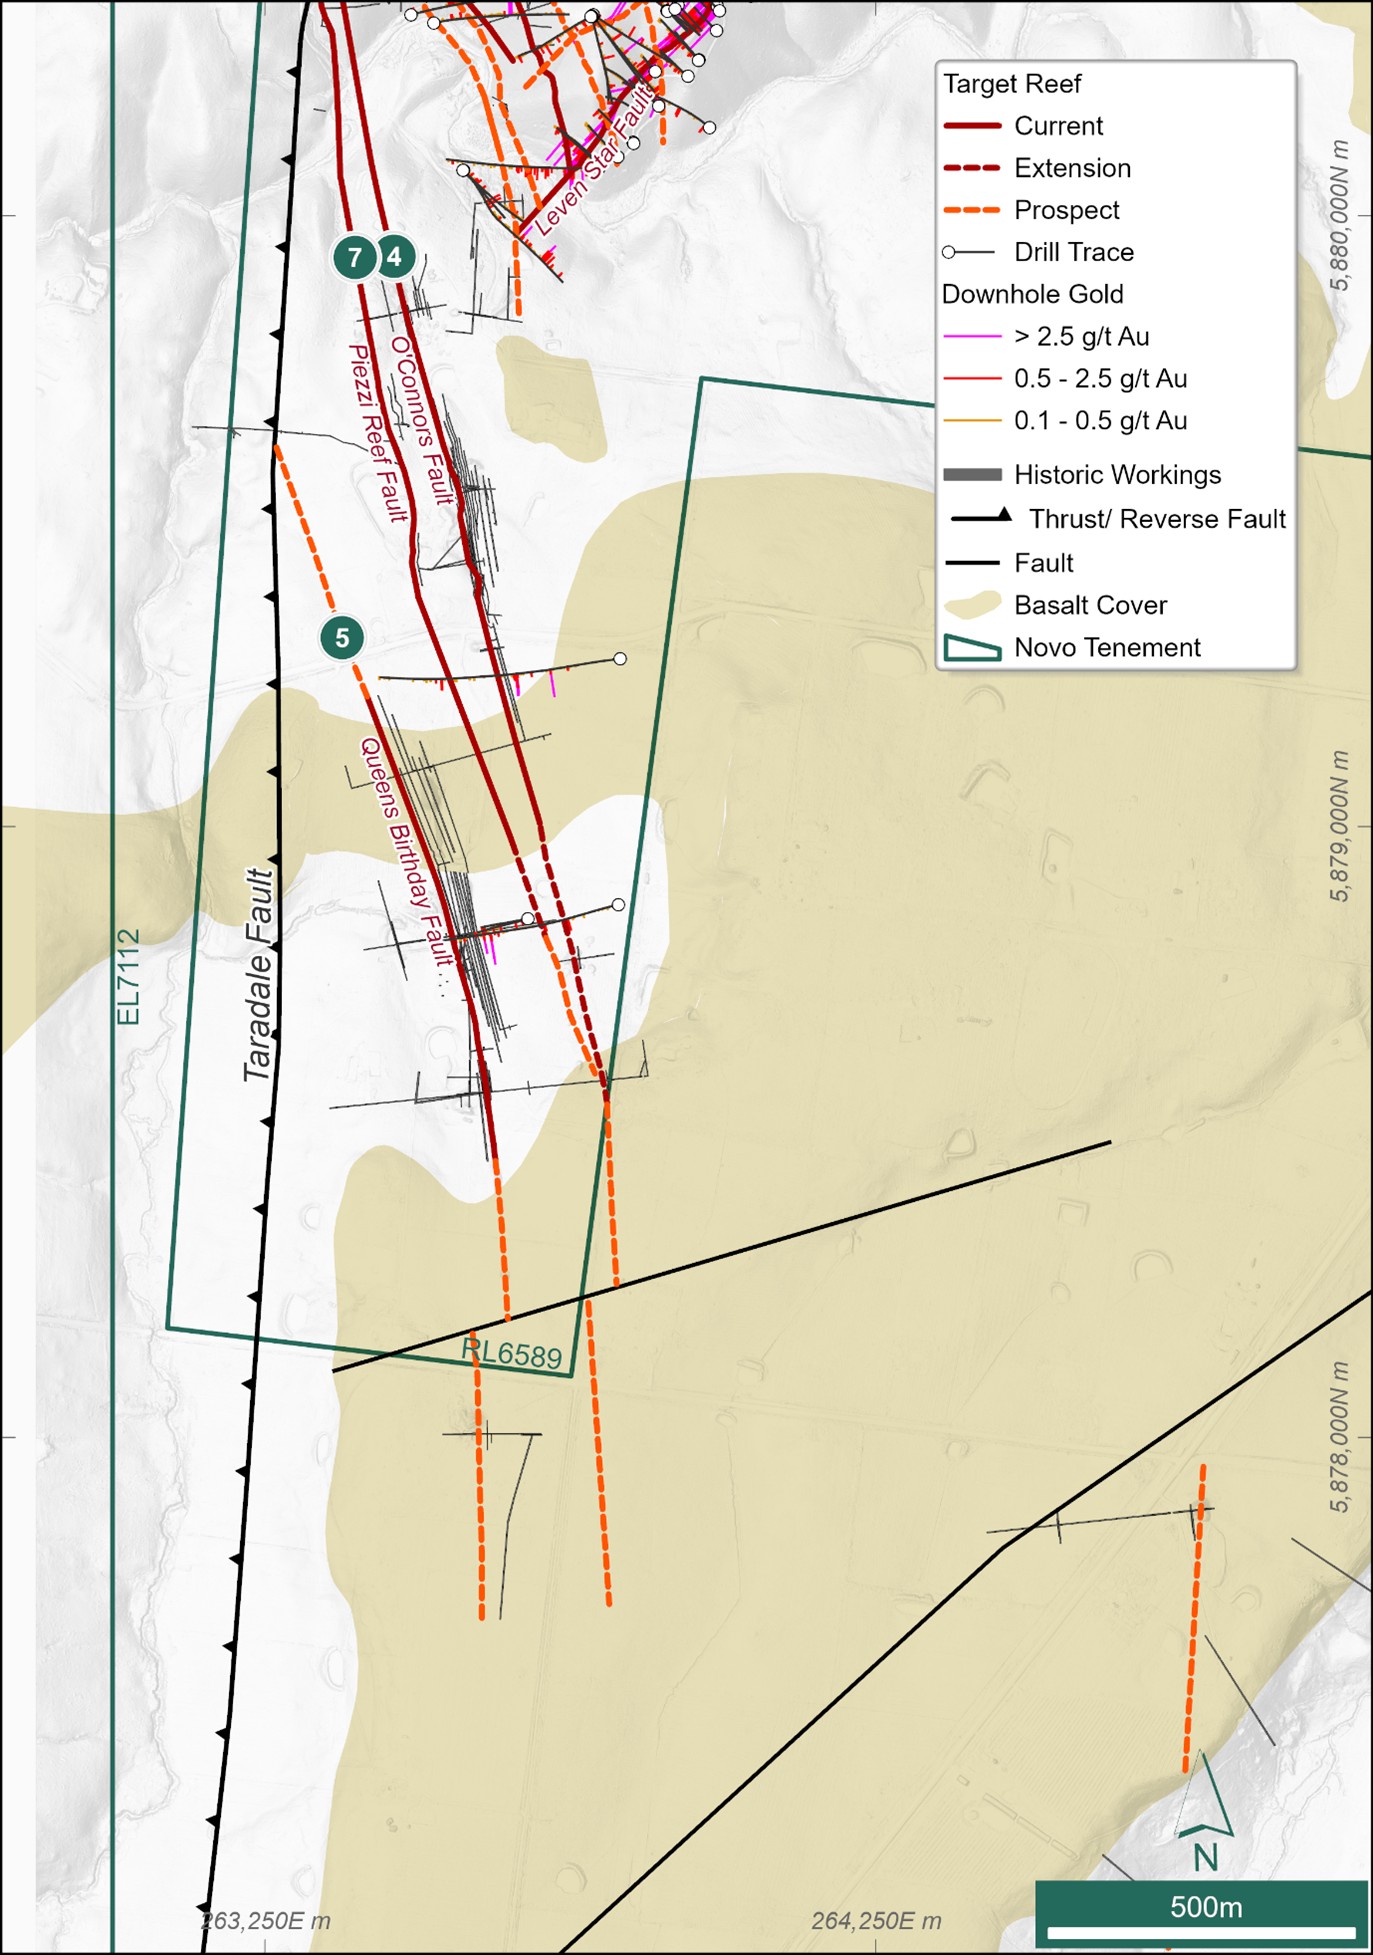
Figure 4, Location map for the southern 2026 Exploration Target reefs labelled #1 through #8. Refer to Table 4 for characteristics of individual reefs and Table 2 for breakdown of the 2026 Exploration Target per reef. For a full list of all significant >2 m.g/t Auc intercepts with corresponding drill collar details and location map refer to Appendices 1, 2 and 3.
All reefs forming part of the updated 2026 Exploration Target have some degree of historic mining and/or exploration development, albeit this is minor on the Leven Star Reef. The most significant mining occurred on the historic Queens Birthday – Egyptian and O’Connor’s Reefs, where a combined production of ca. 90,000 oz Au at historical recovered grades of between 1-2 oz/t Au are reported4.
Key inputs are supported by Novo’s geological understanding of the reef network at Belltopper, and draw upon the detailed 3D reconstruction of historic mining and exploration development data, drilling data, structural and geochemical data, field mapping (including high-resolution LiDAR™ interpretation), and surface rock chip sampling (Tables 3 and 4; Figure 5).
Reefs #1 to #7 were included in the 2024 reported Exploration Target. Reef #8 is an addition to the current updated 2026 Exploration Target.
Table 3. Significant reefs with summary of key inputs to the 2026 Exploration Target.
Target Reefs | Reef No. on Figures 2-4 | Historic underground development | Historical production data | Drilling | Mapped | Surface sampling |
Leven Star | 1 | Minor | No | Significant | Yes | Yes |
Missing Link | 2 | Yes | Yes | Yes | Yes | Yes |
Never Despair | 3 | Yes | Yes | Yes | Yes | Yes |
O’Connor’s | 4 | Yes | Yes | Yes | Yes | Yes |
Queens / Egyptian | 5 | Yes | Yes | Yes | No | No |
Hanover Reef Fault | 6 | Yes | Yes | Yes | Yes | Yes |
Piezzi Reef / Stackyards | 7 | Yes | Yes | Yes | Yes | Yes |
Western Domain Fault | 8 | Yes | Yes | Yes | Yes | Yes |
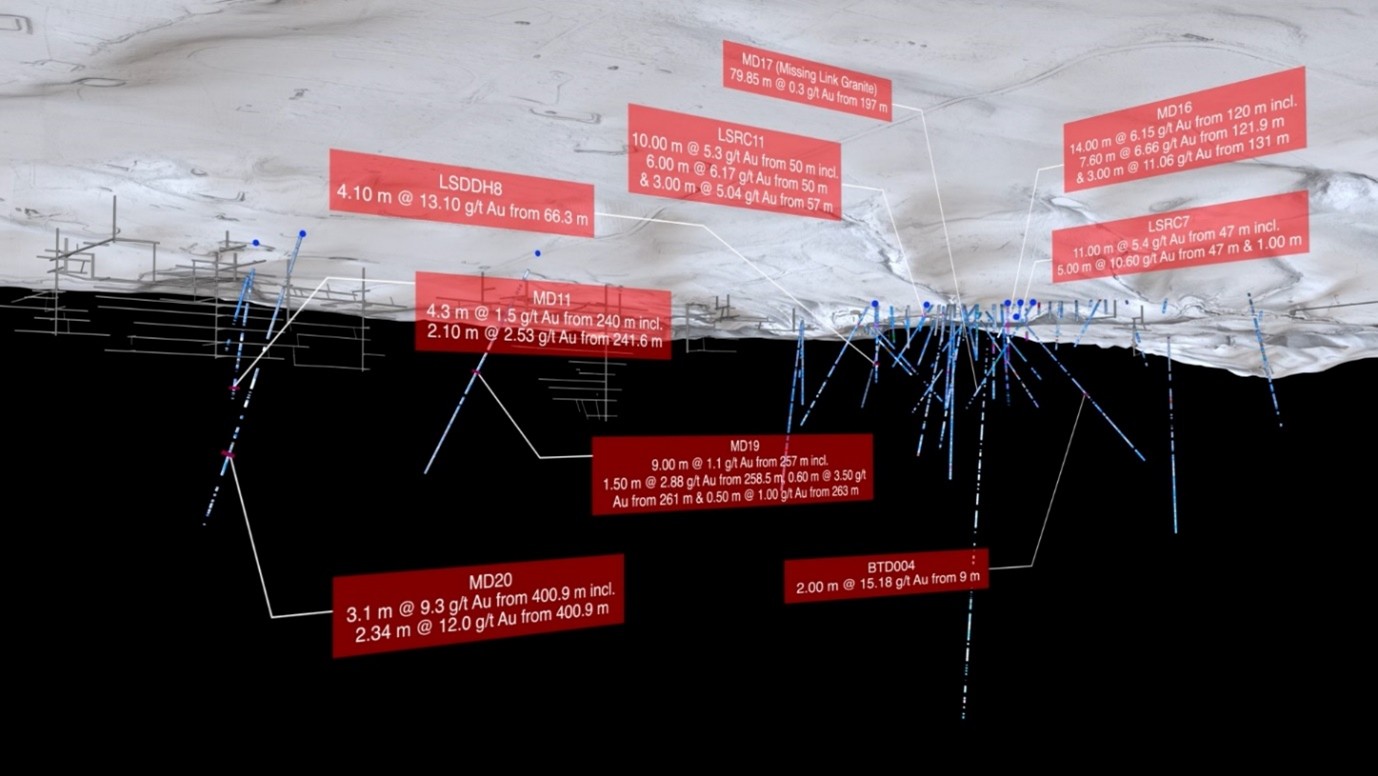
Figure 5, Example from Novo's 3D Model, showing historical mine infrastructure, diamond drilling and assay callouts, beneath LiDAR™ 2
Reefs belonging to the 2026 Exploration Target are typically narrow, discrete, continuous structures that can be traced up to 2 km in strike (e.g. O’Connors Reef). These reefs (barring the newly added Western Domain Fault) typically fall into two geometrical sets: a more common moderate to steep NE dipping set; and a less common subvertical to steep NW dipping set. Both sets are oblique to north-south trending stratigraphy. The reefs manifest as narrow (<1 m wide), sulphide-rich fault breccias ±quartz vein occurrences or infrequently as multiple occurrences within a typically wider halo of intense sericite–silica ±kaolinite altered sediments, with preserved textures and mineralogy consistent with the epizonal class of orogenic lode gold deposits.
The Western Domain Fault strikes north-south and represents the westernmost line of a series of narrow, steeply east-dipping reefs that belong to the historic Doctors Reef–Queen Victoria Reef area of workings (Figures 2 and 3). The Western Domain Fault represents the largest of the north-south workings in this area.
Table 4. Individual characteristics for each of the eight reefs included in the updated 2026 Exploration Target. Square brackets highlight previous parameters adopted for strike and dip continuity on individual reefs reported in the 2024 Exploration Target, where they have changed for the 2026 Exploration Target.
Reef | Dip / dip direction | Strike continuity (m) | Dip continuity (m) | Potential mining width (m) | Mean vein width | Characteristics of mineralisation |
Leven Star | 85° to SE | 1,000 | 400 | 2.6 | 2.60 | Sulphide rich tectonic breccia ±disseminated and stringer hosted sulphides. Occasional zones of white quartz veining stockwork (Au + As, Sb ±Bi, Sn, W) |
Missing Link | 75° to ENE | 920 | 250 | 1.5 | 0.15 | Tectonic breccia +- disseminated sulphides (Au + As) |
Never Despair | 80° to ENE | 670 | 400 | 1.5 | 0.20 | Puggy tectonic breccia (Au + As) |
O’Connor’s | 70° to ENE | 1,960 | 400 | 1.5 | 0.33 | Tectonic breccia ±disseminated sulphides (Au + As) |
Queens/Egyptian | 78° to ENE | 780 | 400 | 1.5 | 0.20 | Tectonic breccia ±disseminated sulphides and irregular white quartz veinlets (Au + As) |
Hanover Reef | 70° to NE | 650 | 250 | 1.5 | 0.25 | Broad zone of quartz stockwork veining surrounding narrow sulphide rich tectonic breccia (Au + As) |
Piezzi Reef / Stackyards | 75° to ENE | 1,760 | 250 | 1.5 | 0.20 | Narrow tectonic breccia overprinting bucky white quartz vein surrounded by irregular quartz veining (Au + As, Bi) |
Western Domain Fault | 70° to E | 550 | 250 | 1.5 | 0.20 | Sericite shear and narrow tectonic breccia (Au + As) with vuggy Fe-Qtz stockwork veining |
* Parameters in square brackets represent those used in the previous 2024 Exploration Target reported. These are presented for comparison.
Leven Star Extension
The original strike continuity for the Leven Star Reef adopted in the 2024 Exploration Target is represented as the solid red line in Figure 3 and was initially restricted to the portion of Leven Star where extensive historical RC and diamond drilling was completed. The updated 2026 Exploration Target extends the Leven Star an additional ~200 m strike to the NE, primarily driven by a significant intersection in BTD003 comprising 3 m @ 1.0 g/t Au from 318.41 m that is consistent with the re-modelled NE projection of the reefd. This intersection is further supported by mapping, paleo-alluvial working trends, and an obvious lineament in the high-resolution LiDAR™ data that logically represents a potential extension to the main Leven Star structure.
The Leven Star Reef intersection in BTD003 is characterised by a distinct zone of sericite and silica altered sandstone with disseminated chalcopyrite, arsenopyrite and pyrite, narrow (1-2 cm) quartz veining and thin (1-2 mm) feldspar veining.
Piezzi and O’Connor’s Reef Extensions
The Piezzi/Stackyard and O’Connor’s reefs were intersected in BTD006 during Novo’s 2023-2024 diamond drilling campaign (Figure 2 and Figure 4). A significant intersection of 7 m @ 1.88 g/t Au from 179 m; including 3.19 m @ 3.42 g/t Au from 182.81 m correlates with the modelled NW extension of the Piezzi/Stackyard Reef (Figure 6)d; whilst a significant intersection of 1.56 m @ 0.55 g/t Au from 238.14 m correlates with the modelled NW extension of the O’Connor’s Reef. These intersections are beyond the northwest strike limits adopted in the 2024 Belltopper Exploration Target for both reefs. The updated 2026 Exploration Target extends the strike of both reefs to drill hole BTD006, where the reefs manifest as “blind,” targets below the surface and in the footwall of the west-dipping Taradale Fault. Both reefs remain open at depth and to the NW.
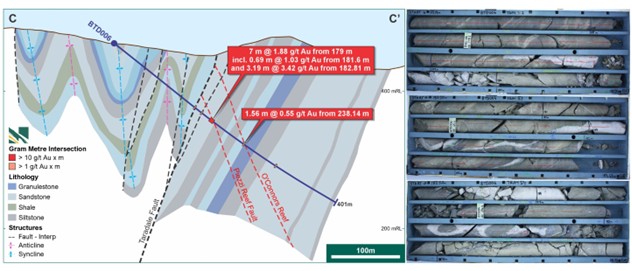
Figure 6, Drill cross section for BTD006 showing intersection of Piezzi Reef Fault and O’Conner’s Reefs. These manifest as “blind,” reefs in the footwall of the Taradale Fault in this area. Diamond core from BTD006 (177.19 m–186.77 m) shows the Piezzi Reef intersection characterised by significant quartz veining within a mineralised halo of strongly sericite altered sediments.d
A review on modelled historic underground workings from the Queens Birthday, Queens Birthday South, and the Eastern Whim Crosscuts (Figure 7), highlight historic drives that worked east-dipping reefs consistent with the current modelled SE extensions for the Piezzi/Stackyards and O’Connor’s reefs. These drives sit beyond the SE limitations adopted for both reefs in the 2024 Exploration Target.
The updated 2026 Exploration Target extends the Piezzi/Stackyards Reef to the main Queens Birthday Crosscut; and the O’Connor’s Reef to the No. 1 South Queens Birthday Crosscut (Figure 7).
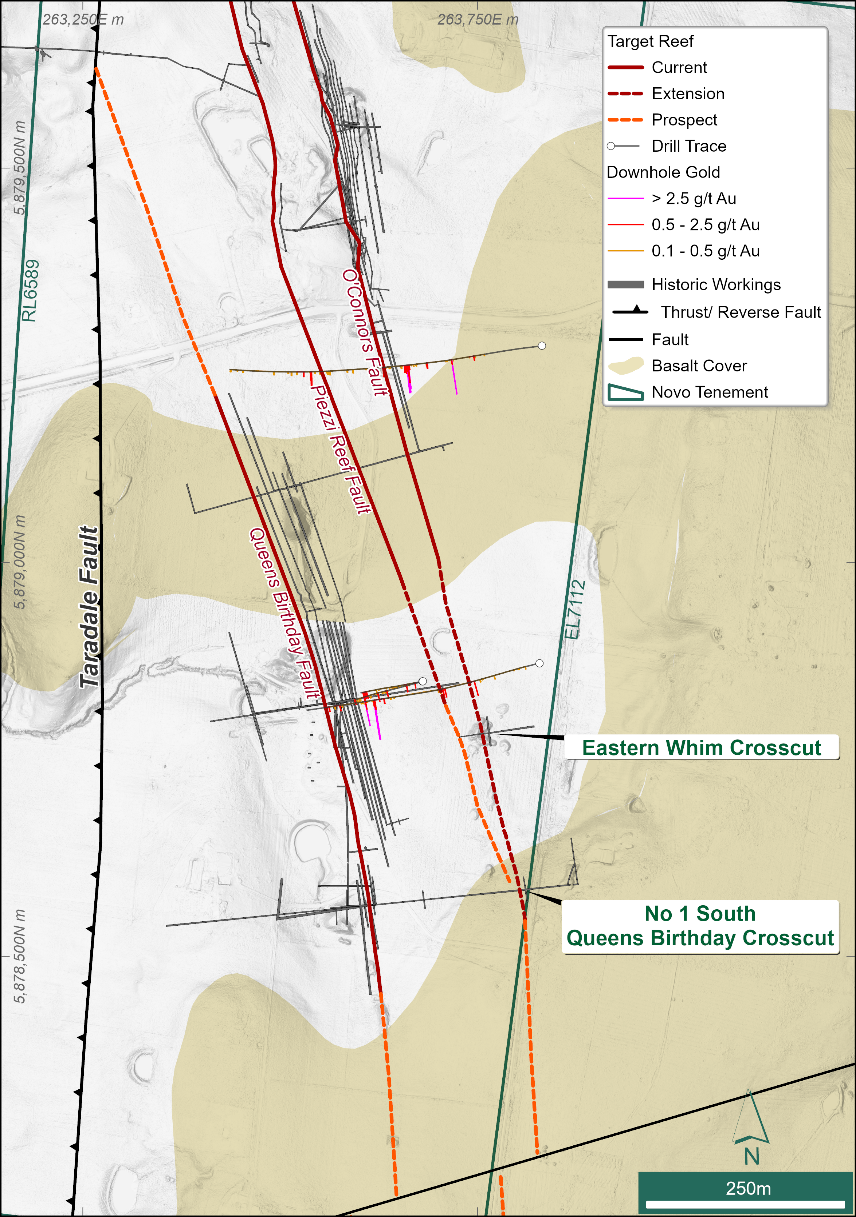
Figure 7, Extents of the Piezzi, Queens Birthday and O’Connors reefs. Solid red lines demarcate the strike continuity extents for these reefs as utilised in the 2024 Exploration Target. Red dashed lines represent the extensions for the reefs as part of the updated 2026 Exploration Target. Orange dashed lines represent priority future target extensions “prospects” that will require future drill validation.
The updated strike continuity for the O’Connors (now 1,960 m) and the Piezzi/Stackyards (now 1,760 m); represent an addition of (+460 m) and (+210 m) for both reefs, respectively, which is incorporated into the 2026 Exploration Target. The solid red lines in Figure 7 depicts the original strike continuity for the O’Connor’s, Piezzi/Stackyards and Queens Birthday Reefs as per the 2024 Exploration Target. The dashed red lines depict the extensions captured in the updated 2026 Exploration Target. The dashed orange lines represent potential future exploration upside for these three reefs that will require drill validation and is not incorporated into the current update.
Western Domain Fault
The Western Domain Fault is a steeply east-dipping structure that forms the westernmost line of a series of north-south trending reefs belonging to the historic Doctors Reef – Queen Victoria area of workings (Figure 2 and Figure 3; Table 4). Small scale historic mining was conducted by various companies on these reefs ca. 1880–1920; with most of the underground development on the Western Domain Fault occurring ca. 1913–1918. Historic mining records describe the main north-south trending underground reef from the Western Domain Fault up to a foot wide (30 cm); though records average at around 20 cm.
The modelled Western Domain Fault was intersected within MD17, drilled in 2022. A significant intersection of 0.95 m @ 10.0 g/t Au from 102.65 m is characterised by a stockwork zone of vuggy Fe–quartz veins in sericite altered competent siltstone and fine-grained sandstone bracketed by narrow puggy sericite-sulphide shears (Figure 8)b. The intersection of the Western Domain Fault in MD17 marks the southern limits adopted for the strike continuity for this reef (550 m total), however the structure has been mapped and interpreted to continue for an additional ~470 m to the south. This potential southern extension represents a priority future target that requires additional drilling.
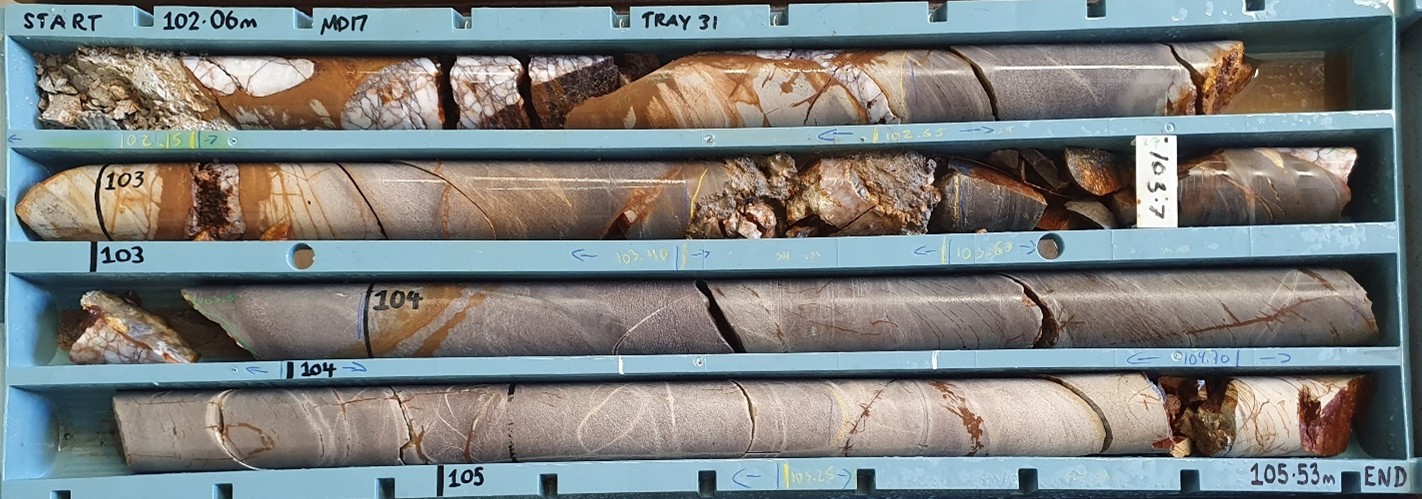
Figure 8. MD17 (102.06 m–105.53 m). Interpreted Western Domain Fault between 102.06 m and 103.6 m. Significant intersection of 0.95 m @ 10.0 g/t Au from 102.65 m with elevated arsenic returned from this intervalb.
Dip Continuity Adjustments
Dip continuity for individual reefs has been simplified in the updated 2026 Exploration Target. For reefs with relatively shallow historic underground workings or no workings, or limited, deeper drill testing (Missing Link, Hanover, Piezzi and Western Domain); a conservative nominal depth of 250 m has been adopted. For reefs with deeper and more extensive underground mine workings (O’Connor’s and Queens Birthday), and/or significant deeper drill reef intersections (Leven Star, Never Despair); a nominal depth of 400 m has been adopted (Table 4).
BASIS FOR THE BELLTOPPER EXPLORATION TARGET
Novo applied its geological understanding of the reef network at Belltopper, drawing upon 3D reconstruction of historic mining (Figures 2 - 5) and exploration data, drilling data, structural and geochemical data, field mapping (including high-resolution LiDAR interpretation), and surface rock chip sampling.
Mineralisation volumes were defined from strike and dip continuity and potential modern “mineable width.” Continuity extents and width were based on geological interpretation and modelling by Novo (Tables 3 and 4; Figures 3 and 4).
The Leven Star Reef (#1) was based on a 3D wireframe from drilling, whereas the other reefs are based on strike and dip extents inferred from historical data, surface, mapping, and limited drilling (Figures 2 and 3). The volumes were modified by three factors: (1) geological continuity factor, (2) payability factor; and (3) mine factor.
The geological continuity factor allows for potential breaks in local geological continuity related to faulting and/or reef pinch-out. Values across the eight reefs (all of which are approximations) averaged 0.86 for the High case and 0.76 for the Low case.
The payability factor acts to report potential “mineable tonnages” at a notional cut-off grade within the target zone, which averaged (approximately) 0.34 for the High case and 0.26 for the Low case. The payability for the Leven Star Reef was based on the percentage of estimation blocks reported at an underground mining cut-off of 2.7 g/t Au – which was 0.25.1
The mine factor accounts for any mining that has been undertaken within the target zone. Values applied range from approximately 0.5 (indicating substantial historical mining) for the Queens/Egyptian Reef (#5 in Figures 2 and 4) to 0.99 (indicating minimal historical mining) for the Leven Star Reef (#1 in Figures 2 and 3).
The Exploration Target is located within both oxide and fresh mineralisation. A weighted bulk density of approximately 2.65 t/m3 was applied to both the High and Low cases to define mineralisation tonnages based on drilling information from the Leven Star Reef. No other bulk density data is available, and it is assumed that the Leven Star data represents other reefs.
The High and Low case Target Mineralisation Tonnages have been calculated using the following equation (Equation 1), where underlined, factors are different between the Low and High Cases:
Strike continuity x dip continuity x mineable width x geological continuity x payability x mine factor x bulk density
The other factors were not changed as the CP/QPs considered that the geological continuity and grade payability factors provided enough variation in the context of a conceptual model – the Exploration Target.
Grade was assigned based on the analysis of historical data. For the Leven Star Reef, the Low grade was assigned from the block model, and for the High case via a nominal 10% upgrade.
For the other reefs, a base historical grade of 1 oz/t Au (31 g/t Au) was used. This grade was based on historical research which indicates mill recovered grades of 1-2 oz/t Au (31-62 g/t Au).2 A conservative value of 31 g/t Au was applied. For the Western Domain Reef (#8 in Figure 2 and Figure 3), a base historical grade of 0.5 oz/t Au (16 g/t Au) was applied reflecting limited production/trial parcel information and its lower grade. The base historical grade applied to reefs #2-8 reflects selective mining from narrow 2-3 feet (0.6-0.9 m) wide stopes and a degree of hand sorting.
The reefs were very narrow, averaging about 0.2 m width, varying from 0.1 m to 1 m (Table 4). Most reefs rarely exceeded 0.6 m, with the mean variation between 0.15 m to 0. 3 m.
The historical reports for the Belltopper area provide no stope widths. Drive backs (roof) in sub-vertical to vertical reefs in Central Victoria were typically c. 3-4 feet wide (0.9-1.2 m), other than for very wide reefs and stockwork zones (e.g., Ballarat and Bendigo). Based on underground observation of Central and Eastern Victorian (< 0.5 m) reefs, stopes were typically c. 2-3 feet wide (e.g. 0.6-0.9 m).3
______________________
1 For the Leven Star Reef an in-house block model has been produced during May 2024. This has not been classified or reported as a Mineral Resource. It has been used to inform the Exploration Target. Evaluation of payability for reefs #2-8 included review of stoping patterns versus developed area.
2 Historically recovered grades and production metrics (tonnes, grades and ounces) were collated from research completed on historic data reported in various newspapers including the Kyneton Observer, Kyneton Guardian, The Age (Melbourne Newspaper) and The Argus (Melbourne Newspaper). These 19th Century newspaper reports are accessible via the TROVE website maintained by the National Library of Australia. In addition, publications of the Geological Survey of Victoria (GSV) and the Mines Department were accessed. Mine plans and sections were also accessed through government archives. Historical data compilation and analysis have been undertaken for Novo by Clive Willman & Associates. Novo has not conducted data verification (as that term is defined in National Instrument 43-101 Standards of Disclosure for Mineral Projects and JORC 2012) in respect of this data and therefore is not to be regarded as reporting, adopting or endorsing those results/figures. No assurance can be given that Novo will achieve similar results at Belltopper.
3 Observations based on underground inspection and historical data review by Dr Simon Dominy (1998 to the present) across the Victorian Goldfields, including Ballarat, Bendigo, Cassilis, Castlemaine, Inglewood, Tarnagulla and Walhalla/Woods Point. Supporting reference - Dominy, S.C. 2009. Historical records in the evaluation of goldfields: Examples from the Central Victorian Goldfields, Australia, J. Welsh Mines Soc. (Welsh Mines & Mining), 1, pp. 83-94.
The following process has been applied to define a potential mining grade for the Exploration Target. For reefs #2-7, grade was assigned via the following steps:
The Target Mineralised Tonnage (defined via Equation 1) was domained into Low (LG) and High (HG) Grade zones using a nominal split of 30:70 (Low case) and 40:60 (High case). The LG mineralisation (including some barren waste) was assigned grades of 3 g/t Au (Low case) and 6 g/t Au (High case) respectively.4 This is based limited data from Belltopper and on research in other Central Victorian goldfields, reflecting the fact that the Target Mineralised Tonnage will not have a consistent high grade, but will include LG mineralisation that historically will have been mined and at least in part hand sorted and/or left as pillars. Modern underground cut-off grades are likely to be in the range 1-3 g/t Au at the prevailing gold price, unlike those historically which could have been >15 g/t Au. Thus any current operation would include more LG material into the mill feed due to a lower cut-off grade.
LG and waste (e.g. wallrocks) material will have had some degree of hand sorting with some material stacked in stopes underground. Some additional sorting may have been undertaken at surface and left as mullock (waste) dumps as seen in the region. The actual amount of sorting undertaken is difficult to quantify and rarely documented. Sorting was not sophisticated and based on human activity, therefore the effect on grade may only have been a 10-20% upgrade relative to the in-situ grade. The historical recovered grade of 16 g/t Au (reef #8) and 31 g/t Au (reefs #2-7) was factored to allow for some sorting. Values of 10% (High case) and 20% (Low case) were applied. Sorted material was assumed to have a nominal waste grade of 0.5 g/t Au (Low case) and 1 g/t Au (High case) respectively.
The reported grades in historical literature are mill recovered grades. Historical process plants usually comprised stamp batteries, where pulverised material was subsequently passed to gravity concentration, followed by amalgamation.5 Very few reconciliations exist, but limited tails reprocessing operations over the years have indicated that historical plant recovery was often between 80-95%, with an average of 90%.6 Novo has applied recovery factors of 95% (Low case) and 90% (High case). Such a correction was not undertaken for the 2024 Exploration Target. For the Low case, assuming 95% metallurgical recovery and 20% sorting (0.5 g/t Au sorted material), the back-calculated “in-situ grade” is 26.2 g/t Au (original historical recovered grade 31 g/t Au).
The “in situ grade” is then proportionally combined with the HG to give the “target zone grade” which is an estimate of the in-situ grade that the historical miners may have mined. This however is at the “historical mining width” (HMW), not a modern mining width. The “in situ grade” needs to be diluted to approximate what might be mined today. The “target zone grade” has been diluted to a possible modern mining width of 1.5 m (Mineable width – see Equation 1) based on HMWs of 0.6 m (Low case) and 0.75 m (High case).
Table 4 presents the updated 2026 Exploration Target characterised per individual reef.
______________________
4 Trial crushing of LG mineralisation based on a few tonnes fed to a stamp battery followed by gravity concentration and amalgamation, often reports a grade of “a few pennyweights,” where one pennyweight is c. 1.5 g/t Au. A range of 2 (3 g/t Au) to 4 (6 g/t Au) pennyweights was selected. Processing of mullock (waste) tips at Queens Birthday during 1894-1895 provided data for to back-estimate feed grades in the range 3-5 g/t Au (c. 2-3 dwt/t). Waste dumps would contain barren material (0 g/t Au); LG mineralization that reflects mineralised wallrocks (containing thin stockwork veins and/or disseminated sulphides); and occasional HG mineralization.
5 Process plants comprise stamp batteries with throughputs of potentially 0.5-4 tonnes per day (per stamp head). Ground material then passed to sluices, strakes, buddles and/or tables, with final gold recovered by mercury amalgamation. Supporting references – Birrell, R.W. 2014. The extraction of gold by amalgamation and chlorination. J. Austral. Mining Hist., 2, pp. 17-43; and Darlington, J. 1878. On the Dressing of Ores in Ure’s Dictionary of Arts, Manufactures and Mines (Volume II), Longmans, Green & Co., London, pp. 72-161.
6 Includes reviews of 20th Century tails reprocessing operations in Central Victoria (e.g. Bendigo) where recovered gold from the tails was reconciled against historical recovered grades (Dominy, S.C., Unpublished data).
INFRASTRUCTURE OPTIONALITY
Novo believes that should mining be viable at Belltopper, an underground operation would be the most appropriate option. Operations could be led by the application of low-profile narrow vein mechanised mining and a selective stoping strategy, potentially using pre-concentration (e.g. ore sorting and/or gravity or flotation options) and shipping offsite for processing to minimise the local surface footprint. The mine access decline could be placed away from existing infrastructure and dwellings. Any operation would be supported by good regional infrastructure and easy access to Melbourne (c. 120 km to the NW). At this time there has been insufficient exploration to estimate Mineral Resources and Ore Reserves as defined in the JORC Code (2012), and any decision to mine would be based on a feasibility study.
The factors and grades used to support the 2026 Exploration Target are based on reasonable assumptions by the CP/QPs derived from historical research at Belltopper and other Victorian Goldfields. Consequently, the conceptual nature of the Exploration Target is re-emphasised, and the reader is referred to the “clarification statement” provided previously.
EXPLORATION POTENTIAL UPSIDE
The updated 2026 Exploration Target incorporates eight individual prospective reefs from an extensive network of high-grade, epizonal gold reefs that are characteristic at Belltopper. Several reefs that currently sit outside of the 2026 Exploration Target have been identified as having the potential to be brought into future updates. These reefs are mapped and modelled in 3D; with individual reefs displaying varied degrees of historic workings (underground and/or surface); positive surface sample assays and/or positive drill intersections.
Specific high-priority reefs that were considered, but not included in, the current Exploration Target include the NW Fault 9, the Butchers Gully Fault, the Panama and the West Panama Faults and the Welcome Fault (Figure 3). Novo considers these reefs a high priority for drill testing and potential inclusion in a future Exploration Target update.
Table 5 below highlights some key characteristics of these additional “prospective,” high-grade epizonal gold reefs.
Table 5, select, key characteristics for additional “Prospective” target reefs for high-priority future drill targeting
Additional Reefs (“Prospects”) | Historic underground development | Surface Workings Evidence | Mapped | Drill Holes | Best significant intersection |
NW Fault 9 | No | Yes | Yes | Limited | 2.0 m @ 15.18 g/t Au from 9 m in BTD004. |
Butchers Gully Fault | No | Yes | Yes | Yes | 3.1 m @ 3.29 g/t Au from 36 m, (includes |
Panama Fault | Yes | Yes | Yes | Limited | N/A |
West Panama Fault | Yes | Yes | Yes | Limited | 13.0 m @ 0.64 g/t Au from 90 m in DDHMA2 |
Welcome Fault | No | Yes | Yes | 1 Hole | 4.1 m @ 2.37 g/t Au from 36.1 m in BTD002. |
Authorised for release by the Board of Directors.
CONTACT
Investors: | North American Queries: | Media: | |
QP STATEMENT
Dr Christopher Doyle (MAIG) and Dr Simon Dominy (FAusIMM CPGeo; FAIG RPGeo), are the qualified persons, as defined under National Instrument 43-101 Standards of Disclosure for Mineral Projects, responsible for, and having reviewed and approved, the technical information contained in this news release. Dr Doyle is Novo’s Exploration Manager - Victoria and Dr Dominy is a Technical Advisor to Novo.
JORC COMPLIANCE STATEMENT
2026 Exploration Target
The information in this announcement that relates to the Belltopper Exploration Target is based on information compiled by Dr Christopher Doyle, a Competent Person who is a Member of the Australasian Institute of Geoscientists (MAIG). Dr Doyle is Exploration Manager – Victoria for Novo and is a full-time employee of Novo. Dr Doyle has sufficient experience that is relevant to the style of mineralisation and type of deposit under consideration and to the activity being undertaken to qualify as a Competent Person as defined in the 2012 Edition of the “Australasian Code for Reporting of Exploration Results, Mineral Resources and Ore Reserves”. Dr Doyle consents to the inclusion in this announcement of the matters based on his information in the form and context in which it appears.
The information in this announcement that relates to the Belltopper Exploration Target is based on information compiled by Dr Simon Dominy, a Competent Person who is a Fellow of both the Australasian Institute of Geoscientists (FAIG RPGeo) and Australasian Institute of Mining and Metallurgy (FAusIMM CPGeo). Dr Dominy is a Technical Advisor contracted to Novo. Dr Dominy has sufficient experience that is relevant to the style of mineralisation and type of deposit under consideration and to the activity being undertaken to qualify as a Competent Person as defined in the 2012 Edition of the “Australasian Code for Reporting of Exploration Results, Mineral Resources and Ore Reserves”. Dr Dominy consents to the inclusion in this announcement of the matters based on his information in the form and context in which it appears.
Previous Exploration Results
The information in this news release that relates to previously reported exploration results at Novo’s Belltopper Project is extracted from the Company’s ASX announcements referred to in endnotes 2 and 6, each of which is available to view at www.asx.com.au. The Company confirms that it is not aware of any new information or data that materially affects the information included in the original market announcements and that all material assumptions and technical parameters underpinning the estimates in the market announcements continue to apply and have not materially changed. The Company confirms that the form and context in which the competent persons findings are presented have not been materially modified from the original market announcements.
FORWARD-LOOKING STATEMENTS
Some statements in this news release may contain “forward-looking statements” within the meaning of Canadian and Australian securities law and regulations. In this news release, such statements include but are not limited to planned exploration activities and the timing of such. These statements address future events and conditions and, as such, involve known and unknown risks, uncertainties and other factors which may cause the actual results, performance or achievements to be materially different from any future results, performance or achievements expressed or implied by the statements. Such factors include, without limitation, customary risks of the resource industry and the risk factors identified in Novo’s annual information form for the year ended December 31, 2024 (which is available under Novo’s profile on SEDAR+ at www.sedarplus.ca and at www.asx.com.au) in the Company’s prospectus dated 2 August 2023 which is available at www.asx.com.au. Forward-looking statements speak only as of the date those statements are made. Except as required by applicable law, Novo assumes no obligation to update or to publicly announce the results of any change to any forward-looking statement contained or incorporated by reference herein to reflect actual results, future events or developments, changes in assumptions or changes in other factors affecting the forward-looking statements. If Novo updates any forward-looking statement(s), no inference should be drawn that the Company will make additional updates with respect to those or other forward-looking statements.
______________________
a See the following for source documents in relation to the historical gold production figures for Bendigo, Fosterville, Costerfield, Castlemaine and Ballarat. Wilson, C. J. L., Moore, D. H., Vollgger, S. A., & Madeley, H. E. (2020). Structural evolution of the orogenic gold deposits in central Victoria, Australia: The role of regional stress change and the tectonic regime. Ore Geology Reviews, 120, 103390. Phillips, G. N., & Hughes, M. J. (1996). The geology and gold deposits of the Victorian gold province. Ore Geology Reviews, 11(5), 255-302. Costerfield Operation, Victoria, Australia, NI 43-101 Technical Report, March 2024; Agnico Eagle Mines Detailed Mineral Reserve and Mineral Resources Statement (as at December 31, 2023). Agnico Eagle Mines Limited. Fosterville Gold Mine. Retrieved August 21, 2024, from Agnico Eagle Website. For Comet and Sunday Creek exploration results, refer: Great Pacific Gold (TSXV:GPAC) Company TSXV release dated 11 January 2024, and Southern Cross Gold (ASX:SXG) Company ASX release dated 5 March 2024, respectively. Production figures for Bendigo, Castlemaine and Ballarat include combined alluvial and hard rock production. Gold endowment for Fosterville include historic production + reserves + resources as at 31/12/2023. Gold endowment for Costerfield equals historic production + resource (including reserves) as at 28/03/2024. Novo has not conducted data verification (as that term is defined in National Instrument 43-101 Standards of Disclosure for Mineral Projects and JORC 2012) in respect of the data set out in Figure 1 and therefore is not to be regarded as reporting, adopting or endorsing those results/figures. No assurance can be given that Novo will achieve similar results at Belltopper.
b Refer to Novo’s news release dated 25 September 2024 – Belltopper mineralisation modelling defines prospectivity
c Reported as metal accumulation, which is the product of width (m) and grade (g/t Au) with the units of m.g/t Au.
d Refer to Novo’s news release dated 3 June 2024 – Significant results from diamond drilling at Belltopper, Victoria
ABOUT NOVO
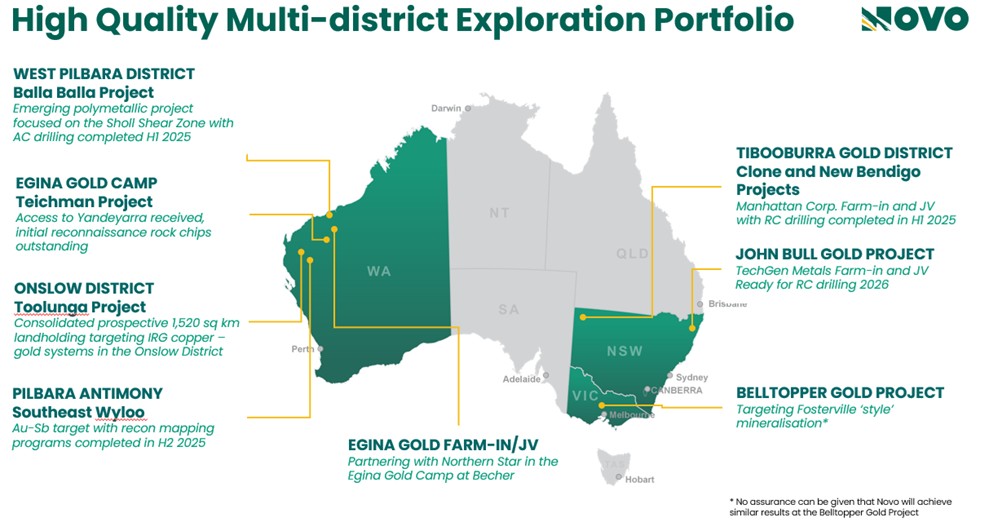
Novo is an Australian based gold explorer listed on the ASX and the TSX focussed on discovering standalone gold and copper projects with > 1 Moz development potential. Novo is an innovative explorer with a significant land package covering approximately 4,160 square kilometres in the Pilbara region of Western Australia, along with the 22 square kilometre Belltopper Gold Project in the Bendigo Tectonic Zone of Victoria. In addition to the above, Novo is part of two prospective farm in agreements in New South Wales.
Novo’s key project area in the Pilbara is the Egina Gold Camp, where Northern Star Resources Limited is farming-in to form a JV at the Becher Project and surrounding tenements through exploration expenditure of A$25 million for a 50% interest. The Becher Project has similar geological characteristics to Northern Star’s 13.6 Moz Hemi Project#. Novo is also advancing gold exploration south of Becher at the Teichman Project in the Egina Gold Camp, part of the Croydon JV (Novo 70%: Creasy Group 30%). Novo continues to undertake early-stage exploration elsewhere across its Pilbara tenement portfolio.
Novo has also formed a lithium joint venture with SQM in the Pilbara which provides shareholder exposure to battery metals.
Novo has strengthened its high-quality, Australian based exploration portfolio by adding the TechGen John Bull Gold Project in the New England Orogen of NSW, and Manhattan Corp. Limited Tibooburra Gold Project in the Albert Goldfields in northwestern NSW. Both projects demonstrate prospectivity for significant discovery and resource definition and align with Novo’s strategy of identifying and exploring projects with > 1 Moz Au potential. These high-grade gold projects compliment the landholding consolidation that forms the Toolunga Project in the Onslow District in Western Australia.
Novo has a significant investment portfolio and a disciplined program in place to identify value accretive opportunities that will build further value for shareholders.
Please refer to Novo’s website for further information including the latest corporate presentation.
#Refer to De Grey’s ASX Announcement, Hemi Gold Project mineral Resource Estimate (MRE) 2024, dated 14 November 2024. No assurance can be given that a similar (or any) commercially viable mineral deposit will be determined at Novo’s Becher Project.
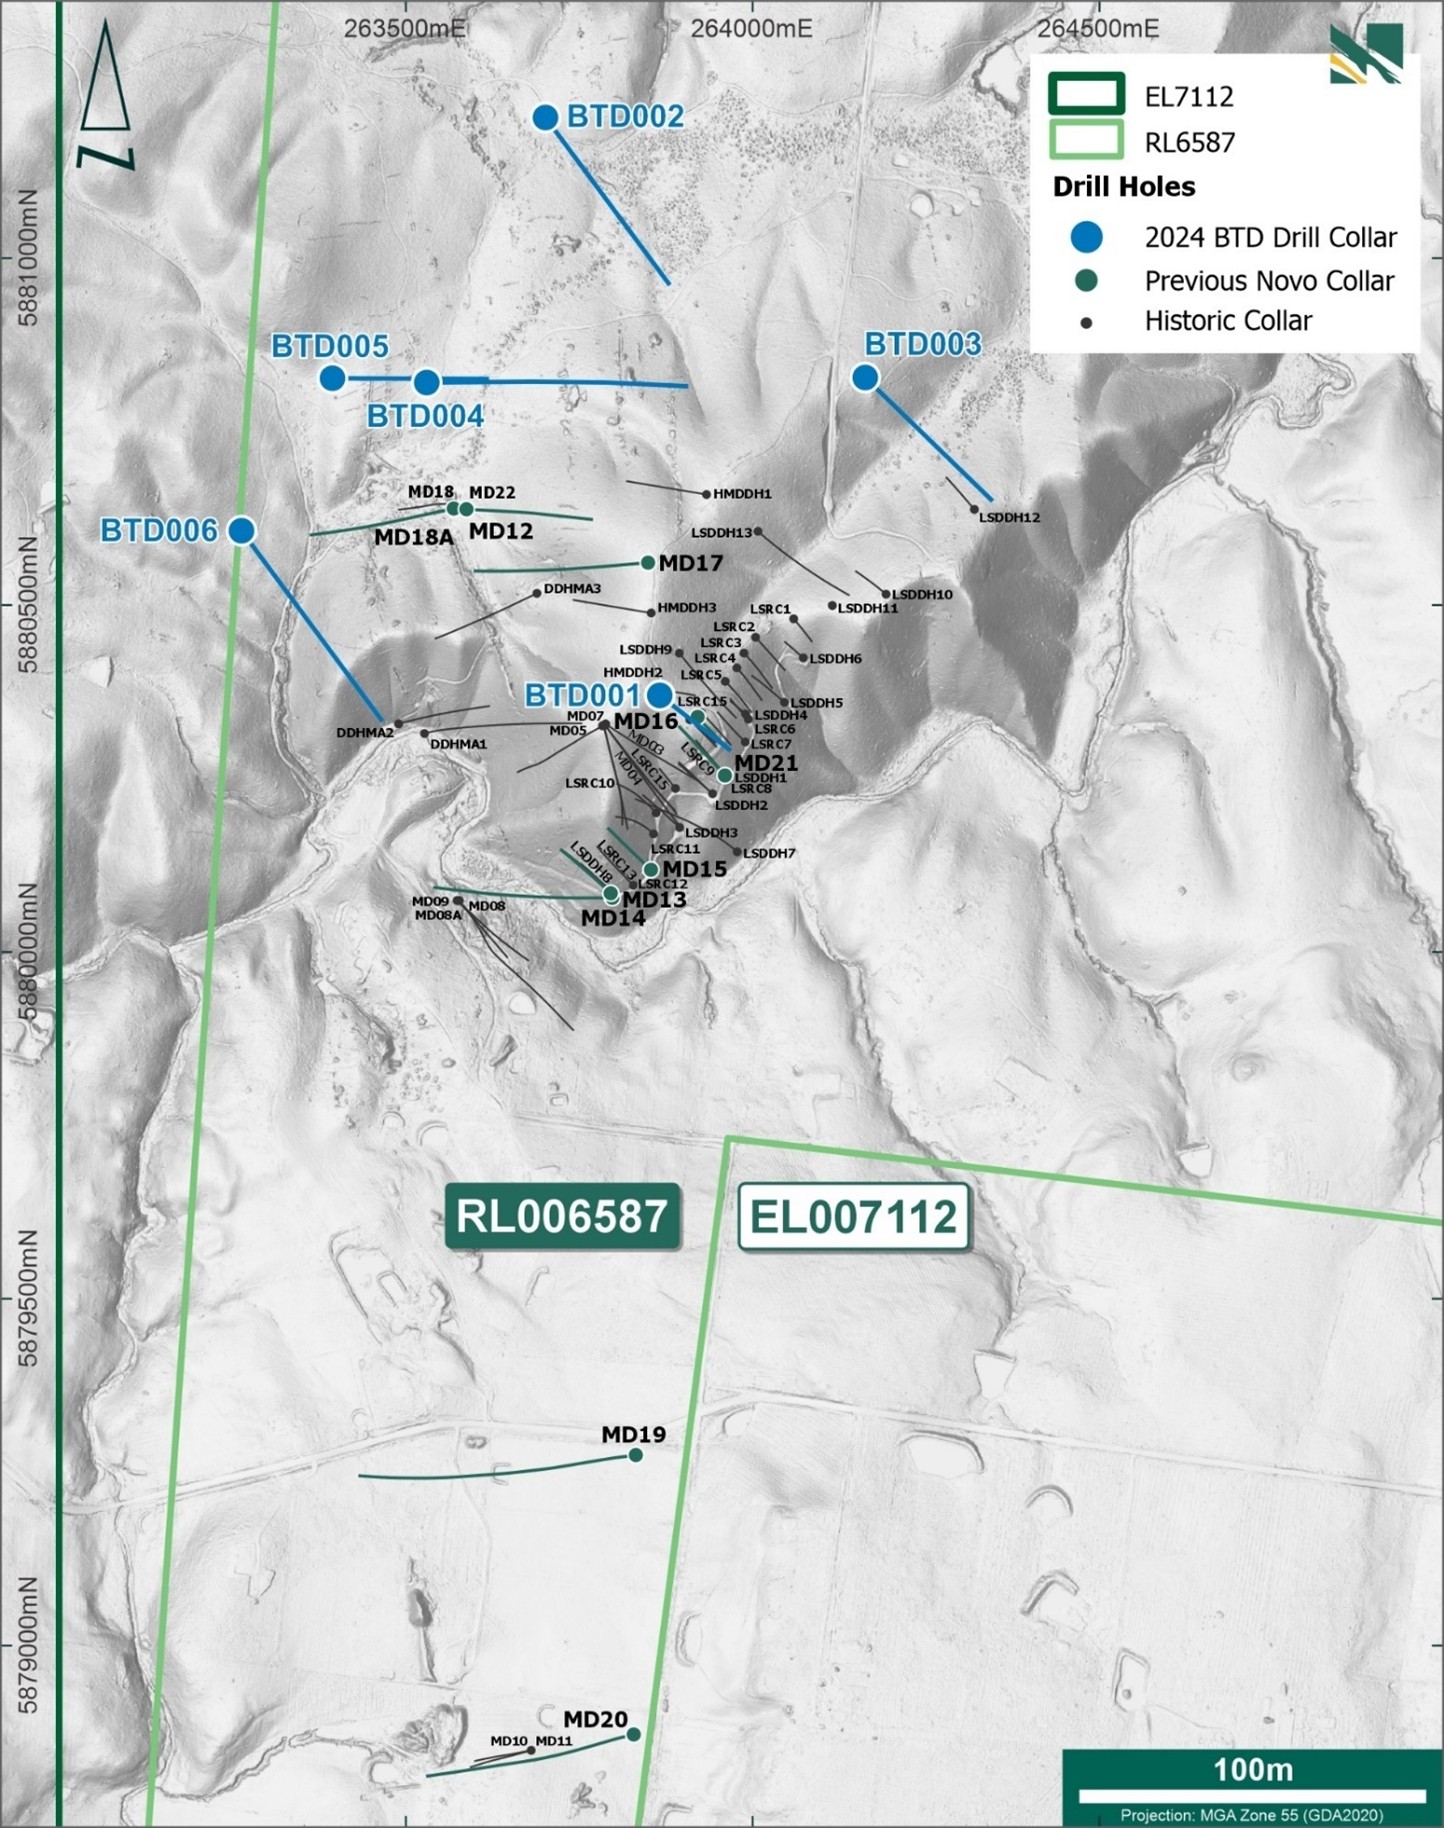
APPENDIX 1: BELLTOPPER DRILL COLLARS
Hole ID | Hole Type | Depth | Easting | Northing | RL AHD (m) | Collar Dip (°) | Collar | Collar Azimuth (Mag) (°) | Company | Date completed |
BTD001 | DD | 323.7 | 263866.02 | 5880369.85 | 524.18 | -66 | 128.484 | 118.984 | NOVO | 28-Nov-23 |
BTD002 | DD | 594 | 263701.31 | 5881202.77 | 457.18 | -60 | 145.117 | 135.617 | NOVO | 21-Dec-23 |
BTD003 | DD | 389.7 | 264162.29 | 5880827.97 | 489.97 | -51.05 | 135.07 | 125.57 | NOVO | 18-Jan-24 |
BTD004 | DD | 521 | 263530.06 | 5880820.71 | 471.69 | -45 | 90.23 | 80.73 | NOVO | 08-Feb-24 |
BTD005 | DD | 299.9 | 263394.65 | 5880825.96 | 471.94 | -50 | 90.495 | 80.995 | NOVO | 19-Feb-24 |
BTD006 | DD | 400.6 | 263263.53 | 5880606.13 | 470.22 | -37.88 | 144.53 | 135.03 | NOVO | 08-Jan-87 |
MD01 | DD | 352.2 | 263787.47 | 5880326.69 | 526.36 | -57 | 144.5 | 135 | GBM | 20-Dec-07 |
MD02 | DD | 262 | 263787.42 | 5880326.77 | 526.39 | -50 | 144.5 | 135 | GBM | 10-Jan-08 |
MD03 | DD | 478.5 | 263787.36 | 5880326.85 | 526.39 | -65 | 144.5 | 135 | GBM | 01-Nov-08 |
MD04 | DD | 255 | 263788.00 | 5880328.62 | 526.37 | -51.5 | 124.5 | 115 | GBM | 26-Jan-08 |
MD05 | DD | 266.9 | 263785.35 | 5880325.81 | 526.34 | -50 | 166.5 | 157 | GBM | 08-Feb-08 |
MD06A | DD | 426.8 | 263785.10 | 5880326.89 | 526.36 | -66 | 165.5 | 156 | GBM | 24-Feb-08 |
MD07 | DD | 249 | 263783.43 | 5880326.00 | 526.32 | -55.5 | 239.5 | 230 | GBM | 03-Mar-08 |
MD08 | DD | 241.2 | 263575.14 | 5880074.01 | 434.02 | -54.9 | 134.7 | 125.2 | GBM | 09-Apr-08 |
MD08A | DD | 450.3 | 263574.36 | 5880074.15 | 434.05 | -55.5 | 134.5 | 125 | GBM | 02-May-08 |
MD09 | DD | 259.8 | 263573.87 | 5880074.24 | 434.07 | -65.9 | 134.5 | 125 | GBM | 12-May-08 |
MD10 | DD | 191.3 | 263680.28 | 5878848.91 | 475.87 | -60 | 254.5 | 245 | GBM | 25-May-08 |
MD11 | DD | 261 | 263680.66 | 5878849.04 | 475.87 | -70 | 259.3 | 249.8 | GBM | 05-Jun-08 |
MD12 | DD | 999.8 | 263587.00 | 5880641.00 | 471.52 | -85.5 | 279.5 | 270 | GBM | 17-Mar-10 |
MD13 | DD | 112.4 | 263795.58 | 5880084.40 | 457.50 | -30 | 315 | 305.5 | GBM | 23-Dec-21 |
MD14 | DD | 365.5 | 263797.55 | 5880078.04 | 456.24 | -50 | 270 | 260.5 | GBM | 24-Jan-22 |
MD15 | DD | 131.2 | 263853.37 | 5880118.38 | 452.71 | -50 | 315 | 305.5 | GBM | 03-Feb-22 |
MD16 | DD | 204 | 263921.11 | 5880337.81 | 518.16 | -73 | 135 | 125.5 | GBM | 15-Feb-22 |
MD17 | DD | 380 | 263849.25 | 5880561.10 | 523.92 | -50 | 265 | 255.5 | GBM | 09-Mar-22 |
MD18 | DD | 320 | 263569.06 | 5880639.13 | 470.11 | -50 | 260 | 250.5 | GBM | 29-Mar-22 |
MD18A | DD | 35 | 263569.46 | 5880639.23 | 470.13 | -50 | 260 | 250.5 | GBM | 30-Mar-22 |
MD19 | DD | 553.9 | 263831.60 | 5879274.76 | 472.01 | -50 | 260 | 250.5 | GBM | 03-May-22 |
MD20 | DD | 551.4 | 263828.50 | 5878871.91 | 477.38 | -58 | 260 | 250.5 | GBM | 07-Jun-22 |
MD21 | DD | 255.5 | 263959.98 | 5880254.29 | 481.10 | -68.4 | 318.6 | 309.1 | GBM | 27-Jun-22 |
MD22 | DD | 252.8 | 263587.28 | 5880638.16 | 471.78 | -45.9 | 93.9 | 84.4 | GBM | 10-Jul-22 |
LSRC1 | RC | 87 | 264059.03 | 5880480.22 | 492.41 | -60 | 135.5 | 126 | Eureka | 20-Aug-94 |
LSRC2 | RC | 111 | 264004.09 | 5880453.50 | 495.34 | -55 | 135.5 | 126 | Eureka | 22-Aug-94 |
LSRC3 | RC | 111 | 263987.44 | 5880430.88 | 498.14 | -55 | 135.5 | 126 | Eureka | 26-Aug-94 |
LSRC4 | RC | 110 | 263977.25 | 5880409.48 | 501.61 | -55 | 135.5 | 126 | Eureka | 27-Aug-94 |
LSRC5 | RC | 110 | 263960.40 | 5880390.00 | 507.44 | -55 | 135.5 | 126 | Eureka | 28-Aug-94 |
LSRC6 | RC | 70 | 263993.79 | 5880335.47 | 496.58 | -56 | 315.5 | 306 | Eureka | 29-Aug-94 |
LSRC7 | RC | 105 | 263989.42 | 5880302.66 | 491.44 | -55 | 315.5 | 306 | Eureka | 29-Aug-94 |
LSRC8 | RC | 112 | 263960.64 | 5880254.82 | 481.32 | -55 | 315.5 | 306 | Eureka | 30-Aug-94 |
LSRC9 | RC | 73 | 263888.69 | 5880235.61 | 474.55 | -60 | 315.5 | 306 | Eureka | 01-Sep-94 |
LSRC10 | RC | 112 | 263860.81 | 5880200.34 | 469.75 | -55 | 315.5 | 306 | Eureka | 04-Sep-94 |
LSRC11 | RC | 96 | 263857.09 | 5880170.10 | 463.53 | -55 | 315.5 | 306 | Eureka | 05-Sep-94 |
LSRC12 | RC | 82 | 263852.64 | 5880119.70 | 452.86 | -50 | 315.5 | 306 | Eureka | 07-Sep-94 |
LSRC13 | RC | 118 | 263828.12 | 5880095.91 | 454.24 | -50 | 315.5 | 306 | Eureka | 08-Sep-94 |
LSRC14 | RC | 100 | 263798.14 | 5880084.18 | 456.59 | -50 | 315.5 | 306 | Eureka | 09-Sep-94 |
LSRC15 | RC | 100 | 263926.07 | 5880344.94 | 517.80 | -50 | 135.5 | 126 | Eureka | 11-Sep-94 |
LSRC16/D14 | RC/DD | 101.1 | 263908.39 | 5880335.61 | 518.96 | -60 | 135.5 | 126 | Eureka | 23-Sep-94 |
LSRC17/D15 | RC/DD | 84 | 263909.51 | 5880334.60 | 518.75 | -50 | 135.5 | 126 | Eureka | 03-Oct-94 |
HMDDH1 | DD | 180.7 | 263933.48 | 5880659.32 | 512.75 | -50 | 279.5 | 270 | Pittson | 16-Dec-91 |
HMDDH2 | DD | 70 | 263872.24 | 5880377.30 | 523.19 | -50 | 99.5 | 90 | Pittson | 22-Dec-91 |
HMDDH3 | DD | 176.5 | 263853.66 | 5880488.54 | 526.55 | -50 | 279.5 | 270 | Pittson | 31-Dec-91 |
LSDDH1 | DD | 100.6 | 263942.09 | 5880228.14 | 474.18 | -50 | 311.5 | 302 | Pittson | 01-May-90 |
LSDDH2 | DD | 162.4 | 263942.09 | 5880228.14 | 474.18 | -65 | 311.5 | 302 | Pittson | 09-May-90 |
LSDDH3 | DD | 110.4 | 263894.70 | 5880179.43 | 450.94 | -50 | 311.5 | 302 | Pittson | 13-May-90 |
LSDDH4 | DD | 49.5 | 263989.89 | 5880343.02 | 500.13 | -55 | 311.5 | 302 | Pittson | 15-May-90 |
LSDDH5 | DD | 140.7 | 264045.76 | 5880359.72 | 473.23 | -65 | 311.5 | 302 | Pittson | 18-May-90 |
LSDDH6 | DD | 60.5 | 264073.00 | 5880423.93 | 476.30 | -55 | 311.5 | 302 | Pittson | 19-May-90 |
LSDDH7 | DD | 333 | 263977.71 | 5880144.28 | 431.21 | -60 | 311.5 | 302 | Pittson | 03-May-91 |
LSDDH8 | DD | 199 | 263799.51 | 5880084.94 | 457.06 | -62 | 311.5 | 302 | Pittson | 12-May-91 |
LSDDH9 | DD | 201 | 263894.14 | 5880430.78 | 517.00 | -50 | 141.5 | 132 | Pittson | 18-May-91 |
LSDDH10 | DD | 98.5 | 264192.32 | 5880515.60 | 501.26 | -55 | 310.5 | 301 | Pittson | 23-May-91 |
LSDDH11 | DD | 9 | 264114.83 | 5880499.34 | 496.16 | -52.5 | 303.5 | 294 | Pittson | 23-May-91 |
LSDDH12 | DD | 106.2 | 264319.66 | 5880637.86 | 487.26 | -55 | 319.5 | 310 | Pittson | 28-May-91 |
LSDDH13 | DD | 247.8 | 264007.53 | 5880606.35 | 499.33 | -50 | 131.5 | 122 | Pittson | 08-Jun-91 |
DDHMA1 | DD | 298.6 | 263526.83 | 5880314.86 | 431.11 | -45 | 74.5 | 65 | Molopo | 18-Jan-87 |
DDHMA2 | DD | 182.3 | 263489.40 | 5880328.73 | 433.31 | -45 | 74.5 | 65 | Molopo | 28-Jan-87 |
DDHMA3 | DD | 260.65 | 263688.97 | 5880516.92 | 499.41 | -53 | 244.5 | 235 | Molopo | 11-Feb-87 |
All drill collars are reported in MGA94 Zone 55. All collars are located within Retention Licence RL006587
APPENDIX 2: BELLTOPPER DRILL COLLAR MAP
APPENDIX 3: BELLTOPPER SIGNIFICANT INTERSECTIONS
Standard Intercepts calculated with 0.3 g/t Au cut-off and 2 m internal dilution. High grade included intercepts calculated with 1.0 g/t Au and no internal dilution.
Broad granite intrusive intersections in MD17, MD22 and DDHMA3 were calculated using a 0.1 g/t Au cut-off grade and no more than 5 m internal dilution. Intersections are identified with “*Granite” in the below table.
^ All width and intercepts are expressed as metres downhole rather than true width. Calculated as length weighted averages.
^^ Au g/t multiplied by metres (m.g/t Au)
Logged core loss treated as 0 g/t Au grade in all calculations. The gold assay of a primary sample from a duplicate pair will be used in all calculations. Any isolated gold intersections separated by internal dilution must independently be above the average cut-off grade when including the grades of the internal dilution.
Significant intersections > 2 m.g/t Au with high grade includes > 5 m.g/t Au
Drill Hole | Including | From (m) | To (m) | Interval (m) ^ | Au (g/t) | Au m.g/t ^^ | Intersection |
BTD001 | 219.80 | 225.40 | 5.60 | 3.14 | 17.6 | 5.60 m @ 3.14 g/t Au from 219.8 m | |
BTD001 | inc. | 222.36 | 225.40 | 3.04 | 4.97 | 15.1 | 3.04 m @ 4.97 g/t Au from 222.36 m |
BTD001 | 230.00 | 231.94 | 1.94 | 2.37 | 4.6 | 1.94 m @ 2.37 g/t Au from 230 m | |
BTD001 | 241.30 | 244.30 | 3.00 | 1.16 | 3.5 | 3.00 m @ 1.16 g/t Au from 241.3 m | |
BTD001 | 274.75 | 279.00 | 4.25 | 5.88 | 25.0 | 4.25 m @ 5.88 g/t Au from 274.75 m | |
BTD001 | inc. | 277.00 | 279.00 | 2.00 | 11.15 | 22.3 | 2.00 m @ 11.15 g/t Au from 277 m |
BTD002 | 36.10 | 40.20 | 4.10 | 2.37 | 9.7 | 4.10 m @ 2.37 g/t Au from 36.1 m | |
BTD002 | 216.00 | 235.15 | 19.15 | 0.68 | 13.0 | 19.15 m @ 0.68 g/t Au from 216 m | |
BTD003 | 168.40 | 177.60 | 9.20 | 0.67 | 6.2 | 9.20 m @ 0.67 g/t Au from 168.4 m | |
BTD003 | 192.45 | 196.45 | 4.00 | 0.50 | 2.0 | 4.00 m @ 0.50 g/t Au from 192.45 m | |
BTD003 | 318.41 | 321.41 | 3.00 | 1.00 | 3.0 | 3.00 m @ 1.00 g/t Au from 318.41 m | |
BTD004 | 9.00 | 11.00 | 2.00 | 15.18 | 30.4 | 2.00 m @ 15.18 g/t Au from 9 m | |
BTD004 | 90.58 | 92.00 | 1.42 | 1.61 | 2.3 | 1.42 m @ 1.61 g/t Au from 90.58 m | |
BTD004 | 136.87 | 138.67 | 1.80 | 1.29 | 2.3 | 1.80 m @ 1.29 g/t Au from 136.87 m | |
BTD005 | 1.10 | 5.90 | 4.80 | 0.78 | 3.8 | 4.80 m @ 0.78 g/t Au from 1.1 m | |
BTD005 | 145.33 | 147.20 | 1.87 | 1.17 | 2.2 | 1.87 m @ 1.17 g/t Au from 145.33 m | |
BTD005 | 164.11 | 167.28 | 3.17 | 1.07 | 3.4 | 3.17 m @ 1.07 g/t Au from 164.11 m | |
BTD005 | 185.00 | 197.26 | 12.26 | 1.45 | 17.7 | 12.26 m @ 1.45 g/t Au from 185 m | |
BTD005 | inc. | 185.00 | 189.60 | 4.60 | 2.64 | 12.1 | 4.60 m @ 2.64 g/t Au from 185 m |
BTD005 | 290.90 | 297.70 | 6.80 | 0.98 | 6.7 | 6.80 m @ 0.98 g/t Au from 290.9 m | |
BTD006 | 163.38 | 165.06 | 1.68 | 2.18 | 3.7 | 1.68 m @ 2.18 g/t Au from 163.38 m | |
BTD006 | 179.00 | 186.00 | 7.00 | 1.88 | 13.1 | 7.00 m @ 1.88 g/t Au from 179 m | |
BTD006 | inc. | 182.81 | 186.00 | 3.19 | 3.42 | 10.9 | 3.19 m @ 3.42 g/t Au from 182.81 m |
BTD006 | 296.42 | 298.18 | 1.76 | 1.17 | 2.1 | 1.76 m @ 1.17 g/t Au from 296.42 m | |
MD01 | 29.00 | 35.00 | 6.00 | 0.49 | 3.0 | 6.00 m @ 0.49 g/t Au from 29 m | |
MD01 | 93.50 | 95.40 | 1.90 | 2.21 | 4.2 | 1.90 m @ 2.21 g/t Au from 93.5 m | |
MD01 | 262.00 | 267.95 | 5.95 | 6.48 | 38.6 | 5.95 m @ 6.48 g/t Au from 262 m | |
MD01 | inc. | 263.00 | 266.91 | 3.91 | 9.52 | 37.2 | 3.91 m @ 9.52 g/t Au from 263 m |
MD01 | 330.60 | 333.00 | 2.40 | 0.90 | 2.2 | 2.40 m @ 0.90 g/t Au from 330.6 m | |
MD02 | 190.00 | 191.00 | 1.00 | 2.49 | 2.5 | 1.00 m @ 2.49 g/t Au from 190 m | |
MD03 | 14.00 | 19.00 | 5.00 | 0.55 | 2.7 | 5.00 m @ 0.55 g/t Au from 14 m | |
MD03 | 45.00 | 47.00 | 2.00 | 1.80 | 3.6 | 2.00 m @ 1.80 g/t Au from 45 m | |
MD03 | 202.50 | 207.00 | 4.50 | 0.86 | 3.9 | 4.50 m @ 0.86 g/t Au from 202.5 m | |
MD03 | 450.00 | 455.00 | 5.00 | 0.59 | 3.0 | 5.00 m @ 0.59 g/t Au from 450 m | |
MD04 | 43.00 | 45.00 | 2.00 | 3.87 | 7.7 | 2.00 m @ 3.87 g/t Au from 43 m | |
MD04 | inc. | 43.00 | 44.00 | 1.00 | 6.92 | 6.9 | 1.00 m @ 6.92 g/t Au from 43 m |
MD04 | 52.00 | 54.00 | 2.00 | 7.19 | 14.4 | 2.00 m @ 7.19 g/t Au from 52 m | |
MD04 | inc. | 52.00 | 53.15 | 1.15 | 12.01 | 13.8 | 1.15 m @ 12.01 g/t Au from 52 m |
MD04 | 206.50 | 209.00 | 2.50 | 1.01 | 2.5 | 2.50 m @ 1.01 g/t Au from 206.5 m | |
MD05 | 217.00 | 218.00 | 1.00 | 3.65 | 3.7 | 1.00 m @ 3.65 g/t Au from 217 m | |
MD06A | 36.00 | 39.10 | 3.10 | 3.29 | 10.2 | 3.10 m @ 3.29 g/t Au from 36 m | |
MD06A | inc. | 37.30 | 38.60 | 1.30 | 7.26 | 9.4 | 1.30 m @ 7.26 g/t Au from 37.3 m |
MD06A | 420.00 | 425.50 | 5.50 | 0.70 | 3.9 | 5.50 m @ 0.70 g/t Au from 420 m | |
MD07 | 25.00 | 30.00 | 5.00 | 0.69 | 3.4 | 5.00 m @ 0.69 g/t Au from 25 m | |
MD07 | 78.90 | 81.00 | 2.10 | 3.82 | 8.0 | 2.10 m @ 3.82 g/t Au from 78.9 m | |
MD07 | inc. | 79.30 | 79.90 | 0.60 | 9.74 | 5.8 | 0.60 m @ 9.74 g/t Au from 79.3 m |
MD07 | 154.00 | 155.60 | 1.60 | 1.22 | 2.0 | 1.60 m @ 1.22 g/t Au from 154 m | |
MD07 | 238.00 | 241.50 | 3.50 | 0.69 | 2.4 | 3.50 m @ 0.69 g/t Au from 238 m | |
MD08A | 123.00 | 125.00 | 2.00 | 1.60 | 3.2 | 2.00 m @ 1.60 g/t Au from 123 m | |
MD08A | 266.20 | 270.60 | 4.40 | 1.18 | 5.2 | 4.40 m @ 1.18 g/t Au from 266.2 m | |
MD08A | 352.00 | 358.00 | 6.00 | 1.58 | 9.5 | 6.00 m @ 1.58 g/t Au from 352 m | |
MD08A | inc. | 354.00 | 358.00 | 4.00 | 1.80 | 7.2 | 4.00 m @ 1.80 g/t Au from 354 m |
MD08A | 364.00 | 365.00 | 1.00 | 1.95 | 2.0 | 1.00 m @ 1.95 g/t Au from 364 m | |
MD08A | 373.40 | 376.00 | 2.60 | 0.93 | 2.4 | 2.60 m @ 0.93 g/t Au from 373.4 m | |
MD11 | 240.00 | 244.30 | 4.30 | 1.49 | 6.4 | 4.30 m @ 1.49 g/t Au from 240 m | |
MD11 | inc. | 241.60 | 243.70 | 2.10 | 2.53 | 5.3 | 2.10 m @ 2.53 g/t Au from 241.6 m |
MD12 | 104.30 | 105.80 | 1.50 | 1.41 | 2.1 | 1.50 m @ 1.41 g/t Au from 104.3 m | |
MD12 | 221.00 | 230.00 | 9.00 | 0.55 | 4.9 | 9.00 m @ 0.55 g/t Au from 221 m | |
MD12 | 362.50 | 365.30 | 2.80 | 0.90 | 2.5 | 2.80 m @ 0.90 g/t Au from 362.5 m | |
MD12 | 712.10 | 717.00 | 4.90 | 1.34 | 6.6 | 4.90 m @ 1.34 g/t Au from 712.1 m | |
MD12 | 948.30 | 951.20 | 2.90 | 1.51 | 4.4 | 2.90 m @ 1.51 g/t Au from 948.3 m | |
MD13 | 32.20 | 40.00 | 7.80 | 3.58 | 27.9 | 7.80 m @ 3.58 g/t Au from 32.2 m | |
MD13 | inc. | 34.15 | 36.00 | 1.85 | 12.45 | 23.0 | 1.85 m @ 12.45 g/t Au from 34.15 m |
MD13 | 62.80 | 63.30 | 0.50 | 4.90 | 2.5 | 0.50 m @ 4.90 g/t Au from 62.8 m | |
MD13 | 70.80 | 75.40 | 4.60 | 0.65 | 3.0 | 4.60 m @ 0.65 g/t Au from 70.8 m | |
MD13 | 80.00 | 84.00 | 4.00 | 2.87 | 11.5 | 4.00 m @ 2.87 g/t Au from 80 m | |
MD13 | inc. | 81.20 | 81.60 | 0.40 | 24.40 | 9.8 | 0.40 m @ 24.40 g/t Au from 81.2 m |
MD14 | 41.80 | 43.50 | 1.70 | 1.74 | 3.0 | 1.70 m @ 1.74 g/t Au from 41.8 m | |
MD14 | 65.40 | 74.45 | 9.05 | 2.36 | 21.3 | 9.05 m @ 2.36 g/t Au from 65.4 m | |
MD14 | inc. | 70.40 | 72.90 | 2.50 | 5.86 | 14.7 | 2.50 m @ 5.86 g/t Au from 70.4 m |
MD14 | 168.50 | 177.20 | 8.70 | 0.49 | 4.3 | 8.70 m @ 0.49 g/t Au from 168.5 m | |
MD15 | 87.00 | 94.75 | 7.75 | 2.83 | 21.9 | 7.75 m @ 2.83 g/t Au from 87 m | |
MD15 | inc. | 89.90 | 91.00 | 1.10 | 7.38 | 8.1 | 1.10 m @ 7.38 g/t Au from 89.9 m |
MD15 | inc. | 92.00 | 94.15 | 2.15 | 5.33 | 11.5 | 2.15 m @ 5.33 g/t Au from 92 m |
MD15 | 104.00 | 109.00 | 5.00 | 0.58 | 2.9 | 5.00 m @ 0.58 g/t Au from 104 m | |
MD15 | 120.00 | 122.00 | 2.00 | 1.01 | 2.0 | 2.00 m @ 1.01 g/t Au from 120 m | |
MD16 | 6.00 | 9.50 | 3.50 | 0.70 | 2.5 | 3.50 m @ 0.70 g/t Au from 6 m | |
MD16 | 73.00 | 79.80 | 6.80 | 2.51 | 17.1 | 6.80 m @ 2.51 g/t Au from 73 m | |
MD16 | inc. | 73.60 | 74.90 | 1.30 | 5.60 | 7.3 | 1.30 m @ 5.60 g/t Au from 73.6 m |
MD16 | inc. | 75.70 | 76.60 | 0.90 | 8.69 | 7.8 | 0.90 m @ 8.69 g/t Au from 75.7 m |
MD16 | 82.80 | 96.00 | 13.20 | 0.52 | 6.9 | 13.20 m @ 0.52 g/t Au from 82.8 m | |
MD16 | 120.00 | 134.00 | 14.00 | 6.15 | 86.0 | 14.00 m @ 6.15 g/t Au from 120 m | |
MD16 | inc. | 121.90 | 129.50 | 7.60 | 6.66 | 50.6 | 7.60 m @ 6.66 g/t Au from 121.9 m |
MD16 | inc. | 131.00 | 134.00 | 3.00 | 11.06 | 33.2 | 3.00 m @ 11.06 g/t Au from 131 m |
MD16 | 137.60 | 140.60 | 3.00 | 5.28 | 15.9 | 3.00 m @ 5.28 g/t Au from 137.6 m | |
MD16 | 173.00 | 183.00 | 10.00 | 4.91 | 49.1 | 10.00 m @ 4.91 g/t Au from 173 m | |
MD16 | inc. | 175.00 | 182.00 | 7.00 | 6.76 | 47.3 | 7.00 m @ 6.76 g/t Au from 175 m |
MD16 | 188.00 | 192.00 | 4.00 | 8.65 | 34.6 | 4.00 m @ 8.65 g/t Au from 188 m | |
MD16 | 196.50 | 198.00 | 1.50 | 2.99 | 4.5 | 1.50 m @ 2.99 g/t Au from 196.5 m | |
MD17 | 102.65 | 103.60 | 0.95 | 10.01 | 9.5 | 0.95 m @ 10.01 g/t Au from 102.65 m | |
MD17 | inc. | 102.65 | 103.40 | 0.75 | 12.50 | 9.4 | 0.75 m @ 12.50 g/t Au from 102.65 m |
MD17 | 168.20 | 168.40 | 0.20 | 12.90 | 2.6 | 0.20 m @ 12.90 g/t Au from 168.2 m | |
MD17 *Granite | 197.00 | 276.85 | 79.85 | 0.26 | 20.9 | 79.85 m @ 0.26 g/t Au from 197 m | |
MD18 | 24.00 | 28.90 | 4.90 | 0.78 | 3.8 | 4.90 m @ 0.78 g/t Au from 24 m | |
MD18A | 25.45 | 30.10 | 4.65 | 0.73 | 3.4 | 4.65 m @ 0.73 g/t Au from 25.45 m | |
MD19 | 176.80 | 178.10 | 1.30 | 1.66 | 2.2 | 1.30 m @ 1.66 g/t Au from 176.8 m | |
MD19 | 257.00 | 266.00 | 9.00 | 1.10 | 9.9 | 9.00 m @ 1.10 g/t Au from 257 m | |
MD19 | 423.30 | 425.10 | 1.80 | 1.29 | 2.3 | 1.80 m @ 1.29 g/t Au from 423.3 m | |
MD20 | 400.90 | 404.00 | 3.10 | 9.27 | 28.7 | 3.10 m @ 9.27 g/t Au from 400.9 m | |
MD20 | inc. | 400.90 | 403.24 | 2.34 | 12.01 | 28.1 | 2.34 m @ 12.01 g/t Au from 400.9 m |
MD21 | 105.00 | 106.50 | 1.50 | 2.53 | 3.8 | 1.50 m @ 2.53 g/t Au from 105 m | |
MD21 | 131.90 | 140.00 | 8.10 | 5.79 | 46.9 | 8.10 m @ 5.79 g/t Au from 131.9 m | |
MD21 | inc. | 131.90 | 136.00 | 4.10 | 3.11 | 12.7 | 4.10 m @ 3.11 g/t Au from 131.9 m |
MD21 | inc. | 137.00 | 140.00 | 3.00 | 11.29 | 33.9 | 3.00 m @ 11.29 g/t Au from 137 m |
MD21 | 144.60 | 150.80 | 6.20 | 3.92 | 24.3 | 6.20 m @ 3.92 g/t Au from 144.6 m | |
MD21 | inc. | 147.00 | 148.70 | 1.70 | 4.86 | 8.3 | 1.70 m @ 4.86 g/t Au from 147 m |
MD21 | inc. | 149.30 | 150.80 | 1.50 | 8.57 | 12.9 | 1.50 m @ 8.57 g/t Au from 149.3 m |
MD22 | 87.60 | 88.80 | 1.20 | 3.81 | 4.6 | 1.20 m @ 3.81 g/t Au from 87.6 m | |
MD22 | 122.40 | 126.50 | 4.10 | 1.38 | 5.7 | 4.10 m @ 1.38 g/t Au from 122.4 m | |
MD22 | 134.00 | 179.00 | 45.00 | 0.23 | 10.4 | 45.00 m @ 0.23 g/t Au from 134 m | |
LSDDH1 | 31.00 | 38.50 | 7.50 | 0.38 | 2.9 | 7.50 m @ 0.38 g/t Au from 31 m | |
LSDDH1 | 84.35 | 91.00 | 6.65 | 8.17 | 54.4 | 6.65 m @ 8.17 g/t Au from 84.35 m | |
LSDDH1 | inc. | 84.35 | 88.20 | 3.85 | 13.77 | 53.0 | 3.85 m @ 13.77 g/t Au from 84.35 m |
LSDDH1 | 95.75 | 99.75 | 4.00 | 2.10 | 8.4 | 4.00 m @ 2.10 g/t Au from 95.75 m | |
LSDDH3 | 35.75 | 42.40 | 6.65 | 0.89 | 5.9 | 6.65 m @ 0.89 g/t Au from 35.75 m | |
LSDDH4 | 0.00 | 2.70 | 2.70 | 3.13 | 8.5 | 2.70 m @ 3.13 g/t Au from 0 m | |
LSDDH4 | 28.50 | 31.20 | 2.70 | 0.81 | 2.2 | 2.70 m @ 0.81 g/t Au from 28.5 m | |
LSDDH5 | 116.80 | 119.00 | 2.20 | 1.32 | 2.9 | 2.20 m @ 1.32 g/t Au from 116.8 m | |
LSDDH6 | 27.70 | 35.40 | 7.70 | 3.12 | 24.0 | 7.70 m @ 3.12 g/t Au from 27.7 m | |
LSDDH6 | inc. | 27.70 | 32.70 | 5.00 | 3.01 | 15.0 | 5.00 m @ 3.01 g/t Au from 27.7 m |
LSDDH6 | inc. | 33.80 | 35.40 | 1.60 | 4.93 | 7.9 | 1.60 m @ 4.93 g/t Au from 33.8 m |
LSDDH7 | 15.30 | 17.20 | 1.90 | 1.32 | 2.5 | 1.90 m @ 1.32 g/t Au from 15.3 m | |
LSDDH7 | 196.40 | 197.40 | 1.00 | 3.41 | 3.4 | 1.00 m @ 3.41 g/t Au from 196.4 m | |
LSDDH8 | 59.00 | 62.00 | 3.00 | 1.46 | 4.4 | 3.00 m @ 1.46 g/t Au from 59 m | |
LSDDH8 | 66.30 | 70.40 | 4.10 | 13.10 | 53.7 | 4.10 m @ 13.10 g/t Au from 66.3 m | |
LSDDH9 | 177.90 | 194.70 | 16.80 | 3.13 | 52.6 | 16.80 m @ 3.13 g/t Au from 177.9 m | |
LSDDH9 | inc. | 186.10 | 188.20 | 2.10 | 4.92 | 10.3 | 2.10 m @ 4.92 g/t Au from 186.1 m |
LSDDH9 | inc. | 190.10 | 193.10 | 3.00 | 11.43 | 34.3 | 3.00 m @ 11.43 g/t Au from 190.1 m |
LSDDH13 | 168.20 | 169.40 | 1.20 | 1.71 | 2.1 | 1.20 m @ 1.71 g/t Au from 168.2 m | |
LSRC1 | 46.00 | 47.00 | 1.00 | 2.09 | 2.1 | 1.00 m @ 2.09 g/t Au from 46 m | |
LSRC2 | 77.00 | 81.00 | 4.00 | 1.13 | 4.5 | 4.00 m @ 1.13 g/t Au from 77 m | |
LSRC3 | 91.00 | 93.00 | 2.00 | 1.14 | 2.3 | 2.00 m @ 1.14 g/t Au from 91 m | |
LSRC4 | 69.00 | 70.00 | 1.00 | 2.27 | 2.3 | 1.00 m @ 2.27 g/t Au from 69 m | |
LSRC4 | 83.00 | 85.00 | 2.00 | 2.11 | 4.2 | 2.00 m @ 2.11 g/t Au from 83 m | |
LSRC5 | 79.00 | 93.00 | 14.00 | 2.81 | 39.4 | 14.00 m @ 2.81 g/t Au from 79 m | |
LSRC5 | inc. | 82.00 | 87.00 | 5.00 | 5.12 | 25.6 | 5.00 m @ 5.12 g/t Au from 82 m |
LSRC5 | inc. | 88.00 | 90.00 | 2.00 | 4.21 | 8.4 | 2.00 m @ 4.21 g/t Au from 88 m |
LSRC6 | 17.00 | 33.00 | 16.00 | 2.62 | 42.0 | 16.00 m @ 2.62 g/t Au from 17 m | |
LSRC6 | inc. | 17.00 | 18.00 | 1.00 | 5.44 | 5.4 | 1.00 m @ 5.44 g/t Au from 17 m |
LSRC6 | inc. | 29.00 | 32.00 | 3.00 | 4.16 | 12.5 | 3.00 m @ 4.16 g/t Au from 29 m |
LSRC7 | 18.00 | 20.00 | 2.00 | 3.13 | 6.3 | 2.00 m @ 3.13 g/t Au from 18 m | |
LSRC7 | inc. | 18.00 | 19.00 | 1.00 | 5.81 | 5.8 | 1.00 m @ 5.81 g/t Au from 18 m |
LSRC7 | 47.00 | 58.00 | 11.00 | 5.38 | 59.2 | 11.00 m @ 5.38 g/t Au from 47 m | |
LSRC7 | inc. | 47.00 | 52.00 | 5.00 | 10.60 | 53.0 | 5.00 m @ 10.60 g/t Au from 47 m |
LSRC7 | 81.00 | 83.00 | 2.00 | 2.91 | 5.8 | 2.00 m @ 2.91 g/t Au from 81 m | |
LSRC7 | inc. | 81.00 | 82.00 | 1.00 | 5.03 | 5.0 | 1.00 m @ 5.03 g/t Au from 81 m |
LSRC8 | 55.00 | 59.00 | 4.00 | 0.57 | 2.3 | 4.00 m @ 0.57 g/t Au from 55 m | |
LSRC8 | 93.00 | 106.00 | 13.00 | 2.44 | 31.8 | 13.00 m @ 2.44 g/t Au from 93 m | |
LSRC8 | inc. | 93.00 | 94.00 | 1.00 | 12.10 | 12.1 | 1.00 m @ 12.10 g/t Au from 93 m |
LSRC8 | inc. | 102.00 | 106.00 | 4.00 | 4.05 | 16.2 | 4.00 m @ 4.05 g/t Au from 102 m |
LSRC9 | 26.00 | 31.00 | 5.00 | 5.23 | 26.1 | 5.00 m @ 5.23 g/t Au from 26 m | |
LSRC9 | inc. | 26.00 | 30.00 | 4.00 | 6.46 | 25.8 | 4.00 m @ 6.46 g/t Au from 26 m |
LSRC9 | 48.00 | 51.00 | 3.00 | 0.99 | 3.0 | 3.00 m @ 0.99 g/t Au from 48 m | |
LSRC10 | 9.00 | 13.00 | 4.00 | 0.62 | 2.5 | 4.00 m @ 0.62 g/t Au from 9 m | |
LSRC10 | 24.00 | 28.00 | 4.00 | 3.84 | 15.4 | 4.00 m @ 3.84 g/t Au from 24 m | |
LSRC10 | inc. | 24.00 | 25.00 | 1.00 | 6.53 | 6.5 | 1.00 m @ 6.53 g/t Au from 24 m |
LSRC10 | inc. | 26.00 | 28.00 | 2.00 | 4.05 | 8.1 | 2.00 m @ 4.05 g/t Au from 26 m |
LSRC11 | 50.00 | 60.00 | 10.00 | 5.26 | 52.6 | 10.00 m @ 5.26 g/t Au from 50 m | |
LSRC11 | inc. | 50.00 | 56.00 | 6.00 | 6.17 | 37.0 | 6.00 m @ 6.17 g/t Au from 50 m |
LSRC11 | inc. | 57.00 | 60.00 | 3.00 | 5.04 | 15.1 | 3.00 m @ 5.04 g/t Au from 57 m |
LSRC12 | 49.00 | 52.00 | 3.00 | 0.99 | 3.0 | 3.00 m @ 0.99 g/t Au from 49 m | |
LSRC13 | 81.00 | 86.00 | 5.00 | 4.37 | 21.8 | 5.00 m @ 4.37 g/t Au from 81 m | |
LSRC13 | inc. | 81.00 | 85.00 | 4.00 | 5.34 | 21.3 | 4.00 m @ 5.34 g/t Au from 81 m |
LSRC14 | 51.00 | 61.00 | 10.00 | 3.57 | 35.7 | 10.00 m @ 3.57 g/t Au from 51 m | |
LSRC14 | inc. | 51.00 | 58.00 | 7.00 | 4.84 | 33.9 | 7.00 m @ 4.84 g/t Au from 51 m |
LSRC14 | 66.00 | 72.00 | 6.00 | 0.33 | 2.0 | 6.00 m @ 0.33 g/t Au from 66 m | |
LSRC14 | 76.00 | 83.00 | 7.00 | 0.32 | 2.3 | 7.00 m @ 0.32 g/t Au from 76 m | |
LSRC14 | 87.00 | 92.00 | 5.00 | 0.79 | 4.0 | 5.00 m @ 0.79 g/t Au from 87 m | |
LSRC15 | 46.00 | 47.00 | 1.00 | 8.79 | 8.8 | 1.00 m @ 8.79 g/t Au from 46 m | |
LSRC15 | 51.00 | 63.00 | 12.00 | 0.52 | 6.2 | 12.00 m @ 0.52 g/t Au from 51 m | |
LSRC15 | 66.00 | 72.00 | 6.00 | 6.30 | 37.8 | 6.00 m @ 6.30 g/t Au from 66 m | |
LSRC15 | inc. | 66.00 | 70.00 | 4.00 | 9.00 | 36.0 | 4.00 m @ 9.00 g/t Au from 66 m |
LSRC16/D14 | 62.00 | 63.80 | 1.80 | 6.00 | 10.8 | 1.80 m @ 6.00 g/t Au from 62 m | |
LSRC16/D14 | 68.60 | 72.80 | 4.20 | 3.09 | 13.0 | 4.20 m @ 3.09 g/t Au from 68.6 m | |
LSRC16/D14 | inc. | 70.10 | 72.80 | 2.70 | 4.32 | 11.7 | 2.70 m @ 4.32 g/t Au from 70.1 m |
LSRC16/D14 | 88.75 | 101.10 | 12.35 | 3.21 | 39.6 | 12.35 m @ 3.21 g/t Au from 88.75 m | |
LSRC16/D14 | inc. | 92.30 | 95.00 | 2.70 | 9.69 | 26.2 | 2.70 m @ 9.69 g/t Au from 92.3 m |
LSRC17/D15 | 49.40 | 55.05 | 5.65 | 4.85 | 27.4 | 5.65 m @ 4.85 g/t Au from 49.4 m | |
LSRC17/D15 | inc. | 50.70 | 55.05 | 4.35 | 5.61 | 24.4 | 4.35 m @ 5.61 g/t Au from 50.7 m |
LSRC17/D15 | 67.05 | 73.40 | 6.35 | 4.72 | 30.0 | 6.35 m @ 4.72 g/t Au from 67.05 m | |
LSRC17/D15 | inc. | 68.90 | 70.40 | 1.50 | 6.68 | 10.0 | 1.50 m @ 6.68 g/t Au from 68.9 m |
LSRC17/D15 | inc. | 71.00 | 73.40 | 2.40 | 7.14 | 17.1 | 2.40 m @ 7.14 g/t Au from 71 m |
HMDDH1 | 19.00 | 24.00 | 5.00 | 0.44 | 2.2 | 5.00 m @ 0.44 g/t Au from 19 m | |
HMDDH1 | 47.00 | 52.00 | 5.00 | 1.07 | 5.3 | 5.00 m @ 1.07 g/t Au from 47 m | |
HMDDH1 | 110.10 | 113.10 | 3.00 | 1.02 | 3.1 | 3.00 m @ 1.02 g/t Au from 110.1 m | |
DDHMA1 | 41.10 | 45.10 | 4.00 | 0.64 | 2.6 | 4.00 m @ 0.64 g/t Au from 41.1 m | |
DDHMA1 | 169.00 | 175.00 | 6.00 | 4.37 | 26.2 | 6.00 m @ 4.37 g/t Au from 169 m | |
DDHMA1 | inc. | 169.00 | 174.00 | 5.00 | 5.18 | 25.9 | 5.00 m @ 5.18 g/t Au from 169 m |
DDHMA2 | 90.00 | 103.00 | 13.00 | 0.64 | 8.4 | 13.00 m @ 0.64 g/t Au from 90 m | |
DDHMA3 | 18.00 | 44.00 | 26.00 | 0.44 | 11.4 | 26.00 m @ 0.44 g/t Au from 18 m |
Appendix 4. - JORC Code, 2012 Edition – Table 1 Belltopper Gold Project
Additional information is available at the following link: https://novoresources.com/wp-content/uploads/2026/02/20260206_Belltopper-Exploration-Target-Update_V8-CLN-FINAL.pdf
Photos accompanying this announcement are available at
https://www.globenewswire.com/NewsRoom/AttachmentNg/8992186c-85ec-4fe3-b331-a06f71ab1941
https://www.globenewswire.com/NewsRoom/AttachmentNg/63f34673-156a-4773-99e4-bfceda52285b
https://www.globenewswire.com/NewsRoom/AttachmentNg/aa90c341-1cb4-4aad-8835-c1e7b1133245
https://www.globenewswire.com/NewsRoom/AttachmentNg/28f80585-2d09-4044-911e-830e2d843798
https://www.globenewswire.com/NewsRoom/AttachmentNg/1d73caaa-75fe-4cd9-ac41-3c2a8baf3175
https://www.globenewswire.com/NewsRoom/AttachmentNg/f413b440-ad10-4426-8509-2f7477e1558a
https://www.globenewswire.com/NewsRoom/AttachmentNg/a462e85d-1290-4a55-a0d0-ddd10a011c53
https://www.globenewswire.com/NewsRoom/AttachmentNg/8a020e7e-6e3d-4373-8681-0a9a0918c519
https://www.globenewswire.com/NewsRoom/AttachmentNg/60ffe326-5b17-4b6b-8ccf-440cc031a20a
https://www.globenewswire.com/NewsRoom/AttachmentNg/30b5991e-812c-4965-aa7d-e129ddad7024