


18th June 2025
Oxford Metrics plc
("Oxford Metrics", the "Company" or the "Group")
Interim Results for the six months ended 31 March 2025
- Progressive H1 and broadening of addressable market opportunities
- Markerless motion capture launched successfully with commercialisation progressing well
- Two acquisitions completed and new MD hire to support build out of smart manufacturing
Oxford Metrics plc (LSE: OMG), the smart sensing and software company, servicing life sciences, entertainment, engineering and smart manufacturing markets, announces unaudited interim results for the six months ended 31 March 2025.
Commenting on the results Imogen O'Connor, Chief Executive, said: "Oxford Metrics has made clear strategic progress in the first half, and is reporting in line with management expectations, against an exceptionally strong comparator created by the fulfilment of our record order book last year.
After several years in development, Vicon Markerless went live in March. I would like to thank our team for their tremendous effort in creating the best launch we have ever delivered and to our 10 beta customers for all their feedback, critiques and support along the way. Vicon is leading the way to set the industry standard, and this is the start to building a quality software and services revenue stream to complement our marker-based business.
We strengthened our smart manufacturing division with the acquisition of Sempre, and appointed a dedicated smart manufacturing managing director, to drive our growth initiatives. Now, the immediate focus is bringing together the precision and distribution capabilities of Sempre and the vision capabilities of IVS, to build an engine to capture more of this substantial growth market.
Trading in the second half has begun as expected, in line with previous years and our usual seasonal trading patterns, albeit we remain mindful of external macro uncertainty. As a diversified business, we are seeing improving activity for Vicon in South America, Asia Pacific and Europe, while recent policy change in the United States relating to the timing of approved funding is starting to impact our institutional and academic customers, a sizeable proportion of our US business. In smart manufacturing, there is good visibility with a building orderbook and pipeline which continues beyond the current financial year.
Notwithstanding the well-publicised uncertainty in the US market and typically being a second half-weighted business, the Board anticipates the full year Adjusted EBIT to be in-line with the Board's expectations based on present market conditions and the conversion and execution of pipeline opportunities at their historical rate."
|
H1 FY25 |
H1 FY24 |
FY24 |
|
|
Revenue |
£20.1m |
£23.5m |
£41.5m |
|
Gross Margin % |
65.5% |
66.8% |
66.5% |
|
Statutory Profit/(Loss) before Tax |
(£0.7m) |
£3.7m |
£2.8m |
|
Adjusted (Loss)/Earnings before Interest and Tax* |
(£0.4m) |
£3.0m |
£1.7m |
|
Adjusted (Loss)/Earnings before Interest & Tax Margin |
(2.0%) |
12.7% |
4.1% |
|
(Loss)/Earnings before Interest & Tax |
(£1.3m) |
£2.6m |
£0.8m |
|
Net Cash |
£39.9m |
£54.8m |
£50.7m |
|
Dividend paid |
£4.2m |
£3.6m |
£3.6m |
|
Basic (Loss)/Earnings per Share |
(0.63p) |
2.34p |
2.24p |
* Adjusted (Loss)/Earnings before Interest and Tax, adjusted for share-based payments, amortisation of intangibles arising on acquisition and exceptional costs.
Financial and strategic highlights
|
● |
Headline Group revenue of £20.1m, down 14% (H1 FY24: 23.5m), in line with management expectations and reflecting a particularly strong comparative due to: |
|
|
○ |
Unusually large opening FY24 order book. |
|
|
○ |
Final stage delivery of our largest order in company history. |
|
|
○ |
As customer buying returned to normal in H2 FY24 this trend was not expected to continue. |
|
|
● |
Group adjusted earnings before interest and tax of (£0.4m) (H1 FY24: £3.0m). |
|
|
● |
Basic earnings per share (0.63p) (H1 FY24: 2.34p). |
|
|
● |
Strong balance sheet with net cash position of £39.9m as at 31 March 2025 (H1 FY24: £54.8m), providing substantial resources for further targeted M&A and capital returns. Post Sempre acquisition of £5.5m, dividend of £4.2m and share buyback program of £3.6 million. |
|
|
● |
Cash generation from operating activities £2.8m (H1FY24: £2.2m) reflecting strong and improved working capital management. |
|
|
● |
Completed restructuring to allocate resources to high impact areas. |
|
Motion capture: launched Vicon Markerless, the future of our industry
|
● |
Vicon Markerless launched in March 2025 empowering Visual Effects teams to bring ideas to life with greater speed and ease than ever before. |
|
|
○ |
Initial feedback continues to be positive with global demonstrations underway. |
|
|
○ |
Dreamscape Immersive's latest VR experience is already powered by Vicon Markerless. |
|
|
● |
Good progress in Vicon's marker-based business, with new contracts and customer upgrades secured across all main markets and geographies. |
|
Smart manufacturing: bolstered by two acquisitions and new leadership appointment
|
● |
Reported revenues of £5.3m (H1 FY24 £1.8m), an increase of 194%, inclusive of revenue contributions of £3.6m from Sempre, acquired in the period. |
|
● |
Organic growth for the period is down slightly by 3% due to some contract delivery delays which have been delivered post period end. |
|
● |
Multiple contracts secured across a broad set of markets including aerospace, medical, pharmaceutical and automotive. |
|
● |
Strengthened the division via acquisition of The Sempre Group Holdings Ltd ("Sempre") with integration underway. |
|
● |
Appointed Dr Simon Gunter as managing director to lead and build our position in this important growth area. |
|
● |
Post period end, completed acquisition of Amber Optix Ltd ("Amber Optix"), further strengthening both IVS' and Sempre's product portfolios. |
Outlook
|
● |
Overall, trading in the second half has started in line with the Board's expectations and our usual seasonal trading patterns. |
|
● |
A typical pipeline of motion capture opportunities across majority of geographies for the remainder of the financial year. |
|
● |
Improving activity and opportunities for Vicon in South America, Asia Pacific and Europe in our Entertainment and Life Sciences markets. |
|
● |
Our US institutional and academic customers are navigating the changing landscape with recent US policy changes and subsequent reduction in grants and funding. |
|
● |
This is starting to impact our US operation with several pipeline opportunities being cancelled or being delayed beyond the current financial year. |
|
● |
Markerless is in early commercialisation with global demonstrations underway; we expect to realise modest markerless revenues in FY25. |
|
● |
Good visibility in smart manufacturing with a building orderbook and pipeline which continues beyond the current financial year. |
|
● |
Separately, the Group continues to monitor the US tariff situation and does not anticipate the current US tariff policy will have a material impact. |
|
● |
Although we remain mindful of external macro uncertainty and the natural H2 weighting of the business, the Board anticipates the full year Adjusted EBIT to be in-line with the Board's expectations based on present market conditions and the conversion and execution of pipeline opportunities at their historical rate. |
|
● |
Long-term fundamental drivers of our business remain strong, with the right products and the right teams well-placed to accelerate and execute. |
|
● |
The Board has approved an additional £4m extension of the share buyback programme to take it up to £10m in aggregate. |
For further information please contact:
|
Oxford Metrics |
+44 (0)1865 261860 |
|
Imogen O'Connor, CEO |
|
|
Zoe Fox, CFO |
|
|
Panmure Liberum (Nomad & Broker) |
+44 (0)20 3100 2000 |
|
Max Jones / James Sinclair-Ford / Gaya Bhatt |
|
|
FTI Consulting |
+44 (0)20 3727 1000 |
|
Matt Dixon / Emma Hall / Jemima Gurney |
|
About Oxford Metrics
Oxford Metrics is a smart sensing and software company that enables the interface between the real world and its virtual twin. Our smart sensing technology helps over 10,000 customers in more than 70 countries, including all the world's top 10 games companies and all of the top 20 universities worldwide. Founded in 1984, we started our journey in healthcare, expanded into entertainment, winning an OSCAR® and an Emmy®, moved into engineering and smart manufacturing. We have a strong track record of creating value by incubating, growing and then augmenting through acquisition, unique technology businesses.
The Group trades through its market-leading division Vicon, Industrial Vision Systems, and recently acquired, The Sempre Group. Vicon is a world leader in motion measurement analysis to thousands of customers worldwide, including Red Bull, Imperial College London, Dreamscape Immersive, Industrial Light & Magic, and NASA. Industrial Vision Systems is a specialist in machine vision software and technology for high precision, automated quality control systems trusted by blue-chip, smart manufacturing companies across the globe including BD, DePuy, Jaguar Land Rover, Johnson & Johnson, Zytronic and Alkegen. Sempre is a measurement specialist solving manufacturing challenges across multiple industries. Through their expert in-house consultants and partnerships with over 25 well-known manufacturers including Jenoptik, Renishaw and Micro-Vu, Sempre offers an extensive range of products and software to customers in aerospace, automotive, medical, energy and precision engineering.
The Group is headquartered in Oxford with offices in the United Kingdom, Ireland, United States and Germany. Since 2001, Oxford Metrics (LSE: OMG), has been a quoted company listed on AIM, a market operated by the London Stock Exchange. For more information about Oxford Metrics, visit www.oxfordmetrics.com.
Chief Executive's Statement
Oxford Metrics has made clear strategic progress in the first half, reporting in line with management expectations. The performance has been driven across both our divisions with an ongoing focus on cost and efficiency. Continued focus has been put into setting the Group up for growth as we continue to actively allocate resources to high-impact areas.
The Group has made good strategic progress in the half with the management team focussed on executing on the key priorities set out at our full year results. Chiefly, these priorities included getting markerless into our customers' hands and establishing our new growth area, smart manufacturing, to position us for future growth. I'm pleased to report clear operational progress on both fronts.
In March, our highly anticipated next generation Vicon Markerless went live and launched at the Game Developer Conference in San Francisco - no suits, no markers needed, enabling faster creative visualisation of motion capture in real time. We worked very closely in the extensive beta testing phases with some of the biggest names in Visual Effects including Industrial Light & Magic, Gearbox Entertainment, Dreamscape Immersive, Dimension|DNEG360 and Framestore, and feedback so far has been positive.
With commercialisation now underway we are well placed to build a quality software and services revenue stream on top of our marker-based business and as anticipated, expect to realise modest markerless revenues in FY25. As planned, initial rollout is to the Entertainment market, enabling Visual Effects teams to quickly bring creative ideas to life and transition to full optical motion capture if required. As Vicon leads the way to set this new industry standard, our new markerless system is already powering Dreamscape Immersive's latest VR experience in Geneva. Post period end, our teams have conducted a number of demonstrations globally to over 250 interested parties and our markerless opportunity pipeline is now building.
In October, we strengthened our smart manufacturing offering with the acquisition of Sempre. Sempre are measurement specialists and an established sales and services organisation, helping well-known, blue-chip manufacturers solve metrology challenges, improve quality and efficiencies across multiple industries including aerospace, automotive, medical and precision engineering.
As we execute upon our smart manufacturing opportunity, we welcomed a new managing director, Dr Simon Gunter to lead and drive forward important initiatives to build the Group's position in this important market and growth area.
Post period end, we acquired Amber Optix, bringing 27 years' experience developing non-contact machine vison inspection systems for contact lens manufacturers to automatically detect defects and ensure 'right first time' products. Amber Optix has been incorporated into Industrial Vision Systems ("IVS"), strengthening both IVS' and Sempre's product portfolios as we accelerate commercial and R&D efforts.
As we move forward, the Group has clear ambitions for the division, with an immediate focus on bringing together the commercial capabilities of Sempre and the vision capabilities of IVS, to build an engine for growth and applying this across co-ordinated manufacturing and quality environments.
Following these acquisitions and the appointment of our new smart manufacturing managing director, we are currently formulating the Group's new three-year strategy which is expected to be announced at our full year results later this year.
Operational and financial performance
|
Revenue |
Adjusted EBIT |
|||||
|
H1 FY25 |
H1 FY24 |
FY24 |
H1 FY25 |
H1 FY24 |
FY24 |
|
|
Motion capture |
£14.8m |
£21.7m |
£38.6m |
£0.6m |
£4.4m |
£5.1m |
|
Smart manufacturing |
£5.3m |
£1.8m |
£2.9m |
£0.7m |
£0.5m |
£0.3m |
|
PLC - unallocated |
(£1.7m) |
(£1.9m) |
(£3.7m) |
|||
|
Total Continued Operations |
£20.1m |
£23.5m |
£41.5m |
(£0.4m) |
£3.0m |
£1.7m |
The Group delivered revenues of £20.1m (H1 FY24: £23.5m) in line with management's expectations. Revenue includes £3.6m generated from Sempre, which we acquired to strengthen our smart manufacturing division. The Group reports Adjusted EBIT* (£0.4m) (H1 FY24 EBIT: £3.0m).
H1 FY24 is a particularly strong comparative reflecting the opening order book of FY24 and final stage delivery of our largest order in company history. This trend in H1 FY24 was not expected to be repeated in FY25 once customer buying returned to normal in H2 FY24.
* Adjusted (Loss)/Earnings before Interest and Tax, adjusted for share-based payments, amortisation of intangibles arising on acquisition and exceptional costs.
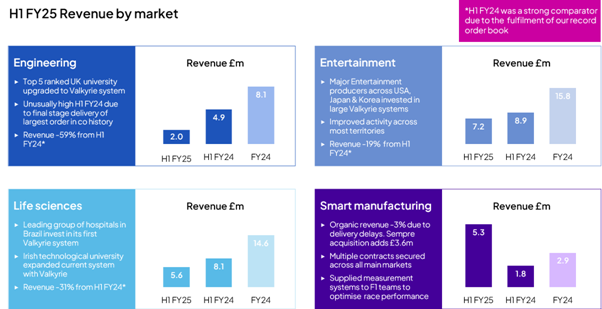
Vertical performance
The Group operates across four markets, life sciences, entertainment, engineering and smart manufacturing, giving a strong income stream and a diverse range of applications for our products. Contracting periods and buying cycles can therefore vary considerably and comparison on a six-month basis can significantly change from period to period. The Group continues to see strong repeat business above 80% within all markets in our motion capture division.
Motion capture
Motion capture revenues were down 32% in the period against an exceptionally strong H1 FY24 comparator and a normalisation of buying patterns in H2 FY24. Revenue of £14.8m (H1 FY24 £21.8m), and gross margins remain strong. The adjusted EBIT of the division after Group allocation of costs is £0.6m (H1 FY24: £4.4m).
While markerless has been a major focus as our teams worked towards its successful launch, Vicon's marker-based business also saw good progress, securing both new contracts and customer upgrades across all main markets and geographies:
|
● |
A leading group of rehabilitation hospitals across Brazil invested in its first Vicon Valkyrie system to carry out clinical gait analysis, enabling its orthopaedic teams to make informed decisions and recommend clinical, surgical and rehabilitative treatments. |
|
● |
Major Entertainment producers across the USA, Japan and Korea invested in large Valkyrie systems to capture ultra realistic movement and bring their characters to life. |
|
● |
Sandbox VR continued its rollout, now with 55 facilities across the globe and more due to be opened. |
Life Sciences
Life Sciences reported revenues of £5.6m (H1 FY24 £8.1m), a decline of 31% on the prior year, marginally below management expectations and against a strong comparator. H1 2024 saw higher than normal sales due to the fulfilment of sales in the order book which had built up to record levels in FY23 as a result of the well-documented supply chain challenges following the pandemic.
Entertainment
Entertainment reported revenues of £7.2m (H1 FY24 £8.9m), a decline of 19% on the prior year. This was above management expectations, with Entertainment showing improved activity across most of the territories:
|
● |
India saw good growth in the half. A leading Indian film studio and a long-standing visual effects customer both invested in large Valkyrie systems for their facilities. |
|
● |
A new customer in South Korea, purchased a 60-camera Valkyrie system for their new virtual content studio which enables V-Tubers to capture their movements to the highest precision, enabling them to live broadcast more realistic and lifelike digital avatars. |
Engineering
Engineering, our smallest vertical, reported revenues of £2.0m (H1 FY24 £4.9m), representing a decline of 59% on prior year. This was in line with management expectations for the half due to the exceptionally high comparator in H1 2024, which saw unusually high revenues in Engineering due to final stages of delivery of the largest standalone order in company history.
In the half, contracts were secured in the automotive, aerospace, metrology and research sectors, including a top-ranking UK university and long-standing customer investing in a new Vicon system for research into autonomous vehicles.
Smart manufacturing
Smart manufacturing reported revenues of £5.3m (H1 FY24 £1.8m), an increase of 194%, inclusive of revenue contributions of £3.6m from Sempre, acquired in the period. Organic growth in the period is down by 3% due to some contract delivery delays impacting revenue recognition. Gross margins are resilient although Sempre has a lower gross margin percentage than IVS due to the different business model. The adjusted EBIT of the division after Group allocation of costs is £0.7m (H1 FY24: £0.5m).
During the half, we welcomed Dr Simon Gunter as managing director to lead this division. Simon is an experienced c-level leader with an extensive track record of growing early-stage technology businesses and successfully implementing change through business transformation, strategy and direction, M&A, and launching innovative products.
Multiple new contracts were secured across various markets including aerospace, medical, pharmaceutical, and automotive, as demand continues for automated vision inspection, quality control and metrology solutions.
|
● |
A UK-based dry inhaler manufacturer invested in an IVS system to automatically inspect blister strips containing pre-set doses of medicine for asthma sufferers. The IVS system inspects each individual blister, checking the height, width and form, ensuring the correct dosage of medicine is included and they are compliant with strict medical regulations. |
|
● |
Three major contracts secured with leading Formula 1 teams, supplying measurement systems to help teams optimise performance in races to gain competitive advantage. |
|
● |
A long-standing leading medical device customer invested in a multi-sensing vision solution for the precision inspection of safety-critical components. |
Profitability
Gross profit decreased by 16% to £13.2m (H1 FY24 £15.7m), with gross margin at 65.5% (H1 FY24: 66.8%) down 130 bps. The decline is mainly due to the mix in sales and the higher volume of sales going through our smart manufacturing division, which is typically lower margin than the motion capture business.
As expected, sales, support and marketing costs increased to £5.4m (H1 FY24: £4.5m) a 21% increase representing the ongoing operational costs from the Sempre acquisition.
Research and development costs were £2.5m (H1 FY24: £2.7m), with investment still being incurred in markerless development and new products for H2 2025.
Administration costs also increased to £6.5m (H1 FY24: £5.9m) an 11% increase in the main attributable to the Sempre acquisition, partially offset by savings seen year-on-year in the motion capture division.
Adjusted profit before tax £0.3m (H1 FY24: £4.0m) reflecting the lower revenue as detailed above.
Adjustments made to the interim financial results before tax were £1.0m (H1 FY24: £0.4m) and are for share-based payments, amortisation of intangibles arising on acquisition and professional fees in relations to acquisitions. See note 4 for further detail.
The finance income for the period was £0.7m (H1 FY24: £1.1m). The income is derived from the Group's large cash balances held on interest bearing deposit accounts. Over the period the value held, and the interest rates have decreased resulting in the lower finance income. Cash has been utilised to fund the acquisition of Sempre and Amber Optix, pay dividend and the share buyback.
EBIT
Adjusted EBIT which provides a more consistent comparison of trading between the financial periods of the Group and removes any non-operating costs, decreased in the period by 113% to a loss of £0.4m (H1 FY24: profit £3.0m). Reflecting the lower revenue in the period and higher operational costs as detailed above.
The Group remains focused on enhancing profitability by optimising operational overheads and driving efficiencies across all departments and divisions. We are actively reducing costs and implementing automation software to streamline processes, improve productivity, and support sustainable growth.
Tax
The Group tax charge is £0.1m (H1 FY2024: £0.6m). The tax charge in the period is due to movements in deferred tax including, but not exclusively, capital allowances in excess of depreciation and amortisation. The Group's consolidated effective tax rate for H1 2025 was 13.0% (H1 2024: 29.5%).
Cash and cash generation
Following recent acquisitions and the share buyback programme, the Group cash position remains strong at £39.9m (H1 FY24: £54.8m) as at 31 March 2025.
The inventory position at the end of the reporting period was £8.1m (H1 FY24: £9.0m). Following the well documented supply chain challenges of previous years, Vicon has continued to drive inventory down in line with forecasts and has made improvements to procurement processes working to internal agreed targets and KPIs.
Cash used in investing and financing activities included continued investment in research and development of £1.8m (H1 FY24: £1.4m), interest received £0.6m (H1 FY24: £1.1m), the deployment of £4.3m (net of cash acquired) on the acquisition of Sempre and other capital items £0.2m.
The final cash dividend of £4.2m (H1 FY24: £3.6m), continuing the Group's progressive dividend policy and cash utilised for shares repurchased of £3.6m at period end. At the current rate we expect the £6m of cash allocated for the share repurchase to be fully utilised during August to September 2025.
Cash generated by operations during the first half was £2.8m compared with £2.2m in the first half of last year, reflecting the lower profitability of the period being offset with stronger control on working capital.
Board changes
In October, we welcomed Dr Ian Wilcock as Non-Executive Director. Ian is Chair of the Remuneration Committee and a member of the Audit Committee. Ian brings over 30 years' experience, has a proven track record of growing businesses organically and through acquisition and held senior positions at smart sensor businesses that delivered ambitious growth plans.
Post period end, we welcomed Dr Margaret Amos as a Non-Executive Director. Margaret brings over 27 years' executive experience, the majority of which were at Rolls Royce, where she held senior leadership positions including Finance Director. Margaret brings strong expertise in M&A, international growth, turnarounds and transformation and has held senior independent, audit, remuneration and ESG Chair positions.
Paul Taylor will be retiring from the Board on 30th June 2025 and Margaret will, from July 1st take over as Chair of the Audit Committee and become a member of the Remuneration Committee.
Roger Parry has informed the Board of his intention to not stand for re-election as Chair at the next AGM. Recruitment for a replacement Chair has commenced.
Long-standing Executive Director and Company Secretary, Cathy Robertson, retired after 24 years on the Board and almost 40 years of service. Cathy has made an enormous contribution to the company over that time, including floating the business on AIM, setting up our US offices and, acquiring and selling businesses for the Group. On behalf of the Board, colleagues and our shareholders, we wish Cathy the very best in retirement.
Co-secretary
Post period end, Philip Abrahams was appointed as Company Secretary for the Group. Philip brings a tremendous amount of experience including strong legal expertise, governance leadership, supporting M&A transactions, regulatory compliance, and sustainability.
Capital allocation
Share buyback programme
In October 2024 we were pleased to announce a return of up to £6m of cash to shareholders through the means of an on-market share buyback programme. The buyback programme is tracking to expected timelines and as 17 June 2025 had utilised £5.0m of cash and purchased 8.8m of shares at an average share price of £0.55 per share.
As of 17 June 2025 the total number of voting rights in ordinary shares of 0.25 pence per share of Oxford Metrics was 122,592,334.
The Group is pleased to report, post period end, the Board approved an additional £4m extension of the share buyback programme.
M&A
Oxford Metrics continues to have a disciplined and consistent approach to M&A. We are actively pursuing M&A opportunities to drive more applications into the smart manufacturing space, building the Group's position in this important growth vector. We continue to only pursue opportunities that align with our strict criteria and mantra; to find the right acquisitions, at the right price, for the right reasons.
On 10 October 2024 the Group acquired 100% of the share capital of The Sempre Group Holdings Limited on for a total consideration of up to £5.5m. Sempre are measurement specialists and an established sales and services organisation, helping manufacturers improve quality and efficiencies across multiple industries including aerospace, automotive, medical and precision engineering.
Post period end, on 4 April 2025, the Group acquired 100% of the share capital of Amber Optix for a total consideration of up to £0.8m, including an earnout contingent consideration of up to £0.3m dependent upon certain performance targets being met. Amber Optix has a profitable track record and, in the year ended 31 March 2024, reported unaudited revenues of £0.6m.
Our ongoing M&A programme continues with focus on smart manufacturing opportunities to augment and accelerate this division's growth.
R&D
R&D investment and innovation of new products remains key to the success of the business. Continued investment has seen development costs capitalised in the period of £1.8m, £0.8m of which was for our new markerless motion capture. Vicon Markerless was launched in March 2025 and initially aimed at our Entertainment market. The majority of other spend is on other new products and product improvements due for release in H2 2025.
Trading and Outlook
Overall, trading in the second half has begun as expected, in line with previous years and our usual seasonal trading patterns, albeit we remain mindful of external macro uncertainty.
Our latest innovation, Vicon Markerless, launched in March 2025 is commercially available. Customer demonstrations are now taking place across the globe, to deliver this latest technology into more of our customers' hands.
As a diversified business, while we are seeing improving activity and opportunities for Vicon in South America, Asia Pacific and Europe in our Entertainment and Life Science markets, we are seeing macroeconomic factors affecting certain areas of the business. In the United States we continue to monitor evolving developments relating to recent policy change. The US National Institutes of Health, the world's largest funder of biomedical research, is facing significant changes and a subsequent reduction in grants and funding. The National Science Foundation was also significantly affected. Our institutional and academic customers are navigating this changing landscape, and this is now being seen in our US operation with several pipeline opportunities being cancelled or being delayed beyond the current financial year.
Independent of these policy changes, the Group continues to monitor the US tariff situation and does not anticipate the current US tariff policy will have a material impact. To help mitigate the current macroeconomic climate we continue to manage our cost base prudently.
In smart manufacturing we have good H2 visibility, with a building orderbook and pipeline which continues beyond the current financial year. With a new managing director in place, we are focused on bringing together our offering to collaborate, upsell and develop cross sell opportunities as we buildout our presence in this important growth area and scale it moving forward.
The long-term fundamental drivers of our business remain intact with the right products and the right teams well-placed to accelerate and execute. Looking ahead, we enter the second half with a typical pipeline of motion capture opportunities across the majority of our geographies. Although we remain mindful of external macro uncertainty and the natural H2 weighting of the business, the Board anticipates the full year Adjusted EBIT to be in-line with the Board's expectations based on present market conditions and the conversion and execution of pipeline opportunities at their historical rate.
CONDENSED CONSOLIDATED INCOME STATEMENT
|
Six months ended 31 March 2025 |
Six months ended 31 March 2024 |
Year ended 30 September 2024 |
||
|
(unaudited) |
Restated (unaudited) |
(audited) |
||
|
Note |
£'000 |
£'000 |
£'000 |
|
|
Revenue |
2 |
20,115 |
23,523 |
41,459 |
|
Cost of sales |
(6,943) |
(7,806) |
(13,868) |
|
|
Gross profit |
13,172 |
15,717 |
27,591 |
|
|
Sales, support and marketing costs |
(5,425) |
(4,531) |
(8,795) |
|
|
Research and development |
(2,534) |
(2,676) |
(5,152) |
|
|
Administrative expenses |
(6,548) |
(5,908) |
(12,920) |
|
|
Operating (loss)/profit |
(1,335) |
2,602 |
724 |
|
|
Finance income |
818 |
1,199 |
2,334 |
|
|
Finance expense |
(149) |
(132) |
(276) |
|
|
(Loss)/profit before taxation |
(666) |
3,669 |
2,782 |
|
|
Taxation |
(148) |
(598) |
149 |
|
|
(Loss)/profit from continuing operations |
(814) |
3,071 |
2,931 |
|
|
Loss from discontinued operations, net of tax |
(472) |
(1,659) |
(2,173) |
|
|
(Loss)/profit for the period attributable to owners of the parent during the period |
(1,286) |
1,412 |
758 |
|
|
(Loss)/earnings per share for profit on continuing operations attributable to owners of the parent during the year |
||||
|
Basic (loss)/earnings per share (pence) |
6 |
(0.63)p |
2.34p |
2.24p |
|
Diluted (loss)/earnings per share (pence) |
6 |
(0.63)p |
2.31p |
2.22p |
|
(Loss)/earnings per share for profit on total operations attributable to owners of the parent during the year |
||||
|
Basic (loss)/earnings per share (pence) |
6 |
(1.00)p |
1.08p |
0.58p |
|
Diluted (loss)/earnings per share (pence) |
6 |
(1.00)p |
1.05p |
0.56p |
CONDENSED CONSOLIDATED STATEMENT OF COMPREHENSIVE INCOME
|
Six months ended 31 March 2025 |
Six months ended 31 March 2024 |
Year ended 30 September 2024 |
||
|
(unaudited) |
(unaudited) |
(audited) |
||
|
£'000 |
£'000 |
£'000 |
||
|
Net (loss)/profit for the period |
(1,286) |
1,412 |
758 |
|
|
Other comprehensive income |
||||
|
Items that will or may be reclassified to profit or loss |
||||
|
Exchange differences on retranslation of overseas subsidiaries |
161 |
(35) |
(406) |
|
|
Tax credit on translation differences |
- |
- |
81 |
|
|
Total other comprehensive income/(expense) |
161 |
(35) |
(325) |
|
|
Total comprehensive (expense)/income for the period attributable to the owners of the parent |
(1,125) |
1,377 |
433 |
CONDENSED CONSOLIDATED STATEMENT OF FINANCIAL POSITION
|
31 March 2025 |
31 March 2024 |
30 September 2024 |
||
|
(unaudited) |
(unaudited) |
(audited) |
||
|
Note |
£'000 |
£'000 |
£'000 |
|
|
Non-current assets |
||||
|
Goodwill and intangible assets |
23,786 |
17,242 |
18,714 |
|
|
Property, plant and equipment |
3,292 |
3,191 |
3,257 |
|
|
Right of use assets |
3,704 |
4,120 |
3,534 |
|
|
Financial asset - investments |
236 |
236 |
236 |
|
|
31,018 |
24,789 |
25,741 |
||
|
Current assets |
||||
|
Inventories |
8,116 |
9,032 |
7,737 |
|
|
Trade and other receivables |
9,356 |
8,019 |
8,932 |
|
|
Current tax debtor |
487 |
- |
425 |
|
|
Fixed term deposits |
25,000 |
44,000 |
30,000 |
|
|
Cash and cash equivalents |
14,860 |
10,754 |
20,723 |
|
|
57,819 |
71,805 |
67,817 |
||
|
Assets classified as held for sale |
- |
407 |
- |
|
|
Current liabilities |
||||
|
Trade and other payables |
(9,700) |
(8,781) |
(7,344) |
|
|
Current tax liability |
- |
(371) |
(124) |
|
|
Deferred consideration payable |
(1,157) |
(436) |
(436) |
|
|
Lease liabilities |
(1,357) |
(1,214) |
(1,174) |
|
|
(12,214) |
(10,802) |
(9,078) |
||
|
Liabilities directly associated with assets classified as held for sale |
- |
(70) |
- |
|
|
Net current assets |
45,605 |
61,340 |
58,739 |
|
|
Total assets less current liabilities |
76,623 |
86,129 |
84,480 |
|
|
Non-current liabilities |
||||
|
Other liabilities |
(1,029) |
(1,302) |
(848) |
|
|
Lease liabilities |
(2,626) |
(3,177) |
(2,601) |
|
|
Provisions |
(67) |
(52) |
(59) |
|
|
Deferred tax liability |
(2,582) |
(1,652) |
(1,879) |
|
|
(6,304) |
(6,183) |
(5,387) |
||
|
Net assets |
70,319 |
79,946 |
79,093 |
|
|
Capital and reserves attributable to the owners of the parent |
||||
|
Share capital |
7 |
313 |
329 |
329 |
|
Shares to be issued |
65 |
65 |
65 |
|
|
Share premium account |
19,494 |
19,494 |
19,494 |
|
|
Merger reserve |
870 |
870 |
870 |
|
|
Retained earnings |
48,927 |
58,347 |
57,865 |
|
|
Capital redemption reserve |
16 |
- |
- |
|
|
Foreign currency translation reserve |
634 |
841 |
470 |
|
|
Total equity shareholders' funds |
70,319 |
79,946 |
79,093 |
CONDENSED CONSOLIDATED STATEMENT OF CASHFLOWS
|
Six months ended 31 March 2025 |
Six months ended 31 March 2024 |
Year ended 30 September 2024 |
|
|
(unaudited) |
Restated (unaudited) |
(audited) |
|
|
£'000 |
£'000 |
£'000 |
|
|
Cash flows from operating activities |
|||
|
(Loss)/profit for the period from continuing operations |
(814) |
3,071 |
2,931 |
|
Loss for the period from continuing operations |
(472) |
(1,659) |
(2,173) |
|
Total (loss)/profit for the period |
(1,286) |
1,412 |
758 |
|
Income tax expense/(credit) |
148 |
598 |
(216) |
|
Finance income |
(818) |
(1,199) |
(2,334) |
|
Finance expense |
149 |
132 |
276 |
|
Depreciation and amortisation |
2,351 |
1,862 |
4,072 |
|
Impairment of intangible assets |
- |
1,076 |
1,273 |
|
Share based payments |
139 |
66 |
211 |
|
Decrease/(increase) in inventories |
334 |
(1,541) |
(285) |
|
Decrease in receivables |
1,889 |
2,597 |
1,108 |
|
Increase/(decrease) in payables |
170 |
(2,509) |
(4,540) |
|
Cash generated from operating activities |
3,076 |
2,494 |
323 |
|
Tax paid |
(322) |
(305) |
(755) |
|
Net cash from operating activities |
2,754 |
2,189 |
(432) |
|
Cash flows from investing activities |
|||
|
Purchase of property, plant and equipment |
(249) |
(969) |
(1,611) |
|
Purchase of intangible assets |
(1,761) |
(1,420) |
(3,086) |
|
Proceeds on disposal of property, plant and equipment |
9 |
9 |
12 |
|
Acquisition of subsidiary undertaking, net of cash acquired |
(4,290) |
(6,231) |
(6,231) |
|
Cash placed on fixed term deposit |
(25,000) |
(22,968) |
(57,968) |
|
Fixed term deposits maturing |
30,000 |
20,968 |
69,968 |
|
Interest received |
1,062 |
650 |
2,388 |
|
Net cash used in investing activities |
(229) |
(9,961) |
3,472 |
|
Cash flows from financing activities |
|||
|
Principal paid on lease liabilities |
(543) |
(313) |
(825) |
|
Interest paid on lease liabilities |
(139) |
(132) |
(291) |
|
Interest paid |
(10) |
- |
(3) |
|
Issue of ordinary shares |
- |
7 |
10 |
|
Shares repurchased |
(3,598) |
- |
- |
|
Equity dividends paid |
(4,193) |
(3,615) |
(3,615) |
|
Net cash used in financing activities |
(8,483) |
(4,053) |
(4,724) |
|
Net (decrease)/increase in cash and cash equivalents |
(5,958) |
(11,825) |
(1,684) |
|
Cash and cash equivalents at beginning of the period |
20,723 |
22,791 |
22,791 |
|
Exchange loss on cash and cash equivalents |
95 |
(129) |
(384) |
|
Cash and cash equivalents |
14,860 |
10,837 |
20,723 |
|
Cash and cash equivalents included in current assets |
14,860 |
10,754 |
20,723 |
|
Cash and cash equivalents classified as held for sale |
- |
83 |
- |
|
Cash and cash equivalents |
14,860 |
10,837 |
20,723 |
CONDENSED CONSOLIDATED STATEMENT OF CHANGES TO EQUITY
|
Share Capital |
Shares to be issued |
Share premium account |
Merger reserve |
Retained earnings |
Capital redemption reserve |
Foreign currency translation reserve |
Total |
||
|
£'000 |
£'000 |
£'000 |
£'000 |
£'000 |
£'000 |
£'000 |
£'000 |
||
|
Balance as at 30 September 2024 |
329 |
65 |
19,494 |
870 |
57,865 |
- |
470 |
79,093 |
|
|
Net profit for the period |
- |
- |
- |
- |
(1,286) |
- |
- |
(1,286) |
|
|
Exchange difference on retranslation of overseas subsidiaries |
- |
- |
- |
- |
- |
- |
164 |
164 |
|
|
Transactions with owners: |
|||||||||
|
Dividends |
- |
- |
- |
- |
(4,193) |
- |
- |
(4,193) |
|
|
Share capital repurchased |
(16) |
- |
(3,598) |
16 |
- |
(3,598) |
|||
|
Share based payment charge |
- |
- |
- |
- |
139 |
- |
- |
139 |
|
|
Balance as at 31 March 2025 |
313 |
65 |
19,494 |
870 |
48,927 |
16 |
634 |
70,319 |
|
|
Balance as at 30 September 2023 |
326 |
65 |
19,487 |
- |
60,451 |
- |
876 |
81,205 |
|
|
Net profit for the period |
- |
- |
- |
- |
1,412 |
- |
- |
1,412 |
|
|
Exchange differences on retranslation of overseas subsidiaries |
- |
- |
- |
- |
- |
- |
(35) |
(35) |
|
|
Transactions with owners: |
|||||||||
|
Tax recognised directly in equity in relation to employee share option schemes |
- |
- |
- |
- |
33 |
- |
- |
33 |
|
|
Dividends |
- |
- |
- |
- |
(3,615) |
- |
- |
(3,615) |
|
|
Issue of share capital |
3 |
- |
7 |
870 |
- |
- |
880 |
||
|
Share based payment charge |
- |
- |
- |
- |
66 |
- |
- |
66 |
|
|
Balance as at 31 March 2024 |
329 |
65 |
19,494 |
870 |
58,347 |
- |
841 |
79,946 |
|
|
Balance as at 30 September 2023 |
326 |
65 |
19,487 |
- |
60,451 |
- |
876 |
81,205 |
|
|
Net profit for the period |
- |
- |
- |
- |
758 |
- |
- |
758 |
|
|
Exchange differences on retranslation of overseas subsidiaries |
- |
- |
- |
- |
- |
- |
(406) |
(406) |
|
|
Tax credit on translation differences |
- |
- |
- |
- |
81 |
- |
- |
81 |
|
|
Transactions with owners: |
|||||||||
|
Tax recognised directly in equity in relation to employee share option schemes |
- |
- |
- |
- |
(21) |
- |
- |
(21) |
|
|
Dividends |
- |
- |
- |
- |
(3,615) |
- |
- |
(3,615) |
|
|
Issue of share capital |
3 |
- |
7 |
870 |
- |
- |
- |
880 |
|
|
Share based payment charge |
- |
- |
- |
- |
211 |
- |
- |
211 |
|
|
Balance as at 30 September 2024 |
329 |
65 |
19,494 |
870 |
57,865 |
- |
470 |
79,093 |
|
The accompanying notes are an integral part of this interim financial information.
NOTES TO THE CONDENSED CONSOLIDATED INTERIM STATEMENTS
1. Basis of preparation
Oxford Metrics Plc, (the "Company") is a company domiciled in England. The condensed consolidated interim financial statements of the Company for the six months ended 31 March 2025 comprise the Company and its subsidiaries (together referred to as the "Group").
The condensed consolidated interim financial statements have been prepared using accounting policies consistent with those of the annual financial statements for the year ended 30 September 2024. Other new and amended standards and interpretations in accordance with UK adopted International Accounting Standards that will apply for the first time in the next annual financial statements are not expected to impact the Group as they are either not relevant to the Group's activities or require accounting which is consistent with the Group's current accounting policies.
The interim financial statements have not been audited or reviewed and the financial information contained in this report does not constitute statutory accounts within the meaning of Section 434 of the Companies Act 2006. The comparative figures for the year ended 30 September 2024 are not the statutory accounts but have been extracted from the Group's 2024 financial statements which have been delivered to the Registrar of Companies. The auditors' report on those financial statements was unqualified did not contain references to any matters to which the auditors drew attention without qualifying the report and did not contain a statement under Section 498(2) or (3) of the Companies Act 2006.
|
2. 2. Revenue from contracts with customers All revenue shown within note 2 relates to continuing operations. |
|||||||
|
Six months ended 31 March 2025 |
Six months ended 31 March 2024 |
Year ended 30 September 2024 |
|||||
|
(unaudited) |
(unaudited) |
(audited) |
|||||
|
Revenue |
£'000 |
£'000 |
£'000 |
||||
|
Motion Capture |
14,817 |
21,759 |
38,590 |
||||
|
Smart Manufacturing |
5,298 |
1,764 |
2,869 |
||||
|
20,115 |
23,523 |
41,459 |
|||||
|
Six months ended 31 March 2025 (unaudited) |
|||||||
|
Motion Capture |
Smart Manufacturing |
Total Group |
|||||
|
£'000 |
£'000 |
£'000 |
|||||
|
Timing of the transfer of goods and services |
|||||||
|
Point in time |
12,561 |
3,602 |
16,163 |
||||
|
Over time |
2,256 |
1,696 |
3,952 |
||||
|
14,817 |
5,298 |
20,115 |
|||||
|
Contract Counterparties |
|||||||
|
Direct to consumers |
8,110 |
5,298 |
13,408 |
||||
|
Third party distributor |
6,707 |
- |
6,707 |
||||
|
14,817 |
5,298 |
20,115 |
|||||
|
By destination |
|||||||
|
UK |
1,192 |
3,745 |
4,937 |
||||
|
Europe |
2,327 |
797 |
3,124 |
||||
|
USA |
4,889 |
106 |
4,995 |
||||
|
Rest of North America |
971 |
635 |
1,606 |
||||
|
Asia Pacific |
5,190 |
15 |
5,205 |
||||
|
Other |
248 |
- |
248 |
||||
|
14,817 |
5,298 |
20,115 |
|||||
|
By origin |
|||
|
UK |
7,612 |
5,017 |
12,629 |
|
Europe |
951 |
281 |
1,232 |
|
North America |
6,254 |
- |
6,254 |
|
14,817 |
5,298 |
20,115 |
|
By market |
|||
|
Engineering |
2,008 |
- |
2,008 |
|
Entertainment |
5,648 |
- |
5,648 |
|
Life Sciences |
7,161 |
- |
7,161 |
|
Smart Manufacturing |
- |
5,298 |
5,298 |
|
14,817 |
5,298 |
20,115 |
|
By type |
|||||
|
Sale of hardware |
11,746 |
4,039 |
15,785 |
||
|
Sale of software |
946 |
197 |
1,143 |
||
|
Rendering of services |
1,573 |
986 |
2,559 |
||
|
Support |
552 |
76 |
628 |
||
|
14,817 |
5,298 |
20,115 |
|||
|
Six months ended 31 March 2024 (unaudited) |
|||||
|
Motion Capture |
Smart Manufacturing |
Total Group |
|||
|
£'000 |
£'000 |
£'000 |
|||
|
Timing of the transfer of goods and services |
|||||
|
Point in time |
19,233 |
- |
19,233 |
||
|
Over time |
2,526 |
1,764 |
4,290 |
||
|
21,759 |
1,764 |
23,523 |
|||
|
Contract Counterparties |
|||||
|
Direct to consumers |
13,210 |
1,764 |
14,974 |
||
|
Third party distributor |
8,549 |
- |
8,549 |
||
|
21,759 |
1,764 |
23,523 |
|||
|
By destination |
|||||
|
UK |
1,878 |
822 |
2,700 |
||
|
Europe |
3,600 |
310 |
3,910 |
||
|
USA |
9,228 |
3 |
9,231 |
||
|
Rest of North America |
680 |
524 |
1,204 |
||
|
Japan |
2,272 |
- |
2,272 |
||
|
Rest of Asia Pacific |
3,976 |
105 |
4,081 |
||
|
Other |
125 |
- |
125 |
||
|
21,759 |
1,764 |
23,523 |
|||
|
By origin |
|||
|
UK |
11,151 |
1,764 |
12,915 |
|
Europe |
690 |
- |
690 |
|
North America |
9,918 |
- |
9,918 |
|
21,759 |
1,764 |
23,523 |
|
By market |
|||
|
Engineering |
4,855 |
- |
4,855 |
|
Entertainment |
8,853 |
- |
8,853 |
|
Life Sciences |
8,051 |
- |
8,051 |
|
Smart Manufacturing |
- |
1,764 |
1,764 |
|
21,759 |
1,764 |
23,523 |
|
By type |
|||
|
Sale of hardware |
17,741 |
1,591 |
19,332 |
|
Sale of software |
917 |
- |
917 |
|
Rendering of services |
2,649 |
- |
2,649 |
|
Support |
452 |
173 |
625 |
|
21,759 |
1,764 |
23,523 |
|
Year ended 30 September 2024 (audited) |
|||||
|
Motion Capture |
Smart Manufacturing |
Total Group |
|||
|
£'000 |
£'000 |
£'000 |
|||
|
Timing of the transfer of goods and services |
|||||
|
Point in time |
33,765 |
393 |
34,158 |
||
|
Over time |
4,825 |
2,476 |
7,301 |
||
|
38,590 |
2,869 |
41,459 |
|||
|
Contract Counterparties |
|||||
|
Direct to consumers |
24,222 |
2,869 |
27,091 |
||
|
Third party distributor |
14,368 |
- |
14,368 |
||
|
38,590 |
2,869 |
41,459 |
|||
|
By destination |
|||||
|
UK |
4,326 |
1,761 |
6,087 |
||
|
Europe |
5,938 |
475 |
6,413 |
||
|
USA |
15,516 |
6 |
15,522 |
||
|
Rest of North America |
1,533 |
480 |
2,013 |
||
|
Japan |
4,009 |
- |
4,009 |
||
|
Rest of Asia Pacific |
6,959 |
11 |
6,970 |
||
|
Other |
309 |
136 |
445 |
||
|
38,590 |
2,869 |
41,459 |
|||
|
By origin |
|||
|
UK |
19,690 |
2,869 |
22,559 |
|
Europe |
1,560 |
- |
1,560 |
|
North America |
17,340 |
- |
17,340 |
|
38,590 |
2,869 |
41,459 |
|
By market |
|||
|
Engineering |
8,100 |
- |
8,100 |
|
Entertainment |
15,851 |
- |
15,851 |
|
Life Sciences |
14,639 |
- |
14,639 |
|
Smart Manufacturing |
- |
2,869 |
2,869 |
|
38,590 |
2,869 |
41,459 |
|
By type |
|||
|
Sale of hardware |
30,626 |
2,734 |
33,360 |
|
Sale of software |
1,741 |
12 |
1,753 |
|
Rendering of services |
5,299 |
35 |
5,334 |
|
Support |
924 |
88 |
1,012 |
|
38,590 |
2,869 |
41,459 |
3. Segmental Analysis
Segment information is presented in the condensed consolidated interim financial statements in respect of the Group's business segments, which are reported to the Chief Operating Decision Maker (CODM). The Group has identified the Board of Directors of Oxford Metrics plc, ("the Board") as the CODM. The business segment reporting reflects the Group's management and internal reporting structure.
The Group comprises the following business segments:
Motion Capture: This is the development, production and sale of computer software and equipment for the entertainment, engineering and life science markets; and
Smart Manufacturing: This is the development, production and sale of smart manufacturing systems.
Other unallocated costs represent head office expenses not recharged to subsidiary companies.
Business segments are analysed below:
|
Additions to non-current assets |
Carrying amount of segment assets |
|||||
|
Six months ended 31 March 2025 (unaudited) |
Six months ended 31 March 2024 (unaudited) |
Year ended 30 September 2024 (audited) |
Six months ended 31 March 2025 (unaudited) |
Six months ended 31 March 2024 (unaudited) |
Year ended 30 September 2024 (audited) |
|
|
£'000 |
£'000 |
£'000 |
£'000 |
£'000 |
£'000 |
|
|
Motion Capture |
1,877 |
3,498 |
4,684 |
32,552 |
38,953 |
35,767 |
|
Smart Manufacturing |
7,162 |
6 |
8,858 |
20,198 |
10,017 |
10,593 |
|
Unallocated |
2 |
5 |
7 |
36,087 |
48,031 |
47,198 |
|
Oxford Metrics Group |
9,041 |
3,509 |
13,549 |
88,837 |
97,001 |
93,558 |
|
Six months ended 31 March 2025 |
Six months ended 31 March 2024 Restated |
Year ended 30 September 2024 |
|
|
Oxford Metrics Group - Continuing operations |
(unaudited) |
(unaudited) |
(audited) |
|
£'000 |
£'000 |
£'000 |
|
|
Motion Capture (loss)/profit before tax |
(488) |
2,214 |
1,058 |
|
Smart Manufacturing profit/(loss) before tax |
251 |
318 |
(314) |
|
Unallocated (loss)/profit before tax |
(429) |
1,137 |
2,038 |
|
Oxford Metrics Group (loss)/profit before tax |
(666) |
3,669 |
2,782 |
|
Motion Capture (loss)/earnings before interest and tax |
(373) |
2,324 |
1,245 |
|
Smart Manufacturing earnings/(loss) before interest and tax |
290 |
357 |
(271) |
|
Unallocated loss before interest and tax |
(1,243) |
(45) |
(216) |
|
Oxford Metrics Group (loss)/earnings before interest and tax |
(1,326) |
2,636 |
758 |
4. Reconciliation of adjusted profit before tax and adjusted EBIT
|
Six months ended 31 March 2025 |
Six months ended 31 March 2024 Restated |
Year ended 30 September 2024 |
|
|
Oxford Metrics Group |
(unaudited) |
(unaudited) |
(audited) |
|
£'000 |
£'000 |
£'000 |
|
|
(Loss)/profit before tax - continuing operations |
(666) |
3,669 |
2,782 |
|
Share option charges |
139 |
66 |
211 |
|
Amortisation of intangibles arising on acquisition |
393 |
132 |
452 |
|
Acquisition costs |
188 |
179 |
295 |
|
Restructuring costs |
244 |
- |
- |
|
Adjusted profit before tax - continuing operations |
298 |
4,046 |
3,740 |
|
Loss before tax - discontinued operations |
(472) |
(1,658) |
(2,240) |
|
Amortisation of intangibles arising on acquisition |
- |
36 |
72 |
|
Impairment of goodwill |
- |
1,076 |
1,273 |
|
Adjusted loss before tax - discontinued operations |
(472) |
(546) |
(895) |
|
Adjusted (loss)/profit before tax - total operations |
(174) |
3,500 |
2,845 |
|
(Loss)/earnings before interest and tax - continuing operations |
(1,326) |
2,636 |
758 |
|
Adjusting items above |
964 |
377 |
958 |
|
Adjusted (loss)/earnings before interest and tax |
(362) |
3,013 |
1,716 |
|
Adjusted earnings per share for profit on continuing operations attributable to owners of the parent during the year |
||||
|
Basic earnings per share (pence) |
0.12p |
2.63p |
2.96p |
|
|
Diluted earnings per share (pence) |
0.11p |
2.59p |
2.93p |
|
|
Six months ended 31 March 2025 |
Six months ended 31 March 2024 Restated |
Year ended 30 September 2024 |
||
|
Motion Capture |
(unaudited) |
(unaudited) |
(audited) |
|
|
£'000 |
£'000 |
£'000 |
||
|
(Loss)/profit before tax - continuing operations |
(488) |
2,214 |
1,058 |
|
|
Share option charges |
- |
13 |
18 |
|
|
Amortisation of intangibles arising on acquisition |
95 |
95 |
189 |
|
|
Restructuring costs |
245 |
- |
- |
|
|
Group recharges |
657 |
2,000 |
3,654 |
|
|
Adjusted profit before tax - continuing operations |
509 |
4,322 |
4,919 |
|
|
(Loss)/earnings before interest and tax |
(373) |
2,324 |
1,245 |
|
|
Adjusting items above |
997 |
2,108 |
3,861 |
|
|
Adjusted earnings before interest and tax |
624 |
4,432 |
5,106 |
|
|
Six months ended 31 March 2025 |
Six months ended 31 March 2024 |
Year ended 30 September 2024 |
||
|
Smart Manufacturing |
(unaudited) |
(unaudited) |
(audited) |
|
|
£'000 |
£'000 |
£'000 |
||
|
Profit/(loss) before tax - continuing operations |
251 |
318 |
(314) |
|
|
Amortisation of intangibles arising on acquisition |
297 |
37 |
262 |
|
|
Group recharges |
153 |
152 |
304 |
|
|
Adjusted profit before tax - continuing operations |
701 |
507 |
252 |
|
|
Earnings/(loss) before interest and tax |
290 |
357 |
(271) |
|
|
Adjusting items above |
450 |
189 |
566 |
|
|
Adjusted earnings before interest and tax |
740 |
546 |
295 |
|
In the current financial year there has been a change in the way head office expenses are allocated to subsidiaries in the Group to only charge the costs and shared services associated with the individual divisions. This has resulted in an increase in unallocated expenses remaining in Oxford Metrics plc.
5. Taxation
The Group's consolidated effective tax rate for the six months ended 31 March 2025 was 13.0% (for the six months ended 31 March 2024: 29.5%; for the year ended 30 September 2024: credit rate of 40.0%).
In accordance with IAS 34 the tax charge for the half year is calculated on the basis of the estimated full year tax rate.
6. Earnings per share
The calculation of the basic earnings per share is based on the earnings attributable to ordinary shareholders divided by the weighted average number of shares in issue during the period. The calculation of diluted earnings per share is based on the basic earnings per share, adjusted to allow for the issue of shares on the assumed conversion of all dilutive options.
|
31 March 2025 (unaudited) |
31 March 2024 (unaudited) |
30 September 2024 (audited) |
|||||||
|
Earnings/(loss) |
Weighted average number of shares |
Per share amount |
Earnings/(loss) |
Weighted average number of shares |
Per share amount |
Earnings/(loss) |
Weighted average number of shares |
Per share amount |
|
|
£'000 |
'000 |
(pence) |
£'000 |
'000 |
(pence) |
£'000 |
'000 |
(pence) |
|
|
Continuing operations |
|||||||||
|
Basic (loss)/earnings per share |
|||||||||
|
Earnings attributable to ordinary shareholders |
(814) |
128,305 |
(0.63) |
3,071 |
131,236 |
2.34 |
2,931 |
131,338 |
2.24 |
|
Dilutive effect of employee share options |
- |
2,695 |
- |
- |
1,793 |
(0.03) |
- |
1,504 |
(0.02) |
|
Diluted (loss)/earnings per share |
(814) |
131,000 |
(0.63) |
3,071 |
133,029 |
2.31 |
2,931 |
132,842 |
2.22 |
|
Discontinued operations |
|||||||||
|
Basic loss per share |
|||||||||
|
Earnings attributable to ordinary shareholders |
(472) |
128,305 |
(0.37) |
(1,659) |
131,236 |
(1.26) |
(2,173) |
131,338 |
(1.66) |
|
Dilutive effect of employee share options |
- |
2,695 |
- |
- |
1,793 |
- |
- |
1,504 |
- |
|
Diluted loss per share |
(472) |
131,000 |
(0.37) |
(1,659) |
133,029 |
(1.26) |
(2,173) |
132,842 |
(1.66) |
|
Total operations |
|||||||||
|
Basic (loss)/earnings per share |
|||||||||
|
Loss attributable to ordinary shareholders |
(1,286) |
128,305 |
(1.00) |
1,412 |
131,236 |
1.08 |
758 |
131,338 |
0.58 |
|
Dilutive effect of employee share options |
- |
2,695 |
- |
- |
1,793 |
(0.03) |
- |
1,504 |
(0.02) |
|
Diluted (loss)/earnings per share |
(1,286) |
131,000 |
(1.00) |
1,412 |
133,029 |
1.05 |
758 |
132,842 |
0.56 |
7. Share capital
|
31 March |
31 March |
30 September |
|
|
2025 |
2024 |
2024 |
|
|
(unaudited) |
(unaudited) |
(audited) |
|
|
£'000 |
£'000 |
£'000 |
|
|
Allotted, called up and fully paid |
|||
|
125,061,834 shares of 0.25p (31 March 2024: 131,439,635 shares of 0.25p and 30 September 2024: 131,439,635 shares of 0.25p) |
313 |
329 |
329 |
During the six months ended 31 March 2025 there were no share options exercised. There were 13,000 shares issued in respect of share options exercised during the six months ended 31 March 2024 (year ended 30 September 2024: 13,000).
During the six months ended 31 March 2024 there were 1,007,000 shares issued as consideration for the acquisition of Industrial Vision Systems Limited.
On 11 October 2024 the Company announced the return of up to £6.0m of cash to its shareholders through an on-market share buyback programme. All ordinary shares repurchased by the Company under the programme will be cancelled. During the six months ended 31 March 2025 6,378,000 shares were repurchased for a total consideration if £3,598,000.
8. Dividends
The following dividends were recognised as distributions to equity holders in the period:
|
31 March |
31 March |
30 September |
|
|
2025 |
2024 |
2024 |
|
|
(unaudited) |
(unaudited) |
(audited) |
|
|
£'000 |
£'000 |
£'000 |
|
|
Final dividend for 2024 paid in 2025 - 3.25 pence per share |
4,193 |
- |
- |
|
Final dividend for 2023 paid in 2024 - 2.75 pence per share |
- |
3,615 |
3,615 |
|
4,193 |
3,615 |
3,615 |
The final dividend for 2024 was paid to shareholders on 5 March 2025 at 3.25 pence per share, a total of £4,193,000.
9. Business combinations
The Group acquired 100% of the share capital of The Sempre Group Holdings Limited on 10 October 2024 for a total consideration of up to £5.4m. The acquisition has been funded through existing cash resources of £4.9m and up to £0.5m through an earnout contingent on certain performance targets being met.
A provisional valuation of the assets acquired and resulting goodwill has been performed and included within these results. Further detail will be provided in the full Annual Report for the year ending 30 September 2025.
10. Post balance sheet events
The Group acquired 100% of the share capital of Amber Optix Limited on 4 April 2025 for a total consideration of up to £0.8m, including contingent consideration of up to £0.3m dependent upon certain performance targets being met.
11. Copies of the interim statement
Copies of the interim statement will be available from the Company's registered office at 6 Oxford Pioneer Park, Yarnton, Oxfordshire OX5 1QU, and from the Company's website: www.oxfordmetrics.com.