

27 November 2025
Gelion plc
("Gelion" or the "Company")
Final results to 30 June 2025
Breakthrough year with momentum continued in FY26
Gelion (AIM: GELN), the global energy storage innovator, announces its audited final results for the year ended 30 June 2025.
Financial performance
|
· |
First revenue generated, delivering a 36% increase in total income to £2.7 million, consistent with market expectations and marking the company's transition into a commercial revenue phase. |
|
· |
Adjusted EBITDA loss1 reduced by 15% to £4.1 million, £0.2 million better than market projections and driven by financial discipline and operational efficiency. |
|
· |
Operating loss narrowed by 25.7% to £6.0 million, reflecting continued progress in cost management and the efficient execution of development programs. |
|
· |
Balance sheet strengthened through completion of a successful capital raise. |
[1] Adjusted EBITDA loss is a non-statutory measure. The calculation method is shown in Note 29.
Operational and strategic progress
|
· |
Strategic Collaborations and Industry Recognition: Expanded global strategic partner network, signing agreements with Max Planck Institute of Colloids and Interfaces (MPI), Materials Testing Agreement (MTA) with TDK Corporation and collaborations with University of Nottingham and UKRI. |
|
· |
Strong Technological Progress across the entire battery supply chain: With the commissioning of advanced capabilities in Sydney and UK, Gelion's sulfur technologies and lithium recycling technology has seen consistent, strong progress and promising results. |
|
· |
Breakthrough Na-S Performance: Successfully integrated MPI's advanced materials into Room Temperature Sodium Sulfur (Na-S) coin cells, delivering industry-leading results, including longer battery life, higher energy retention and higher power performance. |
Post-period end highlights
|
· |
Integration of MPI Technology: Successful transfer of proprietary Sulfur Cathode Active Material (CAM) technology from MPI in Gelion's ACPC, enabling the acceleration of its Sulfur CAM and collaborative development programmes of its Li-S and Room Temperature Sodium Sulfur Battery technologies. |
|
· |
Full Collaboration Agreement with TDK Corporation: Signed full collaboration agreement with TDK, the Japan headquartered global electronics and battery manufacturer. Progressed from MTA to a multi-year Collaboration Agreement to progress to commercial pouch cells prototype and qualification of battery cell manufacturing within the next 12 months. |
|
· |
Breakthrough Li-S Performance: Successfully integrated MPI's advanced materials into Lithium Sulfur (Li-S) coin cells, delivering industry-leading results, including longer battery life, higher energy retention and higher power performance. |
|
· |
OXLiD receives ARMD4 Grant: UK Government grant funding under the DRIVE35 programme, facilitated by the Advanced Propulsion Centre UK. Gelion will collaborate with QinetiQ to scale-up and independently validate Gelion's next-generation lithium-sulfur (Li-S) technology in high-energy multi-layer pouch cells. |
|
· |
Strengthened Balance Sheet: Raised £10.5m in an oversubscribed capital raise (November 2025) from existing and new investors, positioning the Company for the next stage of growth. |
John Wood, CEO of Gelion, commented: "2025 has been a defining year for Gelion, marked by major breakthroughs in Sulfur battery technology and the formation of powerful global partnerships that accelerate our path to commercialisation. Our collaborations with the Max Planck Institute, TDK and QinetiQ, are testament to the milestones achieved in the past year and reinforce the unique performance potential of our Lithium-Sulfur (Li-S) and room temperature Sodium Sulfur (Na-S) battery systems, and our position at the forefront of this emerging field.
"We continued to strengthen our financial and operational foundations during the year, delivered first commercial revenues in our Integration Solutions business, and advanced our lithium-ion recycling capabilities, all while maintaining disciplined execution.
"With strong partner engagement, growing validation from Tier-1 manufacturers such as TDK, and the support shown in our oversubscribed £10.5 million fundraise post year end, we are confident in our strategy and the scale of the opportunity ahead. We are helping to unlock the next generation of energy storage and build a more resilient, accessible and sustainable global battery supply chain."
Annual Report
The FY 2025 Annual Report can be viewed and downloaded from the Company's website: https://gelion.com/investors/financial-reports-documents-notices/
Enquiries:
|
Gelion plc |
via Alma |
|
Strand Hanson Limited (Nominated and Financial Adviser) |
+44 (0) 20 7409 3494 |
|
Oberon Capital (Joint Broker) |
+44 (0) 20 3179 5300 |
|
Allenby Capital Limited (Joint Broker) Jos Pinnington / Lauren Wright (Sales and Corporate Broking) Alex Brearley / Ashur Joseph (Corporate Finance) |
+44 (0) 20 3328 5656 |
|
Alma Strategic Communications (Financial PR) |
+44 (0) 20 3405 0205 |
About Gelion
Gelion ("gel: ion") is a global energy storage innovator, supporting the transition to a more sustainable economy by commercialising globally important next generation battery technologies: Sulfur based, Lithium-Sulfur (Li-S), Sodium-Sulfur (Na-S) and Zinc-based (Zn) hybrid cells to electrify mobile and stationary applications and battery recycling technology.
Gelion plc is quoted on the London Stock Exchange's AIM Market and wholly owns UK based OXLiD Ltd and Battery Minerals Ltd and Australia based Gelion Technologies Pty Ltd. Gelion is designing and delivering innovative battery technology to enable that transition and return value for its customers and investors.
In addition, Gelion is also delivering commercial Battery Energy Storage Systems (BESS) projects through its Integration Solutions business.
Sulfur Batteries
Gelion's effort is directed at the potential for sulfur-based cathode active materials (CAMs) to deliver low-cost & sustainable batteries with compelling performance. In the case of Li-S batteries, the target is a high-performance light-weight battery for the EV and e-aviation market. In the case of Na-S batteries, the target is an ultra-low-cost advancement on batteries currently employed in the stationary storage and economy EV market. The Company's overarching goal is to help make global transport, energy consumption and storage more sustainable.
Glossary
|
Ah |
Ampere hours. A measure of capacity stored in the cell. The larger the number the higher the capacity. |
|
mAh/g(S) |
The unit mAh/g(S) stands for milliampere-hours per gram of Sulfur (with S indicating "Sulfur"). It is a measure quantifying how many electrons (in mAh) can be stored per gram of Sulfur. |
|
CAM |
Cathode active material |
|
Energy density (Wh/kg) |
The ratio of energy stored per unit weight i.e. Watt-hours per kilogram. The higher the number the lighter the battery. |
|
Pouch cell |
An industry standard format of a battery which comprises a flat pouch-shaped design with a multi-layered laminate structure. |
|
Cycle life |
The number of full charge and discharge cycles a battery can complete before its capacity falls below a specified level, typically 80% of the original capacity. Higher cycle life indicates longer-lasting performance. |
Chairman's statement
This was the year Gelion achieved the breakthrough that moves us from an innovator to a genuine disruptor in global energy storage. The step-change came with our success in placing sulfur and sodium -two of the most abundant elements, globally, at the heart of the next-generation of battery technology. Gelion's sulfur-based cathodes are inexpensive and do not use elements associated with conflict or high cost such as cobalt, nickel or manganese.
Gelion's Li-S battery results show superior power capability and outstanding longevity in coin cells and have been independently validated by TDK Corporation. The test results establish that the performance of Gelion's new Li-S battery exceeds certain key performance when compared to incumbent technologies while meeting industry standard in others. This followed similarly exciting test results earlier in the year for Gelion's Sodium-Sulfur (Na-S) battery technology. These achievements were delivered earlier in Gelion's development journey than anticipated. As a result, 2025 saw a shift to a new level of performance, creating an innovative platform technology with the capacity to support multiple different industries and applications.
Industry Partnerships and Depoliticising Batteries
Post year-end, Gelion signed a full collaboration agreement with TDK Corporation, the Japan headquartered global electronics and battery manufacturer with over 100,000 employees worldwide, to facilitate the development of large format commercial pouch cell prototypes (type of rechargeable batteries) and is also receiving interest from other global players. These companies are actively seeking new avenues of competitive advantage, and Gelion's materials model - supplying materials rather than competing with manufacturers - is resonating strongly. Choosing the right partners will be critical, and this requires careful consideration not only of commercial f it, but also of macroeconomic factors and geopolitical realities.
By being selective, we must ensure that collaborations accelerate both Gelion's growth and the global rollout of our technology. This has been demonstrated by the agreement with TDK. Working alongside one of the world's great innovation centres that lives its brand identity, towards realising the potential of our next-generation battery technologies, marks a significant inflection point for Gelion. In recent years, the use of critical minerals from restricted geological sources has made battery manufacturing a sensitive issue. By focusing on abundant materials such as sulfur and sodium, Gelion is helping depoliticise battery supply chains.
As production accelerates, this will have an increasingly positive impact on the environment and society, as well as on the industry itself, through reducing pressure on finite resources and unlocking existing restrictions around battery technologies in many regions.
Board commitment and leadership
I would like to thank everyone involved in making 2025 such a success. Gelion has a highly committed group of stakeholders that go beyond the call of duty to address every aspect of their responsibilities. Every Board member feels a collective responsibility for shareholder funds, along with a closely associated focus on meeting required investor outcomes. For this reason, all members continued to collaborate closely with the Executive team in 2025 to help drive the best possible performance. I'm pleased to note that the Board has participated in every capital raise round including buying shares on the market, thereby demonstrating their support for the business.
Furthermore, we were pleased to welcome Dr. Graham Cooley to the Board in 2025. With more than three decades of experience in the power, energy storage, and hydrogen sectors, he has already added valuable perspective. I must also highlight the continued contribution by the executive team, led by CEO John Wood, who have worked extremely hard to integrate novel material science in achieving the breakthroughs of this year.
Looking ahead
We have over-achieved on our technical progress and, following the successful capital raise post year-end, are well positioned financially.
The Group raised £10.5m via an oversubscribed placing, subscription and retail offer in November 2025, providing Gelion with the opportunity to significantly strengthen our position in the world of battery technology innovation. I would like to thank all new and existing shareholders who participated in the fundraise, the Board is very grateful for the support being extended to our business. We are now in a stronger position than ever to realise of the full value of our technology and continue to finance our commercialisation plans.
I am encouraged by the calibre of partners we have attracted to date, and the continued and strong interest shown throughout the industry. I have every confidence we will continue to be of real interest to industrial and financial partners, as we are convinced, of the prospect of our technologies to create real change and drive great value. Meanwhile, we will continue to take an open and adaptable approach to problem-solving, based on the collective capability and strength of the extended Gelion team.
The Company is already far ahead of expectations with both Li-S and Na-S technologies and Gelion is technically in its most promising position to date. I look ahead to the rest of 2025 and beyond with enthusiasm for what we can achieve.
Dr Steve Mahon
Chairman
26 November 2025
CEO statement
2025 has been a transformative year for Gelion.
Our focus this year has been to:
1. Continue and advance aggressively our very deliberate path to industry leadership in Sulfur battery technology to set a platform for its successful commercialisation and scaling on a capital-light path by combining great science with the maximisation of supply chain collaboration.
2. Ensure that our technology assets and the talents of our team are focussed toward delivering commercial outcomes by direct engagement with market leading battery companies and other industry participants.
3. Progress the development of relationships and collaboration within these companies and others to establish Gelion into the global supply chain.
These efforts led to the multi-year collaborations with the Max Planck Institute of Colloids and Interfaces on technology, along with the agreement that has been put in place for sulfur battery prototyping and preparation for pilot manufacturing testing with TDK, and the commencement of the DRIVE35 programme in partnership with QinetiQ, all of which have strengthened the positioning of our Sulfur Battery technology and clarified the unique proposition we are establishing.
On the technology front, the year saw important breakthroughs in the performance of both our Li-S and Room Temperature Na-S battery technologies. This technological and commercial progression is increasingly developing recognition for Gelion as a leader in unlocking the significant potential of Sulfur-based batteries. Known for having exceptional gravimetric energy (light batteries), Sulfur battery technology has in the past been held back by constraints in power, cycle life and operating temperature. Although we are still in the development phase and face associated technology and execution risks, we are confident our technology offers a clear path to overcoming these challenges.
Our Sulfur technology not only has the potential to outperform alternative Sulfur battery technologies but also the incumbent and emerging alternatives.
Our ambition is to deliver:
· Nickel Manganese Cobalt (NMC) level performance from a Sulfur cathode cell (at a price comparable to Lithium Ferrous Phosphate (LFP)) that utilizes standard electrolytes and anodes which are conventional Lithium-ion technologies.
· LFP-like performance at a substantially lower cost with Gelion's RT Na-S systems.
· In addition, our platform is designed to integrate with lithium metal anodes for high-performance "Halo" applications requiring maximum energy density and high performance.
Key performance highlights:
· Total income growth including recognition of first revenue and continued reduction in Adjusted EBITDA losses.
· Focused R&D programs enabling efficient capital deployment and reduced operating expenses.
· Increase in government support and non-dilutive funding, both in the UK and Australia.
Strategic partnerships driving success
Gelion's progress reflects the success of our strategic partnership approach to developing our proprietary technology, in particular, for this year our collaborations with the Max Planck Institute of Colloids and Interfaces (MPI), TDK and QinetiQ. Integrating MPI's technology into our Sulfur technology has enabled us to create a high energy, high power, long cycle life battery that uses light, abundant and low-cost materials as alternatives instead of critical and expensive minerals such as nickel, cobalt and manganese currently used in battery production. Our tests have indicated our new Sulfur-based technology is on track to have the capability to outperform today's leading NMC technology.
These results have been independently validated by Tier-1 manufacturers, providing compelling third-party endorsement. The exceptional performance and stability of our sulfur cathode material underscore our technology's potential across a range of sectors, including electric vehicles, high end transportation, drones and grid-scale storage systems.
Focus on maximising returns
In 2025, Gelion's primary focus was on the Sulfur technology given its potential to deliver significant returns for our stakeholders and this required reallocation of resources from zinc.
We advanced the capabilities of Battery Minerals, the lithium-ion recycling business, with strong grant support. Exciting progress has been made including the commissioning of the new London-based testing facility and recent patent grants (in the UK, US, and Europe) for lithium extraction from black mass and the more recent testing results confirming >80% of lithium extraction from customer black masses.
Our new Integration Solutions business secured its first commercial order from Group Energy Pty Ltd (part of the Borg Group) and installation was successfully completed leading to our first commercial revenue. There is significant scope for future expansion across further Borg Group sites and other customers across Australia.
Our operating approach
We are committed to running a disciplined and efficient operation to maximise shareholder value and that is clearly reflected in the improved financial performance over the past three years. As part of this focused approach, we have accessed non-dilutive capital such as government grants, both from the British and Australian governments in targeted and effective ways. These grants allow Gelion to accelerate technology development and commercialisation without shareholder dilution, supporting vital workstreams such as material scale up, manufacturing optimisation, safety validation, and partnerships.
The breakthroughs achieved this year involved overcoming exceptionally challenging issues, and I must congratulate everyone involved, the Board, the entire team at Gelion, our valued partners and of course, I thank our shareholders for placing their trust in us.
Looking ahead
Building on this year's momentum, we remain committed to executing our growth strategy. Our successful approach to date is based on sharing the same cultural values as our global partners, and we will continue to build on our existing partnerships and leverage new ones with leading battery manufacturers to develop first commercial prototype pouch cells for validation and market development and then to scale production to realise commercial potential.
Specifically by the end of calendar 2026 we intend to have produced Commercial prototype pouch cells of our high performance Lithium Metal anode based Li-S cells in all of USA, UK and Asia, advanced the materials fabrication scaling of the materials for these cells, and, advanced the testing and validation of our drop in Li-S and RT Na-S cells and the process realisation for the pre-metalation processes associated with these materials. We plan also to continue to advance our collaboration activities right across the full supply chain from government, through technology, to cell manufacture, and application leaders.
The future benefits of our achievements have the potential to extend far beyond Gelion and our immediate stakeholders. We have the potential to become an important partner to the world's leading battery manufacturers, helping to revolutionise global supply chains. I believe that the 'democratisation' of battery materials that we are delivering, enabled by abundant and accessible materials, will be essential in accelerating the shift towards clean energy across multiple market sectors.
Post period-end, we successfully raised gross proceeds of £10.5 million in an oversubscribed capital raise round, demonstrating strong investor confidence and support. Realising the full potential of our technology will continue to require disciplined execution and targeted investment. With the strengthened financial position, we are well-capitalised and confident that the combination of our technology platform and strategic partnerships positions Gelion to seize significant opportunities. By pursuing this path with focus and ambition, we are not only building a business with enormous growth potential but also contributing to the wider transformation of global energy solutions.
John Wood
CEO
26 November 2025
CFO statement
Overview
FY25 marks a breakthrough year for Gelion, setting new benchmarks in both financial and operational performance. The business has transitioned decisively from preparation phase to tangible delivery, resulting in our very first commercial sale from the Integration Solutions team and increased market recognition through the MTA with a Tier one global battery manufacturer.
Gelion's key financial metrics have continued to improve significantly since FY23, underscoring the effectiveness of our focused strategy and rigorous cost discipline.
Our strategic initiatives have translated into concrete progress, including:
· Revenue and margin generation from the Integration Solutions business
· Grant income from UK and Australian governments and associated organisations
· A step-change in commercial traction with the launch of Integration Solutions and the Collaboration Agreement with TDK
· A substantial improvement in Adjusted EBITDA loss
These results confirm that Gelion's transformation is well underway, with solid progress demonstrated through partnerships with leading players in the battery industry.
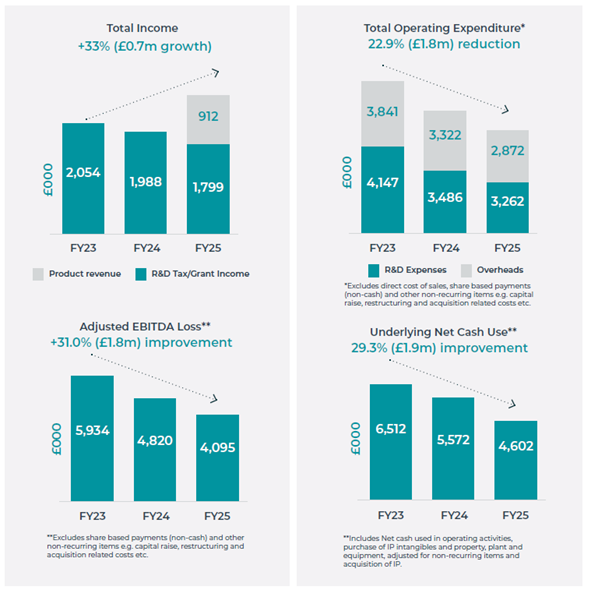
Total income increased by 36.4% to £2.7 million (FY24: £2.0million), primarily driven by:
· Revenue recognition of £0.9m from the first Integration Solutions commercial sale; and
· partially offset by a reduction in other income reflecting lower R&D tax incentives / credit due to both, a reduced R&D spend and a lower proportion claimable in the UK relative to Australia.
This significant milestone of generating product revenue affirms both the strength of the Company's technology roadmap and the effectiveness of its commercial strategy. Adjusted EBITDA loss improved significantly too, reducing by £0.7 million to £4.1 million (FY24: £4.8 million).
This improvement reflects a disciplined balance between continued investment in innovation and tighter cost control with none of the Gelion team taking cash bonuses this year or prior year. Operating losses before non-recurring items reduced to £5.3m (2024: £6.5m), a 19.1% improvement and primarily driven by:
· a £0.2m decrease in R&D spend, reflecting the establishment of focused R&D programmes and lower IP-related costs following the FY24 IP review;
· a £0.4m decrease in administrative costs achieved through lower legal, consulting, other discretionary expenses and lower average employee expenses due to change in team structure; and
· a £0.4m decrease in non-cash costs (share-based payments expenses, depreciation & amortisation).
Non-recurring items of £0.8m (2024: £1.6m) comprised costs associated with capital raising, business restructuring, and non-cash losses from the write-off of intellectual property and disposal of tangible assets.
The combination of income growth, reduced opex and improvement in Adjusted EBITDA loss reflects the Company's commitment to both innovation and disciplined execution. These positive trends demonstrate Gelion's ability to translate its strategic priorities into improved financial outcomes, positioning the business for sustainable value creation.
Financial Performance
Statement of Financial Position and Cash Flows
As at 30 June 2025, Gelion's net assets amounts to £10.0 million (2024: £12.0 million) with current assets of £4.4 million (2024: £5.9 million), including cash and cash equivalents of £2.7 million (2024: £3.8 million). The reduction in cash reflects the continued support of operational activities. On a pro forma basis, including anticipated R&D tax incentives and other government tax receivables, cash and cash equivalents stood at £4.1 million (2024: £5.4 million).
Non-current assets totalled £7.0 million (2024: £7.7 million), primarily representing goodwill after adjusting for amortisation and investment in intangible assets, mainly intellectual property. Other receivables and trade payables have remained broadly consistent with prior year levels.
During the year, Gelion raised £4.4 million (gross) through share placings to support the Company's development initiatives and growth strategy.
Post period end, we successfully completed a £10.5 million capital raise (£9.9 million net), reflecting strong support from both new and existing investors. The funds significantly strengthen our balance sheet and we are well placed to advance our development plans.
Research and Development
We drove our innovation agenda forward, directing resources to programs with the highest commercial readiness and strategic relevance. R&D spending was efficiently managed to ensure maximum leverage from grant funding while simultaneously accelerating focused development programs towards commercialisation.
Foreign Currency Exposure
Gelion's currency risk profile remains well-controlled, supported by active management of procurement and funding streams. As we look to broader commercial expansion, further currency risk mitigation strategies will be deployed as required.
Outlook
Gelion has continued to make tangible progress in FY25, achieving important technological and commercial milestones that validate both our strategy and the capabilities of our team. The successful completion of the recent £10.5 million capital raise has strengthened our balance sheet, providing the resources to pursue the opportunities ahead. A disciplined approach to resource allocation, combined with strengthened financial position, will be key as we move into FY26 and beyond.
The accelerating energy transition and evolving global market dynamics present attractive opportunities for innovative companies such as Gelion. Our differentiated technology, strong partnerships, and ongoing commercial engagement position us to capture these opportunities selectively and responsibly. We will continue to balance investment in innovation and market penetration with prudent financial management to ensure long-term value creation.
As we enter FY26, we do so with focus and determination, acknowledging both the potential and the challenges ahead. I would like to thank our shareholders, partners, and employees for their continued support as we work together to advance Gelion's strategy and deliver sustainable value.
Amit Gupta
CFO
26 November 2025
Consolidated Statement of Comprehensive Income
|
Year ended 30 June |
|||
|
Notes |
2025 £'000 |
2024 £'000 |
|
|
Revenue from contracts with customers |
4 |
912 |
- |
|
Other income |
5 |
1,799 |
1,988 |
|
Total income |
2,711 |
1,988 |
|
|
Research and development expenses |
(3,262) |
(3,486) |
|
|
Administrative expenses |
(2,873) |
(3,322) |
|
|
Direct costs |
(671) |
- |
|
|
Share-based payments expense |
(574) |
(986) |
|
|
Depreciation and amortisation |
(593) |
(700) |
|
|
Operating loss before non-recurring items |
6 |
(5,262) |
(6,506) |
|
Non-recurring items: |
7 |
||
|
Loss on write-off of IP intangibles and disposal of property, plant and equipment |
(346) |
(1,236) |
|
|
Capital raising and acquisition related costs |
(301) |
(363) |
|
|
Business restructure and other costs |
(114) |
- |
|
|
Total non-recurring items |
(761) |
(1,599) |
|
|
Operating loss |
(6,023) |
(8,105) |
|
|
Finance costs |
(27) |
(3) |
|
|
Finance income |
47 |
149 |
|
|
Loss on ordinary activities before taxation |
(6,003) |
(7,959) |
|
|
Tax income |
9 |
19 |
11 |
|
Loss on ordinary activities after taxation |
(5,984) |
(7,948) |
|
|
Total loss for the year attributable to equity holders of the parent |
|||
|
Other comprehensive income: |
|||
|
Items that may be reclassified to profit or loss |
|||
|
- Exchange losses arising on translation of foreign operations |
10 |
(556) |
(27) |
|
Total comprehensive loss for the year attributable to equity holders of the parent |
(6,540) |
(7,975) |
|
|
Loss per share (basic and diluted) attributable to the equity holders (pence) |
12 |
(4.1) |
(6.4) |
|
The above results relate entirely to continuing activities. Result for year ending 30 June 2024 include the results of OXLiD Ltd from the date of acquisition, more details in note 13. The accompanying notes form part of this financial information. |
|||
Consolidated Balance Sheet
|
As at 30 June |
|||
|
Notes |
2025 £'000 |
2024 £'000 |
|
|
Assets |
|||
|
Non-current assets |
|||
|
Intangible assets |
14 |
6,104 |
6,614 |
|
Property, plant and equipment |
16 |
874 |
1,069 |
|
Current assets |
|||
|
Cash and cash equivalents |
18 |
2,661 |
3,792 |
|
Other receivables |
19 |
1,719 |
2,118 |
|
Total Assets |
11,358 |
13,593 |
|
|
Liabilities |
|||
|
Current liabilities |
|||
|
Trade and other payables |
17, 20 |
1,014 |
1,250 |
|
Non-current liabilities |
|||
|
Trade and other payables |
17, 20 |
72 |
55 |
|
Deferred tax liabilities |
21 |
301 |
320 |
|
Total liabilities |
1,387 |
1,625 |
|
|
Net assets |
9,971 |
11,968 |
|
|
Equity |
|||
|
Issued capital |
22 |
177 |
136 |
|
Share premium account |
22 |
28,415 |
24,487 |
|
Other non-distributable reserves |
22 |
8,895 |
8,877 |
|
Capital reduction reserve |
22 |
11,194 |
11,194 |
|
Accumulated losses |
(38,710) |
(32,726) |
|
|
Total equity |
9,971 |
11,968 |
|
|
The financial statements of Gelion Plc, company registration number 09796512, were approved by the Directors and authorised for issue on 26 November 2025. The accompanying notes form part of this financial information. |
|||
Consolidated Statement of Cash Flows
|
Year ended 30 June |
|||
|
Notes |
2025 £'000 |
2024 £'000 |
|
|
Cash flow from operating activities |
|||
|
Loss for the year before tax and exchange losses |
(6,003) |
(7,959) |
|
|
Adjustments for: |
|||
|
Depreciation & amortisation |
593 |
700 |
|
|
Net finance income |
(20) |
(146) |
|
|
Loss on disposal of property, plant and equipment and write-off of IP intangibles |
346 |
1,236 |
|
|
Share-based payments expense |
574 |
986 |
|
|
Changes in operating assets/liabilities |
|||
|
Decrease in receivables |
239 |
107 |
|
|
Decrease in prepayments |
9 |
35 |
|
|
(Decrease)/Increase in payables |
(193) |
508 |
|
|
Net cash used in operating activities |
(4,455) |
(4,533) |
|
|
Cash flows from investing activities |
|||
|
Purchase of intangible assets |
(318) |
(838) |
|
|
Sale of property, plant and equipment |
2 |
- |
|
|
Purchase of tangible property, plant and equipment |
(165) |
(589) |
|
|
Acquisition of subsidiary, net of cash acquired |
- |
(1,226) |
|
|
Other investment - escrow account |
- |
(133) |
|
|
Interest received |
46 |
153 |
|
|
Net cash used in investing activities |
(435) |
(2,633) |
|
|
Cash flows from financing activities |
|||
|
Proceeds f rom issue of shares |
4,420 |
4,100 |
|
|
Transaction costs of issue of shares |
(451) |
(348) |
|
|
Repayment of leasing liabilities |
(16) |
(47) |
|
|
Net cash used in financing activities |
3,953 |
3,705 |
|
|
Net decrease in cash held |
(937) |
(3,461) |
|
|
Cash and cash equivalents at beginning of financial year |
3,792 |
7,268 |
|
|
Effect of exchange rate changes |
(194) |
(15) |
|
|
Cash and cash equivalents at end of financial year |
18 |
2,661 |
3,792 |
|
The accompanying notes form part of this financial information. |
|||
Consolidated Statement of Changes in Equity
|
Share capital £'000 |
Share premium £'000 |
Accu-mulated losses £'000 |
Capital reduction reserve £'000 |
Other non-distributable reserves £'000 |
Total £'000 |
|
|
Balance at 1 July 2023 |
108 |
20,752 |
(24,778) |
11,194 |
5,328 |
12,604 |
|
Loss on ordinary activities after taxation |
- |
- |
(7,948) |
- |
- |
(7,948) |
|
Other comprehensive income |
- |
- |
- |
- |
(27) |
(27) |
|
Total comprehensive loss for the year |
- |
- |
(7,948) |
- |
(27) |
(7,975) |
|
Contributions by and distributions to owners: |
||||||
|
Merger relief reserve (fair value of shares issued on acquisition) |
11 |
- |
- |
- |
2,590 |
2,601 |
|
Share-based payment charge |
- |
- |
- |
- |
986 |
986 |
|
Shares issued during the period |
17 |
4,083 |
- |
- |
- |
4,100 |
|
Costs of shares issued |
- |
(348) |
- |
- |
- |
(348) |
|
Total contributions by and distributions to owners: |
28 |
3,735 |
- |
- |
3,576 |
7,339 |
|
Balance at 30 June 2024 |
136 |
24,487 |
(32,726) |
11,194 |
8,877 |
11,968 |
|
Balance at 1 July 2024 |
136 |
24,487 |
(32,726) |
11,194 |
8,877 |
11,968 |
|
Loss on ordinary activities after taxation |
- |
- |
(5,984) |
- |
- |
(5,984) |
|
Other comprehensive income |
- |
- |
- |
- |
(556) |
(556) |
|
Total comprehensive loss for the year |
- |
- |
(5,984) |
- |
(556) |
(6,540) |
|
Contributions by and distributions to owners: |
||||||
|
Share-based payment charge |
- |
- |
- |
- |
574 |
574 |
|
Shares issued during the period |
41 |
4,379 |
- |
- |
- |
4,420 |
|
Costs of shares issued |
- |
(451) |
- |
- |
- |
(451) |
|
Total contributions by and distributions to owners: |
41 |
3,928 |
- |
- |
574 |
4,543 |
|
Balance at 30 June 2025 |
177 |
28,415 |
(38,710) |
11,194 |
8,895 |
9,971 |
|
The accompanying notes form part of this 2025 financial information. |
||||||
Notes to the Consolidated Financial Statements
1. General Information
Gelion Plc ('Gelion' or the 'Company') is a 100% owner of:
• Gelion Technologies Pty Ltd, an Australian subsidiary that conducts research and development in respect of an innovative battery system and associated industrial design and manufacturing; and
• OXLiD Ltd, a UK subsidiary which is involved in the research and development of lithium-sulphur battery technology; and
• Battery Minerals Ltd, a UK subsidiary which is involved in the recycling of lithium-ion battery technology.
Gelion is a public limited company, limited by shares, incorporated and domiciled in England and Wales. The Company was incorporated on 26 September 2015. The registered office of the Company is at c/o Armstrong, Level 4 LDN:W, 3 Noble Street London EC2V 7EE. The registered company number is 09796512.
Gelion Plc was incorporated as Gelion UK Ltd. On 12 November 2021, the Company was re-registered as a public limited company under the Companies Act and its name was changed to Gelion Plc.
The Board, Directors and management referred to in this document refers to the Board, Directors and management of Gelion.
2. Accounting Policies
2.1 Basis of preparation
The principal accounting policies applied in the preparation of the Group financial statements are set out below. These policies have been consistently applied to the period presented, unless otherwise stated.
These financial statements have been prepared in accordance with UK-adopted International Accounting Standards and International Accounting Standards as issued by the International Accounting Standards Board (IASB) and Interpretations.
The preparation of financial statements in compliance with UK-adopted International Accounting Standards requires the use of certain critical accounting estimates. It also requires Group management to exercise judgement in applying the Group's accounting policies. The areas where significant judgements and estimates have been made in preparing the financial statements and their effect are disclosed in note 2.21.
These financial statements are presented in Great British Pounds (GBP) unless otherwise stated, which is the Company's presentational currency and the parent company's functional currency. Amounts are rounded to the nearest thousand, unless otherwise stated. The functional currency of the subsidiaries are both Great British Pounds (GBP) and Australian Dollars (AUD). Some numerical figures included in this Annual Report have been subject to rounding adjustments. The policies adopted for translation of the subsidiary's assets, liabilities, income and expenses are set out in note 2.17.
2.2 Basis of Consolidation
The consolidated financial statements consolidate the financial statements of Gelion Plc and of its subsidiary undertakings drawn up to each reporting date.
Where the Company has control over an investee, it is classified as a subsidiary. The Company controls an investee if all three of the following elements are present: power over the investee, exposure to variable returns from the investee, and the ability of the investor to use its power to affect those variable returns. Control is reassessed whenever facts and circumstances indicate that there may be a change in any of the elements of control.
Profit or loss and each component of other comprehensive income are attributed to the equity holders of the parent of the Group. When necessary, adjustments are made to the financial statements of subsidiaries to bring their accounting policies in line with the Group's accounting policies. All intra-group assets and liabilities, equity, income, expenses and cash flows relating to transactions between members of the Group are eliminated in full on consolidation.
The following were subsidiary undertakings of the Group:
|
Name |
Registered office |
Class of shares |
Holding |
|
Gelion Technologies Pty Limited |
Australia |
Ordinary A |
100% |
|
OXLiD Ltd |
UK |
Ordinary A |
100% |
|
Battery Minerals Ltd |
UK |
Ordinary A |
100% |
The shareholdings are held directly.
The registered office of Gelion Technologies Pty Limited is Level 16, 101 Miller Street, North Sydney, NSW 2060.
The registered office of OXLiD Ltd and Battery Minerals Ltd is c/o Armstrong, Level 4 LDN:W, 3 Noble Street London EC2V 7EE.
2.3 Going concern
The financial statements have been prepared on a going concern basis which assumes that the Group will have sufficient funds available to enable it to continue to trade for the foreseeable future being a period of at least 12 months from the date of approval of these financial statements. In making their assessment that this assumption is correct, the Directors have undertaken an in-depth review of the business, its current prospects, and cash resources as set out below, which requires significant judgment.
The Company is a holding entity and as such its going concern is dependent on the Group. Therefore the going concern assessment for the Company was performed as part of the Group's assessment.
The Group meets its normal working capital requirements through existing cash resources which, at 30 June 2025, comprised £2.7 million in cash at bank. Furthermore, £1.3 million in receivables from the R&D tax incentive and RDEC refunds, and £0.1m in other tax receivables from the Australian and the UK tax authorities were received subsequent to 30 June 2025. The Group's pro forma cash position at 30 June 2025 therefore equals £4.1 million. In addition, the Group recently completed a gross capital raise of £10.5 million, of which it received net proceeds of £9.9 million in November 2025 after related expenses.
In determining the going concern status of the business, the Directors have reviewed the Group's cash flow forecast for the period to 31 December 2026 ("the going concern period"), including a reasonably possible downside sensitivity of a 10% increase in non-controllable operating costs (excluding payroll).
At the end of the going concern period, the Group is forecast to retain a reasonable proportion of the funds raised in the recent capital raise. As a worst-case scenario, if no further cash receipts were received through R&D tax incentives, RDEC refunds, and grant income between the date of approval of these financial statements and 31 December 2026 with no mitigating actions being taken, the Group would still retain a positive cash balance at the end of the going concern period.
After due consideration of the forecast and current cash resources including the capital raise approved on 5 November 2025, the Directors confirm that they are satisfied that the Group and Company will be able to continue to operate and meet its liabilities as they fall due over the going concern period to 31 December 2026. Accordingly, the Board has concluded that the going concern basis of preparation of the Group and Company Financial Statements is appropriate and that there are no material uncertainties that would cast doubt on that basis of preparation.
2.4 Revenue
Under IFRS 15, an entity recognises revenue when a performance obligation is satisfied, i.e. when control of the goods or services underlying the particular performance obligation is transferred to the customer. Revenue is measured at the fair value of the consideration received or receivable.
The BESS (Battery Energy Storage System) contracts are fixed-price and are treated as a single performance obligation, as the components and related services are highly interdependent and do not have standalone value to the customer. Revenue is recognised at a point in time, which occurs when control of the completed system transfers to the customer, typically upon delivery, customer acceptance, and/or installation.
Judgement is required in assessing the point at which control transfers, including consideration of contractual acceptance provisions and the customer's ability to direct the use of, and obtain the benefits from the system.
Amounts invoiced are recorded as trade receivables when the right to payment is unconditional. Where revenue recognised at the year end date is more than amounts invoiced, the Group recognises accrued income for the difference. Prior to the point of revenue recognition, costs incurred are recorded as work-in-progress within inventory. Advance payments from customers are recognised as contract liabilities and are released to revenue when the performance obligation is satisfied.
2.5 Other Income
Other Income Includes:
• Government grants: Grants that compensate the Group for expenses incurred are recognised in the income statement on a systematic basis in the same periods in which the expenses are recognised under IAS 20 'Accounting for Government Grants and Disclosures'. Submissions are made for pre-arranged time periods with timing differences recognised within accrued or deferred income.
• R&D tax Incentives (Australia): primarily relate to research and development incentives. This represents a refundable tax offset that is available on eligible R&D expenditure incurred by the Group. These are not recognised until there is reasonable assurance that the Group will comply with the conditions attaching to them and that the incentives will be received. Government grants that are receivable as compensation for expenses or losses already incurred or for the purpose of giving immediate financial support to the Group with no future related costs are recognised in profit or loss in the period in which they become receivable.
• R&D tax credits (UK): The Group claims R&D Expenditure Credit ('RDEC') on the costs it incurs in its research and development projects. RDEC is considered taxable income and therefore the Group records the RDEC under Other income in the statement of comprehensive income, and the associated tax charge levied against this income is recorded in the taxation line. The income is recognised on the performance model under IAS 20 'Accounting for Government Grants and Disclosures'.
2.6 Taxation
The income tax expense or benefit for the period is the tax payable on the current periods taxable income based on the national income tax rate for each jurisdiction, adjusted by changes in deferred tax assets and liabilities attributable to temporary differences, unused tax losses and adjustments recognised for prior periods where applicable.
Deferred tax assets relating to temporary differences and unused tax losses are recognised only to the extent that it is probable that future taxable profit will be available against which the benefits of the deferred tax asset can be utilised. Deferred tax assets and liabilities are offset when there is a legally enforceable right to offset current tax assets and liabilities and when the deferred tax balances relate to the same taxation authority.
Current tax assets and tax liabilities are offset where the entity has a legally enforceable right to offset and intends either to settle on a net basis, or to realise the asset and settle the liability simultaneously.
Current and deferred tax is recognised in profit or loss, except to the extent that it relates to items recognised in other comprehensive income or directly in equity. In this case, the tax is also recognised in other comprehensive income or directly in equity, respectively.
2.7 Earnings/loss per share
Basic earnings/loss per share
Basic earnings/loss per share Is calculated by dividing:
• the profit or loss attributable to owners of Gelion Plc, excluding any costs of servicing equity other than Ordinary Shares; by
• the weighted average number of Ordinary Shares outstanding during the financial year, adjusted for bonus elements in Ordinary Shares issued during the financial year.
Diluted earnings/loss per share
Diluted earnings/loss per share adjusts the figures used in the determination of basic earnings/loss per share to take into account:
• the after-income tax effect of interest and other financing costs associated with dilutive potential Ordinary Shares; and
• the weighted average number of shares assumed to have been issued for no consideration in relation to dilutive potential Ordinary Shares.
2.8 Cash and cash equivalents
For the purpose of presentation in the Statement of Cash Flows, cash and cash equivalents includes cash on hand, deposits held at call with financial institutions, other short-term highly liquid investments with original maturities of three months or less that are readily convertible to known amounts of cash and which are subject to an insignificant risk of changes in value, and bank overdrafts. Term deposits that are held for a period of less than three months form a part of cash and cash equivalents.
2.9 Property, plant and equipment
Plant and equipment are stated at historical cost less accumulated depreciation and impairment. Historical cost includes expenditure that is directly attributable to the acquisition of the items.
Depreciation is calculated on a straight-line basis to write off the net cost of each item of property, plant and equipment (excluding land) over their expected useful lives as follows:
Plant and equipment 3-7 years
Office furniture and equipment 3 years
Leasehold improvements are depreciated over the unexpired period of the lease or the estimated useful life of the assets, whichever is shorter.
The residual values, useful lives and depreciation methods are reviewed, and adjusted if appropriate, at each reporting date.
An item of property, plant and equipment is derecognised upon disposal or when there is no future economic benefit to the Group. Gains and losses between the carrying amount and the disposal proceeds are taken to profit or loss.
2.10 Right-of-use assets
A right-of-use asset is recognised at the commencement date of a lease. The right-of-use asset is measured at cost, which comprises the initial amount of the lease liability, adjusted for, as applicable, any lease payments made at or before the commencement date net of any lease incentives received, any initial direct costs incurred, and, except where included in the cost of inventories, an estimate of costs expected to be incurred for dismantling and removing the underlying asset, and restoring the site or asset.
Right-of-use assets are depreciated on a straight-line basis over the unexpired period of the lease or the estimated useful life of the asset, whichever is the shorter. Where the Group expects to obtain ownership of the leased asset at the end of the lease term, the depreciation is calculated over its estimated useful life. Right-of-use assets are subject to impairment or adjusted for any remeasurement of lease liabilities.
The Group has elected not to recognise a right-of-use asset and corresponding lease liability for short-term leases with terms of 12 months or less. Lease payments on these assets are expensed to profit or loss as incurred.
2.11 Intangible assets
Research and development
Research and development expenditure is recognised as an expense as incurred. No research and development costs have been capitalised to date given the stage of the business.
Development expenditure is recognised as an expense except those costs incurred on development projects can be capitalised as intangible assets to the extent that such expenditure is expected to generate future economic benefits.
Patents and trademarks
Separately acquired trademarks and patents are recognised at historical cost. Patents have a finite life and are subsequently carried at cost less accumulated amortisation.
Separately acquired trademarks are shown at historical cost. They are considered to have infinite lives and are assessed for impairment at each year end. The Group amortises intangible assets with a limited useful life using the straight-line method over their expected useful lives as follows:
Patents 1-20 years
Disposal of intangible assets
When an intangible asset, such as a patent, is disposed of or no longer expected to generate future economic benefits, it is derecognized from the financial statements.
The profit or loss on disposal is determined as the difference between the carrying amount of the asset at the time of disposal and the proceeds from its disposal.
The Group may dispose of intangible assets through various methods, including but not limited to sale, abandonment, or expiration of the asset's legal rights. The method of disposal is chosen based on the circumstances at the time of disposal. Any gain or loss on the disposal of an intangible asset is recognized in the statement of profit or loss in the period in which the disposal occurs.
2.12 Impairment of non-financial assets
Goodwill and intangible assets with indefinite useful economic lives are tested for impairment annually at the financial year-end. Other non-financial assets are reviewed for impairment whenever events or changes in circumstances indicate that the carrying amount may not be recoverable. An impairment loss is recognised for the amount by which the asset's carrying amount exceeds its recoverable amount.
2.13 Trade and other payables
These amounts represent liabilities for goods and services provided to the Group prior to the end of the financial year and which are unpaid. Due to their short-term nature, they are measured at amortised cost and are not discounted. The amounts are unsecured and are usually paid within 30 days of recognition.
2.14 Financial instruments
IFRS 9 requires an entity to address the classification, measurement and recognition of financial assets and liabilities.
a) Classification
The Group classifies its financial assets in the following measurement categories:
• those to be measured at amortised cost.
The classification depends on the Group's business model for managing the financial assets and the contractual terms of the cash flows.
The Group classifies financial assets as at amortised cost only if both of the following criteria are met:
• the asset is held within a business model whose objective is to collect contractual cash flows; and
• the contractual terms give rise to cash flows that are solely payment of principal and interest.
b) Recognition
Purchases and sales of financial assets are recognised on trade date (that is, the date on which the Group commits to purchase or sell the asset). Financial assets are derecognised when the rights to receive cash flows from the financial assets have expired or have been transferred and the Group has transferred substantially all the risks and rewards of ownership.
c) Measurement
At initial recognition, the Group measures a financial asset at its fair value plus, in the case of a financial asset not at fair value through profit or loss (FVPL), transaction costs that are directly attributable to the acquisition of the financial asset.
Transaction costs of financial assets carried at FVPL are expensed in profit or loss.
d) Tax receivables
Management has assessed that tax receivables arising from a refundable tax offset from Australian Taxation Office, for eligible R&D expenditure, are recognised at the value claimed. These receivables are expected to be collected in a short-term period and the Directors have assessed that the receivables are not impaired. This is based on Australian government credit rating (AAA) and successful historical collection of tax receivables.
2.15 Share-based payments
The Group provides benefits to its employees in the form of share-based payments, whereby employees render services in exchange for shares or rights over shares (equity-settled transactions) in the parent entity.
The cost of these equity-settled transactions with employees is measured by reference to the fair value of the equity instruments at the date at which they are granted. The fair value is determined using a Black- Scholes model.
The cost of these equity-settled transactions is recognised as an expense, with a corresponding increase in equity, over the period in which the service conditions are fulfilled (the vesting period), ending on the date on which the relevant employees become fully entitled to the award (the vesting date).
At each subsequent reporting date until vesting, the cumulative charge to profit and loss is the product of:
• the grant date fair value of the award;
• the current best estimate of the number of awards that will vest;
• the expired portion of the vesting period; and
• the removal of any fair value attributable to share options that have contractually lapsed or expired.
The charge to profit and loss for the period is the cumulative amount as calculated above less the amounts already charged in previous periods. There is a corresponding entry to the share-based payment reserve in equity.
If a share-based payment arrangement is modified, the minimum expense recognised over the vesting period is the original fair value. If the modification increases fair value, the additional fair value is recognised over the remaining vesting period.
2.16 Non-Recurring Items
The Group considers certain unusual or infrequent items that either because of their size or their nature, or relevance to the business as are non-recurring and disclose separately to report the underlying performance of the business. For an item to be considered as a separate item, it must initially meet at least one of the following criteria:
• It is a significant item, which may cross more than one accounting period.
• It has been directly incurred as a result of either an acquisition / divestment or funding related or arises from a major business change.
• It is unusual in nature, e.g. outside the normal course of business.
If an item meets at least one of the criteria, the Board, through the Audit and Risk Committee, then exercises judgement as to whether the item should be classified as an allowable adjustment to IFRS performance measures and disclosed separately.
2.17 Foreign currency translation
The functional currency of each company in the Group is that of the primary economic environment in which the entity operates. Monetary assets and liabilities denominated in foreign currencies are translated into GBP at the rates of exchange ruling at the period end. Transactions in foreign currencies are recorded at the rate ruling at the date of the transaction.
All differences are taken to the Statement of Comprehensive Income. On consolidation, the assets and liabilities of the Group entities that have a functional currency different to the presentational currency are translated into GBP at the closing rate at the date of the Statement of Financial Position. Income and expenses for each statement of profit or loss are translated at average exchange rates for the period. Exchange differences are recognised in other comprehensive income and accumulated in a foreign exchange translation reserve.
2.18 Contributed equity
Ordinary Shares are classified as equity. Incremental costs directly attributable to the issue of new shares are deducted from the share premium account.
Retained losses includes all current and prior period results.
2.19 Business combinations
The acquisition method of accounting is used to account for business combinations regardless of whether equity instruments or other assets are acquired.
The consideration transferred is the sum of the acquisition-date fair values of the assets transferred, equity instruments issued or liabilities incurred by the acquirer to former owners of the acquiree and the amount of any non-controlling interest in the acquiree. For each business combination, the non-controlling interest in the acquiree is measured at either fair value or at the proportionate share of the acquiree's identifiable net assets. All acquisition costs are expensed as incurred to profit or loss.
On the acquisition of a business, the Group assesses the financial assets acquired and liabilities assumed for appropriate classification and designation in accordance with the contractual terms, economic conditions, the Group's operating or accounting policies and other pertinent conditions in existence at the acquisition-date.
Contingent consideration to be transferred by the acquirer is recognised at the acquisition-date fair value. Subsequent changes in the fair value of the contingent consideration classified as a liability is recognised in profit or loss. Contingent consideration classified as equity is not remeasured and its subsequent settlement is accounted for within equity.
The difference between the acquisition-date fair value of assets acquired, liabilities assumed and any non-controlling interest in the acquiree and the fair value of the consideration transferred and the fair value of any pre-existing investment in the acquiree is recognised as goodwill. If the consideration transferred and the pre-existing fair value is less than the fair value of the identifiable net assets acquired, being a bargain purchase to the acquirer, the difference is recognised as a gain directly in profit or loss by the acquirer on the acquisition-date, but only after a reassessment of the identification and measurement of the net assets acquired, the non-controlling interest in the acquiree, if any, the consideration transferred and the acquirer's previously held equity interest in the acquirer.
Business combinations are initially accounted for on a provisional basis. The acquirer retrospectively adjusts the provisional amounts recognised and also recognises additional assets or liabilities during the measurement period, based on new information obtained about the facts and circumstances that existed at the acquisition-date. The measurement period ends on either the earlier of (i) 12 months from the date of the acquisition or (ii) when the acquirer receives all the information possible to determine fair value.
2.20 Input taxes
Revenues, expenses and assets are recognised net of the amount of associated goods and services tax (GST) in Australia or value added tax (VAT) in the UK, unless the sales tax incurred is not recoverable from the taxation authority. In this case it is recognised as part of the cost of acquisition of the asset or as part of the expense.
Receivables and payables are stated inclusive of the amount of sales tax receivable or payable. The net amount of sales tax recoverable from, or payable to, the taxation authority is included with other receivables or payables in the balance sheet.
Cash flows are presented on a net basis. The sales tax components of cash flows arising from investing or financing activities which are recoverable from, or payable to the taxation authority, are presented as operating cash flows.
2.21 Critical accounting judgements and key sources of estimation uncertainty
The preparation of the financial information requires the use of accounting estimates which, by definition, will seldom equal the actual results. Management also needs to exercise judgement in the process of applying the Group's accounting policies. The areas involving a high degree of judgement or complexity, or areas of assumptions and estimates are:
Critical accounting judgements
Revenue recognition
The Group treats each fixed-price BESS contract as a single performance obligation satisfied at a point in time. Revenue is measured when the performance obligation is satisfied and control is transferred to the customer. Management judgement is required to assess the point at which control transfers, taking into account contractual terms and the customer's ability to use and obtain benefits from the system.
Australian R&D tax incentives
From 1 July 2011, the Australian Taxation Office has provided a tax incentive, in the form of a refundable tax offset of 43.5%, for eligible research and development expenditure.
Management has assessed its research and development activities and expenditure and applied judgement in determining which expenses are likely to be eligible under the scheme. For the period ended 30 June 2025 the Group has recorded other income of £1,209,000 (2024: £1,548,000) based on expected tax refunds to be received from the government (recognised under Other receivables).
UK R&D Tax reliefs: R&D expenditure credit (RDEC) Scheme
OXLiD and Battery Minerals are both eligible to claim Research and Development Expenditure Credit (RDEC) under the SMEs program. For the period ending 30 June 2025, Management has assessed eligible R&D expenses and has recognised £102,000 (2024: £57,000) in other income from expected tax refunds (recognised under Other receivables).
Recognition of a deferred tax asset
The Group has incurred tax losses in both Australia and the UK in each of the periods reported in these financial statements. No deferred tax asset has been recognised in respect of these losses, as the Directors believe that there is not sufficient certainty over future profits that would utilise them.
Key sources of estimation uncertainty
Business combination
Determining the acquisition date fair values of the identifiable assets acquired and liabilities assumed involves considerable estimation. The necessary measurements are based on information available on the acquisition date and are based on expectations as well as assumptions that have been deemed reasonable by management.
Estimation of useful lives of property, plant and equipment and Intangible assets
The Group determines the estimated useful lives and related depreciation and amortisation charges for its property, plant and equipment and finite life of intangible assets. The useful lives could change significantly as a result of technical innovations or some other event. The depreciation and amortisation charge will increase where the useful lives are less than previously estimated lives, or technically obsolete or non-strategic assets that have been abandoned or sold will be written off or written down.
Management believes, during the research and development phase, the key assumption for amortisation of patents is the useful life which is determined by the life of the patent (usually 15-20 years). The Directors do not believe that a future change in the useful life of patents is probable in the foreseeable future.
The key assumption for trademarks is they have an infinite life as they do not have an expiration date.
Impairment of goodwill, patents and trademarks
The Group performs an annual impairment test for goodwill acquired through business combinations, comparing its carrying amount to its recoverable amount at the reporting date. The recoverable amount of goodwill is determined for the Group as a whole based on its FVLCTS (Fair Value Less Cost of Disposal) method. Fair value is estimated with reference to the Group's market capitalisation at the reporting date. Management considers this approach to provide the most reliable indication of fair value given the Group's listed status on AIM. Any impairment loss is recognised immediately in the income statement and is not subsequently reversed. Further details are provided in Note 15.
The Group assesses impairment of patents and trademarks at each reporting date by evaluating conditions specific to the Group and to the particular asset that may lead to impairment. If an impairment trigger is identified, the recoverable amount of the asset is determined. To date, impairment has been recognized on capitalised patent for patent applications that have either lapsed, been rejected or written off. In these instances, the Group fully impairs the carrying amount of patent at that date.
Derecognition of Intangible assets (patents and trademarks)
An intangible asset is derecognised on disposal, or when no future economic benefits are expected from use or disposal. Gains or losses arising from derecognition of an intangible asset, measured as the difference between the net disposal proceeds and the carrying amount of the asset, are recognised in profit or loss when the asset is derecognised.
Recognition of equity-settled share-based payments
The cost of equity-settled share-based payment transactions with employees is measured by reference to the fair value of the equity instruments at the date at which they are granted. The fair value is determined using a Black-Scholes model. The Group had adopted the graded vesting approach, whereby a larger proportion of the total expense is recognised in earlier vesting periods which then decreases in the subsequent years. Please refer to note 23 for the key assumptions and inputs used in the model to determine the fair values at each measurement date.
2.22 Standards, amendments and interpretations to existing standards that are effective for the first time in the financial year
During the year ended 30 June 2025, Gelion has adopted the following new IFRSs (including amendments thereto) and IFRIC interpretations that became effective for the first time.
|
Standard |
Effective date, annual period beginning on or after |
|
Lack of exchangeability (Amendment to IAS 21 The Effects of Changes in Foreign Exchange Rates) |
1 January 2025 |
Their adoption has not had any material impact on the disclosures or amounts reported in the financial information.
Standards issued but not yet effective:
There are a number of standards, amendments to standards, and interpretations which have been issued by the IASB that are effective in future accounting periods that the Group has decided not to adopt early.
|
Standard |
Effective date, annual period beginning on or after |
|
Amendments to the Classification and Measurement of Financial Instruments (Amendments to IFRS 9 Financial Instruments) |
1 January 2026 |
|
Contracts Referencing Nature-dependent Electricity (Amendments to IFRS 9 and IFRS 7) |
1 January 2026 |
|
IFRS 18 Presentation and Disclosure in Financial Statements |
1 January 2027 |
|
IFRS 19 Subsidiaries without Public Accountability: Disclosures |
1 January 2027 |
All of the above standards issued but not yet effective have not been endorsed by the UK Endorsement Board as of the reporting date.
The Directors are evaluating the impact that these standards will have on the financial information of Gelion.
3. Segment Reporting
Operating segments are reported in a manner consistent with the internal reporting provided to the chief operating decision-maker.
The chief operating decision-maker, who is responsible for allocating resources and assessing performance of the operating segments, has been identified as the Board as a whole.
On October 16, 2024, Gelion announced the launch of its Energy Storage Integration Solutions (Integration Solutions) business, which provides Battery Energy Storage Systems using third party cells.
While the financial statements present information by activity type - Integration Solutions and Battery Technology Development - the Group operates as a single operating segment ("Operating Business") for the purposes of internal reporting and resource allocation. The presentation of these categories and the geographical split is provided for informational purposes only and does not represent separate reportable operating segments under IFRS 8.
|
2025 |
Integration Solutions £'000 |
Battery Technology Development £'000 |
Total £'000 |
|
Revenue / Other income |
912 |
1,799 |
2,711 |
|
Direct costs / R&D expenses |
(671) |
(3,262) |
(3,933) |
|
Segment profit / (loss) |
241 |
(1,463) |
(1,222) |
|
As at 30 June 2025 |
As at 30 June 2024 |
|||||
|
UK |
Australia |
£'000 |
UK |
Australia |
£'000 |
|
|
Non-current assets |
||||||
|
Goodwill |
2,804 |
- |
2,804 |
2,804 |
- |
2,804 |
|
Intangible assets |
1,198 |
2,102 |
3,300 |
1,284 |
2,526 |
3,810 |
|
Property, plant and equipment |
171 |
703 |
874 |
101 |
968 |
1,069 |
|
Total income |
||||||
|
Revenue f rom contracts with customers |
- |
912 |
912 |
- |
- |
- |
|
Other income |
590 |
1,209 |
1,799 |
440 |
1,548 |
1,988 |
|
Depreciation and amortisation |
(129) |
(464) |
(593) |
(69) |
(631) |
(700) |
|
Finance income (interest) |
8 |
39 |
47 |
91 |
58 |
149 |
|
Operating loss |
(1,933) |
(4,090) |
(6,023) |
(1,359) |
(6,746) |
(8,105) |
4. Revenue from contracts with customers
|
Year ended 30 June |
||
|
2025 £'000 |
2024 £'000 |
|
|
Revenue f rom contracts with customers |
912 |
- |
|
Total Revenue from contracts with customers |
912 |
- |
In FY2025, the Group recognised revenue of £912k from the installation of two 2MWh BESS for Group Energy Pty Ltd (a Borg Group company). The remaining contract value will be recognised in FY2026 upon completion of final commissioning activities.
5. Other income
|
Year ended 30 June |
||
|
2025 £'000 |
2024 £'000 |
|
|
R&D tax concessions |
1,311 |
1,605 |
|
Grant income |
488 |
383 |
|
Total other income |
1,799 |
1,988 |
The subsidiaries incur R&D expenditure which qualifies for relief under a tax incentive scheme provided by the Australian Taxation Office, as well as the R&D expenditure credit (RDEC) Scheme by HMRC. Management estimates the expenditure each year relevant to approved R&D activities in respect of which a claim can be made at each reporting date. The accounting policy in respect of recognition of this income is detailed in note 2.5 and the key accounting judgements applied are detailed in note 2.21.

6. Operating Loss before Non-Recurring Items
Operating loss is stated after the following specific income and expenses:
|
Year ended 30 June |
|||
|
Notes |
2025 £'000 |
2024 £'000 |
|
|
Revenue f rom contracts with customers |
4 |
912 |
- |
|
Direct costs |
(671) |
- |
|
|
R&D tax concessions |
5 |
1,311 |
1,605 |
|
Grant income |
5 |
488 |
383 |
|
Depreciation and amortisation |
14, 16 |
(593) |
(700) |
|
Employee benefits |
11 |
(4,269) |
(4,842) |
|
R&D expenses |
(928) |
(1,161) |
|
|
Out of which: |
|||
|
External R&D services |
(500) |
(813) |
|
|
R&D materials, consumables & other |
(428) |
(348) |
|
|
Administration and other expenses |
(1,512) |
(1,791) |
|
|
Total operating loss before non-recurring items |
(5,262) |
(6,506) |
|
7. Non-Recurring Items
|
Year ended 30 June |
||
|
2025 £'000 |
2024 £'000 |
|
|
Acquisition related costs |
211 |
225 |
|
Capital raising costs |
90 |
138 |
|
Loss on disposal of Property, Plant and Equipment |
47 |
112 |
|
Loss on write-off of IP intangibles |
299 |
1,124 |
|
Business restructure |
88 |
- |
|
Other |
26 |
- |
|
Total non-recurring items |
761 |
1,599 |
Non-recurring costs in FY25 include write-off of IP intangibles, deferred consideration in relation to the OXLiD Ltd acquisition which occurred in the prior year, capital raise costs and one-off costs relating to organisational restructure. These have been separately disclosed to assist the user of the financial information to understand and compare the underlying results of the Company.
Non-recurring costs in FY24 include costs incurred in relation to capital raise, OXLiD Ltd acquisition costs, loss on disposal of Property, Plant and Equipment and write-off of IP intangibles.
8. Auditors' Remuneration
|
Year ended 30 June |
||
|
2025 £'000 |
2024 £'000 |
|
|
Fees payable to the Company's auditors for the statutory audit of the Company's annual financial statements |
104 |
119 |
|
Fees payable to the Company's auditors and its associates for the audits of the Company's subsidiaries |
43 |
37 |
|
Non-audit services |
||
|
Taxation and other services |
2 |
1 |
|
Total auditors' remuneration |
149 |
157 |
9. Taxation
|
Year ended 30 June |
||
|
2025 £'000 |
2024 £'000 |
|
|
The taxation income for the year is made up as follows: |
||
|
Corporation taxation on the results for the year |
(19) |
(11) |
|
Taxation income for the year |
(19) |
(11) |
|
Numerical reconciliation of income tax expense to accounting loss: |
||
|
Loss for the year before income tax |
(6,003) |
(7,959) |
|
Prima facie tax benefit on loss f rom ordinary activities before income tax at 25% (2024: 25%) |
(1,501) |
(1,990) |
|
Add/(less) tax effect of: |
||
|
Non-deductible expenditure |
880 |
1,253 |
|
R&D tax offsets |
(302) |
(401) |
|
Tax losses incurred but not recognised |
904 |
1,127 |
|
Total taxation income |
(19) |
(11) |
Non-deductible expenses include share-based payments and expenditure subject to R&D tax incentive.
Estimated tax losses of £15,156,000 (2024: £12,009,000) are available for relief against future profits. No deferred tax asset has been provided for in the accounts based on the estimated tax losses. The estimated tax losses per jurisdiction is as follows and do not have an expiry date in each of these jurisdictions:
|
Year ended 30 June |
||
|
2025 £'000 |
2024 £'000 |
|
|
Estimated tax losses arising in the UK |
3,934 |
2,576 |
|
Estimated tax losses arising in Australia |
11,222 |
9,433 |
|
Total tax losses available to carry forward |
15,156 |
12,009 |
The standard rate of corporation tax in Australia, where the subsidiary is based, is 25% (2024: 25%).
As per note 2.6, deferred tax assets have not been recognised on the basis the Company is not forecasted to make a profit for the foreseeable future.
10. Exchange Gains and Losses Arising on Translation of Foreign Operations
Gelion Technologies Pty Limited, a battery technology development business incorporated in Australia, was merged into Gelion UK Limited in 2016 so as to maximise operational synergies and generate further cost savings.
A gain or loss through other comprehensive income arises on translation of the subsidiary's assets and liabilities from Australian Dollars to GBP as part of the consolidation process at year end.
11. Employee Benefit Expenses
Employee benefit expenses (including Directors) comprise:
|
Year ended 30 June |
||
|
2025 £'000 |
2024 £'000 |
|
|
Salaries and wages including taxes |
3,419 |
3,573 |
|
Defined contribution pension cost |
276 |
283 |
|
Share-based payment expense |
574 |
986 |
|
Total employee benefits expense (note 6) |
4,269 |
4,842 |
Average employee numbers
|
2025 (#) |
2024 (#) |
|
|
R&D |
24 |
24 |
|
Systems & Engineering |
6 |
10 |
|
Administration |
16 |
16 |
|
Average number of employees |
46 |
50 |
|
Employee headcount at period end |
42 |
50 |
Decrease in the average number of employees from FY24 to FY25 is primarily due to the business restructure and attrition of certain employees during FY25.
Key management personnel
Directors and key management personnel compensation
The total remuneration paid (including bonus accruals) to the Directors and key management personnel of the Group during the year are as follows:
|
Year ended 30 June |
||
|
2025 £'000 |
2024 £'000 |
|
|
Salaries and wages including taxes |
684 |
756 |
|
Defined contribution pension cost |
45 |
44 |
|
Share-based payment expense |
233 |
773 |
|
Total key management personnel costs |
962 |
1,573 |
The Directors and senior management represent key management personnel. Further details of Directors' remunerations are given in the Directors' Remuneration Report. The highest paid Director during the year received total remuneration of £201,268 (2024: £219,803). No share options were exercised by Directors during the financial year ended 30 June 2025.
12. Loss Per Share
|
Year ended 30 June |
||
|
2025 |
2024 |
|
|
Loss after tax |
£5,984,000 |
£7,948,000 |
|
Weighted average number of shares (number) |
146,797,706 |
124,870,447 |
|
Loss per share (pence) |
4.1p |
6.4p |
The calculation of the loss per share is based on the loss for the financial period after taxation of £5,984,000 (2024: £7,948,000) and on the weighted average of 146,797,706 (2024: 124,870,447) Ordinary Shares in issue during the period.
In FY25, the parent company issued 40,841,180 shares, majority of which relates:
• 12,431,171 ordinary shares issued at a price of 15 pence per share
• 28,381,093 ordinary shares issued at a price of 9 pence per share
• 28,916 shares issued in lieu of options exercised.
This increase in the number of Ordinary Shares has resulted in the weighted average number of shares in the year to June 2025 to increase to 146,797,706 (2024: 124,870,447).
There were 14,468,083 share options outstanding at 30 June 2025 (2024: 11,139,221). The impact of these options would be to reduce the diluted loss per share and therefore they are antidilutive. Hence, the diluted loss per share reported for the periods under review is the same as the loss per share.
13. Business combinations
On 29th November 2023, the Company completed the acquisition of 100% of ordinary shares of OXLiD Ltd. OXLiD Ltd is a UK-based lithium-sulfur battery technology company. The Company believes that the acquisition will enhance Gelion's presence in the UK which will act as a further catalyst to establish the foundations for strategic partnerships with major supply chain and industry participants (upstream and downstream), providing a commercially attractive route to market for Gelion's technology.
The following table summarises the fair value of assets acquired, and liabilities assumed at the acquisition date:
|
Fair values £'000 |
|
|
Intangible asset - technology |
1,326 |
|
Property, plant and equipment |
20 |
|
Trade and other receivables |
16 |
|
Cash |
24 |
|
Trade and other payables |
(8) |
|
Deferred tax liabilities |
(331) |
|
Total provisional fair value |
1,047 |
|
Consideration |
3,851 |
|
Goodwill |
2,804 |
The fair values include recognition of an intangible asset related to technology of £1,326,000 which will be amortised over 17 years on a straight-line basis. The goodwill of £2,804,447 comprises the potential value of future technology, the value of the existing workforce and the value of Gelion increasing its geographical footprint in the UK, all of which are not separately recognised. Deferred tax of £331,534 has been calculated on the fair value uplift of the intangible assets acquired, and a corresponding amount recognised as goodwill. Directly related acquisition costs of £225,000 were expensed to the income statement in the prior period.
Fair value of consideration paid:
|
£'000 |
|
|
Completion cash |
1,250 |
|
Completion equity |
2,601 |
|
Total consideration |
3,851 |
The net cash sum expended on Acquisition in the period ended 30 June 2024 is as follows:
|
£'000 |
|
|
Cash paid as consideration on acquisition |
(1,250) |
|
Cash acquired at acquisition |
24 |
|
Net cash outflow on acquisition |
(1,226) |
The consideration was settled by cash (£1.25 million) and in equity (amounting to £2,522,060, with the issue of 10,508,582 shares in the Company valued at 24 pence per share on 29th November 2023).
The completion equity consideration of 10,508,582 ordinary shares in Gelion has subsequently been fair valued £2,600,874 based on the closing share price of Gelion of 24.75p at the Acquisition Date.
The deferred consideration of £400,000 is subject to the retention of the founder in OXLiD Ltd and is to be paid equally over 12, 18 and 24 months, therefore this part of the arrangement represents post-combination services and is separate from the business combination (IFRS 3, B55(a) - Continuing Employment). As at 30 June 2025, £22,222 was included in other payables relating to this transaction (2024: £77,595), the expense has been included in administrative expenses and classified as Non-Recurring Items within the consolidated statement of comprehensive income.
14. Intangible Assets
|
Patents £'000 |
Trademarks £'000 |
Goodwill £'000 |
Total £'000 |
|
|
Cost |
||||
|
At 30 June 2023 |
3,430 |
20 |
- |
3,450 |
|
Additions |
587 |
1 |
- |
588 |
|
Acquisition of a subsidiary |
1,326 |
- |
2,804 |
4,130 |
|
Write-offs |
(1,278) |
- |
- |
(1,278) |
|
Difference on foreign exchange |
(9) |
- |
- |
(9) |
|
At 30 June 2024 |
4,056 |
21 |
2,804 |
6,881 |
|
Additions |
318 |
- |
- |
318 |
|
Write-offs |
(341) |
- |
- |
(341) |
|
Difference on foreign exchange |
(242) |
(4) |
- |
(246) |
|
At 30 June 2025 |
3,791 |
17 |
2,804 |
6,612 |
|
Amortisation |
||||
|
At 30 June 2023 |
101 |
- |
- |
101 |
|
Amortisation |
318 |
- |
- |
318 |
|
Write-offs |
(154) |
- |
- |
(154) |
|
Difference on foreign exchange |
2 |
- |
- |
2 |
|
At 30 June 2024 |
267 |
- |
- |
267 |
|
Amortisation |
308 |
- |
- |
308 |
|
Write-offs |
(42) |
- |
- |
(42) |
|
Difference on foreign exchange |
(25) |
- |
- |
(25) |
|
At 30 June 2025 |
508 |
- |
- |
508 |
|
Carrying amount |
||||
|
At 30 June 2024 |
3,789 |
21 |
2,804 |
6,614 |
|
At 30 June 2025 |
3,283 |
17 |
2,804 |
6,104 |
15. Goodwill and impairment
In accordance with IFRS requirements, the Group performs an annual impairment test to assess whether goodwill has suffered any impairment. As at 30 June 2025, goodwill was tested for impairment using the FVLCTS (Fair Value Less Cost of Disposal) method. The closing share price at 30 June 2025 was 24 pence giving a market capitalisation of £42.4 million which is £32.5 million higher than the Net Assets of the Group on this date. The share price would need to have dropped below 6 pence for the market value to be below the Net Asset value of the Group at that date. Based on the above, no impairment loss was identified in relation to goodwill. Since 30 June 2025, the share price of Gelion Plc has traded across a high-low range of 18.4p and 27p per share.
On 29th November 2023, the Group recognised goodwill of £2,804,447 following the acquisition of OXLiD. In the prior year, goodwill had been fully allocated to the OXLiD Cash Generating Unit (CGU) on the basis that OXLiD would generate cash flows that were largely independent of the cash inflows from other subsidiaries within the Group and was therefore considered a separate CGU. This was based on the intention for OXLiD to manufacture and deliver battery technology, however the group strategy is now to licence/toll manufacture utilising the group IP including IP and expertise acquired as part of the acquisition to deliver technology. In the current year, the benefits arising from goodwill acquired through the OXLiD acquisition will apply to the Group and therefore recognition of goodwill will be realised at the group level.
16. Property, Plant and Equipment
|
Office furniture and equipment £'000 |
Plant and equipment £'000 |
Right-of-use assets £'000 |
Leasehold improvements £'000 |
Total £'000 |
|
|
Cost |
|||||
|
At 30 June 2023 |
81 |
1,346 |
427 |
122 |
1,976 |
|
Additions |
10 |
559 |
32 |
20 |
621 |
|
Acquisition of a subsidiary |
1 |
22 |
- |
- |
23 |
|
Disposals |
- |
(198) |
(31) |
(36) |
(265) |
|
Difference on foreign exchange |
- |
(3) |
(1) |
- |
(4) |
|
At 30 June 2024 |
92 |
1,726 |
427 |
106 |
2,351 |
|
Additions |
67 |
98 |
53 |
- |
218 |
|
Disposals |
(1) |
(240) |
- |
- |
(241) |
|
Difference on foreign exchange |
(12) |
(138) |
(37) |
(10) |
(197) |
|
At 30 June 2025 |
146 |
1,446 |
443 |
96 |
2,131 |
|
Depreciation |
|||||
|
At 30 June 2023 |
55 |
506 |
376 |
82 |
1,019 |
|
Charge for the year |
17 |
298 |
44 |
23 |
382 |
|
Acquisition of a subsidiary |
- |
3 |
- |
- |
3 |
|
Accumulated depreciation on disposal |
- |
(108) |
- |
(14) |
(122) |
|
Difference on foreign exchange |
- |
- |
(1) |
1 |
- |
|
At 30 June 2024 |
72 |
699 |
419 |
92 |
1,282 |
|
Charge for the year |
13 |
257 |
12 |
3 |
285 |
|
Accumulated depreciation on disposal |
(1) |
(191) |
- |
- |
(192) |
|
Difference on foreign exchange |
(7) |
(65) |
(38) |
(8) |
(118) |
|
At 30 June 2025 |
77 |
700 |
393 |
87 |
1,257 |
|
Carrying amount |
|||||
|
At 30 June 2024 |
20 |
1,027 |
8 |
14 |
1,069 |
|
At 30 June 2025 |
69 |
746 |
50 |
9 |
874 |
17. Leases
The Group has lease contracts in respect of leasehold property used in its operations. These leases have lease terms of between two and three years. There is no leasehold property recognised by the Group in the two years ended 30 June presented in these financial statements other than those recognised as right-of-use assets. Therefore, for the carrying amount of right-of-use assets at each reporting date and movements in each year ended refer to note 16.
Set out below are the carrying amounts of lease liabilities (included under trade and other payables) and the movements during each year ended 30 June:
|
2025 £'000 |
2024 £'000 |
|
|
Balance as at 1 July |
8 |
56 |
|
Additions |
53 |
32 |
|
Interest |
1 |
3 |
|
Payments |
(16) |
(47) |
|
Termination of lease |
- |
(33) |
|
Difference on foreign exchange |
(1) |
(3) |
|
Balance as at 30 June |
45 |
8 |
The maturity analysis of lease liabilities is disclosed in note 24.
The following are the amounts recognised in profit or loss:
|
Year ended 30 June |
||
|
2025 £'000 |
2024 £'000 |
|
|
Depreciation expense of right-of-use assets |
12 |
44 |
|
Interest expense on lease liabilities |
1 |
3 |
|
Total amount recognised in profit or loss |
13 |
47 |
18. Cash and Cash equivalents
|
As at 30 June |
||
|
2025 £'000 |
2024 £'000 |
|
|
Cash at bank |
2,661 |
3,792 |
|
Total Cash and Cash Equivalents |
2,661 |
3,792 |
Cash at bank comprises balances held by Gelion Plc, OXLiD Ltd, Battery Minerals Ltd and Gelion Technologies Pty Limited current bank accounts.
19. Other Receivables
|
As at 30 June |
||
|
2025 £'000 |
2024 £'000 |
|
|
Other receivables: |
||
|
R&D tax incentive |
1,256 |
1,614 |
|
Prepayments |
119 |
137 |
|
Restricted cash - Escrow account |
- |
133 |
|
VAT/GST receivable |
145 |
99 |
|
Other debtors |
199 |
135 |
|
Total other receivables |
1,719 |
2,118 |
The amounts are measured at amortised cost using the effective interest method in line with IFRS 9.
R&D tax incentives are granted by the Australian Taxation Office and the HMRC in the form of refundable tax offsets. The key judgements applied in the recognition of this receivable are detailed in note 2.21.
Restricted cash in the escrow account of £133,000 represents the first instalment of total deferred consideration of £400,000 that was payable to the founder of OXLiD.
Other debtors includes £138,000 accrued income relating to the contract with Group Energy Pty Ltd (a Borg Group company).
The Directors consider that the carrying value of other receivables approximates to their fair value.
20. Trade and Other Payables
Due within one year
|
As at 30 June |
||
|
2025 £'000 |
2024 £'000 |
|
|
Trade payables |
546 |
795 |
|
Accruals |
291 |
290 |
|
Employee liabilities including employment taxes |
150 |
157 |
|
Lease liabilities |
27 |
8 |
|
1,014 |
1,250 |
|
Due in more than one year
|
As at 30 June |
||
|
2025 £'000 |
2024 £'000 |
|
|
Lease liabilities |
18 |
- |
|
Provision for long service leave |
54 |
55 |
|
72 |
55 |
|
Trade payables and accruals principally comprise amounts outstanding for trade purchases and continuing costs. The Directors consider that the carrying value amount of trade and other payables approximates to their fair value. Please refer to note 24 for further details.
21. Deferred tax
|
2025 £'000 |
2024 £'000 |
|
|
Balance as at 1 July |
320 |
- |
|
Deferred tax liabilities on acquisition |
- |
331 |
|
Credit to profit or loss |
(19) |
(11) |
|
Balance as at 30 June |
301 |
320 |
Deferred tax liability of £301k represents the carrying amount of the deferred tax liability recognised on OXLiD's technology-based intangibles at the time of acquisition, as detailed in Note 13.
22. Issued Capital and Reserves
|
Ref. |
Number of shares on issue |
Share capital £'000 |
Share premium £'000 |
|
|
Balance as at 1 July 2023 |
108,407,750 |
108 |
20,752 |
|
|
Merger relief reserve (fair value of shares issued on acquisition) |
- |
11 |
- |
|
|
Shares issued during the period |
a |
27,590,709 |
17 |
4,083 |
|
Cost of shares issued |
b |
- |
- |
(348) |
|
Exercise of share options |
12,144 |
- |
- |
|
|
Balance as at 30 June 2024 |
136,010,603 |
136 |
24,487 |
|
|
Shares issued during the period |
c/d |
40,812,264 |
41 |
4,379 |
|
Cost of shares issued |
e |
- |
- |
(451) |
|
Exercise of share options |
28,916 |
- |
- |
|
|
Balance as at 30 June 2025 |
176,851,783 |
177 |
28,415 |
Year ended 30 June 2024
a) On 23 November 2023, 17,082,127 new ordinary shares of £0.001 have been issued at a price of 24 pence per share. On 29 November 2023, 10,508,582 new ordinary shares of £0.001 have been issued as part of consideration for acquisition of OXLiD Ltd.
b) Transaction costs incurred in the issuing of shares in the period ended 30 June 2024 of £436,000 of which £348,000 was offset against share premium and £88,000 was expensed.
Year ended 30 June 2025
c) On 20 December 2024, 11,397,837 new ordinary shares of £0.001 have been issued at a price of 15 pence per share. On 3 January 2025, 1,033,334 new ordinary shares of £0.001 have been issued at a price of 15 pence per share.
d) On 6 May 2025, 28,381,093 new ordinary shares of £0.001 have been issued at a price of 9 pence per share.
e) Transaction costs incurred in the issuing of shares in the period ended 30 June 2025 of £541,000 of which £451,000 was offset against share premium and £90,000 was expensed.
Nature and purpose of other reserves
Other reserves
• Share-based payments reserve
The share-based payments reserve is used to recognise the value of equity-settled share-based payments provided to employees, including key management personnel, as part of their remuneration. Refer to note 23 for further details of these plans.
• Foreign currency translation reserve
The subsidiary's functional currency is AUD and therefore on consolidation a foreign exchange gain or loss on translation of net assets is recognised through other comprehensive income at each reporting date. These gains or losses are accumulated in a foreign currency translation reserve.
• Capital reduction reserve
Immediately following the Second Bonus Issue in FY22, the balance standing to the credit of the share premium account was cancelled and the amount so cancelled was credited to a distributable reserve called the 'capital reduction reserve'.
• Merger relief reserve
On 29th November 2023, the Company completed the acquisition of 100% of ordinary shares of OXLiD Ltd, The transaction consideration involved a combination of cash and the issuance of 10,508,582 ordinary shares in Gelion. The investment was recognised at fair value, and the excess of the fair value over the nominal value of the issued share capital is recorded within equity as a merger relief reserve.
Other non-distributable reserves:
|
Share-based payment reserve £'000 |
Foreign currency translation reserve £'000 |
Merger relief reserve £'000 |
Total other reserves £'000 |
|
|
Balance at 1 July 2023 |
5,511 |
(183) |
- |
5,328 |
|
Foreign currency translation reserve movement |
- |
(27) |
- |
(27) |
|
Merger relief - fair value of shares issued for OXLiD Acquisition |
- |
- |
2,590 |
2,590 |
|
Share-based payment charge |
986 |
- |
- |
986 |
|
Balance at 30 June 2024 |
6,497 |
(210) |
2,590 |
8,877 |
|
Balance at 1 July 2024 |
6,497 |
(210) |
2,590 |
8,877 |
|
Foreign currency translation reserve movement |
- |
(556) |
- |
(556) |
|
Share-based payment charge |
574 |
- |
- |
574 |
|
Balance at 30 June 2025 |
7,071 |
(766) |
2,590 |
8,895 |
23. Share-Based Payments
The Directors recognise the role of the Group's staff in contributing to its overall success and the importance of the Group's ability to incentivise and motivate its employees. Therefore, the Directors believe that certain employees should be given the opportunity to participate and take a financial interest in the success of the Company, aligning employees' interests with shareholders and Company goals.
In July 2022, the Board introduced a new Share Option Plan. The plan is designed to motivate and incentivise key talent to assist the Group in achieving its strategic aims whilst remaining consistent with its tolerance for risk, all set within delegated limits set out during the IPO.
These options are structured as nominal cost options. The options will normally vest in three equal tranches over three years, subject to continued employment.
Share-based payment expenses are calculated using the graded vesting method, whereby a larger proportion of the total expense is recognised in earlier vesting periods and decreases in the subsequent years. This expense recognition pattern aligns with the economics of these awards, as employees render a greater proportion of the services required to earn the awards during the initial vesting periods.
Issued during the year ended 30 June 2025
• On the 6 January 2025, 300,000 options were granted under an Unapproved share option scheme to Director Dr Graham Cooley that will vest in three equal tranches, the first anniversary being 6 January 2026, followed by annual vesting on 6 January 2027 and 6 January 2028, subject to continuing to be a Director of the Group. The options were granted with the exercise price of 0.1 pence and will be exercisable up to the tenth anniversary of the grant.
• On the 15 March 2025, 1,500,000 options were granted under an Unapproved share option scheme to advisor Prof. Markus Antonietti that will vest in three equal tranches, the first anniversary being 15 March 2026, followed by annual vesting on 15 March 2027 and 15 March 2028, subject to continuing as an advisor to Gelion PLC. The options were granted with the exercise price of 0.1 pence and will be exercisable up to the fifth anniversary of the grant.
• On 25 March 2025, 706,899 options were granted that will vest in three equal tranches, the first anniversary being 31 August 2025, followed by annual vesting on 31 August 2026 and 31 August 2027. The options were granted with the exercise price of 0.1 pence and will be exercisable up to the tenth anniversary of the grant.
• On 30 April 2025, 1,113,737 options were granted that will vest in three equal tranches, the first anniversary being 31 August 2025, followed by annual vesting on 31 August 2026 and 31 August 2027. The options were granted with the exercise price of 0.1 pence and will be exercisable up to the tenth anniversary of the grant.
Issued during the year ended 20 June 2024
• On 13 December 2023, 1,637,629 options were granted that will vest in three equal tranches, the first anniversary being 31 August 2024, followed by annual vesting on 31 August 2025 and 31 August 2026. The options were granted with the exercise price of 0.1 pence and will be exercisable up to the tenth anniversary of the grant.
• On 20 December 2023, 949,751 options were granted that have an 18 month vesting period and will vest in full on 31 May 2024. The options were granted with the exercise price of 0.1 pence and will be exercisable up to the tenth anniversary of the grant.
• On the 5 February 2024, 200,000 options were granted to Louis Adriaenssens that have a 12-month vesting period and will vest in full on 4 February 2025. The options were granted with the exercise price of 0.1 pence and will be exercisable up to the fifth anniversary of the grant.
|
Year ended 30 June |
||
|
2025 £'000 |
2024 £'000 |
|
|
Share-based payment expense recognised |
574 |
986 |
|
Total share-based payment expense |
574 |
986 |
Summary of movements in awards:
|
New Share Option Plan Number '000s |
2021 and prior Original Share Option Plan Number '000s |
Unapproved Share Option Plan Number '000s |
Weighted average exercise price £ |
|
|
Outstanding at 30 June 2023 |
2,896 |
5,583 |
- |
0.21 |
|
Exercisable at 30 June 2023 |
- |
5,583 |
- |
0.32 |
|
Granted |
2,787 |
- |
- |
0.00 |
|
Forfeited |
(115) |
- |
- |
0.00 |
|
Exercised |
(12) |
- |
- |
0.00 |
|
Outstanding at 30 June 2024 |
5,556 |
5,583 |
- |
0.16 |
|
Exercisable at 30 June 2024 |
1,674 |
5,583 |
- |
0.24 |
|
Granted |
1,821 |
- |
1,800 |
0.00 |
|
Forfeited/Cancelled |
(263) |
- |
- |
0.00 |
|
Exercised |
(29) |
- |
- |
0.00 |
|
Outstanding at 30 June 2025 |
7,085 |
5,583 |
1,800 |
0.12 |
|
Exercisable at 30 June 2025 |
3,909 |
5,583 |
- |
0.19 |
The range of exercise prices for options outstanding at the end of the year was £0.001 to £1.45 (2024: £0.001 to £1.45).
The weighted average remaining contractual life for the share options outstanding as at 30 June 2025 was 5.74 years (2024: 5.55 years).
Of the total number of options outstanding at 30 June 2025, 9,491,963 (2024: 7,256,964) had vested and were exercisable.
The weighted average fair value of the options granted in the year was £0.11 (2024: £0.24).
The Black-Scholes option pricing model was used to value the share-based payment awards granted in the year as it was considered that this approach would result in materially accurate estimate of the fair value of options granted. The following table lists the inputs to the models used for share option plans:
|
2025* |
2024 |
|
|
Weighted average fair values at the measurement date |
£0.11 |
£0.24 |
|
Weighted average exercise price |
£0.001 |
£0.001 |
|
Expected volatility (%) |
n/a |
n/a |
|
Risk-free interest rate (%) |
n/a |
n/a |
|
Expected life of share options (years) |
10 |
10 |
*2025 Options that were granted represent nominal cost options with an exercise price of £0.001. Nominal cost options fair value, under the Black-Scholes option pricing model, equals the share price at grant date, therefore expected volatility and risk-free interest rate have no impact on the valuation. In the year ended 30 June 2025 3,620,636 options (2024: 2,787,380) were granted at an exercise price of £0.001 (2024: £0.001). The total share-based payment expense for the year was £574,000 (2024: £986,000).
24. Financial Instruments and Risk Management
Capital risk management
The Group manages its capital to ensure it will be able to continue as a going concern while maximising the return to stakeholders. The overall strategy of the Group is to minimise costs and liquidity risk.
The capital structure of the Group consists of equity attributable to equity holders of the Group, comprising issued share capital, and retained earnings as disclosed in the Consolidated Statement of Changes of Equity.
The Group is exposed to a number of risks through its normal operations, the most significant of which are credit, currency and liquidity risks. The management of these risks is vested to the Board of Directors.
Credit risk
Credit risk is the risk of financial loss to the Group if a customer or counterparty to a financial instrument fails to meet its contractual obligations and arises principally from the Group's receivables from customers. Indicators that there is no reasonable expectation of recovery include, amongst others, failure to make contractual payments for a period of greater than 120 days past due. There were no receivables from customers as at end of June 2025.
The carrying amount of financial assets represents the maximum credit exposure.
The principal financial assets of the Group are bank balances including short-term deposits. The Group deposits surplus liquid funds with counterparty banks that have high credit ratings, and the Directors consider the credit risk to be minimal. The Group's maximum exposure to credit by class of individual financial instrument is shown in the table below:
|
As at 30 June |
||||
|
2025 |
2025 |
2024 |
2024 |
|
|
Carrying |
Maximum |
Carrying |
Maximum |
|
|
value |
exposure |
value |
exposure |
|
|
£'000 |
£'000 |
£'000 |
£'000 |
|
|
Cash and cash equivalents |
2,661 |
2,661 |
3,792 |
3,792 |
|
2,661 |
2,661 |
3,792 |
3,792 |
|
As at 30 June |
||||
|
2025 Rating |
2025 Cash at bank £'000 |
2024 Rating |
2024 Cash at bank £'000 |
|
|
Royal Bank of Scotland |
A+ |
1,334 |
A+ |
3,671 |
|
HSBC UK |
A+ |
24 |
A+ |
31 |
|
Commonwealth Bank of Australia |
A+ |
1,303 |
A+ |
90 |
|
2,661 |
3,792 |
The Group monitors the credit ratings of counterparties regularly and at the reporting date does not expect any losses from non-performance by the counterparties. For all financial assets to which the impairment requirements have not been applied, the carrying amount represents the maximum exposure to credit loss.
Currency risk
The Group operates in a global market with income and costs possibly arising in a number of currencies (AUD, USD, GBP) and is exposed to foreign currency risk arising from commercial transactions, acquiring Property, Plant and Equipment and raw materials, as well as translation of net investment in foreign subsidiaries. Exposure to commercial transactions arise from sales or purchases by operating companies in currencies other than the companies' functional currency. Currency exposures are reviewed regularly. The Group has signed an agreement with financial institution in FY23, to set forward exchange rate contracts to provide certainty in terms of cash flow forecasts.
The Group has a limited level of exposure to foreign exchange risk through their foreign currency denominated cash balances and a portion of the Group's costs being incurred in Australian Dollar. Accordingly, movements in the Great British Pounds exchange rate against these currencies could have a detrimental effect on the Group's results primarily for reporting purposes.
Currency risk is managed by maintaining some cash deposits in currencies other than Great British Pounds, particularly those currencies where future expenditure is forecasted. The table below shows the currency profiles of cash and cash equivalents:
|
As at 30 June |
||
|
2025 £'000 |
2024 £'000 |
|
|
Cash, cash equivalents and term deposits |
||
|
US Dollars |
214 |
3 |
|
Great British Pounds |
1,358 |
2,901 |
|
Australian Dollars |
1,089 |
888 |
|
2,661 |
3,792 |
|
Liquidity risk
Liquidity risk is the risk that the Group will encounter difficulty in meeting the obligations associated with its financial liabilities that are settled by delivering cash or another financial asset. The Group's approach to managing liquidity is to ensure, as far as possible, that it will have sufficient liquidity to meet its liabilities when they are due, under both normal and stressed conditions, without incurring unacceptable losses or risking damage to the Group's reputation.
The Group seeks to manage liquidity risk by regularly reviewing cash flow budgets and forecasts to ensure that sufficient liquidity is available to meet foreseeable needs and to invest cash assets safely and profitably. The Group deems there is sufficient liquidity for the foreseeable future.
The Group had cash and cash equivalents at period end as below:
|
As at 30 June |
||
|
2025 £'000 |
2024 £'000 |
|
|
Cash and cash equivalents |
2,661 |
3,792 |
|
2,661 |
3,792 |
|
The table below sets out the maturity profile of the Group's financial liabilities at each year end:
Year ended 30 June 2025
|
Due in less than one month £'000 |
Due between one and three months £'000 |
Due between three months and one year £'000 |
Due between one year and five years £'000 |
Total £'000 |
|
|
Trade and other payables |
965 |
- |
22 |
- |
987 |
|
Lease liabilities |
- |
7 |
22 |
19 |
48 |
|
Provision for Long Service Leave |
54 |
54 |
|||
|
965 |
7 |
44 |
73 |
1,089 |
Year ended 30 June 2024
|
Due in less than one month £'000 |
Due between one and three months |
Due between three months and one year |
Due between one year and five years £'000 |
Total £'000 |
|
|
Trade and other payables |
1,242 |
- |
- |
- |
1,242 |
|
Lease liabilities |
3 |
5 |
- |
- |
8 |
|
Provision for Long Service Leave |
- |
- |
- |
55 |
55 |
|
1,245 |
5 |
- |
55 |
1,305 |
|
25. Capital Commitments
There were no capital commitments as at 30 June 2025 and 30 June 2024.
26. Related Party Transactions
Other than the remuneration to key management personnel outlined in note 11 of these financial statements, there are the following related party transactions:
Management and R&D service fees of £43,089 (2024: £88,201) were paid to Thomas Maschmeyer Consulting Pty Ltd, a company with a common director (Prof Thomas Maschmeyer).
Remuneration of £26,866 (2024: £25,448) was paid to a fixed term employee for services provided to the company. The employee is a related person of a Group Director.
Remuneration of key management personnel
The remuneration of the Directors, who are the key management personnel of the Group, is set out in aggregate in note 11 for each of the categories specified in IAS 24.
27. Events Subsequent to Year End
Equity fundraising through new ordinary shares
On 18 October 2025, the company announced that it had successfully raised gross proceeds of £10.5 million via the issue of 52,500,000 new ordinary shares at a price of 20 pence per share. As part of the placing, the Directors subscribed for new ordinary shares which raised gross proceeds of £0.2 million in aggregate.
UK Grant funding and Collaboration with QinetiQ
The UK subsidiary, OXLiD Ltd, was awarded a £0.5m grant from the UK Government's DRIVE35 programme, facilitated by Advanced Propulsion Centre UK (APC). The project will be delivered in collaboration with QinetiQ to build and test Li-S multi-layer pouch cells. The project will run for 12 months and has a total budget of c £1.1m, 50% co-funded by APC.
28. Control
In the opinion of the Directors there is no single ultimate controlling party.
29. Alternate Performance Measures (APM)
The below non-IFRS performance measures have been used. These measures are additional to IFRS measures and may not be comparable with other companies. APMs should not be viewed in isolation but as a supplementary information.
In determining whether an item should be presented as an allowable adjustment to IFRS measures, the Group considers items which are significant either because of their size or their nature, and which are non-recurring. For an item to be considered as an allowable adjustment to IFRS measures, it must initially meet at least one of the following criteria:
• It is a significant item, which may cross more than one accounting period.
• It has been directly incurred as a result of either an acquisition / divestment or arises from a major business change.
• It is unusual in nature, e.g. outside the normal course of business.
If an item meets at least one of the criteria, the Board, through the Audit and Risk Committee, then exercises judgement as to whether the item should be classified as an allowable adjustment to IFRS performance measures. These adjustments have been defined as:
a) Transaction costs - Costs Incurred in relation to capital raising, acquisition or divestment
b) Loss on disposal of property, plant and equipment and write-off of IP intangibles
c) Share based payments expense - Non-cash employee incentives
d) Business restructure
Use: Provides a consistent measure of the profits from the core business activities. The Company believes these APMs are widely used by securities analysts, investors and other interested parties to evaluate the profitability of companies. This measure is closely tracked by management to evaluate the Company's operating performance and to make financial, strategic and operating decisions and because it may help investors to understand and evaluate, in the same manner as management, the underlying trends in the Company's operational performance on a comparable basis, period on period.
Measures
1. Adjusted EBITDA loss is calculated by excluding Capital raising and acquisition related costs, Loss on disposal of Property, Plant and Equipment and write-off of IP intangibles, Share based payments, Business restructure and Depreciation and Amortisation from Operating loss:
Reconciliation:
|
Year ended 30 June |
||
|
2025 £'000 |
2024 £'000 |
|
|
Operating loss |
(6,023) |
(8,105) |
|
Adjustments |
||
|
Loss on disposal of fixed assets and write-off of IP intangibles |
346 |
1,236 |
|
Share-based payments expense |
574 |
986 |
|
Depreciation and amortisation |
593 |
700 |
|
Capital raising and acquisition related costs |
301 |
363 |
|
Business restructure and other |
114 |
- |
|
Adjusted EBITDA loss |
(4,095) |
(4,820) |
2. Adjusted operating loss is calculated by excluding Loss on disposal of Property, Plant and Equipment, write-off of IP intangibles, Transaction costs and Business restructure costs from operating loss.
Reconciliation:
|
Year ended 30 June |
||
|
2025 £'000 |
2024 £'000 |
|
|
Operating loss |
(6,023) |
(8,105) |
|
Adjustments |
||
|
Loss on disposal of Property, Plant and Equipment and write-off of IP intangibles |
346 |
1,236 |
|
Capital raising and acquisition related costs |
301 |
363 |
|
Business restructure and other |
114 |
- |
|
Adjusted operating loss |
(5,262) |
(6,506) |
3. Adjusted loss after taxation is calculated by excluding non-recurring expenses from reported loss from ordinary activities after taxation.
Reconciliation:
|
Year ended 30 June |
||
|
2025 £'000 |
2024 £'000 |
|
|
Loss on ordinary activities after taxation |
(5,984) |
(7,948) |
|
Adjustments |
||
|
Loss on disposal of Property, Plant and Equipment and write-off of IP |
346 |
1,236 |
|
Capital raising and acquisition related costs |
301 |
363 |
|
Business restructure and other |
114 |
- |
|
Adjusted loss after taxation |
(5,223) |
(6,349) |
4. Proforma cash and cash equivalents is calculated by including R&D tax incentive and RDEC receivables and other tax receivables from the Australian and the UK tax authorities.
Reconciliation:
|
Year ended 30 June |
||
|
2025 £'000 |
2024 £'000 |
|
|
Cash and cash equivalents |
2,661 |
3,792 |
|
R&D tax incentive receivable f rom the Australian Government |
1,159 |
1,557 |
|
RDEC f rom the UK government |
97 |
57 |
|
Other tax receivables |
145 |
- |
|
Pro forma cash and cash equivalents |
4,062 |
5,406 |
5. Underlying net cash use is calculated by including net cash used in operating activities, purchase of IP intangibles and property, plant and equipment, adjusted for non-recurring items and acquisition of IP.
|
Year ended 30 June |
||
|
2025 £'000 |
2024 £'000 |
|
|
Net cash used in operating activities |
(4,455) |
(4,533) |
|
Purchase of tangible Property, Plant and Equipment |
(165) |
(589) |
|
Cash used for IP intangibles |
(318) |
(588) |
|
Non-recurring items |
336 |
138 |
|
Underlying net cash use |
(4,602) |
(5,572) |
Parent Company Balance Sheet
|
As at 30 June |
|||
|
Notes |
2025 £'000 |
2024 £'000 |
|
|
Assets |
|||
|
Non-current assets |
|||
|
Investment in subsidiary |
4 |
32,465 |
26,446 |
|
Current assets |
|||
|
Cash and cash equivalents |
1,170 |
3,671 |
|
|
Other receivables |
5 |
253 |
392 |
|
Total assets |
33,888 |
30,509 |
|
|
Liabilities |
|||
|
Current liabilities |
|||
|
Trade and other payables |
6 |
252 |
315 |
|
Total liabilities |
252 |
315 |
|
|
Net assets |
33,636 |
30,194 |
|
|
Equity |
|||
|
Issued capital |
7 |
177 |
136 |
|
Share premium account |
7 |
28,415 |
24,487 |
|
Share-based payment reserve |
7 |
7,071 |
6,496 |
|
Capital reduction reserve |
7 |
11,194 |
11,194 |
|
Merger relief reserve |
2,511 |
2,511 |
|
|
Accumulated losses |
(15,732) |
(14,630) |
|
|
Total equity |
33,636 |
30,194 |
As permitted by Section 408 of the Companies Act 2006, no income statement or statement of comprehensive income is presented for the Company.
The financial statements of Gelion Plc, company registration number 09796512, were approved by the Directors and authorised for issue on 26 November 2025.
Parent Company Statement of Changes in Equity
|
Share capital £'000 |
Share premi- um £'000 |
Accu-mulated losses £'000 |
Capital reduc- tion reserve £'000 |
Share-based payment reserve £'000 |
Merger relief reserve £'000 |
Total £'000 |
|
|
Balance at 1 July 2023 |
108 |
20,752 |
(8,831) |
11,194 |
5,510 |
- |
28,733 |
|
Total comprehensive loss for the period |
- |
- |
(5,799) |
- |
- |
- |
(5,799) |
|
Contributions by and distributions to owners: |
|||||||
|
Merger relief reserve (fair value of shares issued on acquisition) |
11 |
- |
- |
- |
- |
2,511 |
2,522 |
|
Share-based payment charge |
- |
- |
- |
- |
986 |
- |
986 |
|
Shares issued during the period |
17 |
4,083 |
- |
- |
- |
- |
4,100 |
|
Costs of share issued |
- |
(348) |
- |
- |
- |
- |
(348) |
|
Total contributions by and distributions to owners |
28 |
3,735 |
- |
- |
986 |
2,511 |
7,260 |
|
Balance at 30 June 2024 |
136 |
24,487 |
(14,630) |
11,194 |
6,496 |
2,511 |
30,194 |
|
Balance at 1 July 2024 |
136 |
24,487 |
(14,630) |
11,194 |
6,496 |
2,511 |
30,194 |
|
Total comprehensive loss for the period |
(1,102) |
(1,102) |
|||||
|
Contributions by and distributions to owners: |
|||||||
|
Share-based payment charge |
- |
- |
- |
- |
575 |
- |
575 |
|
Shares issued during the period |
41 |
4,379 |
- |
- |
- |
- |
4,420 |
|
Costs of share issued |
- |
(451) |
- |
- |
- |
- |
(451) |
|
Total contributions by and distributions to owners: |
41 |
3,928 |
- |
- |
575 |
4,544 |
|
|
Balance at 30 June 2025 |
177 |
28,415 |
(15,732) |
11,194 |
7,071 |
2,511 |
33,636 |
Financial Statement
1. General Information
Gelion Plc ('Gelion' or the 'Company') is a 100% owner of an Australian subsidiary that conducts research and development in respect of an innovative battery system and associated industrial design and manufacturing.
Gelion is a public limited company, limited by shares, incorporated and domiciled in England and Wales. The Company was incorporated on 26 September 2015. The registered office of the Company is at c/o Armstrong, Level 4 LDN:W, 3 Noble Street London EC2V 7EE. The registered company number is 09796512.
Gelion Plc was incorporated as Gelion UK Ltd. On 12 November 2021, the Company was re-registered as a public limited company under the Companies Act and its name was changed to Gelion Plc.
The Board, Directors and management referred to in this document refers to the Board, Directors and management of Gelion.
2. Accounting Policies
2.1. Basis of preparation
These separate financial statements have been prepared in accordance with Financial Reporting Standard 101, 'Reduced Disclosure Framework' (FRS 101). The financial statements have been prepared under the historical cost convention and in accordance with the Companies Act 2006.
The preparation of financial statements in compliance with FRS 101 requires the use of certain critical accounting estimates. It also requires Group management to exercise judgement in applying the Group's accounting policies. The areas where significant judgements and estimates have been made in preparing the financial statements and their effect are disclosed in note 2.21 of the consolidated financial statements.
The following exemptions from the requirements of IFRS have been applied in the preparation of these financial statements, in accordance with FRS 101:
• Paragraphs 45(b) and 46 to 52 of IFRS 2 - Share-Based Payment
• IFRS 7 - Financial Instruments (Disclosures)
• Paragraphs 91 to 99 of IFRS 13 - Fair Value Measurement
• The following paragraphs of IAS 1 - Presentation of Financial Statements
• 10(d) - Statement of cash flows
• 16 - Statement of compliance with all IFRS
• 38A - Requirement for minimum of two primary statements, including cash flow statements
• 38B-D - Additional comparative information
• 111 - Statement of cash flows information
• 134-136 - Capital management disclosures
• IAS 7 - Statement of cash flows
• Paragraph 17 of IAS 24 - Related party disclosures relating to key management personnel
• The requirement of IAS 24 - Related party transactions relating to transactions between group members
These financial statements are presented in Great British Pounds (GBP) unless otherwise stated, which is the Company's presentational and functional currency. Amounts are rounded to the nearest thousand, unless otherwise stated.
2.2. Significant accounting policies
The accounting policies of the Company are the same as those of the Group which are set out in the relevant Notes to the Consolidated Financial Statements, except that it has no policy in respect of consolidation and investments in subsidiaries are carried at historical cost, less any provisions for impairment.
2.3. Critical judgements and key sources of estimation uncertainty
As noted in note 2.21 to the consolidated financial statements the preparation of the financial statements requires management to make estimates and assumptions that affect the reported amount of revenues, expenses, assets and liabilities and the disclosure of contingent liabilities. Company specific critical judgements are as follows:
Impairment of investments in subsidiaries.
The Company is making significant investments into Gelion Technologies Pty and OXLiD Ltd to assist with the development and deployment of its technologies. The Company incorporated Battery Minerals Ltd in February 2024 for the purpose of developing advanced hydrometallurgy solutions to improve the efficiency of critical metal recycling from battery production scrap and end-of-life-cells and is largely funded through government grants and on a long-term expects this to be independently funded. In assessing the carrying value of this asset for impairment, the Directors will at the end of each reporting period assess whether there is any indication that an asset may be impaired including the Investment in Subsidiary. The assessment will consider indications for potential impairment and assess the impairment amount with reference to the recoverable amount and carrying amount of the asset.
2.4. Share-based payments
The Group provides benefits to its employees in the form of share-based payments, whereby employees render services in exchange for shares or rights over shares (equity-settled transactions) in the parent entity as per note 2.15 of the consolidated financial statements. The only difference to that policy is that the costs relating to share-based payments is capitalised in the parent as part of the investment in the Group's subsidiaries, as it relates to employees of those subsidiaries.
3. Results for the Year
The Company recorded a loss for the financial year ended 30 June 2025 of £1,102,000 (2024: loss £5,799,000). The auditors' remuneration for audit and other services is disclosed in note 8 to the consolidated financial statements.
4. Investments In Subsidiaries
The following were subsidiary undertakings of the Group:
|
Name |
Registered office |
Class of shares |
Holding |
|
Gelion Technologies Pty Limited |
Australia |
Ordinary A |
100% |
|
OXLiD Ltd |
UK |
Ordinary A |
100% |
|
Battery Minerals Ltd |
UK |
Ordinary A |
100% |
The shareholdings are held directly.
The registered office of Gelion Technologies Pty Limited is Level 16, 101 Miller Street, North Sydney, NSW 2060.
The registered office of OXLiD Ltd and Battery Minerals Ltd is c/o Armstrong, Level 4 LDN:W, 3 Noble Street London EC2V 7EE.
|
Gelion Technologies Pty Ltd £'000 |
OXLiD Ltd £'000 |
Battery Minerals Ltd £'000 |
Total £'000 |
||
|
Cost |
|||||
|
At 30 June 2023 |
31,590 |
- |
- |
31,590 |
|
|
Additions - acquisition of a subsidiary |
- |
3,772 |
- |
3,772 |
|
|
Additions - equity subscription |
1,562 |
300 |
- |
1,862 |
|
|
Additions - share-based payment charge |
895 |
91 |
- |
986 |
|
|
At 30 June 2024 |
34,047 |
4,163 |
- |
38,210 |
|
|
Additions - equity subscription |
4,759 |
500 |
230 |
5,489 |
|
|
Additions - share-based payment charge |
378 |
152 |
- |
530 |
|
|
At 30 June 2025 |
39,184 |
4,815 |
230 |
44,229 |
|
|
Impairment |
|||||
|
At 30 June 2023 |
7,001 |
- |
- |
7,001 |
|
|
Impairment |
4,763 |
- |
- |
4,763 |
|
|
At 30 June 2024 |
11,764 |
- |
- |
11,764 |
|
|
Impairment |
- |
- |
- |
- |
|
|
At 30 June 2025 |
11,764 |
- |
- |
11,764 |
|
|
Carrying amount |
|||||
|
At 30 June 2024 |
22,283 |
4,163 |
- |
26,446 |
|
|
At 30 June 2025 |
27,420 |
4,815 |
230 |
32,465 |
|
Share-based payment charges capitalised relate to the share-based payment charges incurred by the parent company for options granted by the parent to the employees of the subsidiary.
As for the impairment of the investment, please refer further to note 4.1.
4.1. Impairment of Investments in Subsidiaries
The Company tests the net recoverable amounts of assets annually for impairment, or more frequently if there are indicators of impairment. During the year, Management considered the recoverability of its investments in subsidiaries, which is disclosed in Note 4. The subsidiaries continue to operate, incurring research and development activity and generate losses, which is seen as temporary. The fair value measurement of the investments is classified as Level 1 under IFRS 13.
Gelion Technologies Pty Limited is responsible for majority of the Group activities. As such, this single cash generating unit is the largest contributor to the market capitalisation of the Group (and parent company, listed on AIM).
Based on this, the directors considered that the market capitalisation less relevant adjustments as a proxy in the 'fair value less costs to sell' method is more reliable and applicable in assessing the impairment of investments in subsidiaries.
The market capitalisation of the Group on 30 June 2025 was £42.4 million (176,851,783 shares at a share price of 24.0 pence). Certain adjustments were made to the market capitalisation being the cash balance (£1.2 million) and net receivables (£nil) in the parent company at 30 June 2025 resulting in the indicative carrying value of £41.2 million.
In comparing the cost of the total investment £32.5 million, the indicative carrying value of £41.2 million represents a nil impairment to be recognised in the current year.
Management considered the investment in OXLiD Ltd for impairment and concluded that there is no impairment as of 30 June 2025 as detailed in Note 15.
Battery Minerals Ltd was incorporated on 16 February 2024, and there is a £230,000 investment in Battery Minerals Ltd as of 30 June 2025.
Management considered the investment in Battery Minerals Ltd for impairment and concluded that there is no impairment as of 30 June 2025.
The Company will continue to assess the recoverable amount of its investments in subsidiaries annually or whenever there are indications of impairment, in accordance with IAS 36. Any subsequent changes in the recoverable amount and impairment losses will be recognized in the financial statements in the periods in which they occur.
5. Trade and Other Receivables
Restricted cash in the escrow account represents the first instalment of deferred consideration of £400,000 that was paid to the founder of OXLiD in November 2024.
The amounts are measured at amortised cost using the effective interest method in line with IFRS 9.
There were no term deposits for a period greater than three months as of June 2025.
|
As at 30 June |
|||
|
2025 £'000 |
2024 £'000 |
||
|
Amounts receivable from Group companies |
184 |
198 |
|
|
Restricted cash - Escrow account |
- |
133 |
|
|
Prepayments |
26 |
19 |
|
|
Other debtors |
43 |
42 |
|
|
253 |
392 |
||
6. Trade and Other Payables
Due within one year
|
As at 30 June |
|||
|
2025 £'000 |
2024 £'000 |
||
|
Trade payables |
86 |
231 |
|
|
Amounts owed to Group companies |
1 |
- |
|
|
Accruals |
165 |
84 |
|
|
252 |
315 |
||
7. Share Capital
Details of the Company's share capital are as set out in note 22 to the consolidated financial statements.
Details of the Company's share premium account and other reserves are as set out in note 22 to the consolidated financial statements.
Details of the movements in retained earnings are set out in the parent company Statement of Changes in Equity.