STORE Capital — Q3 2021 Earnings Presentation
38 slides from STORE Capital's earnings presentation, Nov 4, 2021
Slide 1: 2021 Third Quarter Investor Presentation
2021 THIRD QUARTER INVESTOR PRESENTATION
Slide 2: Forward-looking statements
2021 Third Quarter Investor Presentation 2 This presentation contains forward-looking statements within the meaning of Section 27A of the Securities Act of 1933, as amended, or the Securities Act, and Section 21E of the Securities Exchange Act of 1934, as amended, or the Exchange Act. Such forward-l
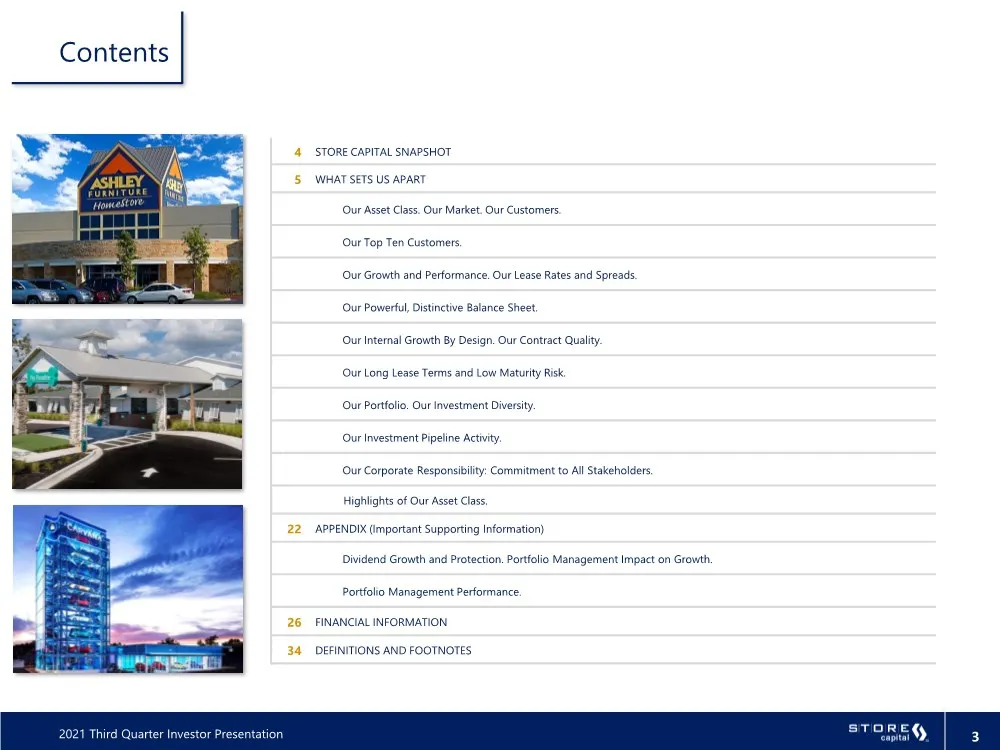
Slide 3: Contents
2021 Third Quarter Investor Presentation 3 Contents 4 STORE CAPITAL SNAPSHOT 5 WHAT SETS US APART Our Asset Class. Our Market. Our Customers. Our Top Ten Customers. Our Growth and Performance. Our Lease Rates and Spreads. Our Powerful, Distinctive Balance Sheet. Our Internal Growth By Design. Our Co
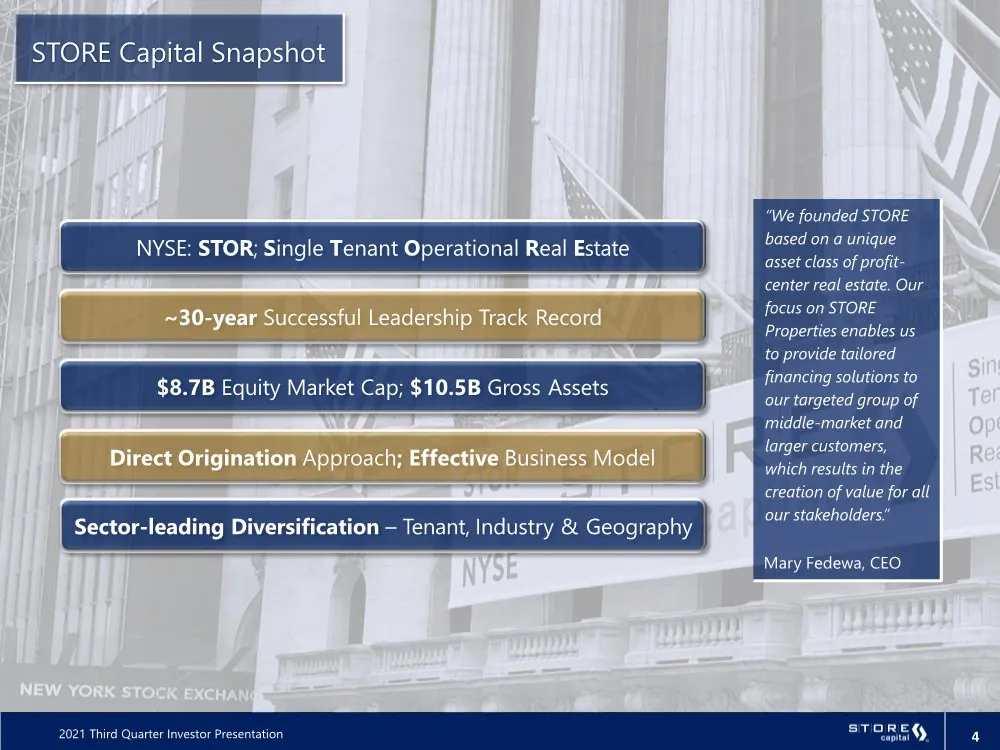
Slide 4: STORE Capital Snapshot
2021 Third Quarter Investor Presentation 4 STORE Capital Snapshot “We founded STORE based on a unique asset class of profit- center real estate. Our focus on STORE Properties enables us to provide tailored financing solutions to our targeted group of middle-market and larger customers, which results
Slide 5: The Power of Profit Center Real Estate
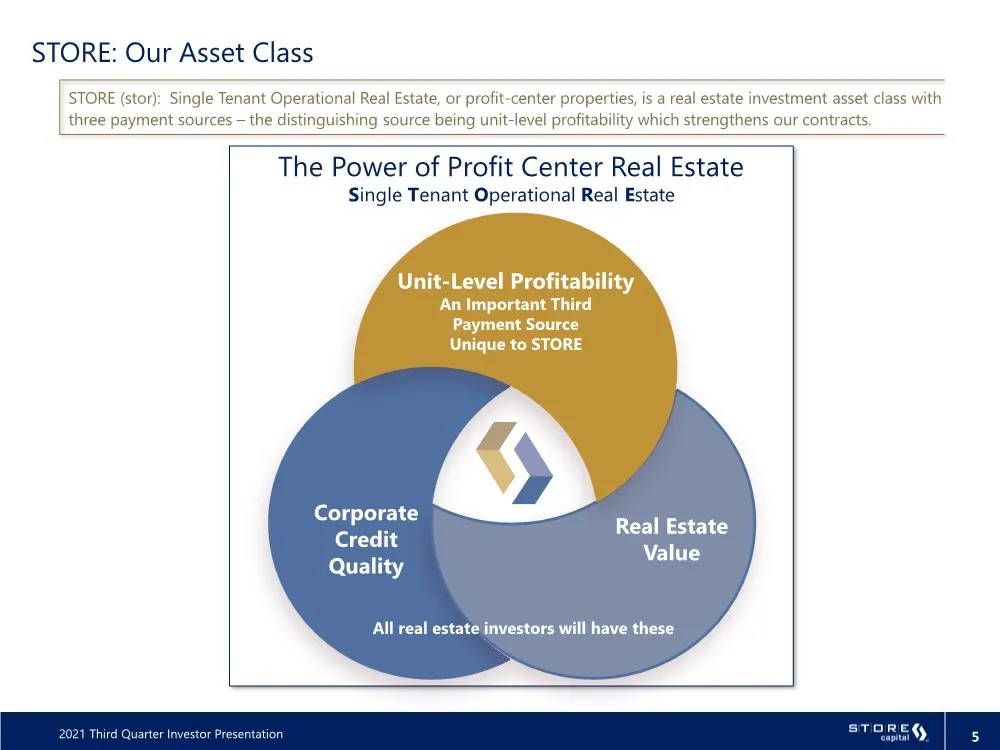
2021 Third Quarter Investor Presentation 5 The Power of Profit Center Real Estate Single Tenant Operational Real Estate STORE: Our Asset Class STORE (stor): Single Tenant Operational Real Estate, or profit-center properties, is a real estate investment asset class with three payment sources – the di
Slide 6: The Middle Market is our target market
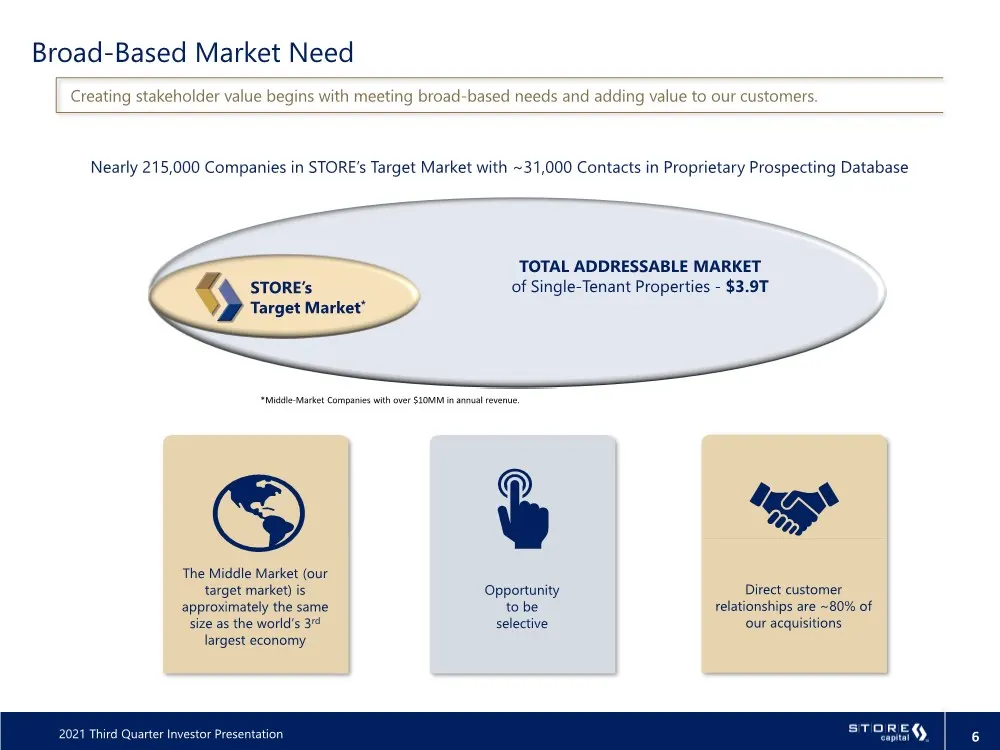
2021 Third Quarter Investor Presentation 6 The Middle Market (our target market) is approximately the same size as the world’s 3rd largest economy Broad-Based Market Need Creating stakeholder value begins with meeting broad-based needs and adding value to our customers. Nearly 215,000 Companies in S
Slide 7: STORE's Customer Revenue Distribution
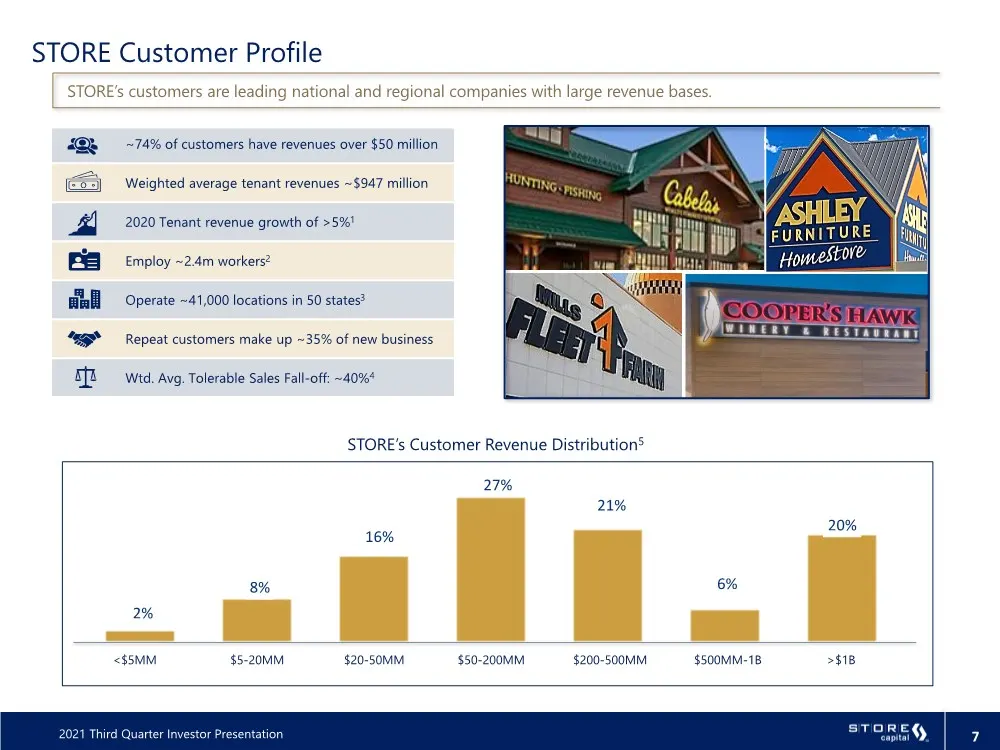
2021 Third Quarter Investor Presentation 7 2% 8% 16% 27% 21% 6% 20% STORE’s Customer Revenue Distribution5 % of Total Rent & Interest STORE Customer Profile <$5MM $5-20MM $20-50MM $50-200MM $200-500MM $500MM-1B >$1B ~74% of customers have revenues over $50 million Weighted average tenant revenues ~$
Slide 8: Top Ten Customers
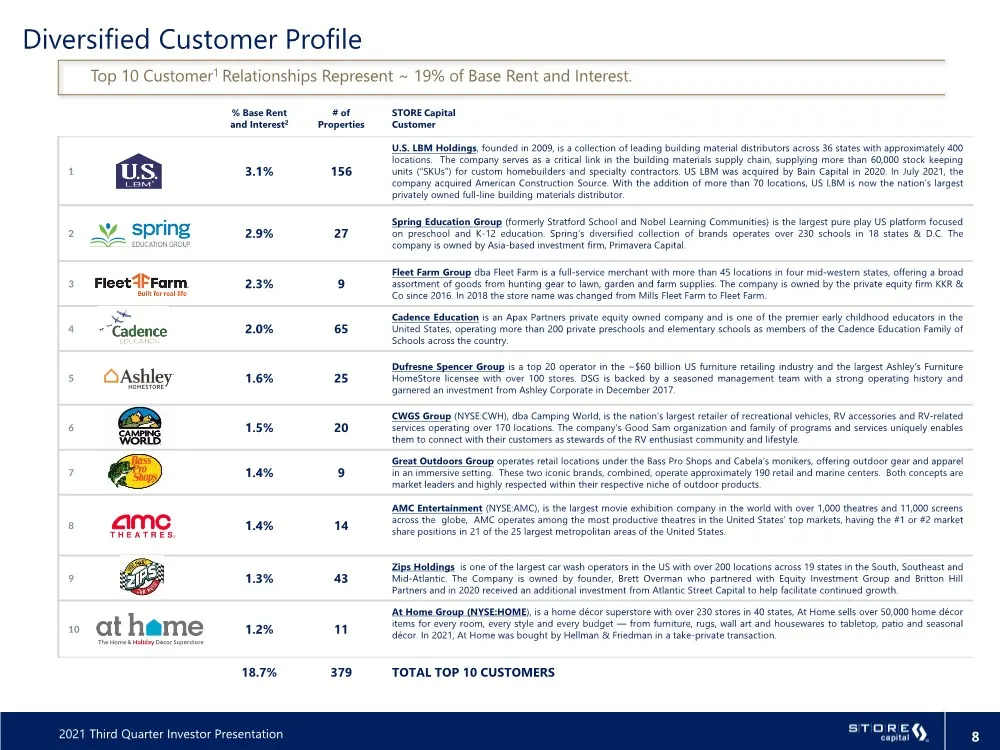
2021 Third Quarter Investor Presentation 8 % Base Rent and Interest2 # of Properties STORE Capital Customer 1 3.1% 156 U.S. LBM Holdings, founded in 2009, is a collection of leading building material distributors across 36 states with approximately 400 locations. The company serves as a critical lin
Slide 9: Growth and Performance
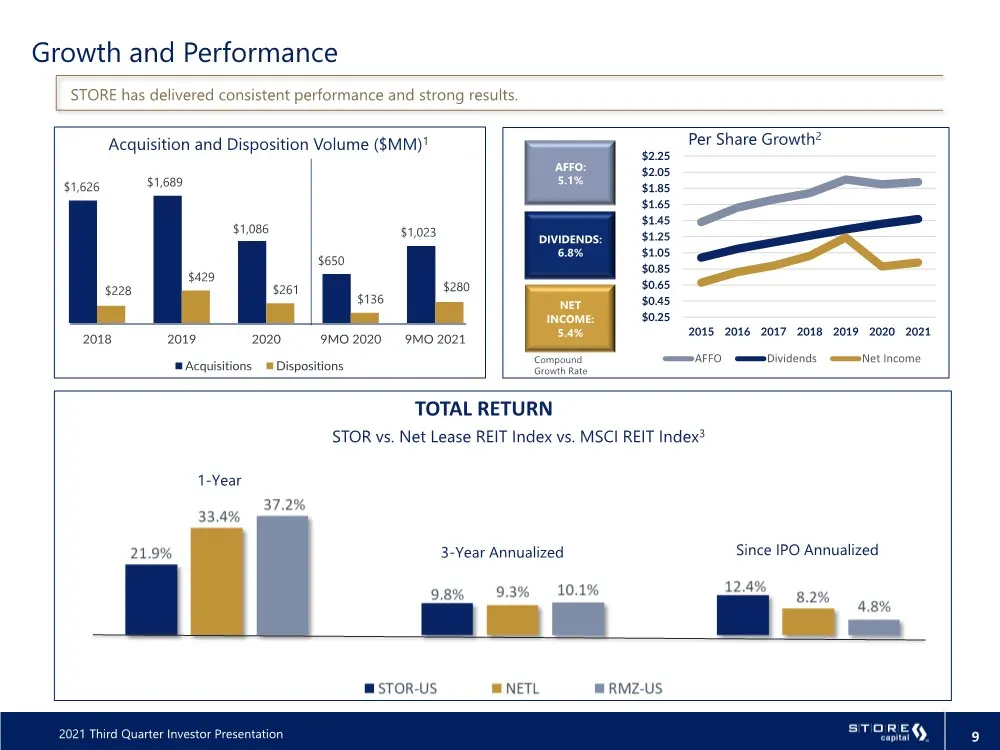
2021 Third Quarter Investor Presentation 9 $1,626 $1,689 $1,086 $650 $1,023 $228 $429 $261 $136 $280 2018 2019 2020 9MO 2020 9MO 2021 Acquisitions Dispositions Per Share Growth2 NET INCOME: 5.4% DIVIDENDS: 6.8% AFFO: 5.1% Compound Growth Rate Acquisition and Disposition Volume ($MM)1 $0.25 $0.45 $0.
Slide 10: Stable and Attractive Lease Rate Spreads
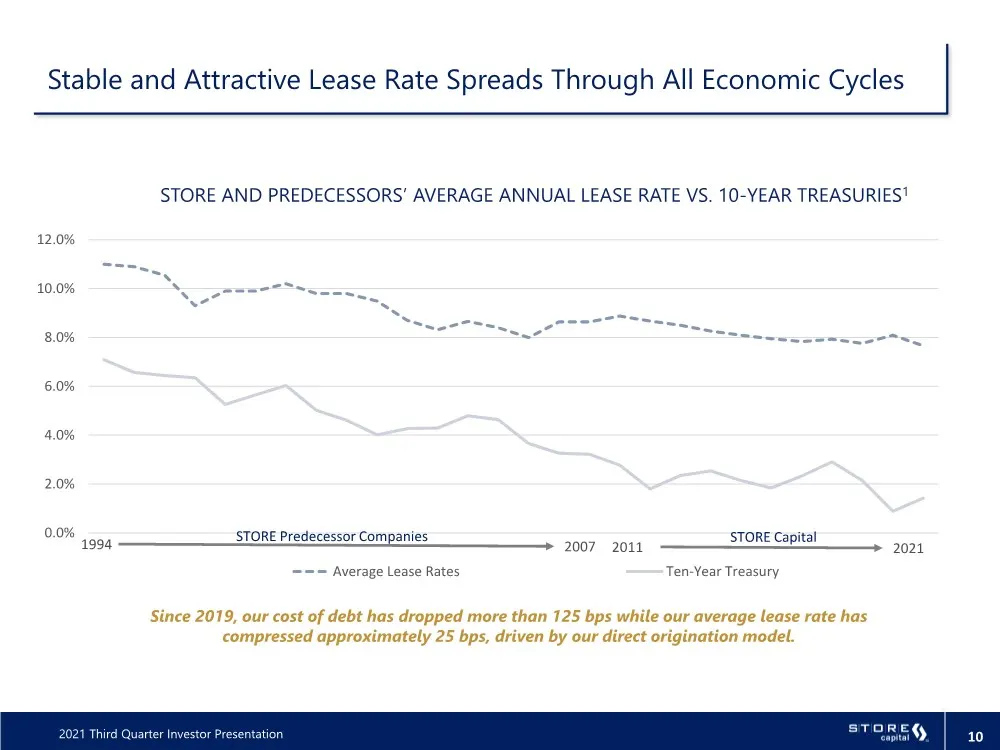
2021 Third Quarter Investor Presentation 10 Stable and Attractive Lease Rate Spreads Through All Economic Cycles STORE AND PREDECESSORS’ AVERAGE ANNUAL LEASE RATE VS. 10-YEAR TREASURIES1 0.0% 2.0% 4.0% 6.0% 8.0% 10.0% 12.0% Average Lease Rates Ten-Year Treasury STORE Capital Since 2019, our cost of
Slide 11: The Power of Our Distinctive Balance Sheet
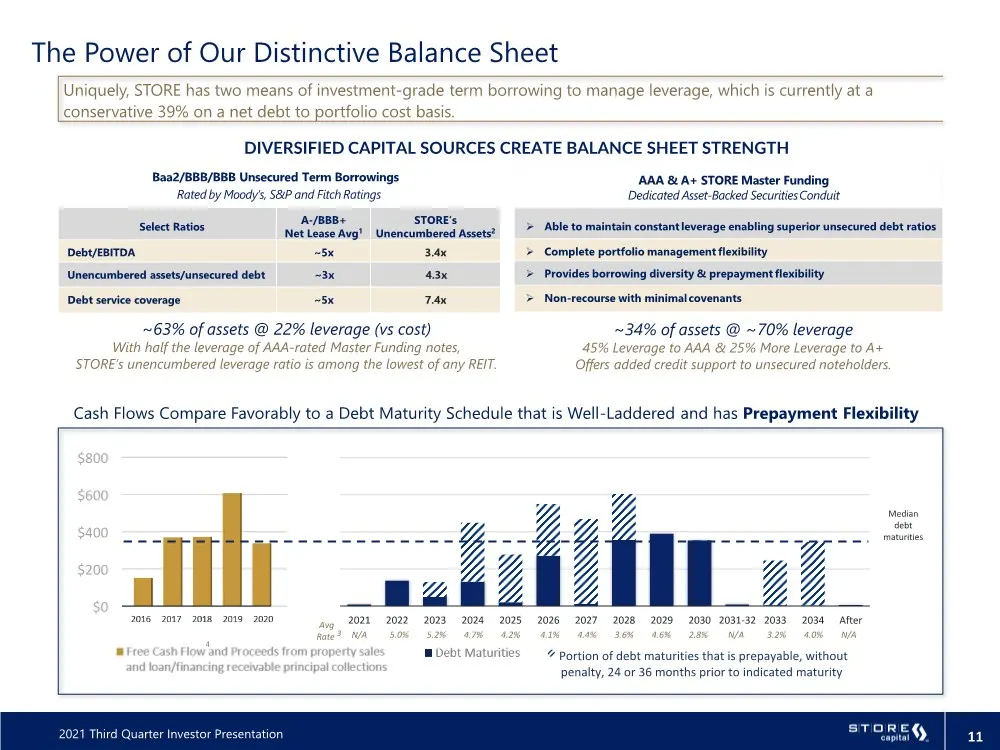
2021 Third Quarter Investor Presentation 11 2021 2022 2023 2024 2025 2026 2027 2028 2029 2030 2031-32 2033 2034 After Portion of debt maturities that is prepayable 24 or 36 months prior to maturity Debt Maturities Free Cash Flow and Proceeds from property sales 4 $0 $200 $400 $600 $800 2016 2017 201
Slide 12: Internal Growth By Design
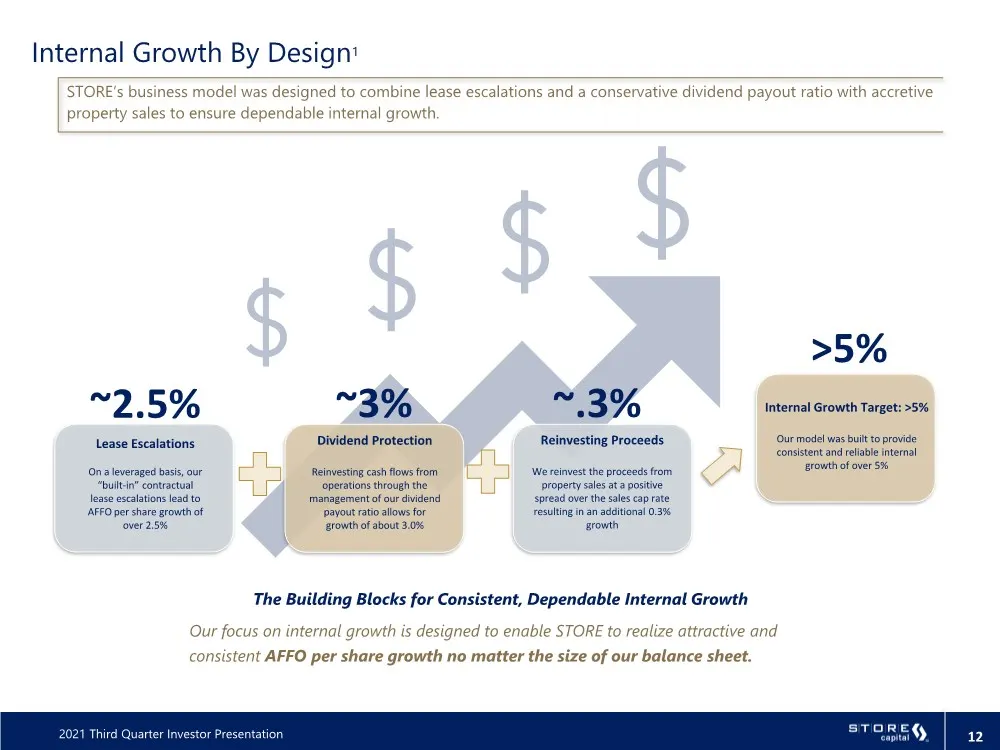
2021 Third Quarter Investor Presentation 12 Internal Growth By Design1 STORE’s business model was designed to combine lease escalations and a conservative dividend payout ratio with accretive property sales to ensure dependable internal growth. Lease Escalations On a leveraged basis, our “built-in”
Slide 13: Essential Ingredients of our Business Model
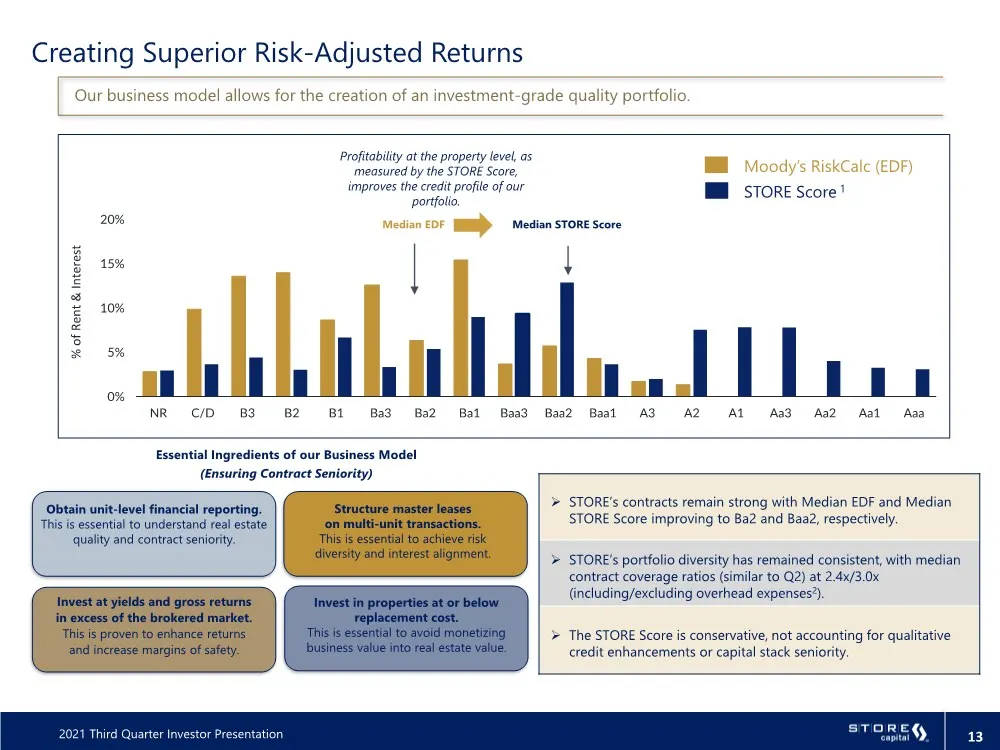
2021 Third Quarter Investor Presentation 13 Essential Ingredients of our Business Model (Ensuring Contract Seniority) 0% 5% 10% 15% 20% NR C/D B3 B2 B1 Ba3 Ba2 Ba1 Baa3 Baa2 Baa1 A3 A2 A1 Aa3 Aa2 Aa1 Aaa % of Rent & Interest Moody’s RiskCalc (EDF) STORE Score 1 Median EDF Median STORE Score Profitab
Slide 14: Long Lease Terms and Low 5-Year Maturities
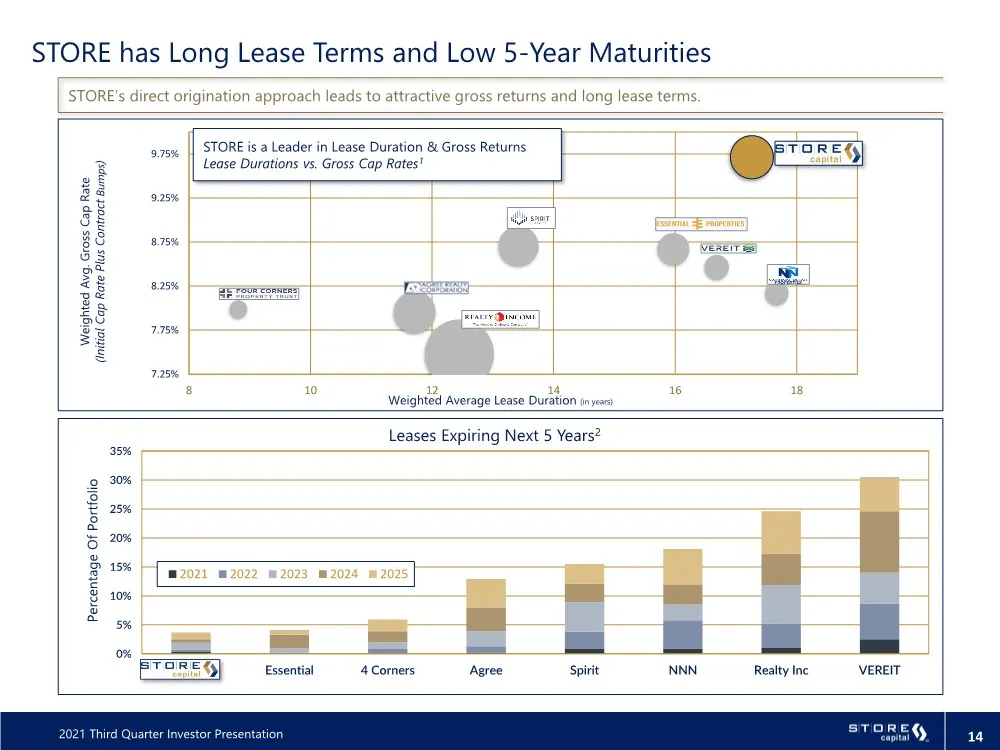
2021 Third Quarter Investor Presentation 14 0% 5% 10% 15% 20% 25% 30% 35% STOR Essential 4 Corners Agree Spirit NNN Realty Inc VEREIT 2021 2022 2023 2024 2025 Percentage Of Portfolio Leases Expiring Next 5 Years2 STORE has Long Lease Terms and Low 5-Year Maturities STORE’s direct origination approac
Slide 15: Portfolio At A Glance
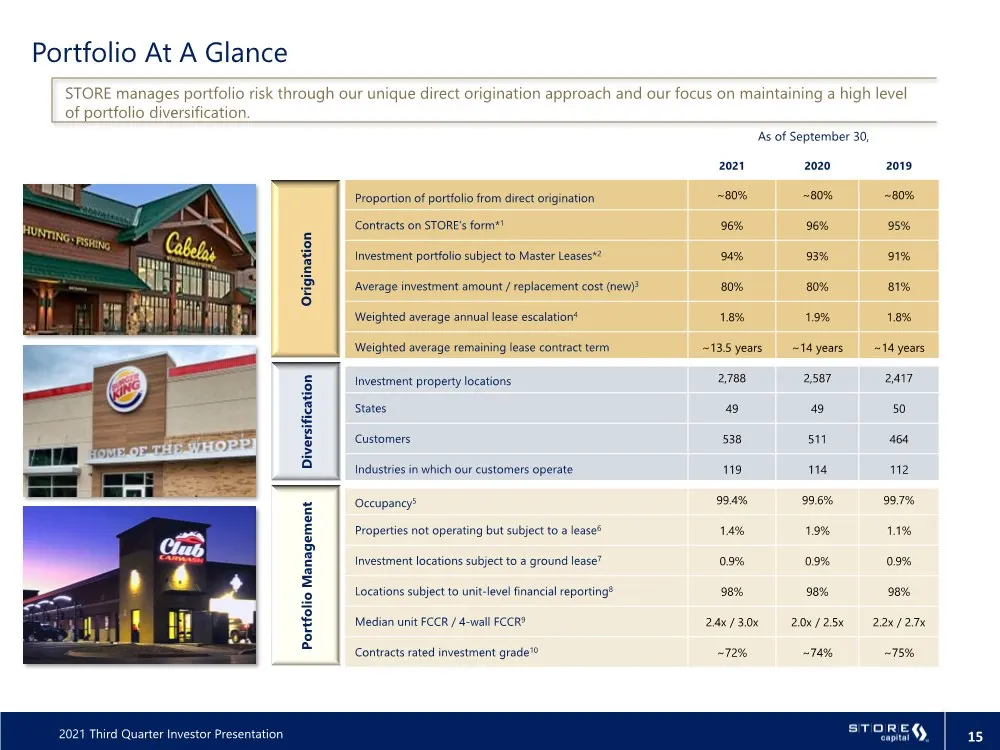
2021 Third Quarter Investor Presentation 15 As of September 30, 2021 2020 2019 Proportion of portfolio from direct origination ~80% ~80% ~80% Contracts on STORE’s form*1 96% 96% 95% Investment portfolio subject to Master Leases*2 94% 93% 91% Average investment amount / replacement cost (new)3 80% 80
Slide 16: Diversification Across Industry Groups
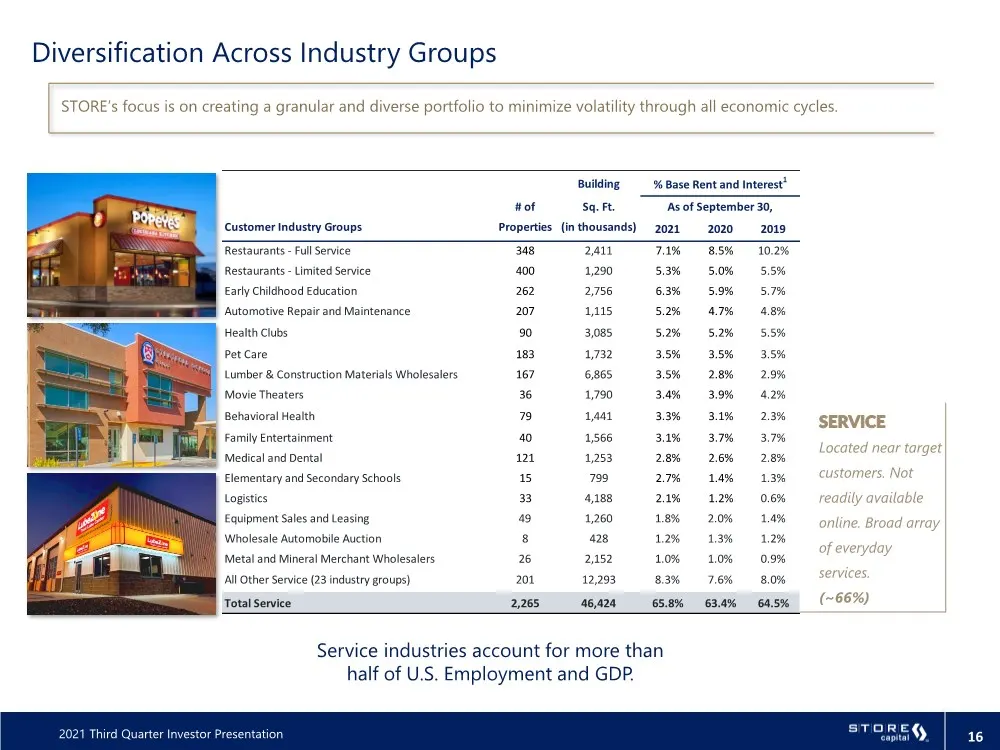
2021 Third Quarter Investor Presentation 16 Service industries account for more than half of U.S. Employment and GDP. Diversification Across Industry Groups STORE’s focus is on creating a granular and diverse portfolio to minimize volatility through all economic cycles. SERVICE Located near target c
Slide 17: Diversification Across Industry Groups (continued)
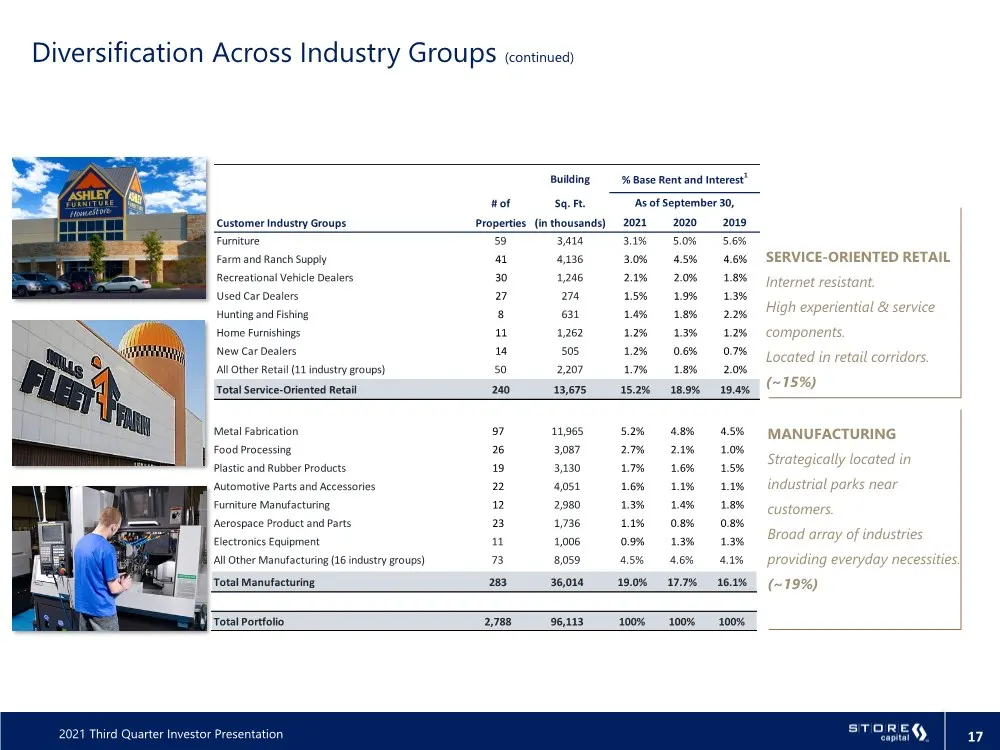
2021 Third Quarter Investor Presentation 17 Diversification Across Industry Groups (continued) MANUFACTURING Strategically located in industrial parks near customers. Broad array of industries providing everyday necessities. (~19%) SERVICE-ORIENTED RETAIL Internet resistant. High experiential & serv
Slide 18: Robust Investment Pipeline Activity
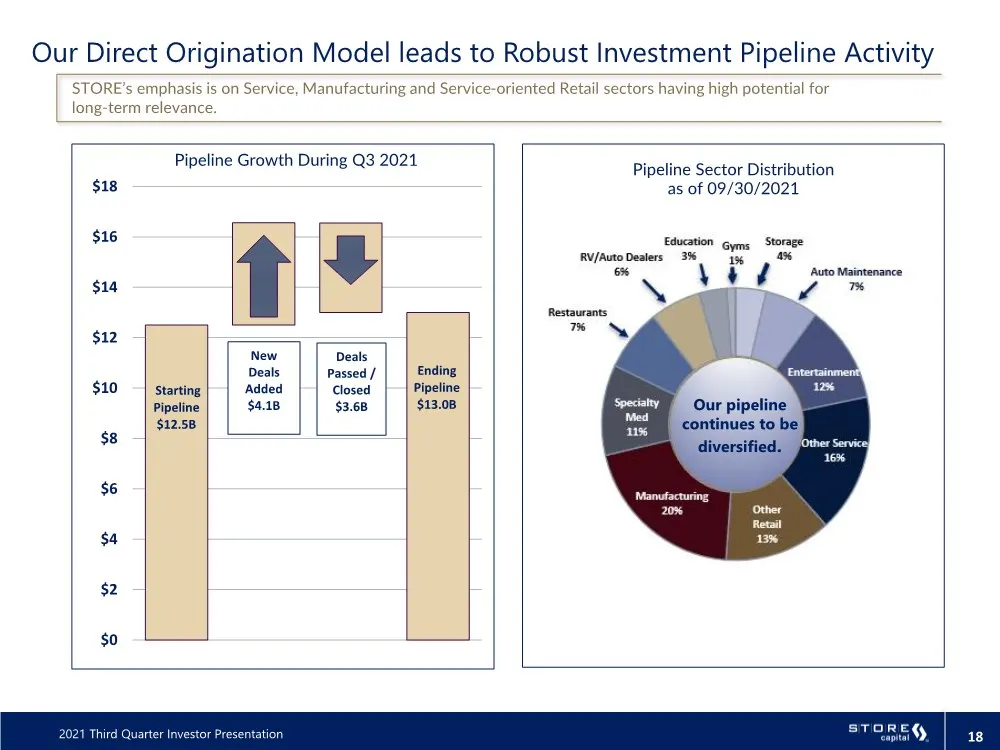
2021 Third Quarter Investor Presentation 18 Our Direct Origination Model leads to Robust Investment Pipeline Activity STORE’s emphasis is on Service, Manufacturing and Service-oriented Retail sectors having high potential for long-term relevance. Pipeline Sector Distribution as of 09/30/2021 Startin
Slide 19: Corporate Responsibility: Commitment to All Stakeholders
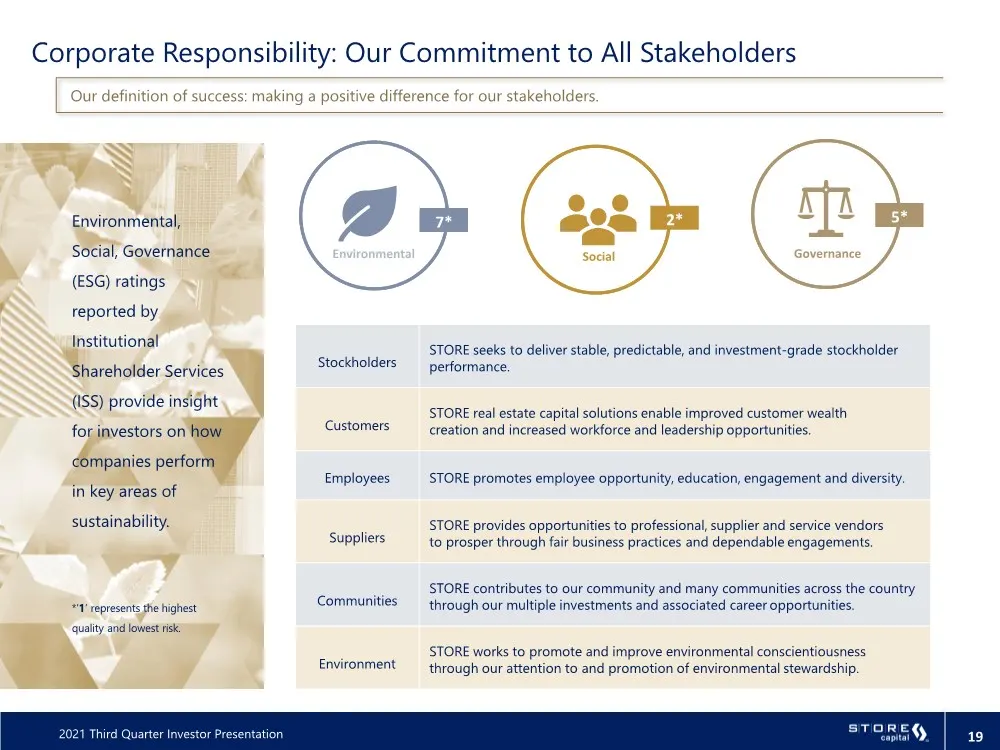
2021 Third Quarter Investor Presentation 19 Stockholders STORE seeks to deliver stable, predictable, and investment-grade stockholder performance. Customers STORE real estate capital solutions enable improved customer wealth creation and increased workforce and leadership opportunities. Employees ST
Slide 20: Corporate responsibility highlights
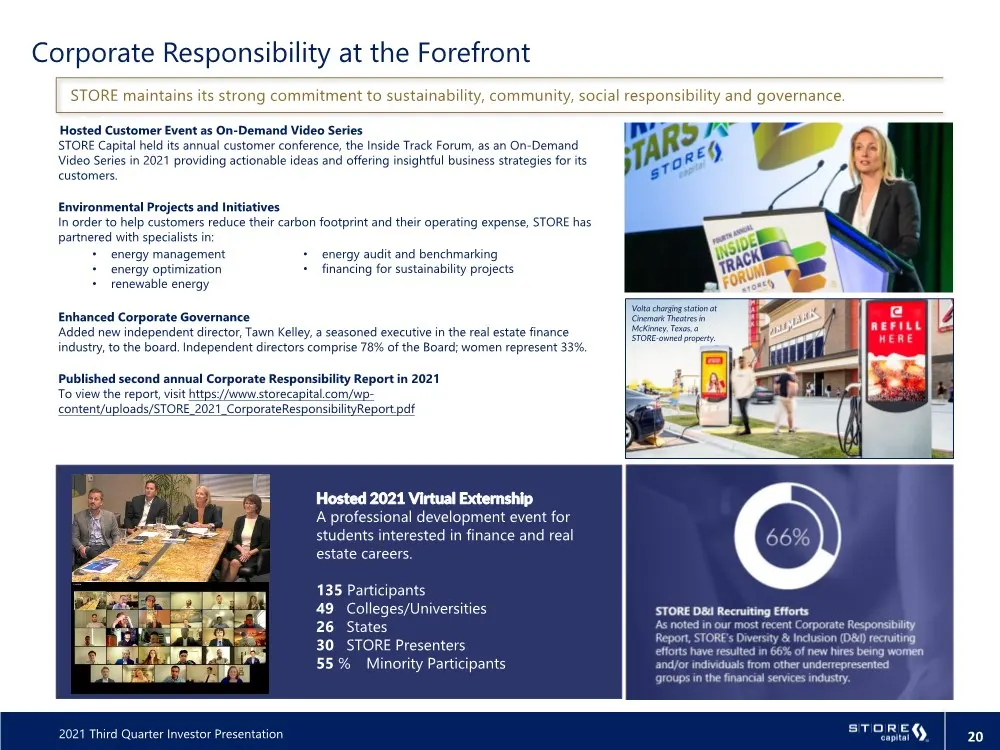
2021 Third Quarter Investor Presentation 20 Hosted 2021 Virtual Externship A professional development event for students interested in finance and real estate careers. 135 Participants 49 Colleges/Universities 26 States 30 STORE Presenters 55 % Minority Participants Hosted Customer Event as On-Deman
Slide 21: Highlights of Our Asset Class
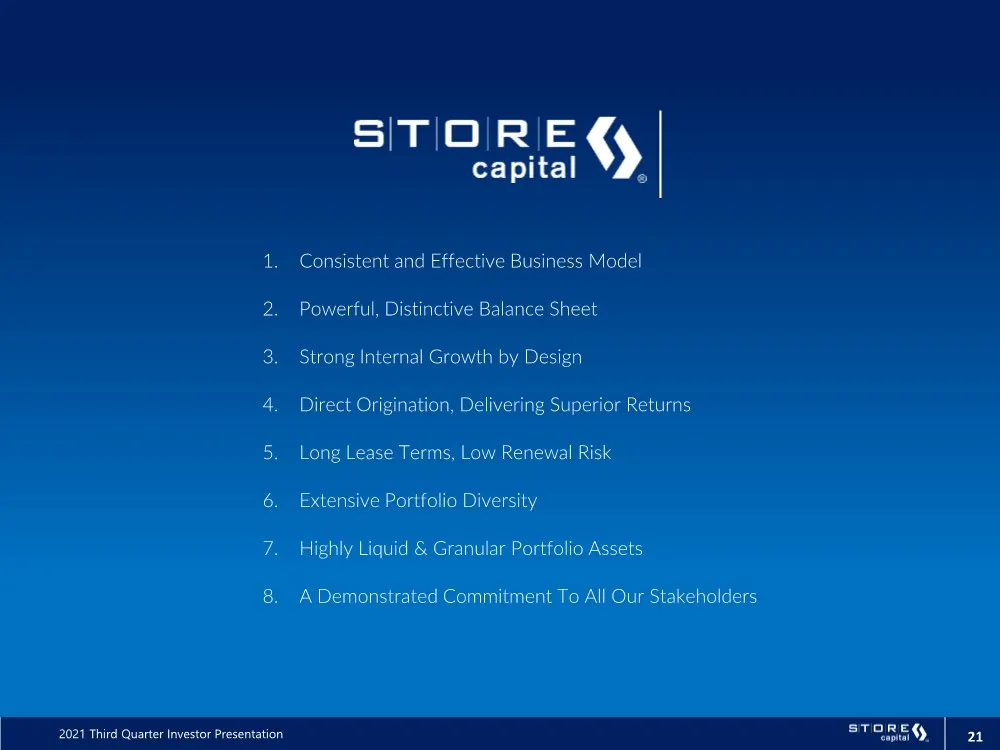
2021 Third Quarter Investor Presentation 21 1. Consistent and Effective Business Model 2. Powerful, Distinctive Balance Sheet 3. Strong Internal Growth by Design 4. Direct Origination, Delivering Superior Returns 5. Long Lease Terms, Low Renewal Risk 6. Extensive Portfolio Diversity 7. Highly Liquid
Slide 22: Third Quarter Appendix
2021 THIRD QUARTER INVESTOR PRESENTATION APPENDIX
Slide 23: Dividend Growth and Protection
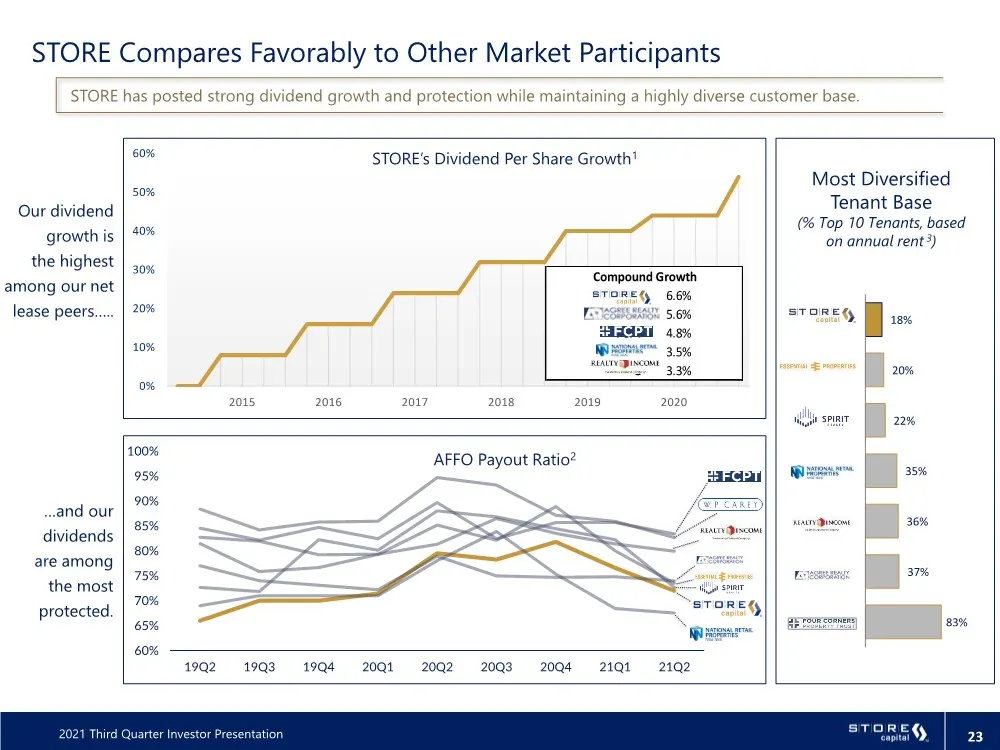
2021 Third Quarter Investor Presentation 23 83% 37% 36% 35% 22% 20% 18% FCPT ADC O NNN SRC EPRT STORE 60% 65% 70% 75% 80% 85% 90% 95% 100% 19Q2 19Q3 19Q4 20Q1 20Q2 20Q3 20Q4 21Q1 21Q2 0% 10% 20% 30% 40% 50% 60% 2015 2016 2017 2018 2019 2020 STORE’s Dividend Per Share Growth1 AFFO Payout Ratio2 STORE
Slide 24: Portfolio Management Impact on Growth
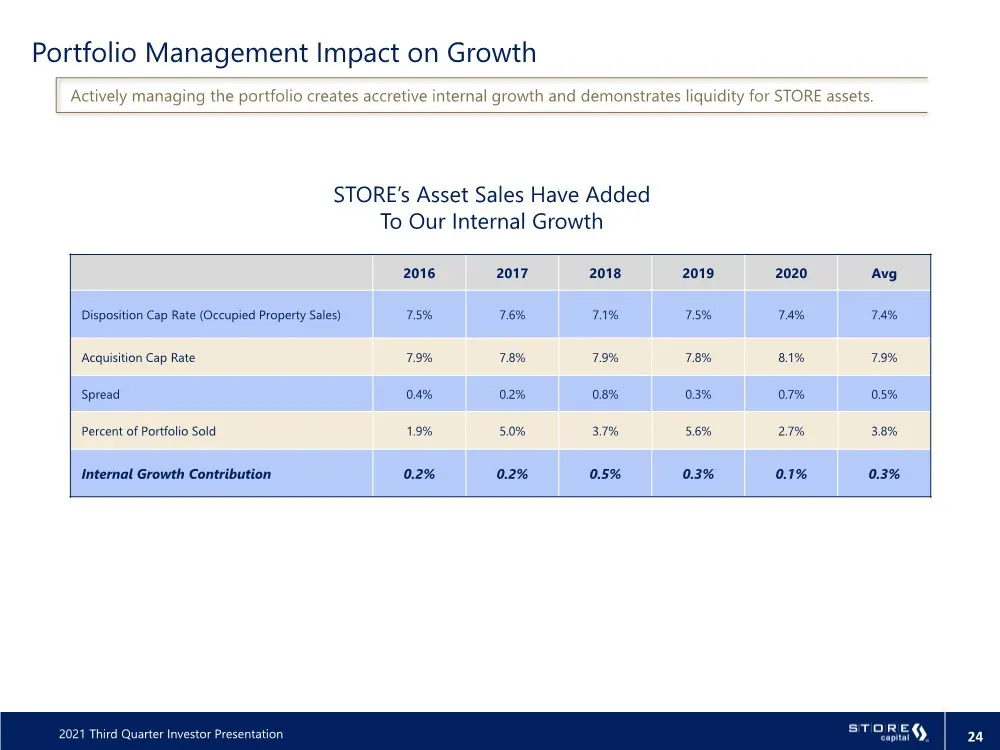
2021 Third Quarter Investor Presentation 24 Portfolio Management Impact on Growth Actively managing the portfolio creates accretive internal growth and demonstrates liquidity for STORE assets. STORE’s Asset Sales Have Added To Our Internal Growth 2016 2017 2018 2019 2020 Avg Disposition Cap Rate (Oc
Slide 25: Portfolio Management Performance
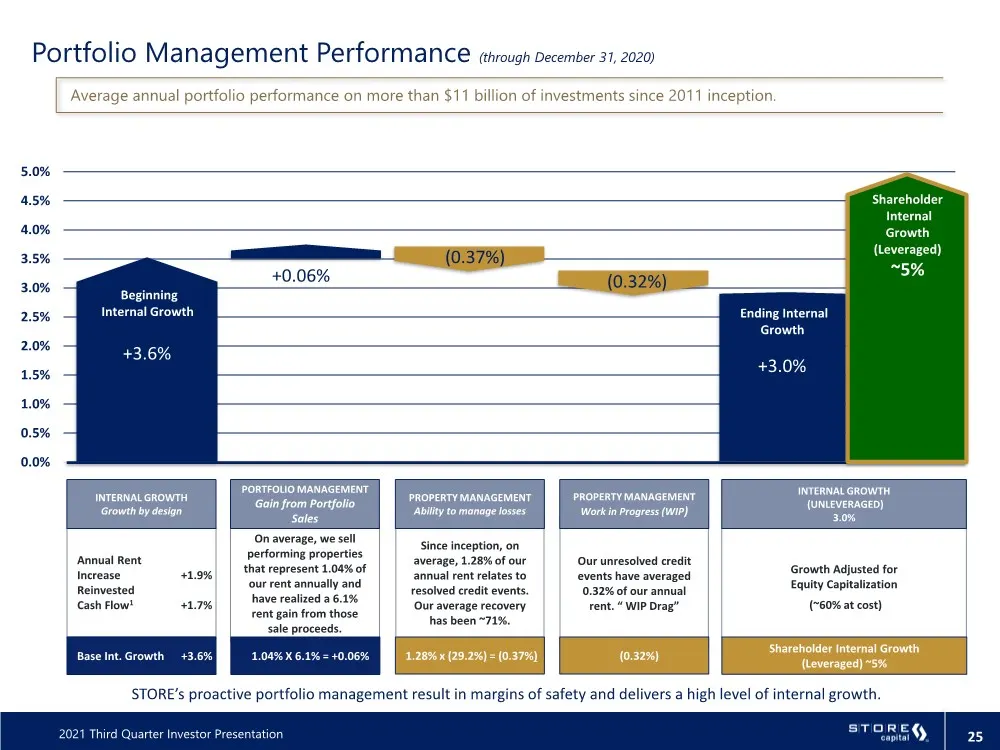
2021 Third Quarter Investor Presentation 25 Since inception, on average, 1.28% of our annual rent relates to resolved credit events. Our average recovery has been ~71%. Our unresolved credit events have averaged 0.32% of our annual rent. “ WIP Drag” Portfolio Management Performance (through December

Slide 26: Third Quarter Financial Information
2021 THIRD QUARTER INVESTOR PRESENTATION FINANCIAL INFORMATION
Slide 27: Condensed Consolidated Statements of Income
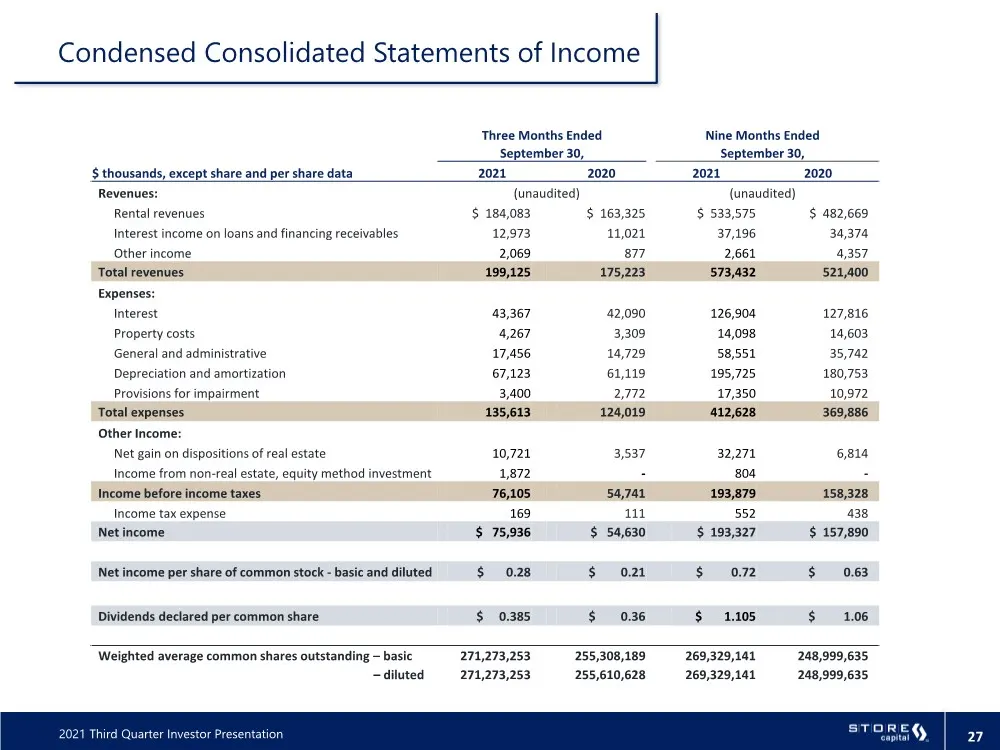
2021 Third Quarter Investor Presentation 27 Condensed Consolidated Statements of Income Three Months Ended Nine Months Ended September 30, September 30, $ thousands, except share and per share data 2021 2020 2021 2020 Revenues: (unaudited) (unaudited) Rental revenues $ 184,083 $ 163,325 $ 533,575 $
Slide 28: Condensed Consolidated Balance Sheets
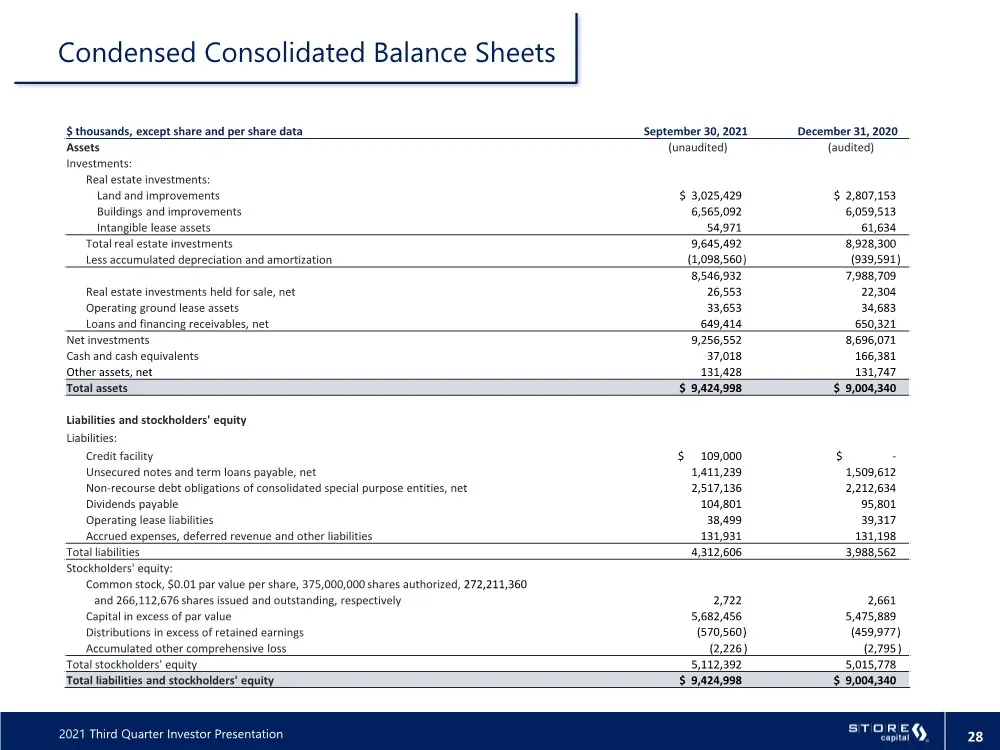
2021 Third Quarter Investor Presentation 28 $ thousands, except share and per share data September 30, 2021 December 31, 2020 Assets (unaudited) (audited) Investments: Real estate investments: Land and improvements $ 3,025,429 $ 2,807,153 Buildings and improvements 6,565,092 6,059,513 Intangible lea
Slide 29: Funds From Operations and Adjusted Funds from Operations
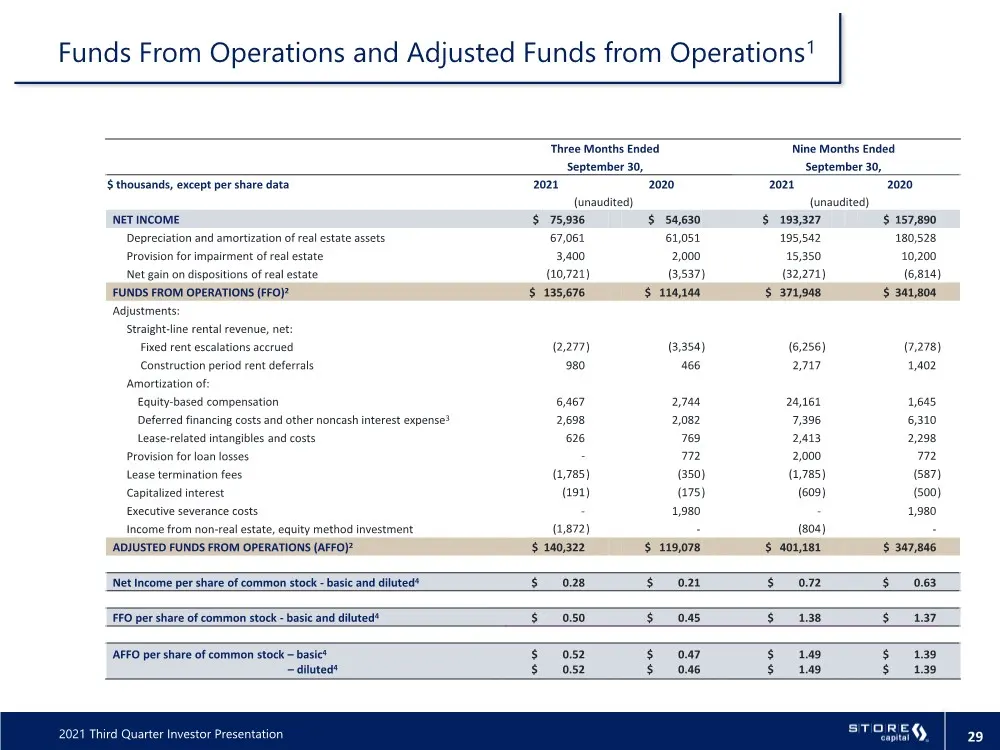
2021 Third Quarter Investor Presentation 29 Funds From Operations and Adjusted Funds from Operations1 Three Months Ended Nine Months Ended September 30, September 30, $ thousands, except per share data 2021 2020 2021 2020 (unaudited) (unaudited) NET INCOME $ 75,936 $ 54,630 $ 193,327 $ 157,890 Depre
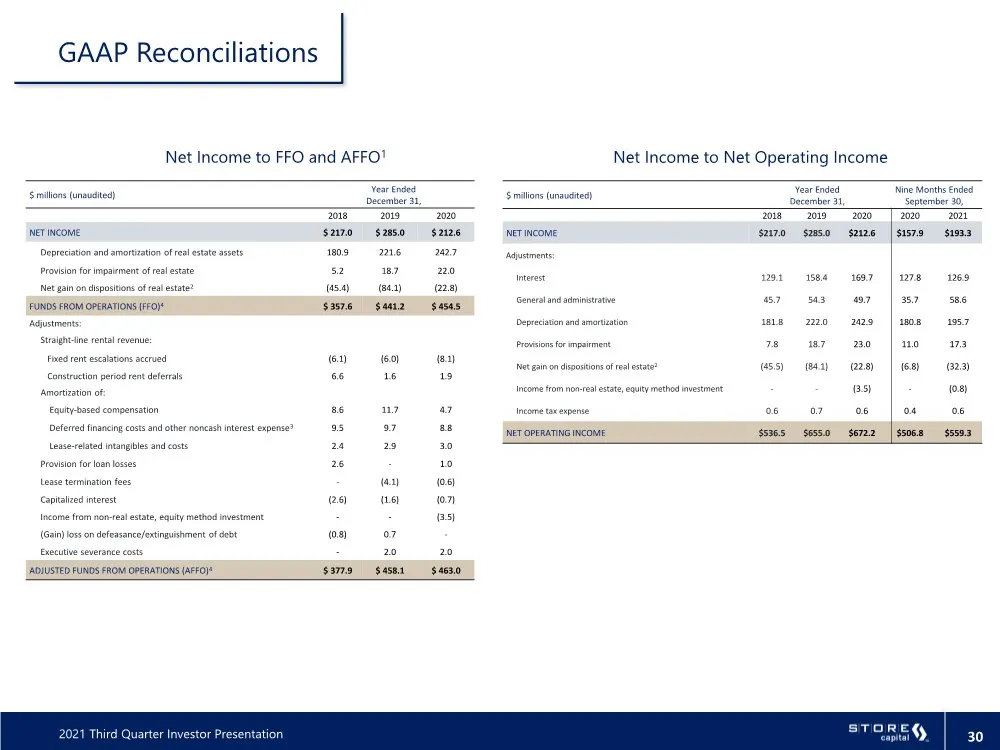
Slide 30: Annual FFO and AFFO reconciliation
2021 Third Quarter Investor Presentation 30 $ millions (unaudited) Year Ended December 31, 2018 2019 2020 NET INCOME $ 217.0 $ 285.0 $ 212.6 Depreciation and amortization of real estate assets 180.9 221.6 242.7 Provision for impairment of real estate 5.2 18.7 22.0 Net gain on dispositions of real es
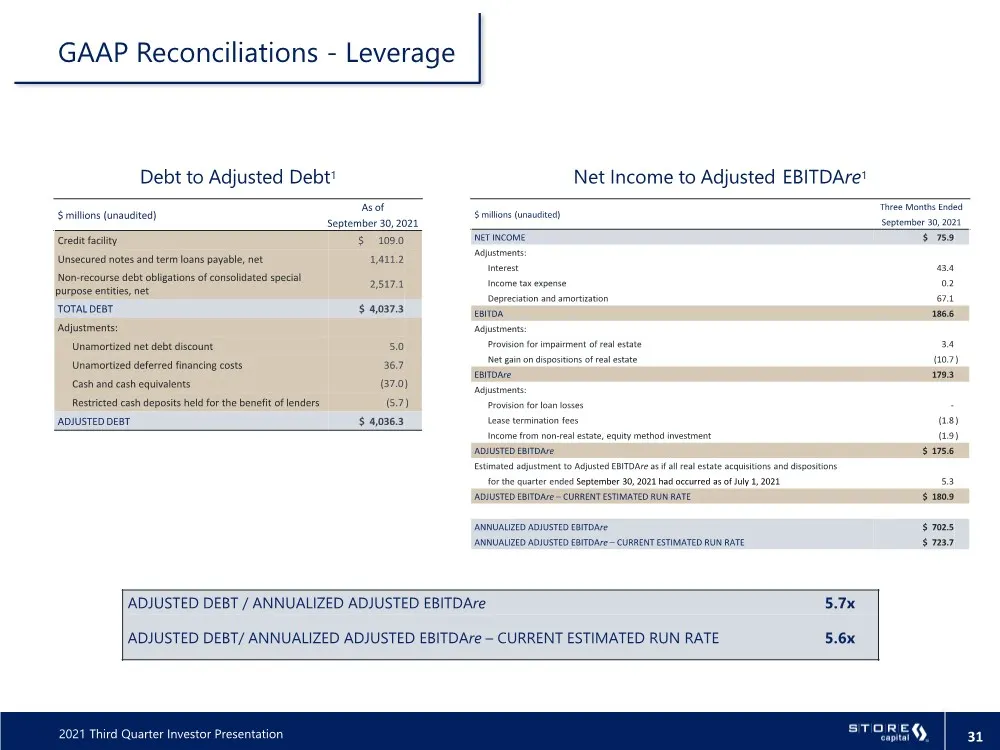
Slide 31: Adjusted Debt and EBITDAre reconciliation
2021 Third Quarter Investor Presentation 31 $ millions (unaudited) As of September 30, 2021 Credit facility $ 109.0 Unsecured notes and term loans payable, net 1,411.2 Non-recourse debt obligations of consolidated special purpose entities, net 2,517.1 TOTAL DEBT $ 4,037.3 Adjustments: Unamortized ne
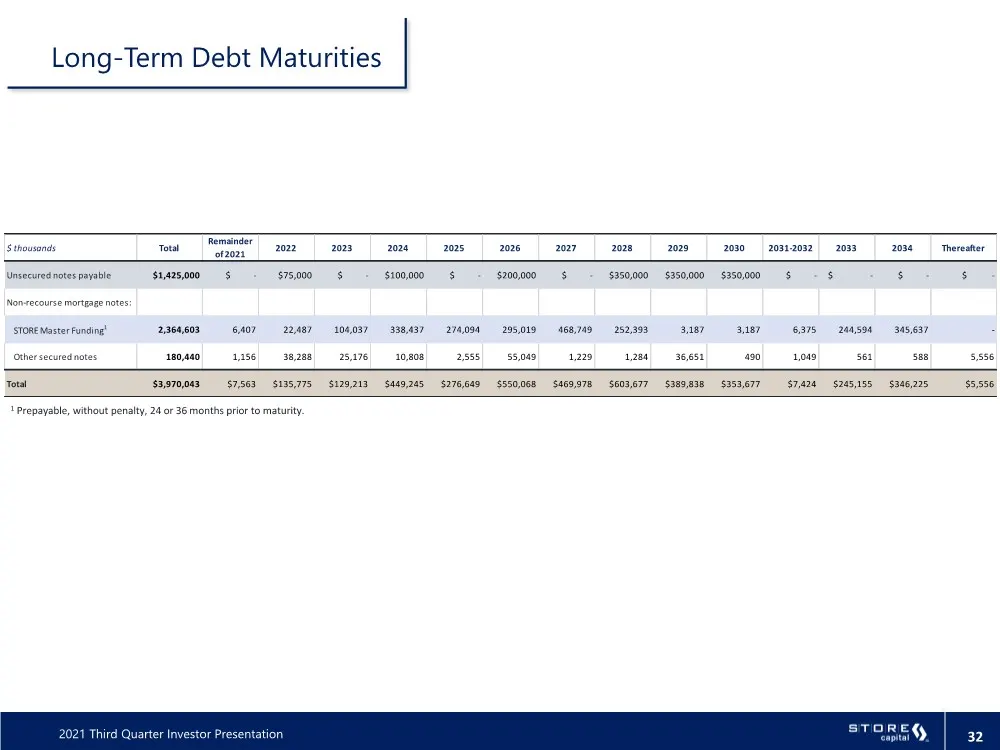
Slide 32: Long-Term Debt Maturities
2021 Third Quarter Investor Presentation 32 $ thousands Total Remainder of 2021 2022 2023 2024 2025 2026 2027 2028 2029 2030 2031-2032 2033 2034 Thereafter Unsecured notes payable $1,425,000 $ - $75,000 $ - $100,000 $ - $200,000 $ - $350,000 $350,000 $350,000 $ - $ - $ - $ - Non-recourse mortgage no
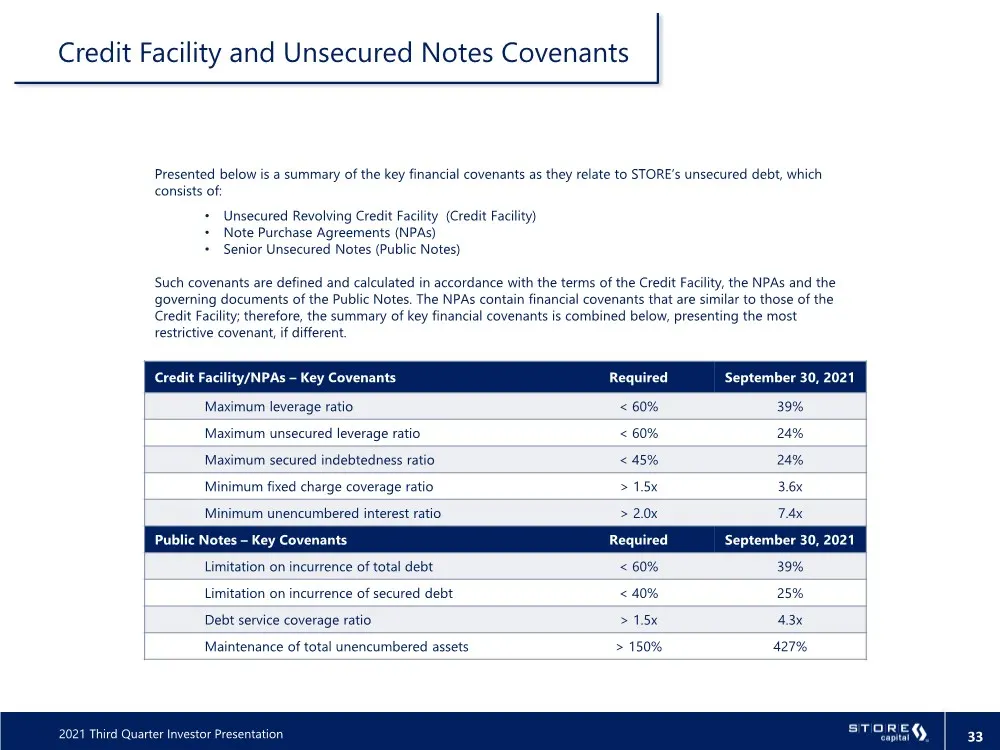
Slide 33: Key Covenants
2021 Third Quarter Investor Presentation 33 Credit Facility/NPAs – Key Covenants Required September 30, 2021 Maximum leverage ratio < 60% 39% Maximum unsecured leverage ratio < 60% 24% Maximum secured indebtedness ratio < 45% 24% Minimum fixed charge coverage ratio > 1.5x 3.6x Minimum unencumbered i
Slide 34: Definitions: FFO and AFFO
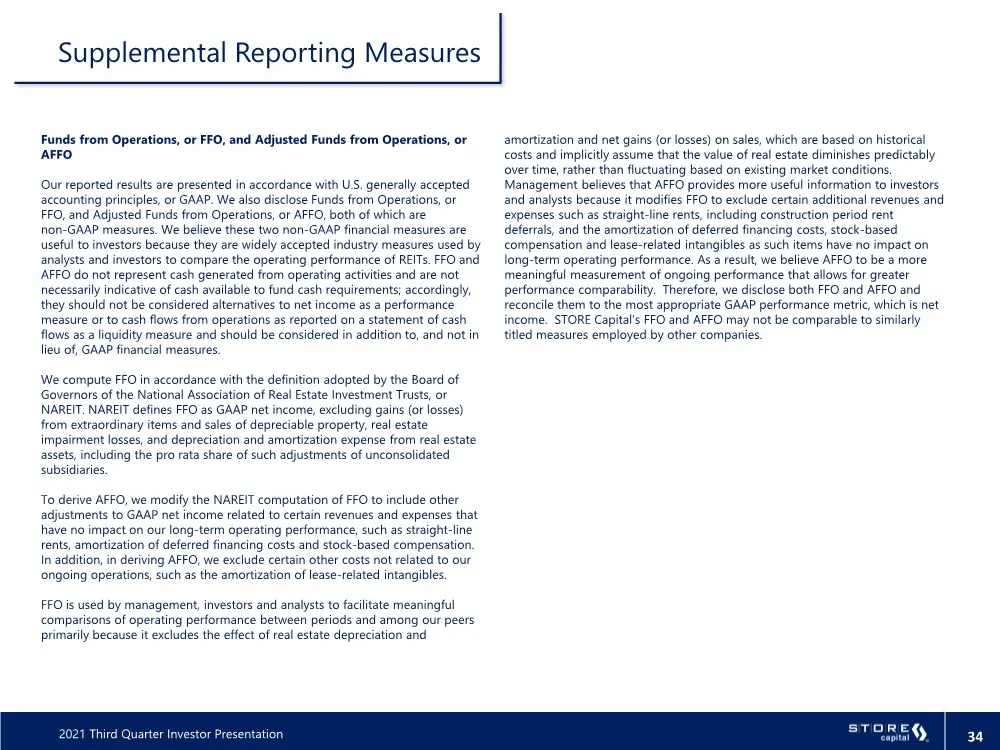
2021 Third Quarter Investor Presentation 34 Funds from Operations, or FFO, and Adjusted Funds from Operations, or AFFO Our reported results are presented in accordance with U.S. generally accepted accounting principles, or GAAP. We also disclose Funds from Operations, or FFO, and Adjusted Funds from
Slide 35: Definitions: EBITDA, EBITDAre and Adjusted EBITDAre
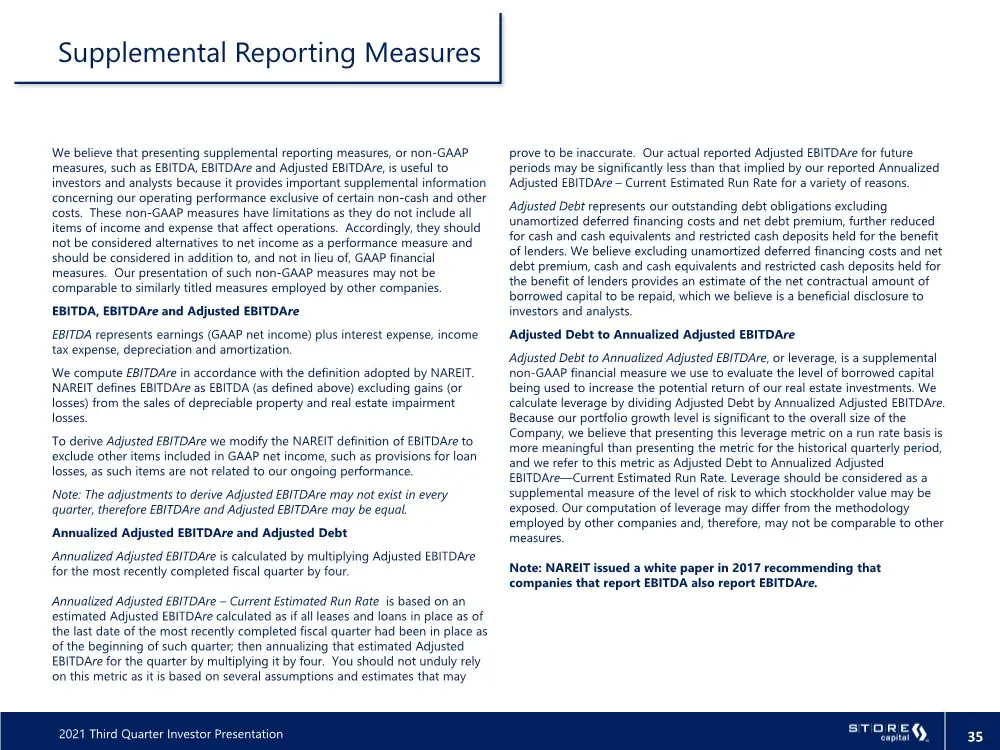
2021 Third Quarter Investor Presentation 35 We believe that presenting supplemental reporting measures, or non-GAAP measures, such as EBITDA, EBITDAre and Adjusted EBITDAre, is useful to investors and analysts because it provides important supplemental information concerning our operating performanc
Slide 36: Footnotes
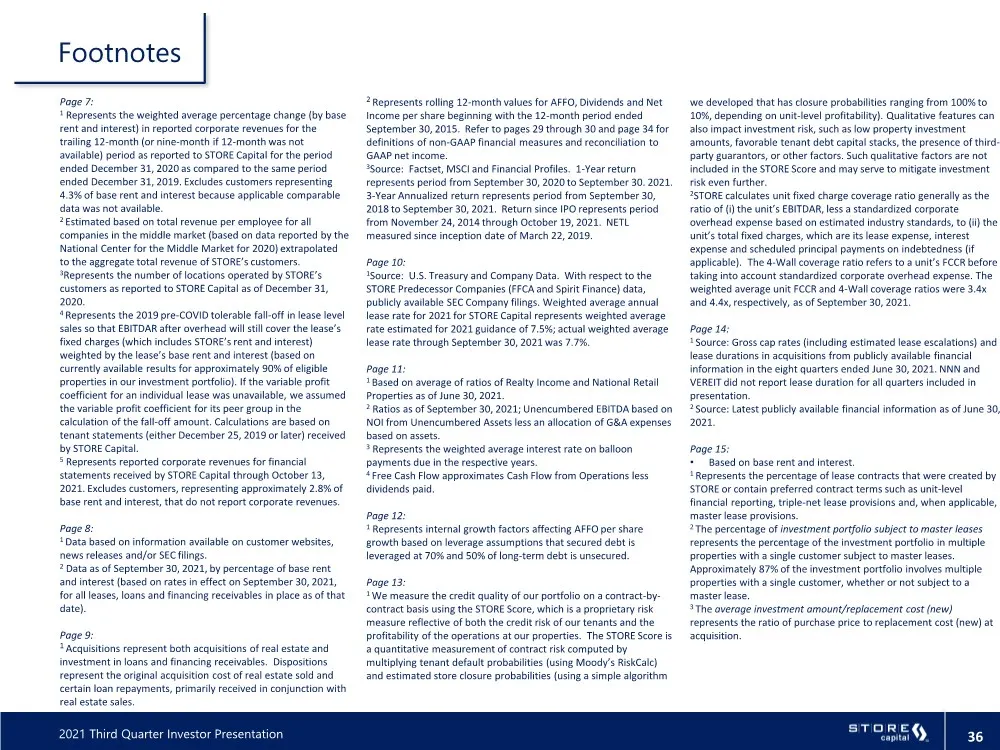
2021 Third Quarter Investor Presentation 36 Footnotes Page 7: 1 Represents the weighted average percentage change (by base rent and interest) in reported corporate revenues for the trailing 12-month (or nine-month if 12-month was not available) period as reported to STORE Capital for the period ende
Slide 37: Footnotes continued
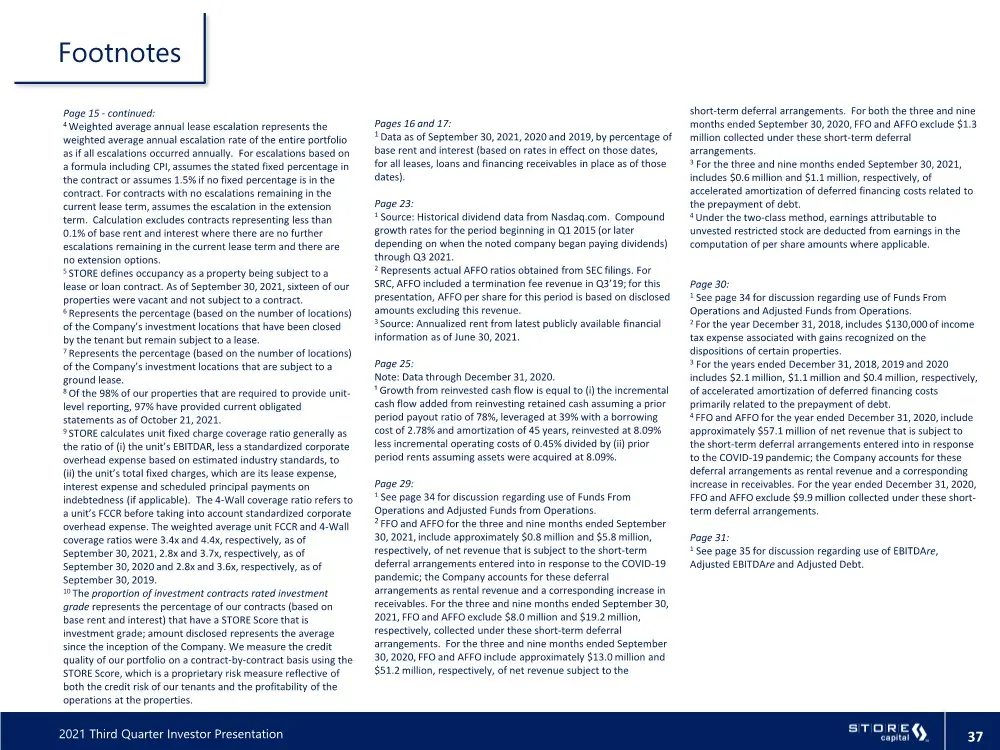
2021 Third Quarter Investor Presentation 37 Footnotes Page 15 - continued: 4 Weighted average annual lease escalation represents the weighted average annual escalation rate of the entire portfolio as if all escalations occurred annually. For escalations based on a formula including CPI, assumes the
Slide 38: Investor and Media Contacts
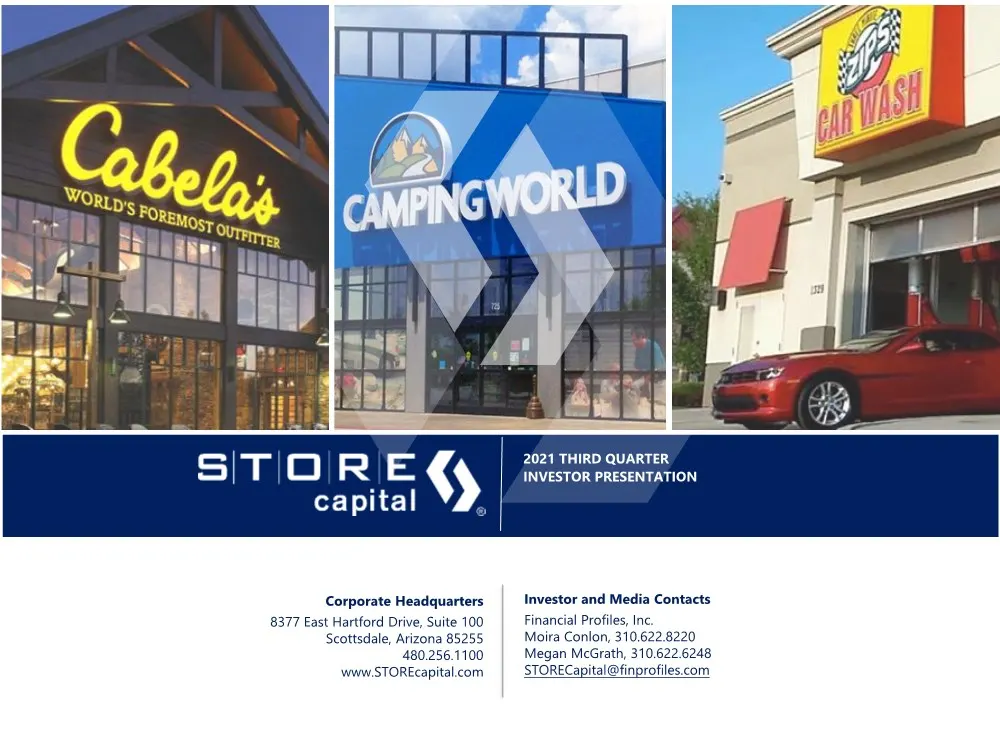
Investor and Media Contacts Financial Profiles, Inc. Moira Conlon, 310.622.8220 Megan McGrath, 310.622.6248 STORECapital@finprofiles.com Corporate Headquarters 8377 East Hartford Drive, Suite 100 Scottsdale, Arizona 85255 480.256.1100 www.STOREcapital.com 2021 THIRD QUARTER INVESTOR PRESENTATION
Source: SEC EDGAR · 8-K filed Nov 4, 2021
More decks from STORE Capital Corp
 Q2 2023 Earnings Presentation10 slides · Aug 4, 2023
 Q2 2022 Earnings Presentation26 slides · Aug 3, 2022
 Q2 2022 Earnings Presentation22 slides · Aug 3, 2022
 Q1 2022 Earnings Presentation26 slides · May 4, 2022
 Q1 2022 Earnings Presentation22 slides · May 4, 2022
 Q4 2021 Earnings Presentation33 slides · Feb 23, 2022