STORE Capital — Q2 2022 Earnings Presentation
22 slides from STORE Capital's earnings presentation, Aug 3, 2022
Slide 1: 2Q22 Supplemental Operating and Financial Information
SINGLE | TENANT | OPERATIONAL | REAL | ESTATE NYSE: STOR ir.storecapital.com 2Q22 Supplemental Operating and Financial Information August 3, 2022
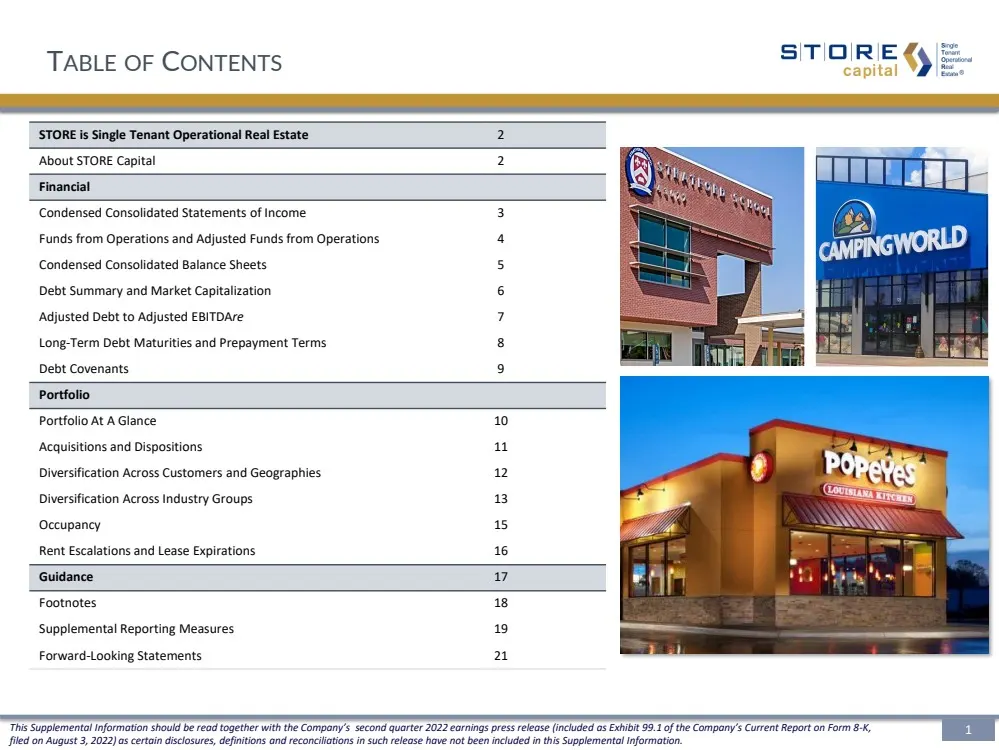
Slide 2: Table of Contents
This Supplemental Information should be read together with the Company’s second quarter 2022 earnings press release (include d a s Exhibit 99.1 of the Company’s Current Report on Form 8 - K, filed on August 3, 2022) as certain disclosures, definitions and reconciliations in such release have not bee
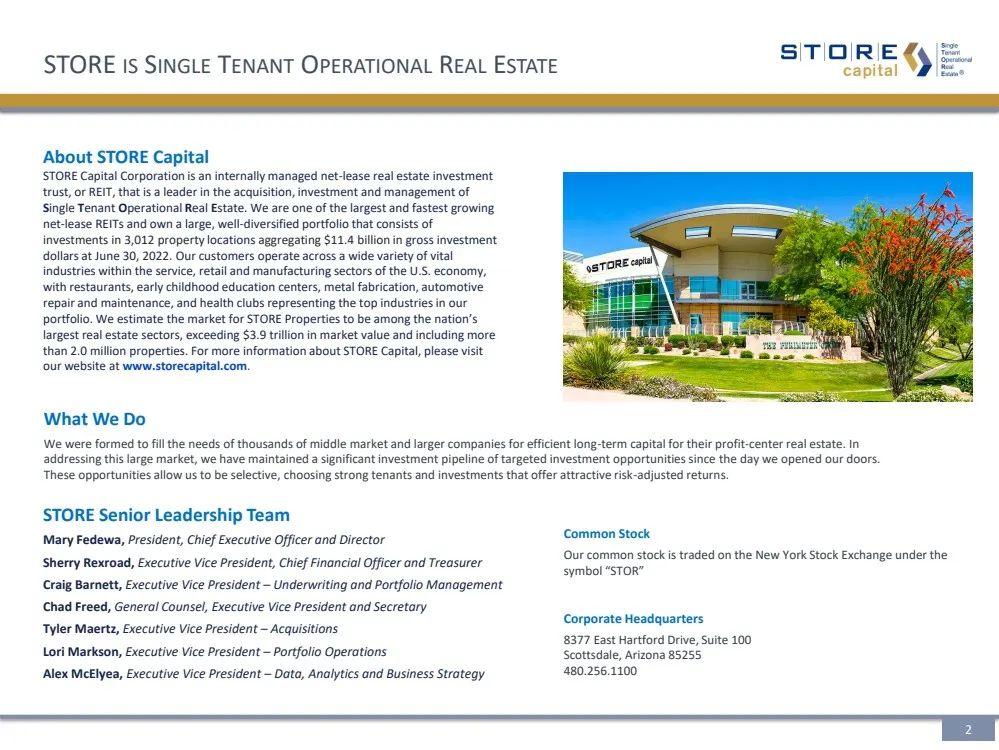
Slide 3: STORE is Single Tenant Operational Real Estate
STORE IS S INGLE T ENANT O PERATIONAL R EAL E STATE What We Do We were formed to fill the needs of thousands of middle market and larger companies for efficient long - term capital for their pr ofit - center real estate. In addressing this large market, we have maintained a significant investment pi
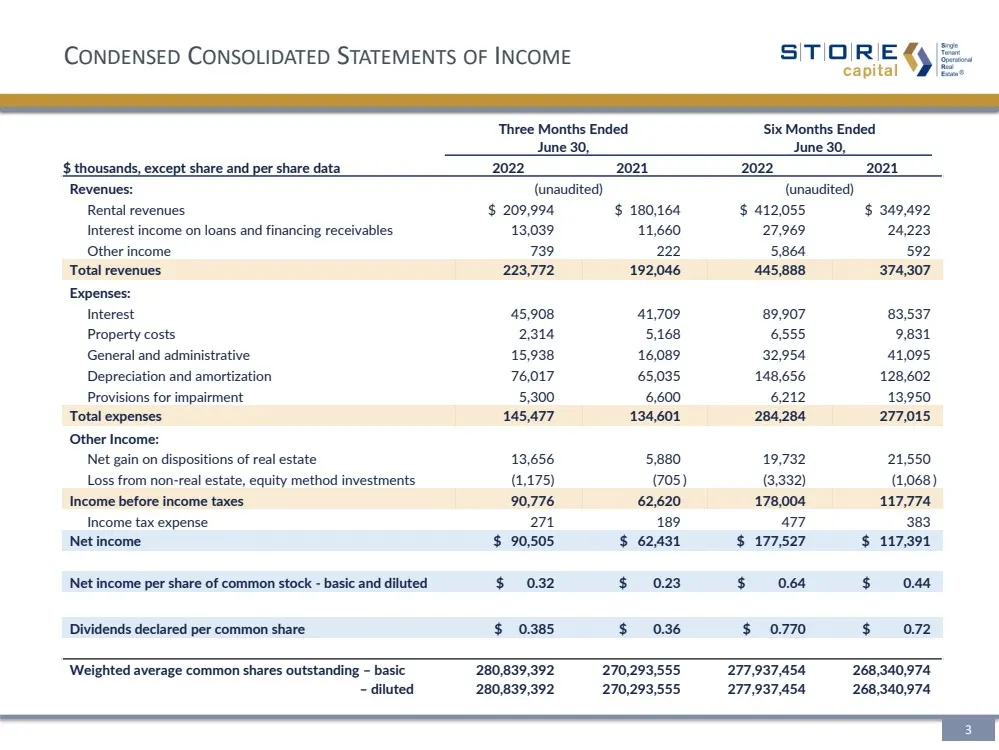
Slide 4: Condensed Consolidated Statements of Income
C ONDENSED C ONSOLIDATED S TATEMENTS OF I NCOME Three Months Ended Six Months Ended June 30, June 30, $ thousands, except share and per share data 2022 2021 2022 2021 Revenues: (unaudited) (unaudited) Rental revenues $ 209,994 $ 180,164 $ 412,055 $ 349,492 Interest income on loans and financing rece
Slide 5: Funds From Operations and Adjusted Funds From Operations
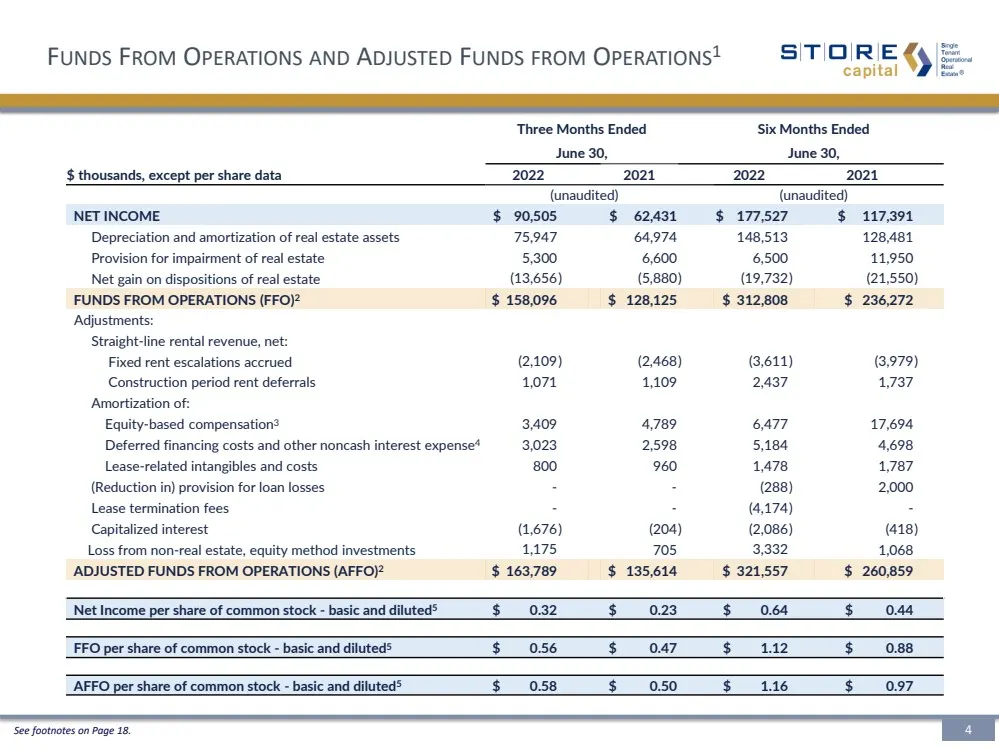
F UNDS F ROM O PERATIONS AND A DJUSTED F UNDS FROM O PERATIONS 1 See footnotes on Page 18. .. Three Months Ended Six Months Ended June 30, June 30, $ thousands, except per share data 2022 2021 2022 2021 (unaudited) (unaudited) NET INCOME $ 90,505 $ 62,431 $ 177,527 $ 117,391 Depreciation and amortiz
Slide 6: Condensed Consolidated Balance Sheets
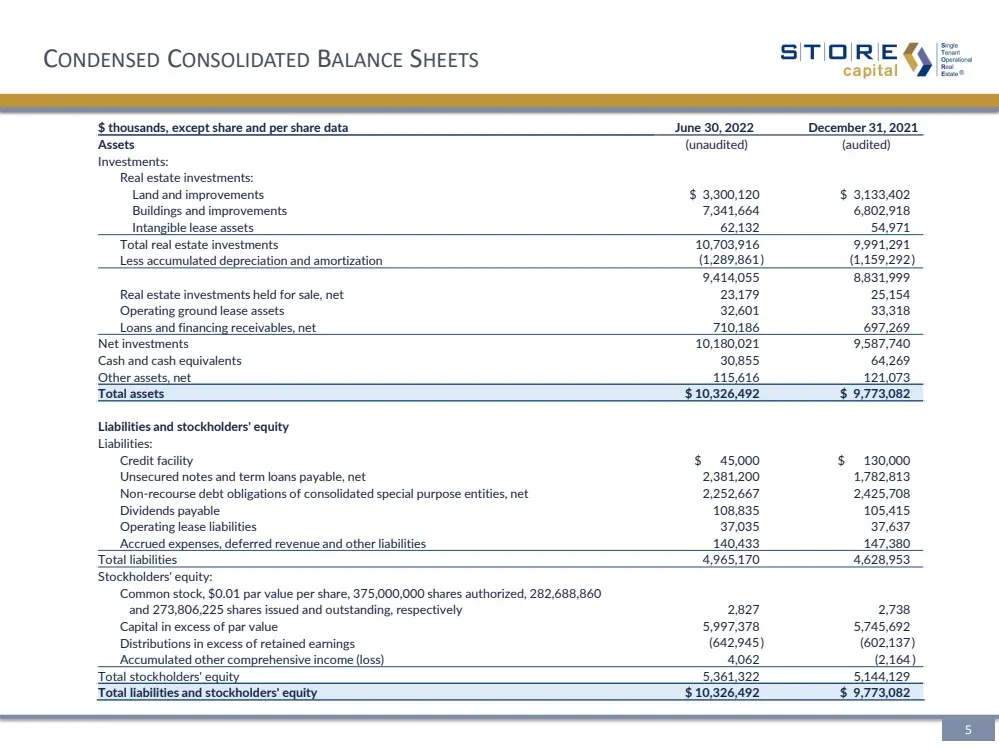
C ONDENSED C ONSOLIDATED B ALANCE S HEETS $ thousands, except share and per share data June 30, 2022 December 31, 2021 Assets (unaudited) (audited) Investments: Real estate investments: Land and improvements $ 3,300,120 $ 3,133,402 Buildings and improvements 7,341,664 6,802,918 Intangible lease asse
Slide 7: Debt Summary and Market Capitalization
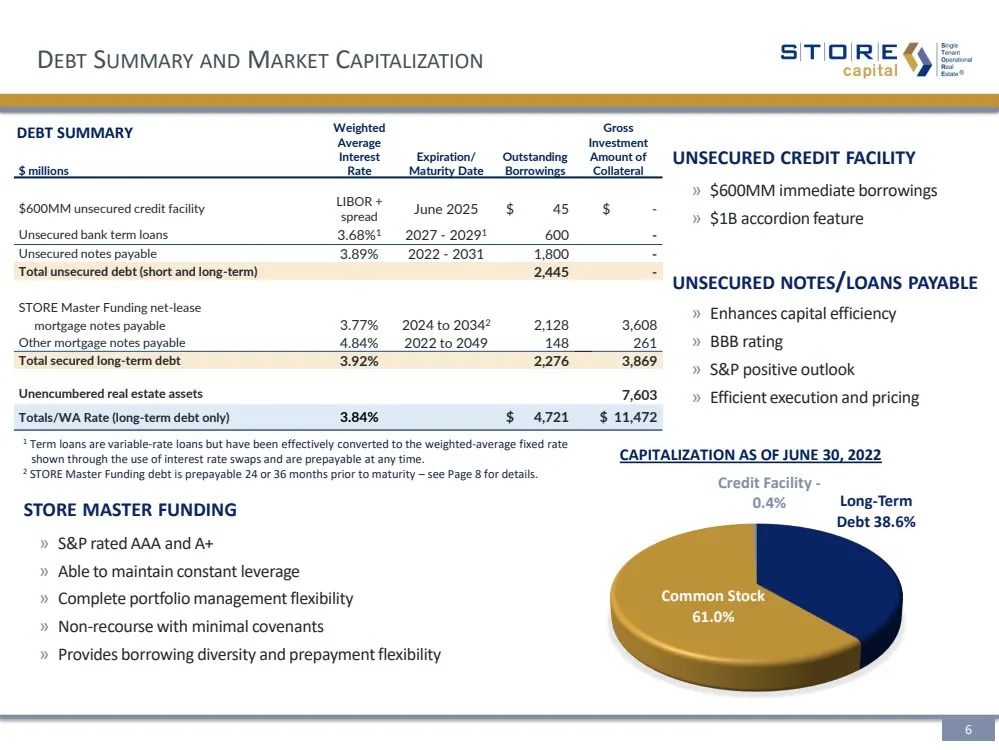
D EBT S UMMARY AND M ARKET C APITALIZATION DEBT SUMMARY DEBT MATURITIES STORE MASTER FUNDING » S&P rated AAA and A+ » Able to maintain constant leverage » Complete portfolio management flexibility » Non - recourse with minimal covenants » Provides borrowing diversity and prepayment flexibility » Enh
Slide 8: Adjusted Debt to Adjusted EBITDAre
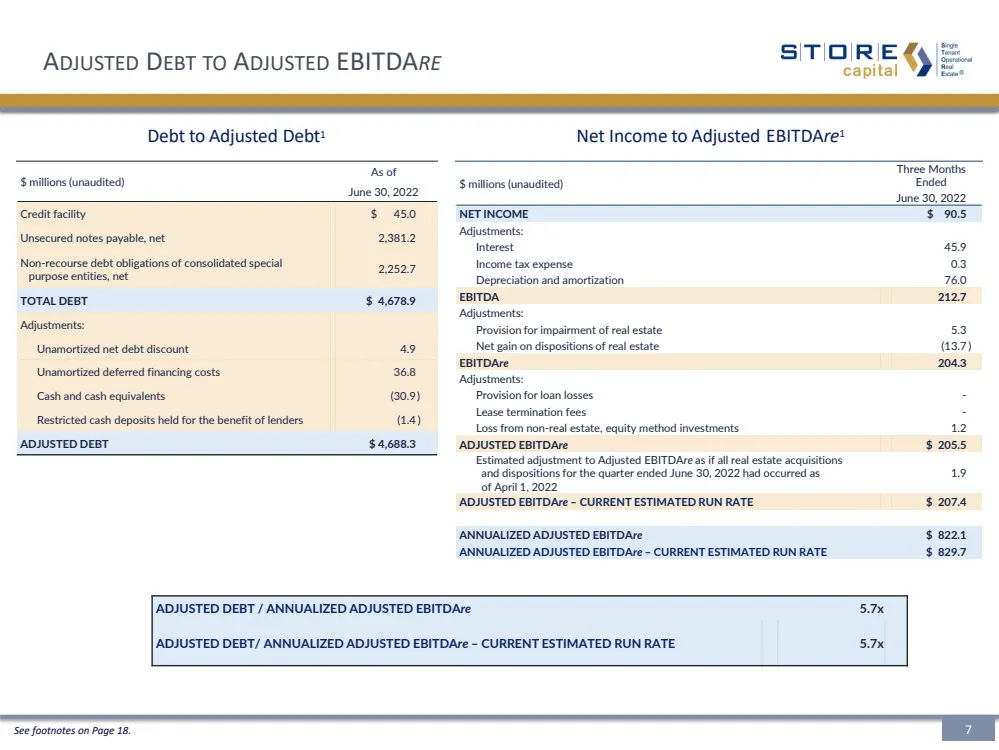
A DJUSTED D EBT TO A DJUSTED EBITDA RE .. $ millions (unaudited) As of June 30, 2022 Credit facility $ 45.0 Unsecured notes payable, net 2,381.2 Non - recourse debt obligations of consolidated special purpose entities, net 2,252.7 TOTAL DEBT $ 4,678.9 Adjustments: Unamortized net debt discount 4.9 U
Slide 9: Long-Term Debt Maturities and Prepayment Terms
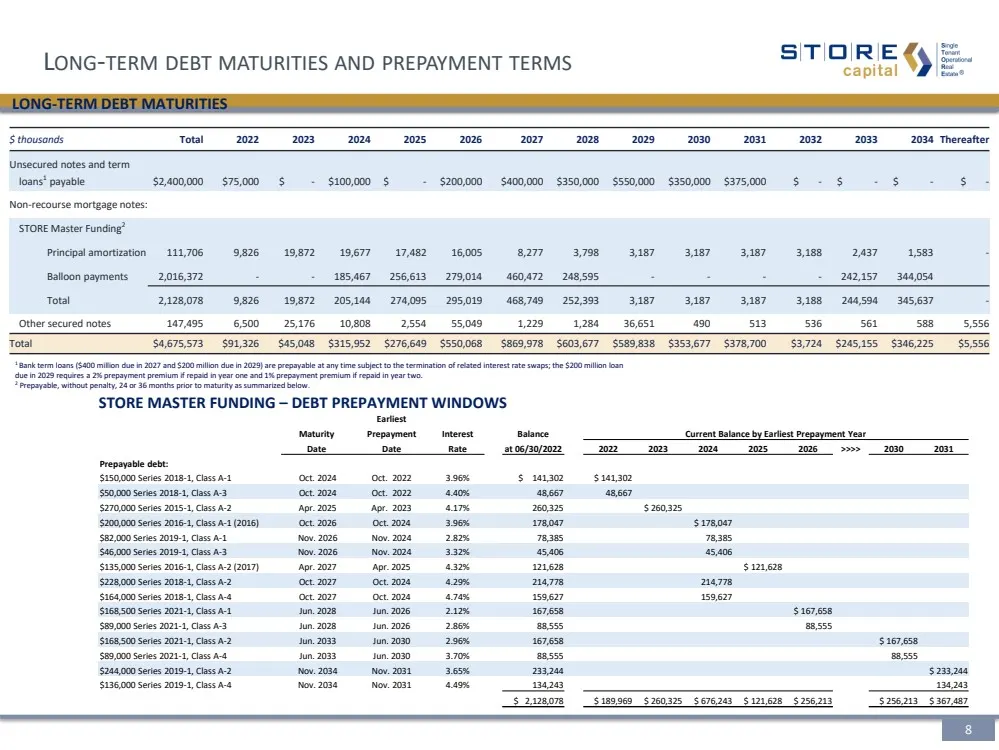
$ thousands Total 2022 2023 2024 2025 2026 2027 2028 2029 2030 2031 2032 2033 2034 Thereafter Unsecured notes and term loans 1 payable $2,400,000 $75,000 $ - $100,000 $ - $200,000 $400,000 $350,000 $550,000 $350,000 $375,000 $ - $ - $ - $ - Non - recourse mortgage notes: STORE Master Funding 2 Princ
Slide 10: Debt Covenants
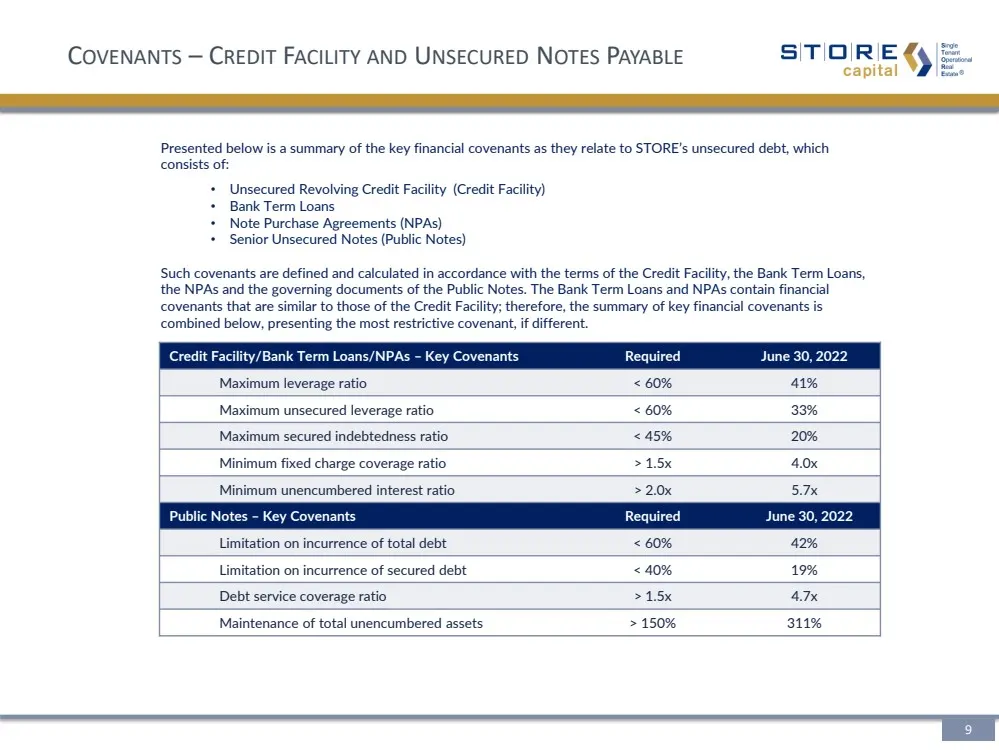
Presented below is a summary of the key financial covenants as they relate to STORE’s unsecured debt, which consists of: • Unsecured Revolving Credit Facility (Credit Facility) • Bank Term Loans • Note Purchase Agreements (NPAs) • Senior Unsecured Notes (Public Notes) Such covenants are defined and
Slide 11: Portfolio at a Glance
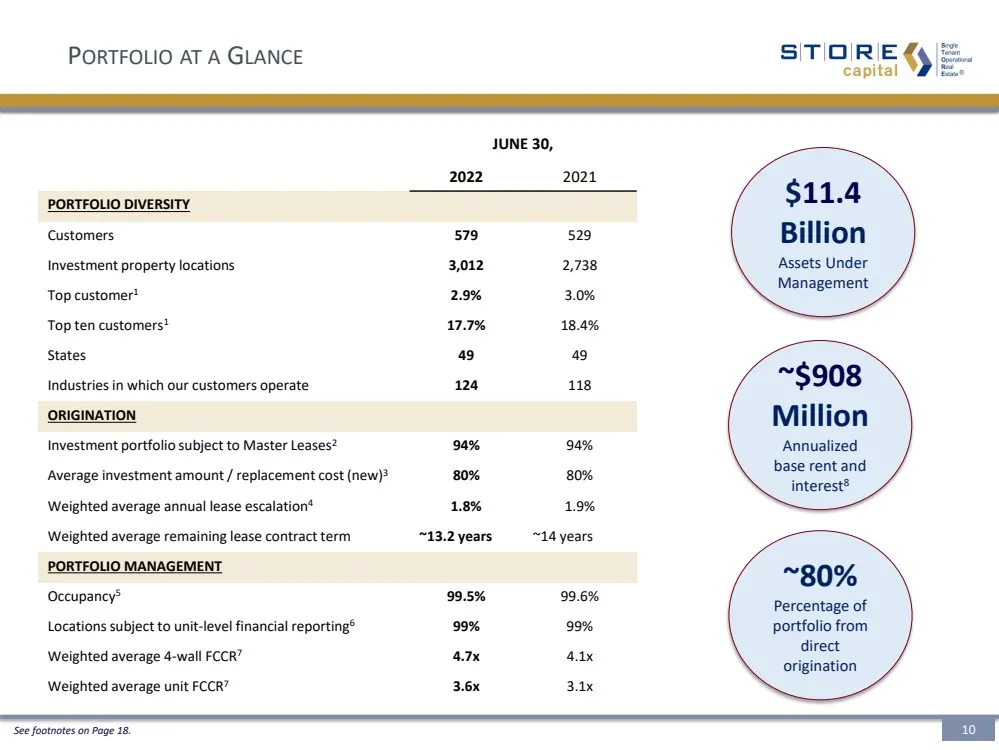
P ORTFOLIO AT A G LANCE JUNE 30, 2022 2021 PORTFOLIO DIVERSITY Customers 579 529 Investment property locations 3,012 2,738 Top customer 1 2.9% 3.0% Top ten customers 1 17.7% 18.4% States 49 49 Industries in which our customers operate 124 118 ORIGINATION Investment portfolio subject to Master Leases
Slide 12: Acquisitions and Dispositions
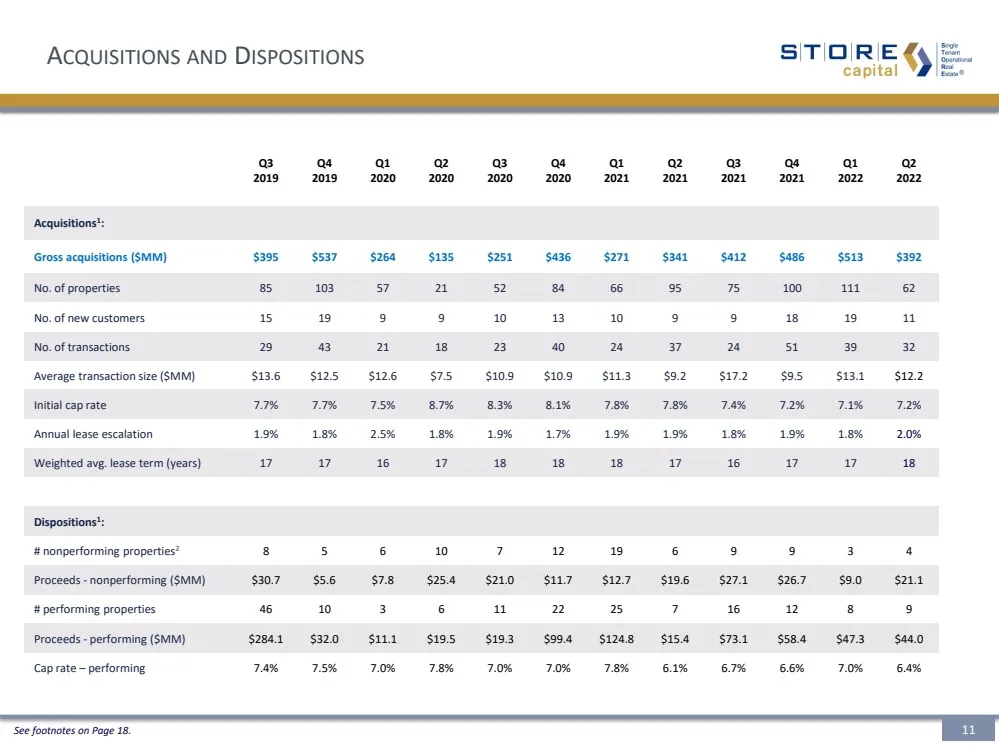
Q3 2019 Q4 2019 Q1 2020 Q2 2020 Q3 2020 Q4 2020 Q1 2021 Q2 2021 Q3 2021 Q4 2021 Q1 2022 Q2 2022 Acquisitions 1 : Gross acquisitions ($MM) $395 $537 $264 $135 $251 $436 $271 $341 $412 $486 $513 $392 No. of properties 85 103 57 21 52 84 66 95 75 100 111 62 No. of new customers 15 19 9 9 10 13 10 9 9 1
Slide 13: Diversification Across Customers and Geographies
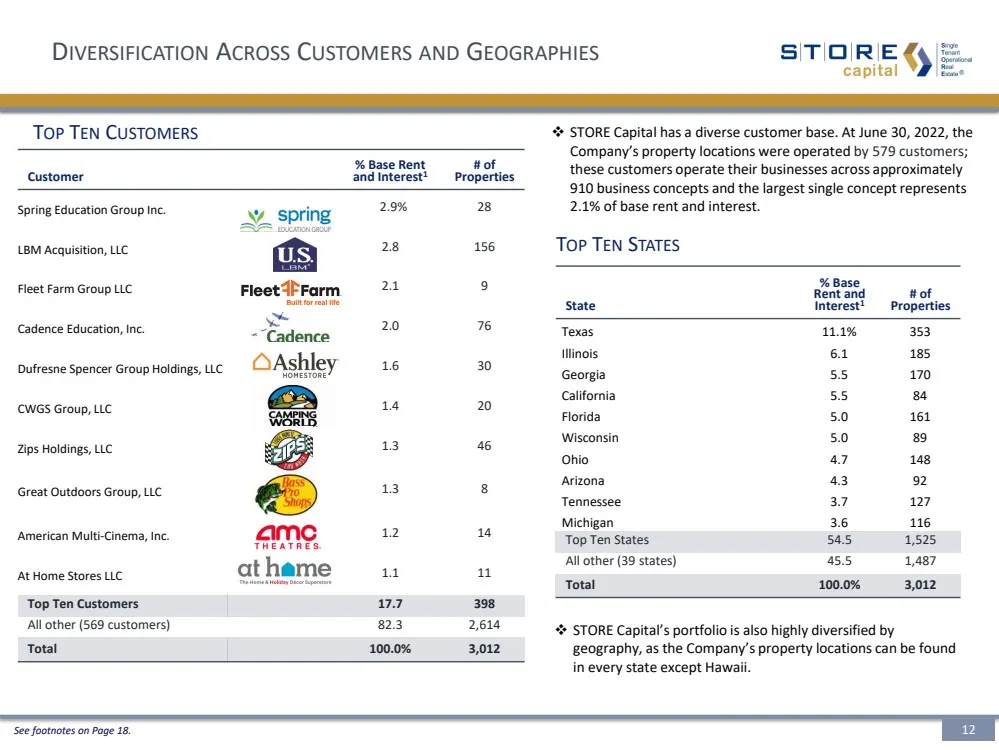
D IVERSIFICATION A CROSS C USTOMERS AND G EOGRAPHIES T OP T EN S TATES State % Base Rent and Interest 1 # of Properties Texas 11.1% 353 Illinois 6.1 185 Georgia 5.5 170 California 5.5 84 Florida 5.0 161 Wisconsin 5.0 89 Ohio 4.7 148 Arizona 4.3 92 Tennessee 3.7 127 Michigan 3.6 116 Top Ten States 54
Slide 14: Diversification Across Industry Groups
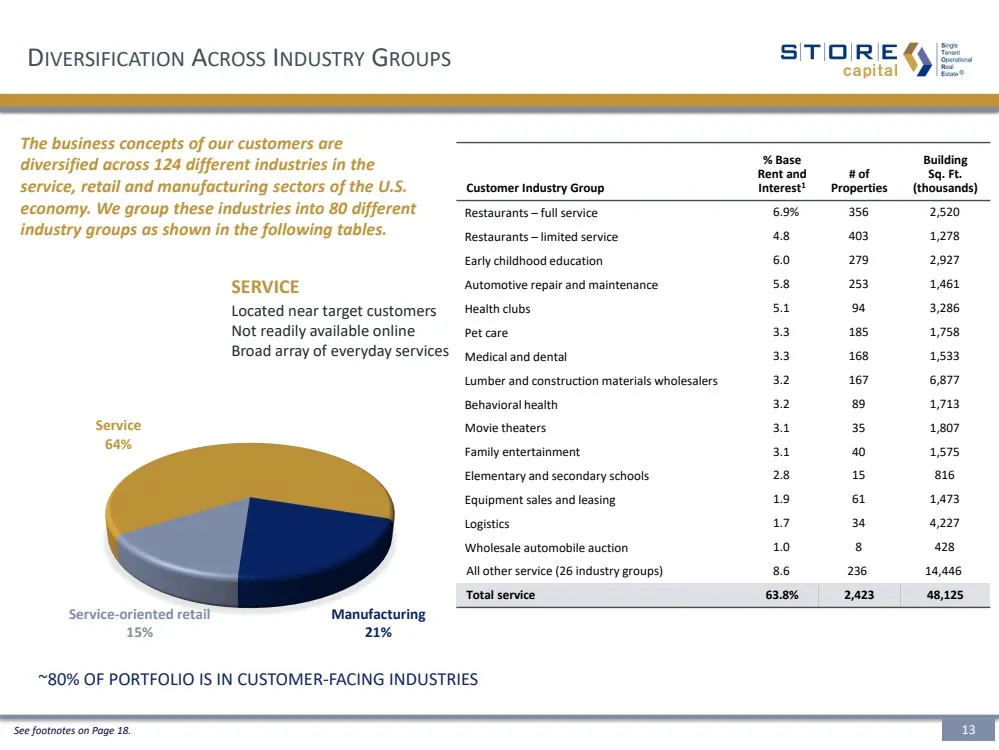
D IVERSIFICATION A CROSS I NDUSTRY G ROUPS ~80% OF P ORTFOLIO IS IN C USTOMER - F ACING I NDUSTRIES Located near target customers Not readily available online Broad array of everyday services SERVICE Service 64% Manufacturing 21% Service - oriented retail 15% Customer Industry Group % Base Rent and
Slide 15: Diversification Across Industry Groups (continued)
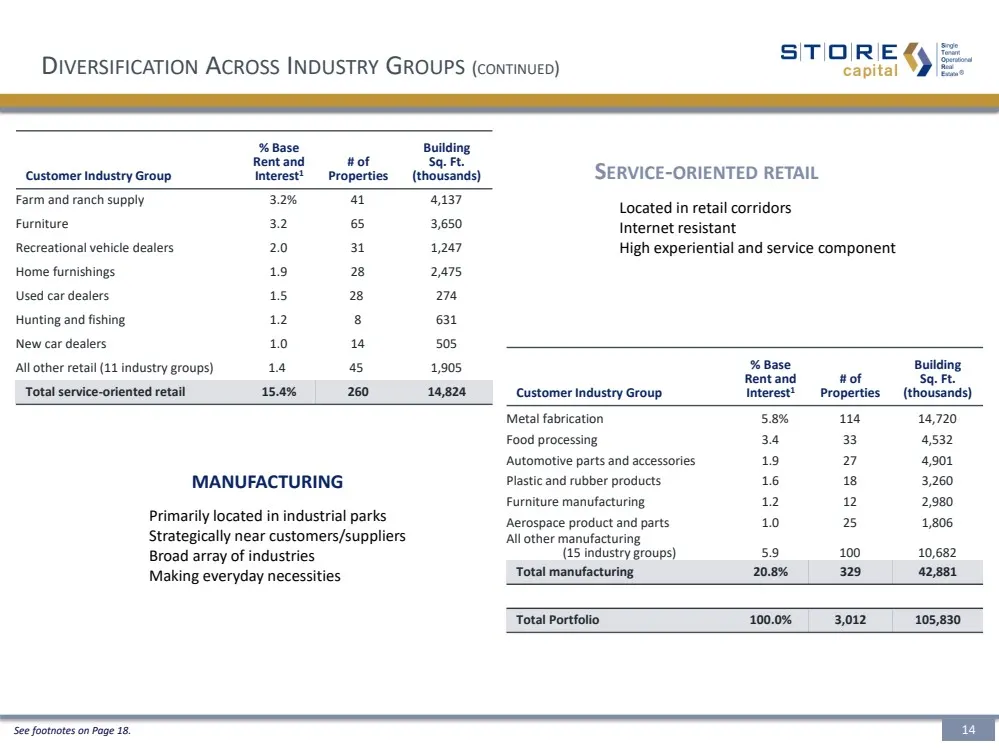
D IVERSIFICATION A CROSS I NDUSTRY G ROUPS ( CONTINUED ) Customer Industry Group % Base Rent and Interest 1 # of Properties Building Sq. Ft. (thousands) Farm and ranch supply 3.2% 41 4,137 Furniture 3.2 65 3,650 Recreational vehicle dealers 2.0 31 1,247 Home furnishings 1.9 28 2,475 Used car dealers
Slide 16: Occupancy
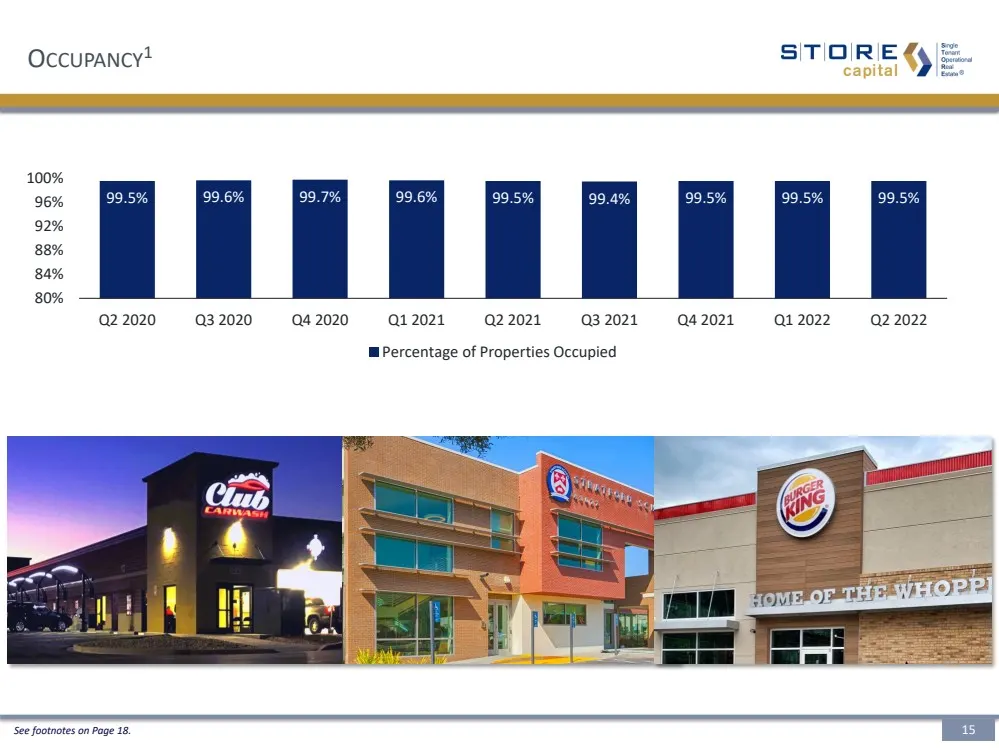
99.5% 99.6% 99.7% 99.6% 99.5% 99.4% 99.5% 99.5% 99.5% 80% 84% 88% 92% 96% 100% Q2 2020 Q3 2020 Q4 2020 Q1 2021 Q2 2021 Q3 2021 Q4 2021 Q1 2022 Q2 2022 Percentage of Properties Occupied O CCUPANCY 1 15 See footnotes on Page 18. ..
Slide 17: Rent Escalations and Contract Expirations
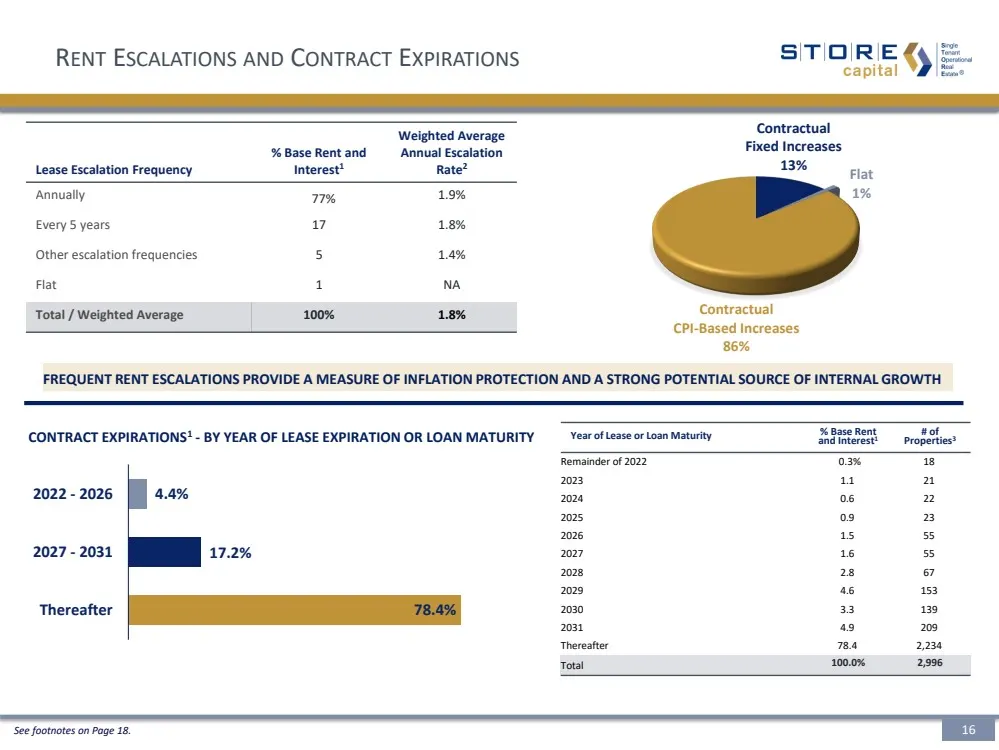
R ENT E SCALATIONS AND C ONTRACT E XPIRATIONS FREQUENT RENT ESCALATIONS PROVIDE A MEASURE OF INFLATION PROTECT ION AND A STRONG POTENTIAL SOURCE OF INTERNAL GROWTH Lease Escalation Frequency % Base Rent and Interest 1 Weighted Average Annual Escalation Rate 2 Annually 77% 1.9% Every 5 years 17 1.8%
Slide 18: 2022 Guidance
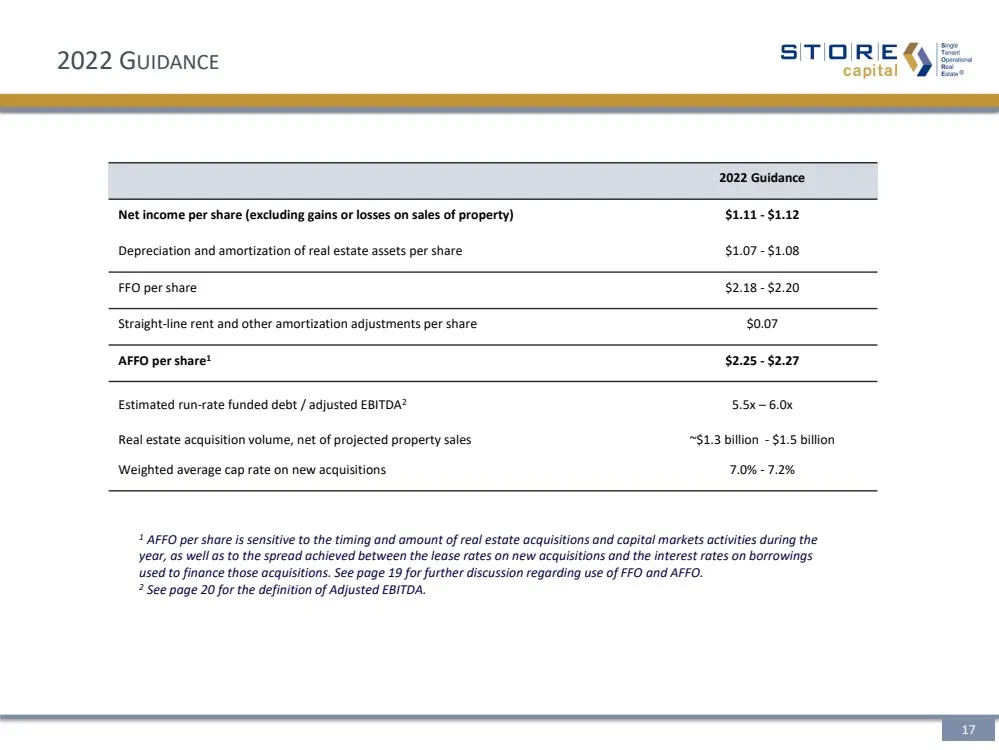
2022 G UIDANCE 2022 Guidance Net income per share (excluding gains or losses on sales of property) $1.11 - $1.12 Depreciation and amortization of real estate assets per share $1.07 - $1.08 FFO per share $2.18 - $2.20 Straight - line rent and other amortization adjustments per share $0.07 AFFO per sh
Slide 19: Footnotes
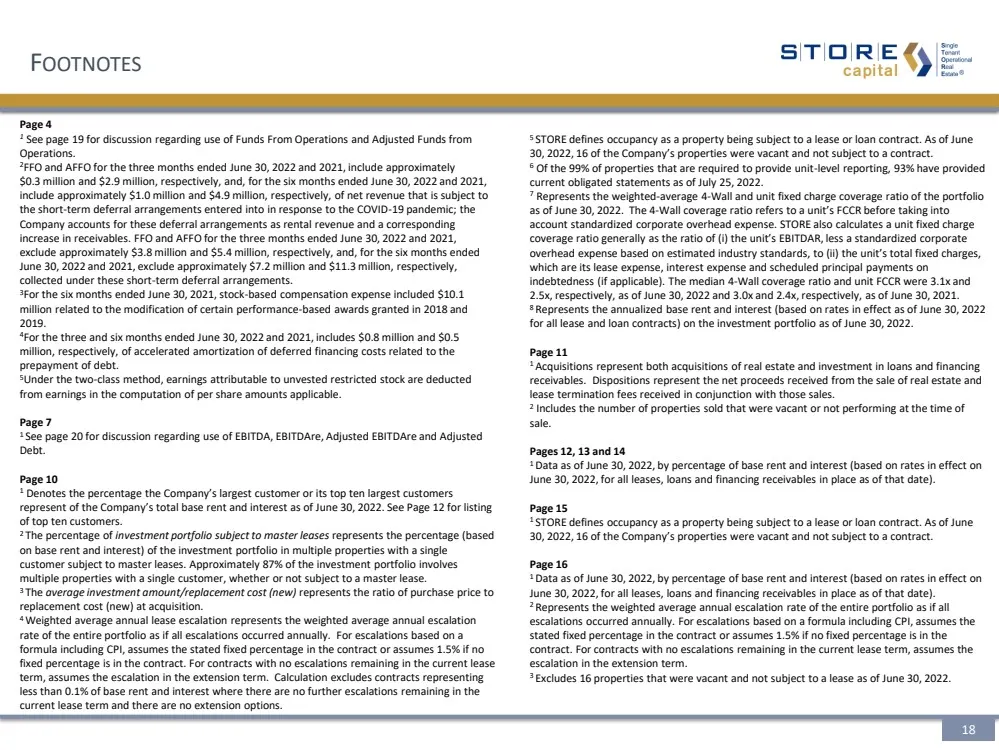
F OOTNOTES Page 4 1 See page 19 for discussion regarding use of Funds From Operations and Adjusted Funds from Operations. 2 FFO and AFFO for the three months ended June 30, 2022 and 2021, include approximately $0.3 million and $2.9 million, respectively, and, for the six months ended June 30, 2022 a
Slide 20: Supplemental Reporting Measures
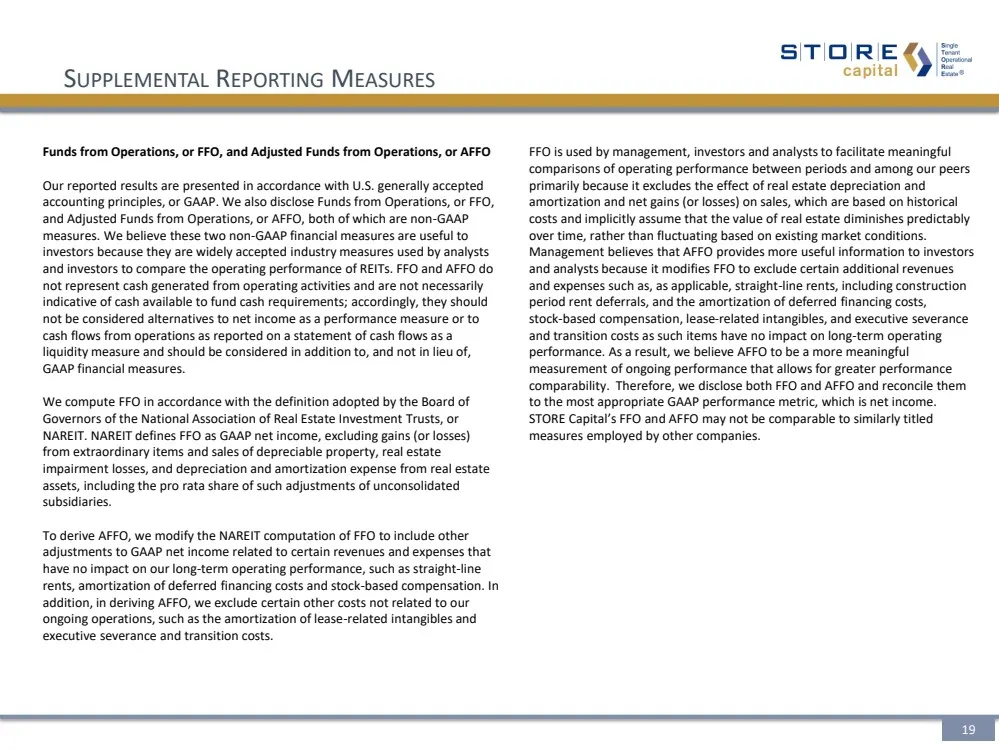
S UPPLEMENTAL R EPORTING M EASURES Funds from Operations, or FFO, and Adjusted Funds from Operations, or AFFO Our reported results are presented in accordance with U.S. generally accepted accounting principles, or GAAP. We also disclose Funds from Operations, or FFO, and Adjusted Funds from Operatio
Slide 21: Supplemental Reporting Measures
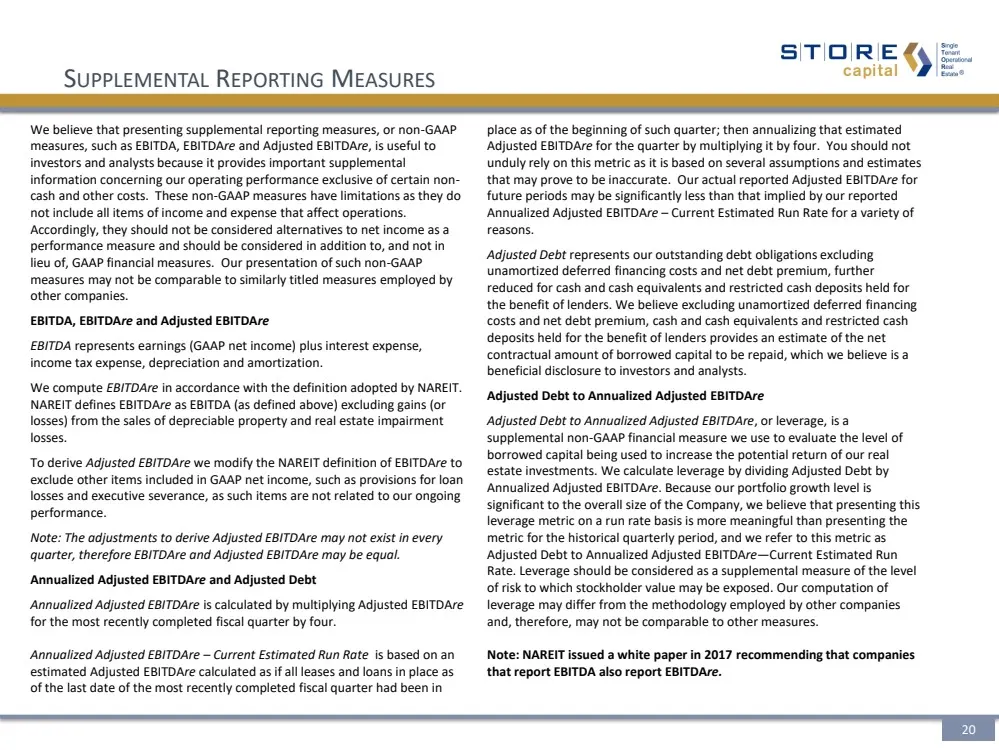
S UPPLEMENTAL R EPORTING M EASURES We believe that presenting supplemental reporting measures, or non - GAAP measures, such as EBITDA, EBITDA re and Adjusted EBITDA re , is useful to investors and analysts because it provides important supplemental information concerning our operating performance ex
Slide 22: Forward-Looking Statements
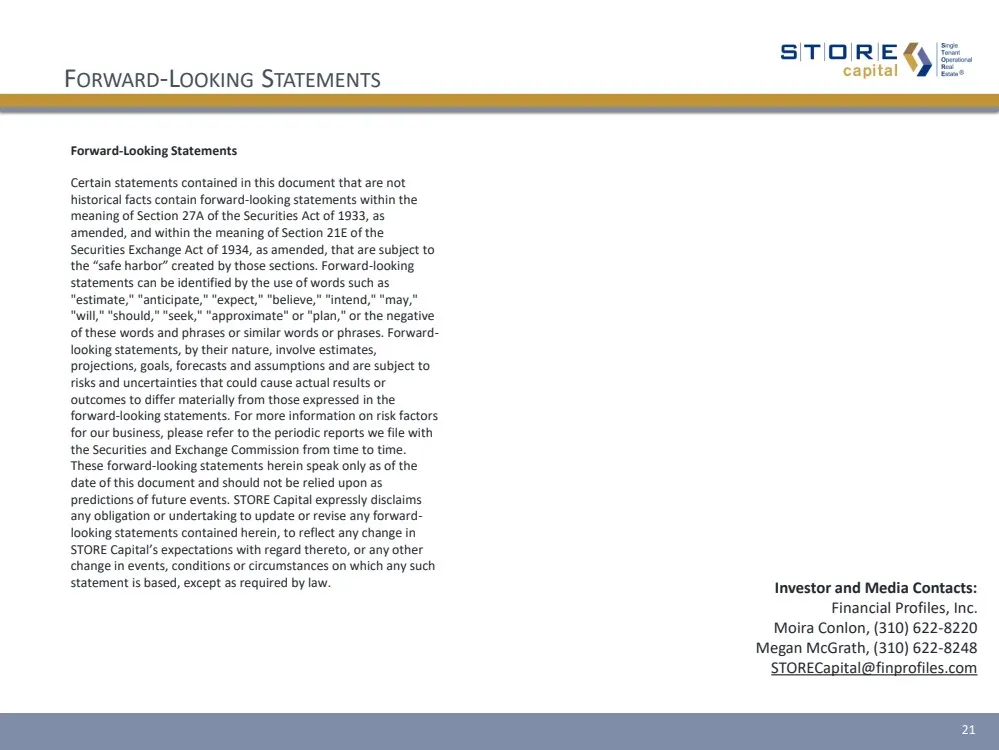
Forward - Looking Statements Certain statements contained in this document that are not historical facts contain forward - looking statements within the meaning of Section 27A of the Securities Act of 1933, as amended, and within the meaning of Section 21E of the Securities Exchange Act of 1934, as
Source: SEC EDGAR · 8-K filed Aug 3, 2022
More decks from STORE Capital Corp
 Q2 2023 Earnings Presentation10 slides · Aug 4, 2023
 Q2 2022 Earnings Presentation26 slides · Aug 3, 2022
 Q1 2022 Earnings Presentation26 slides · May 4, 2022
 Q1 2022 Earnings Presentation22 slides · May 4, 2022
 Q4 2021 Earnings Presentation33 slides · Feb 23, 2022
 Q3 2021 Earnings Presentation38 slides · Nov 4, 2021