STORE Capital — Q2 2022 Earnings Presentation
26 slides from STORE Capital's earnings presentation, Aug 3, 2022
Slide 1: 2022 Second Quarter Investor Presentation
202 2 second quarter investor presentation a leader in real estate capital solutions
Slide 2: Disclaimer
2022 second quarter investor presentation 2 disclaimer This presentation contains forward - looking statements within the meaning of Section 27A of the Securities Act of 1933, as amended, or the Securities Act, and Section 21E of the Securities Exchange Act of 1934, as amended, or the Exchange Act.
Slide 3: Overview
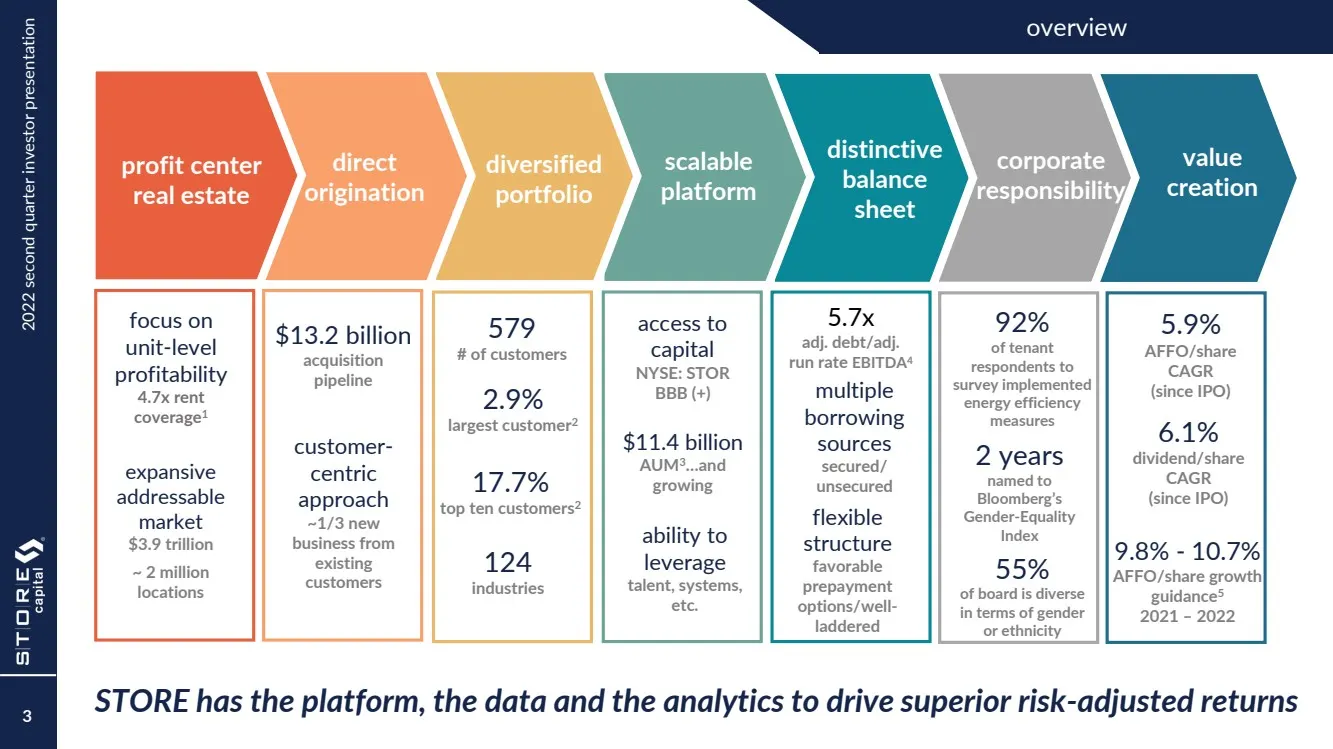
2022 second quarter investor presentation 3 overview STORE has the platform, the data and the analytics to drive superior risk - adjusted returns profit center real estate direct origination diversified portfolio scalable platform distinctive balance sheet corporate responsibility focus on unit - le
Slide 4: Owning profit center real estate is core to STORE's investment approach
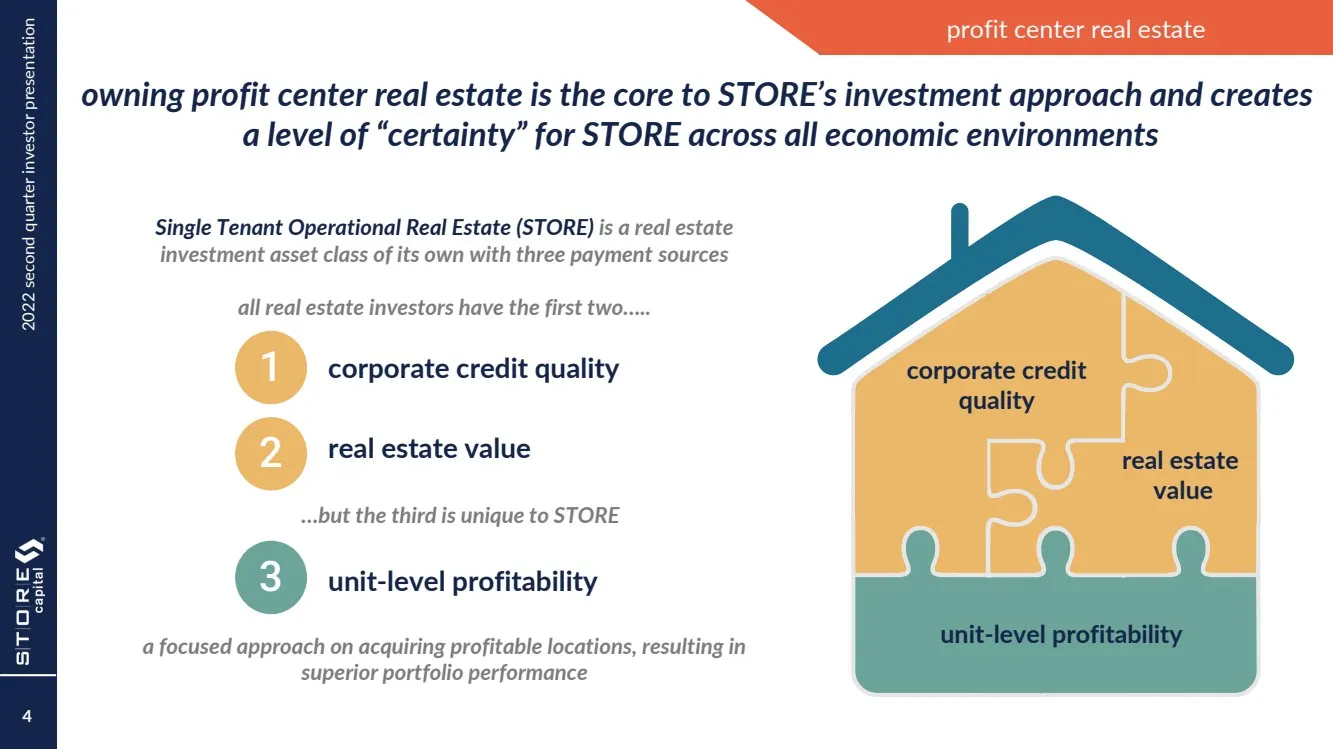
2022 second quarter investor presentation owning profit center real estate is the core to STORE’s investment approach and creates a level of “certainty” for STORE across all economic environments Single Tenant Operational Real Estate (STORE) is a real estate investment asset class of its own with th
Slide 5: Broad-based market need
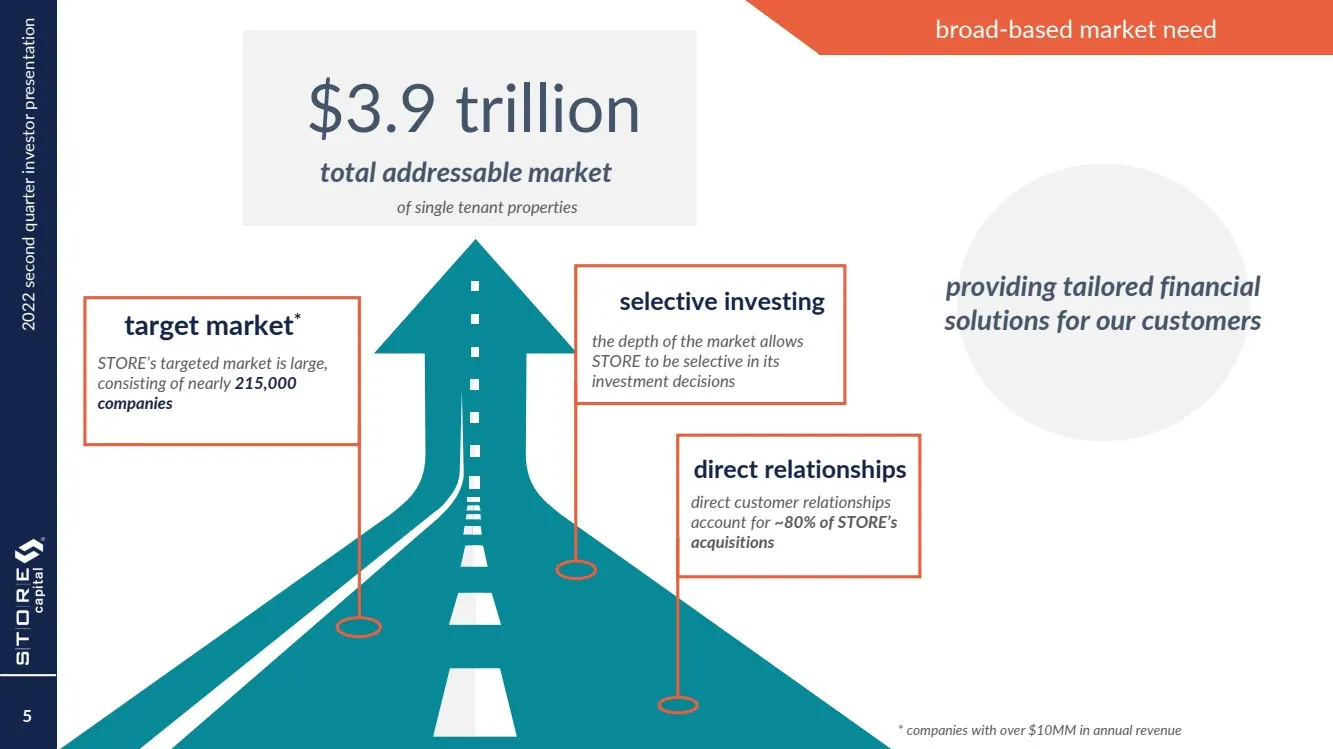
2022 second quarter investor presentation 5 broad - based market need total addressable market $3.9 trillion of single tenant properties providing tailored financial solutions for our customers the depth of the market allows STORE to be selective in its investment decisions selective investing targe
Slide 6: STORE customer profile
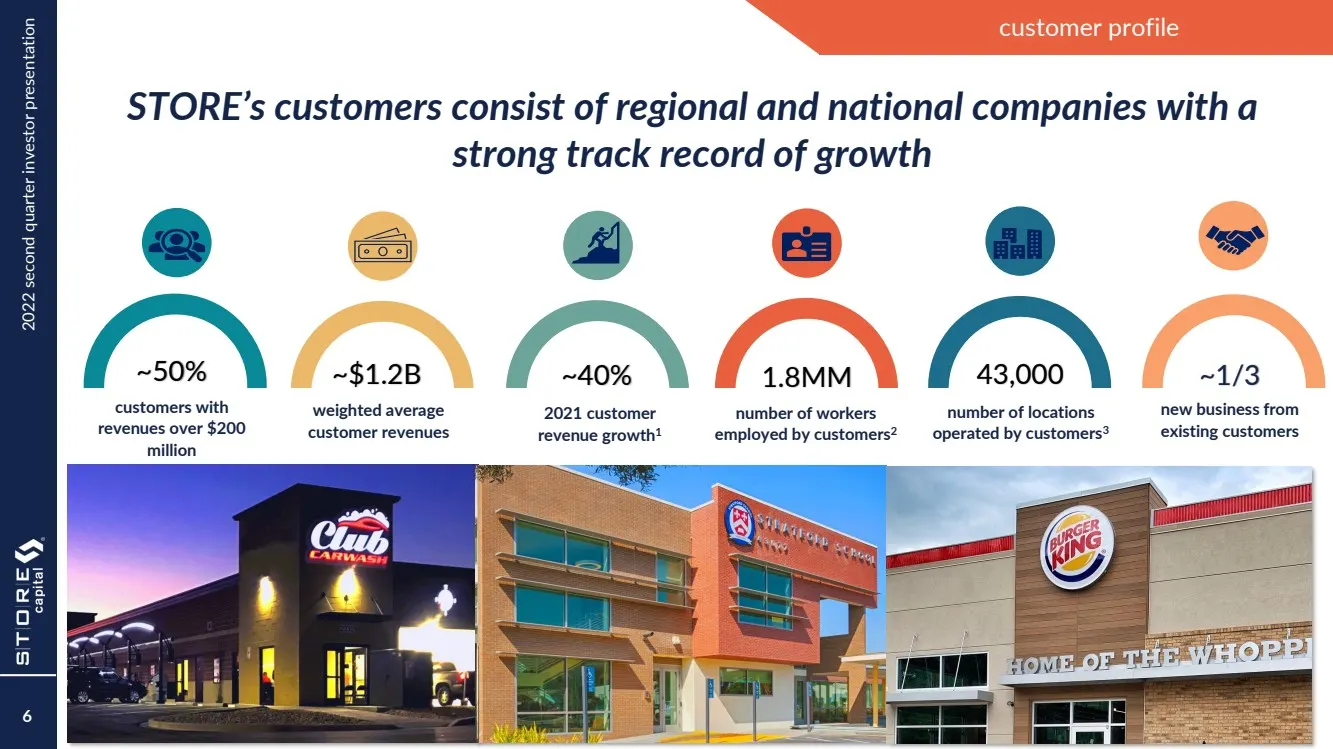
2022 second quarter investor presentation STORE customer profile 43,000 locations STORE’s customers consist of regional and national companies with a strong track record of growth 1.8MM ~40% ~$1.2B ~1/3 ~50% new business from existing customers number of locations operated by customers 3 number of w
Slide 7: Direct origination model
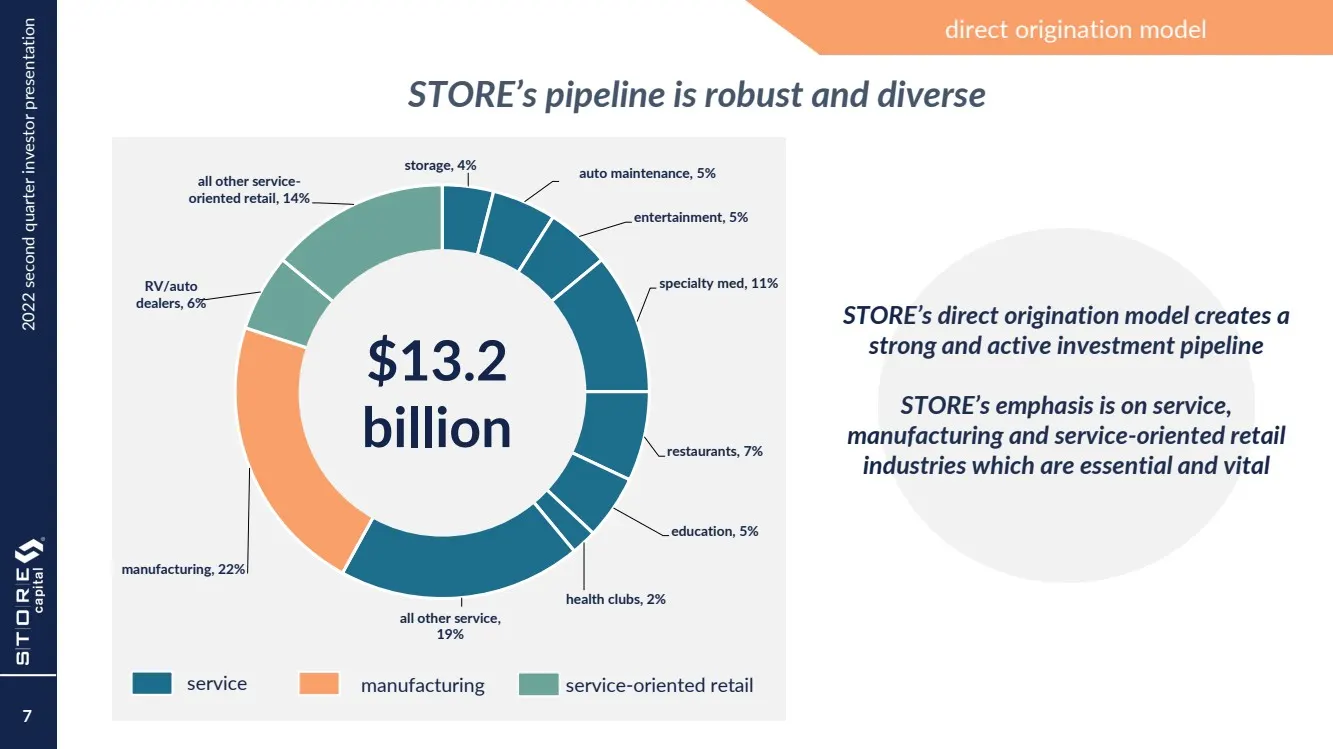
2022 second quarter investor presentation direct origination model STORE’s pipeline is robust and diverse storage , 4% auto maintenance , 5% entertainment , 5% specialty med , 11% restaurants , 7% education , 5% health clubs , 2% all other service , 19% manufacturing , 22% RV/auto dealers , 6% all o
Slide 8: Investment activity & portfolio management
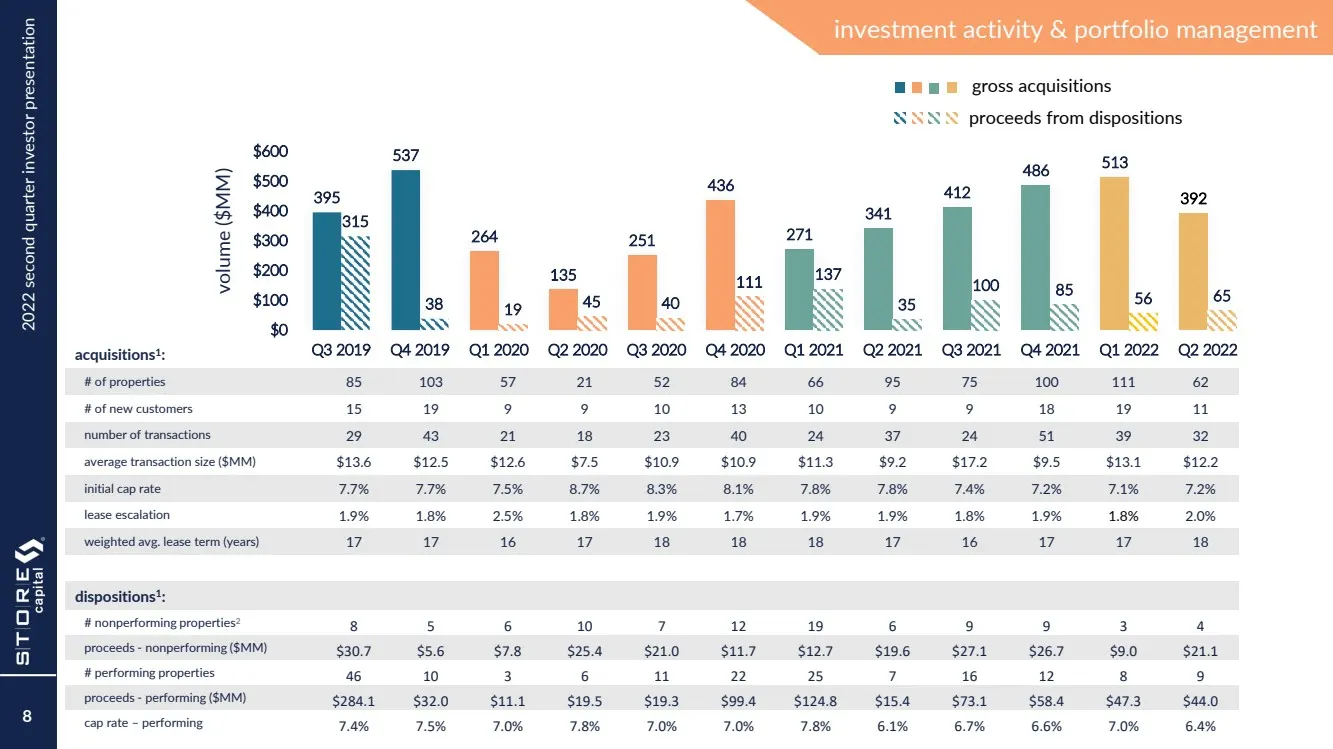
2022 second quarter investor presentation investment activity & portfolio management REAL ESTATE VALUE acquisitions 1 : # of properties 85 103 57 21 52 84 66 95 75 100 111 62 # of new customers 15 19 9 9 10 13 10 9 9 18 19 11 number of transactions 29 43 21 18 23 40 24 37 24 51 39 32 average transac
Slide 9: Stable and attractive spreads
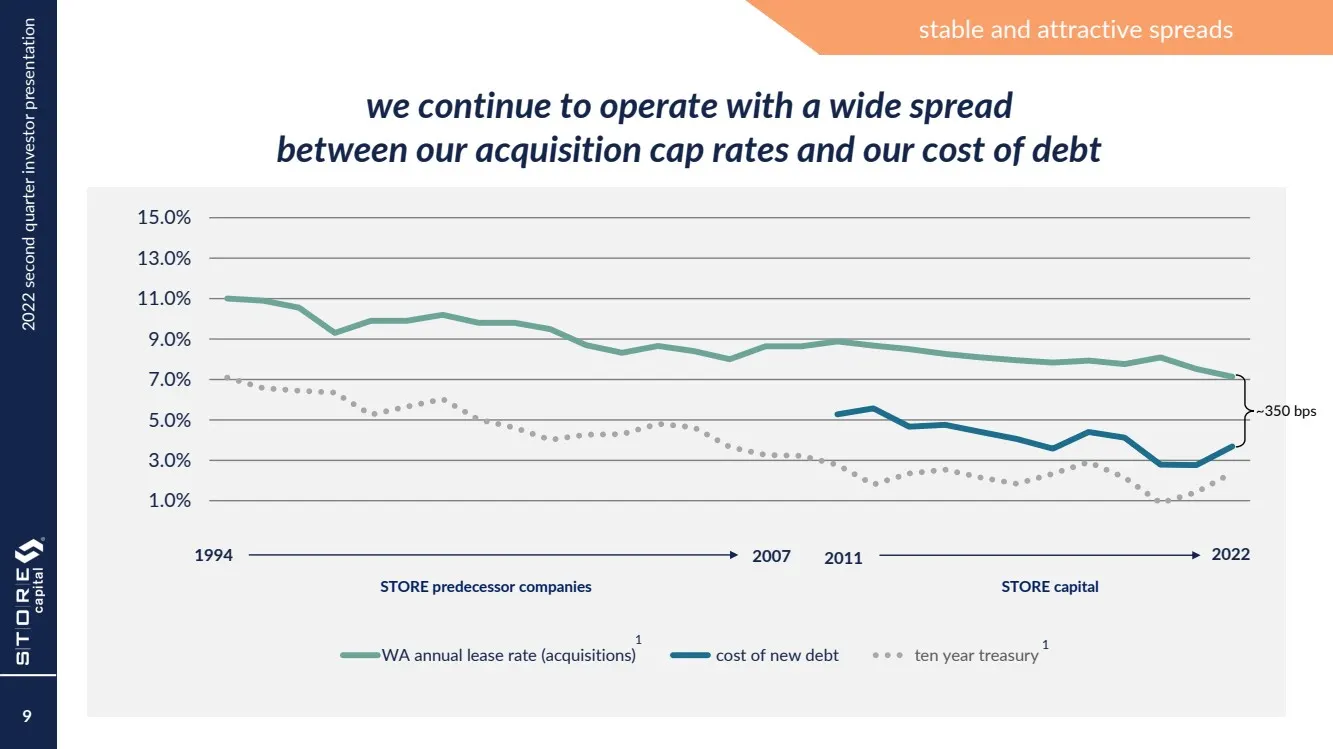
2022 second quarter investor presentation stable and attractive spreads we continue to operate with a wide spread between our acquisition cap rates and our cost of debt -1.0% 1.0% 3.0% 5.0% 7.0% 9.0% 11.0% 13.0% 15.0% WA annual lease rate (acquisitions) cost of new debt ten year treasury 2011 2022 1
Slide 10: Portfolio at a glance
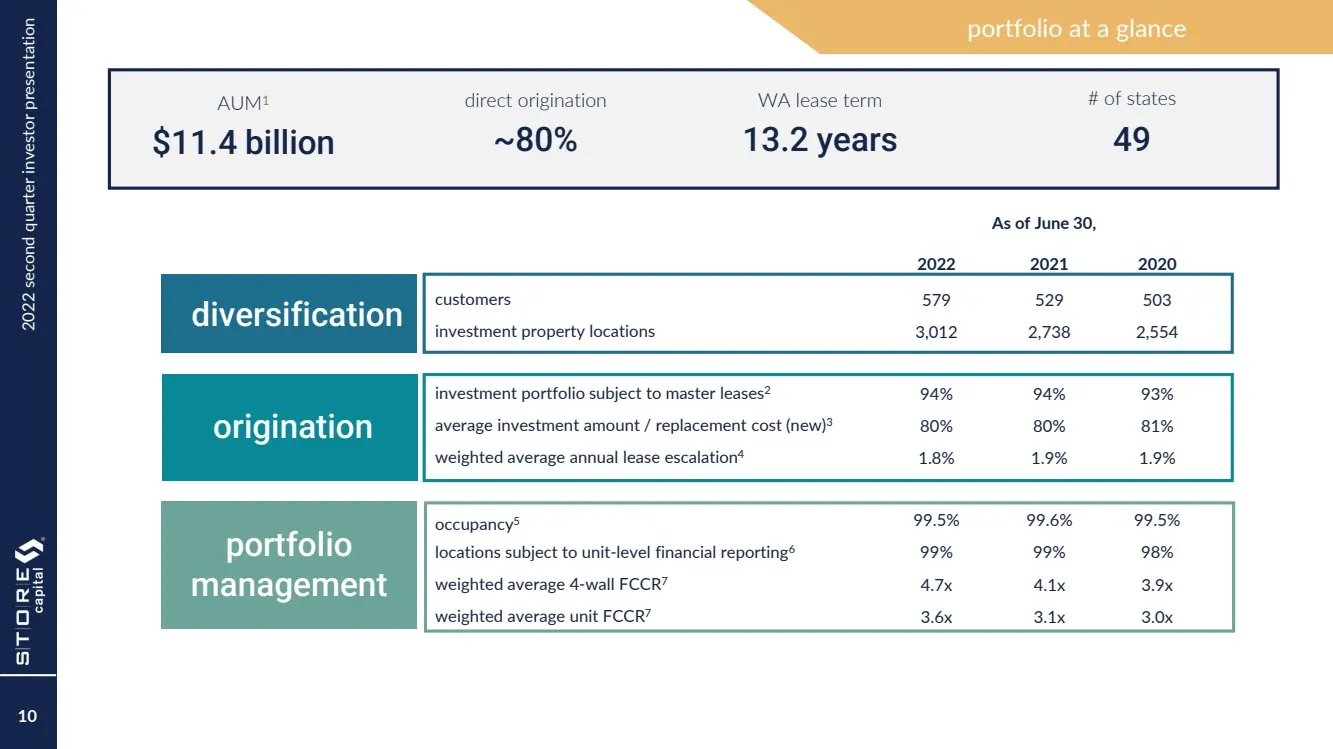
2022 second quarter investor presentation 10 As of June 30, 2022 2021 2020 customers 579 529 503 investment property locations 3,012 2,738 2,554 investment portfolio subject to master leases 2 94% 94% 93% average investment amount / replacement cost (new) 3 80% 80% 81% weighted average annual lease
Slide 11: Diversified profile: top customers and industries
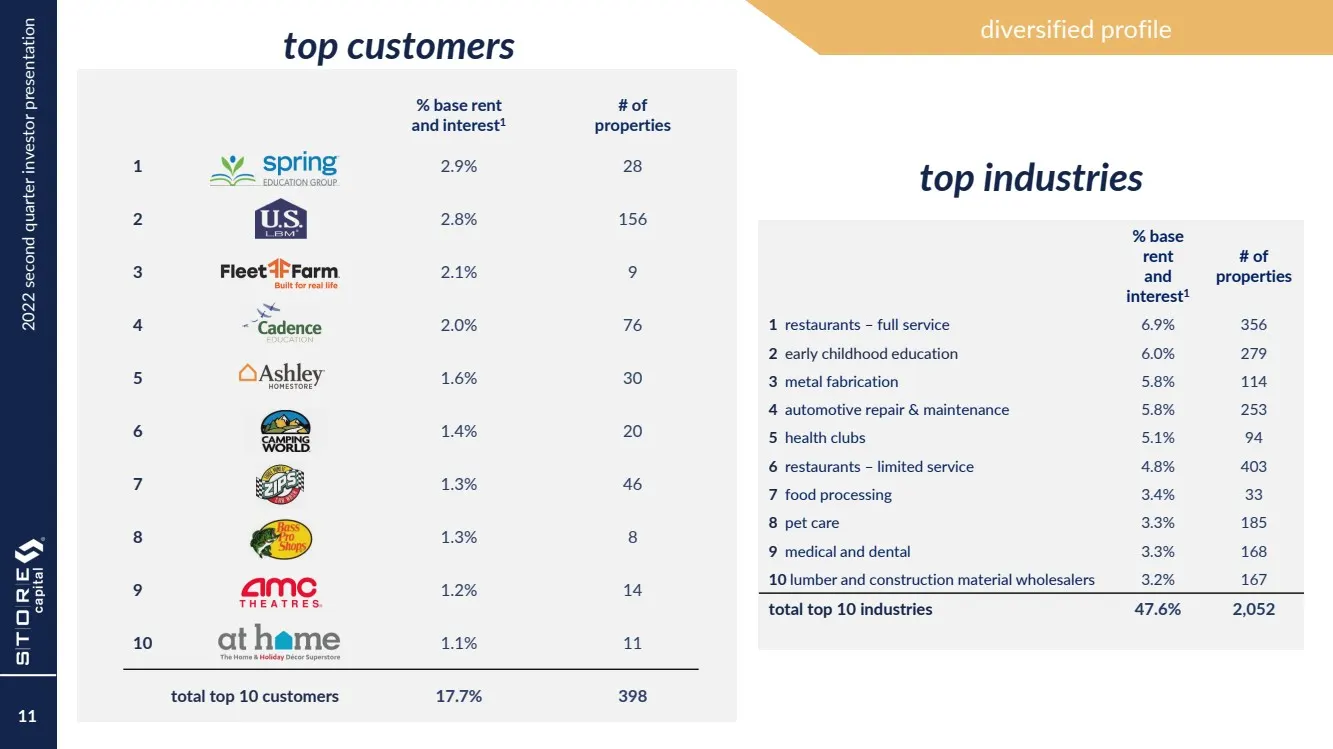
2022 second quarter investor presentation % base rent and interest 1 # of properties 1 2.9% 28 2 2.8% 156 3 2.1% 9 4 2.0% 76 5 1.6% 30 6 1.4% 20 7 1.3% 46 8 1.3% 8 9 1.2% 14 10 1.1% 11 total top 10 customers 17.7% 398 % base rent and interest 1 # of properties 1 restaurants – full service 6.9% 356 2
Slide 12: Diversification by industry
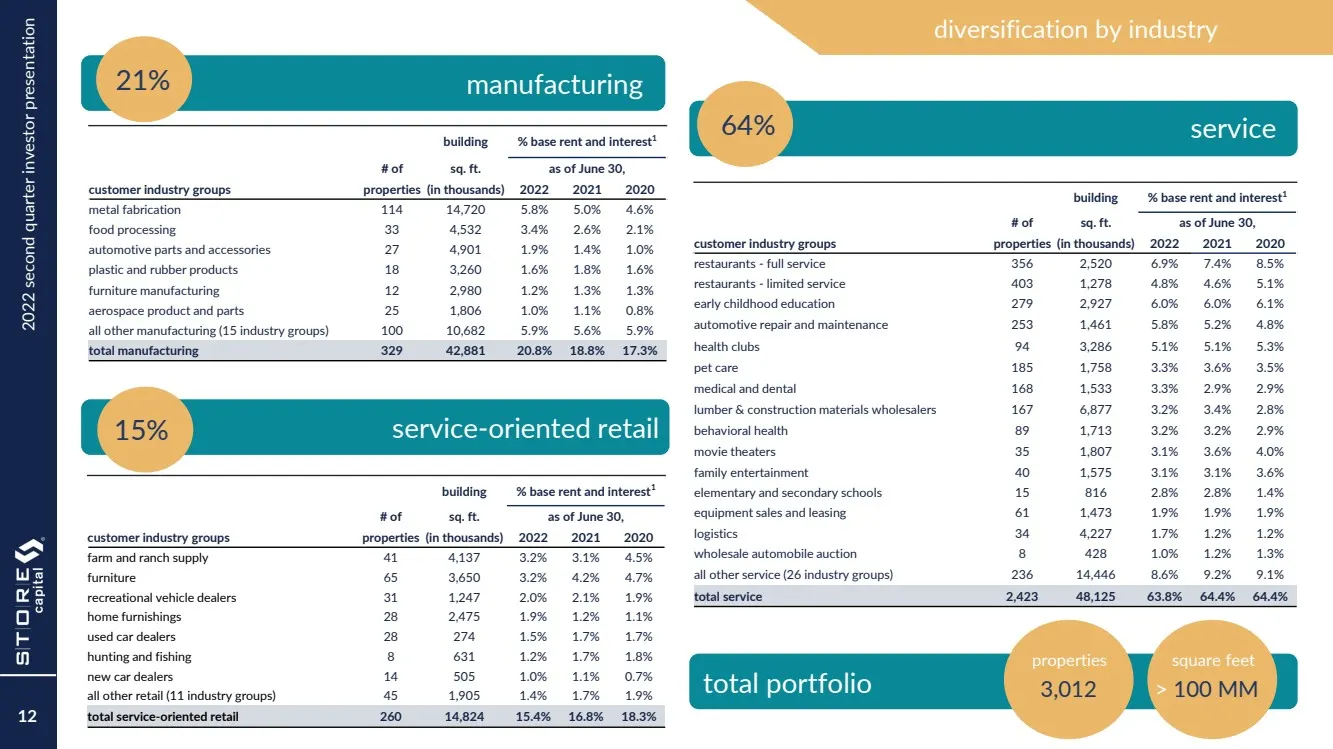
2022 second quarter investor presentation diversification by industry service manufacturing 12 building % base rent and interest 1 # of sq. ft. as of June 30, customer industry groups properties (in thousands) 2022 2021 2020 restaurants - full service 356 2,520 6.9% 7.4% 8.5% restaurants - limited s
Slide 13: Diversification by geography
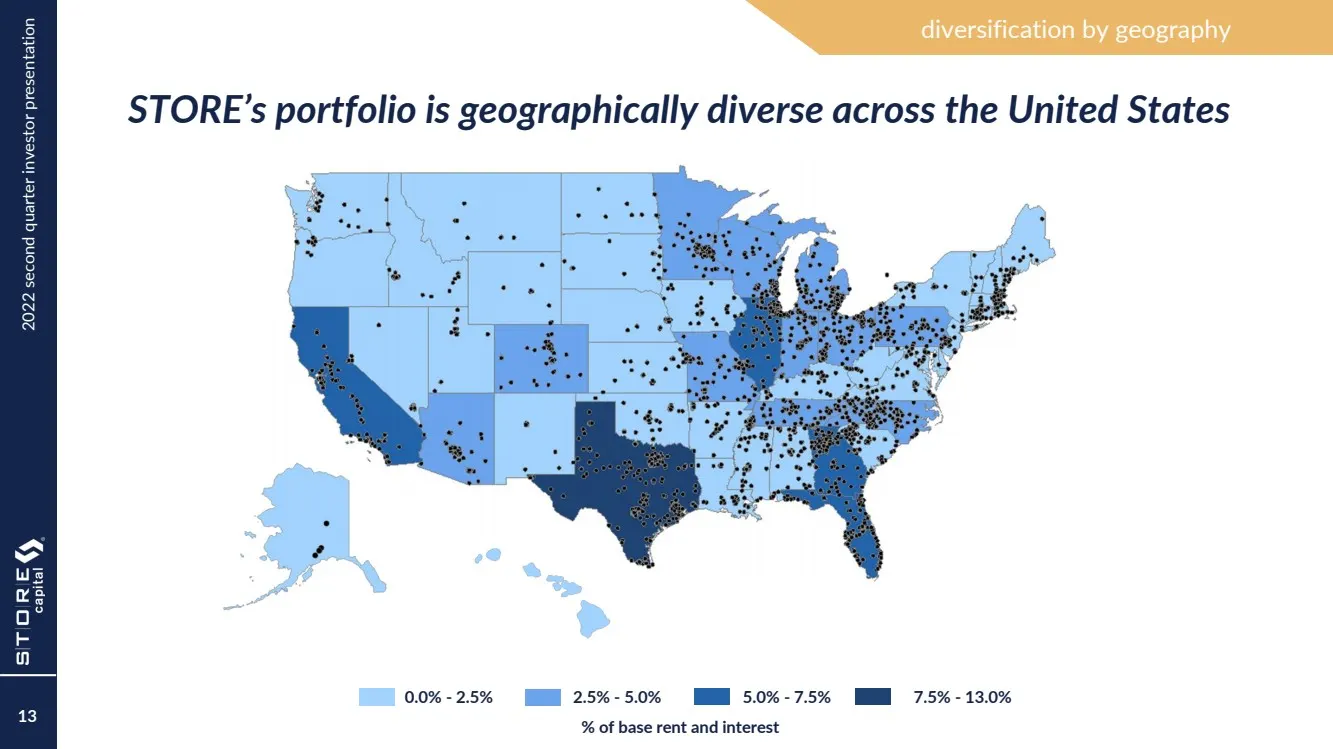
2022 second quarter investor presentation diversification by geography STORE’s portfolio is geographically diverse across the United States 13 0.0% - 2.5% 2.5% - 5.0% 5.0% - 7.5% 7.5% - 13.0% % of base rent and interest
Slide 14: Strong unit-level FCCRs creating a superior portfolio
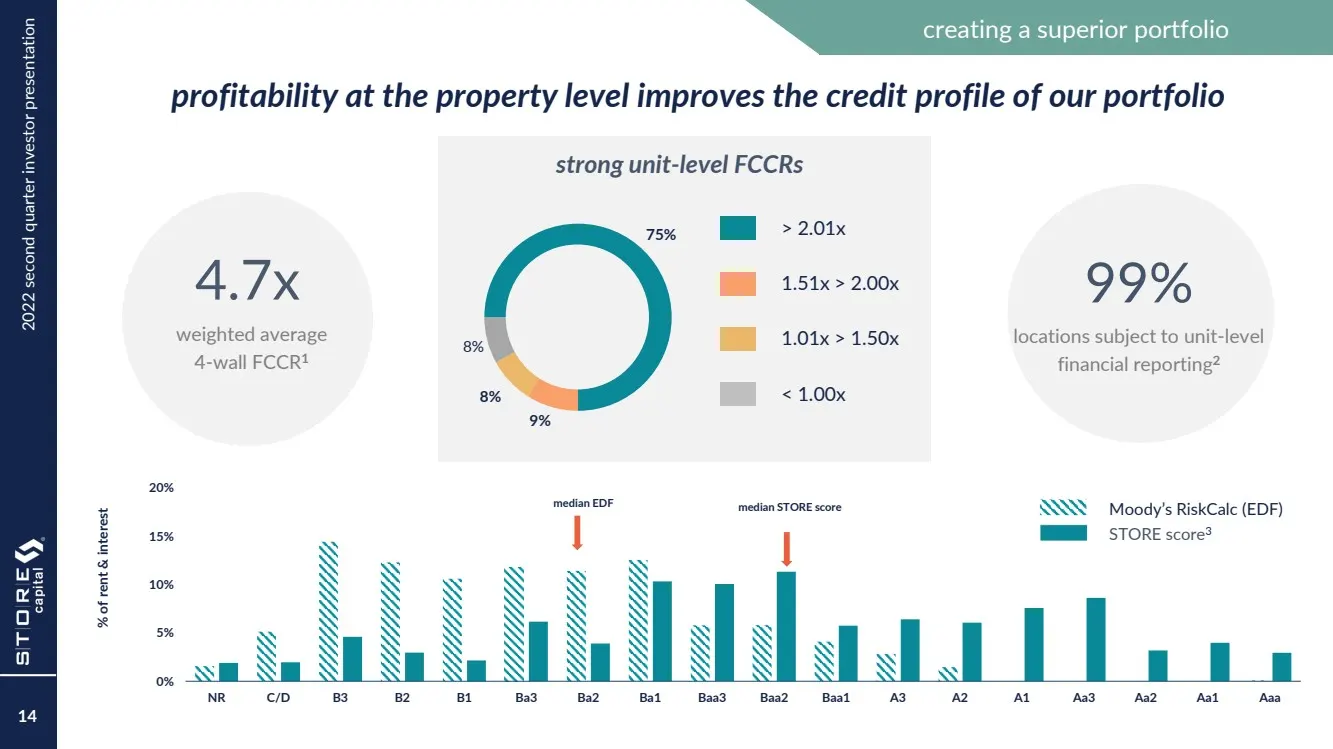
2022 second quarter investor presentation 75% 9% 8% 8% REAL ESTATE VALUE CORPORATE CREDIT QUALITY 0% 5% 10% 15% 20% NR C/D B3 B2 B1 Ba3 Ba2 Ba1 Baa3 Baa2 Baa1 A3 A2 A1 Aa3 Aa2 Aa1 Aaa % of rent & interest Moody’s RiskCalc (EDF) STORE score 3 99% locations subject to unit - level financial reporting
Slide 15: Distinctive balance sheet
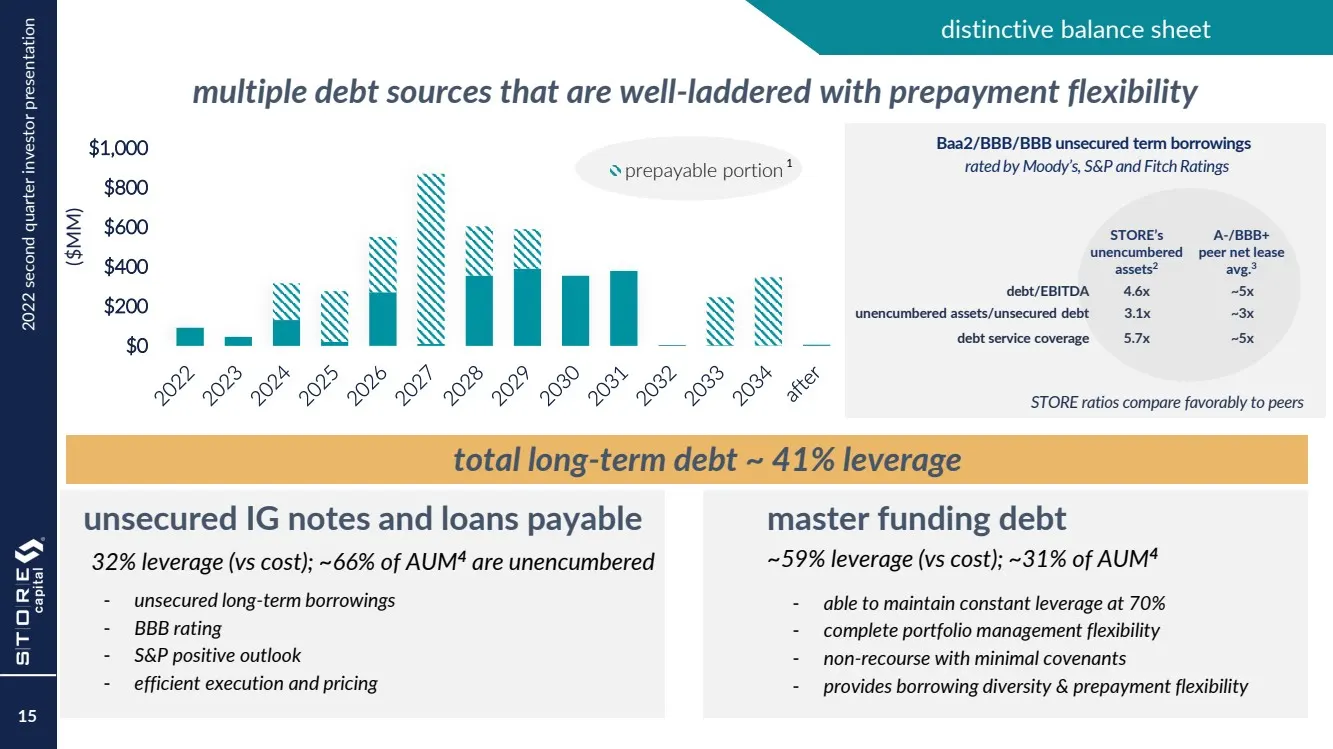
2022 second quarter investor presentation 15 $0 $200 $400 $600 $800 $1,000 Thousands prepayable portion - able to maintain constant leverage at 70% - complete portfolio management flexibility - non - recourse with minimal covenants - provides borrowing diversity & prepayment flexibility multiple deb
Slide 16: Growth by design
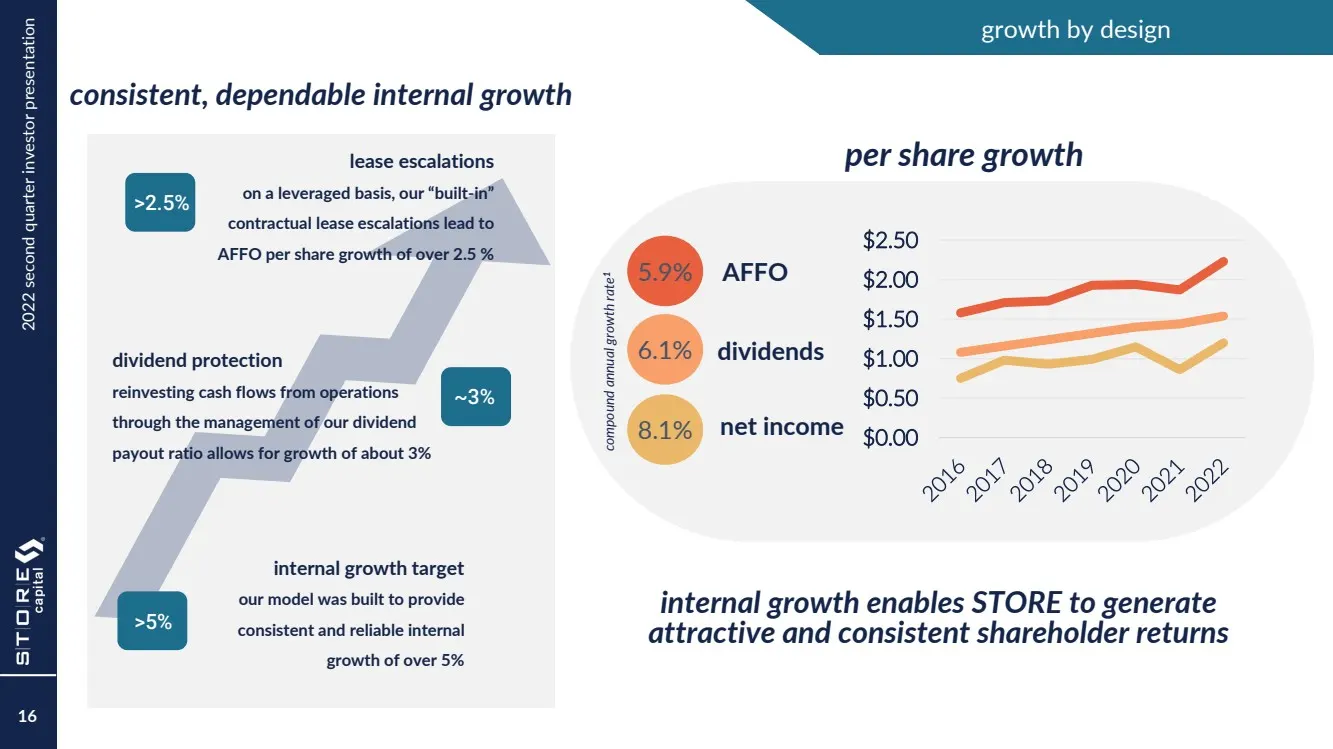
2022 second quarter investor presentation growth by design >2.5% lease escalations on a leveraged basis, our “built - in” contractual lease escalations lead to AFFO per share growth of over 2.5 % dividend protection reinvesting cash flows from operations through the management of our dividend payout
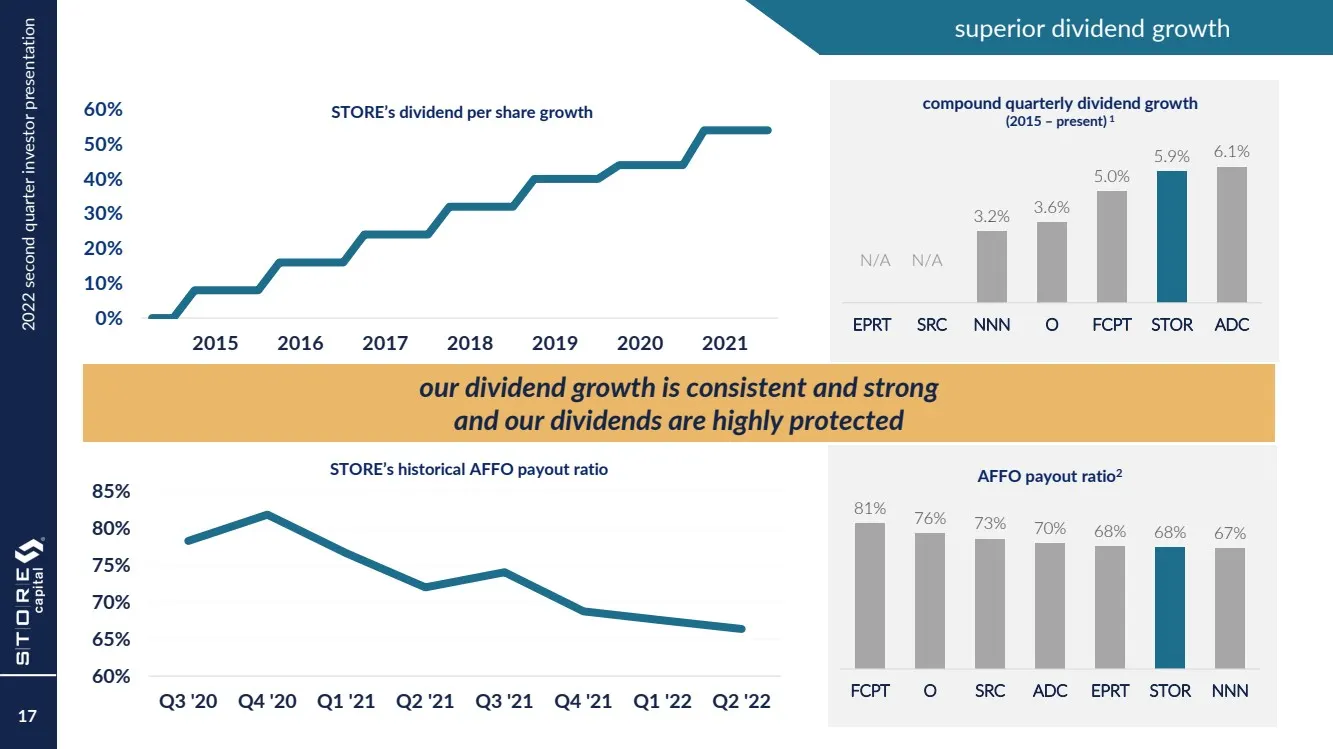
Slide 17: Peer comparison: superior dividend growth
2022 second quarter investor presentation PEER COMPARISON superior dividend growth our dividend growth is consistent and strong and our dividends are highly protected 81% 76% 73% 70% 68% 68% 67% FCPT O SRC ADC EPRT STOR NNN AFFO payout ratio 2 3.2% 3.6% 5.0% 5.9% 6.1% EPRT SRC NNN O FCPT STOR ADC co
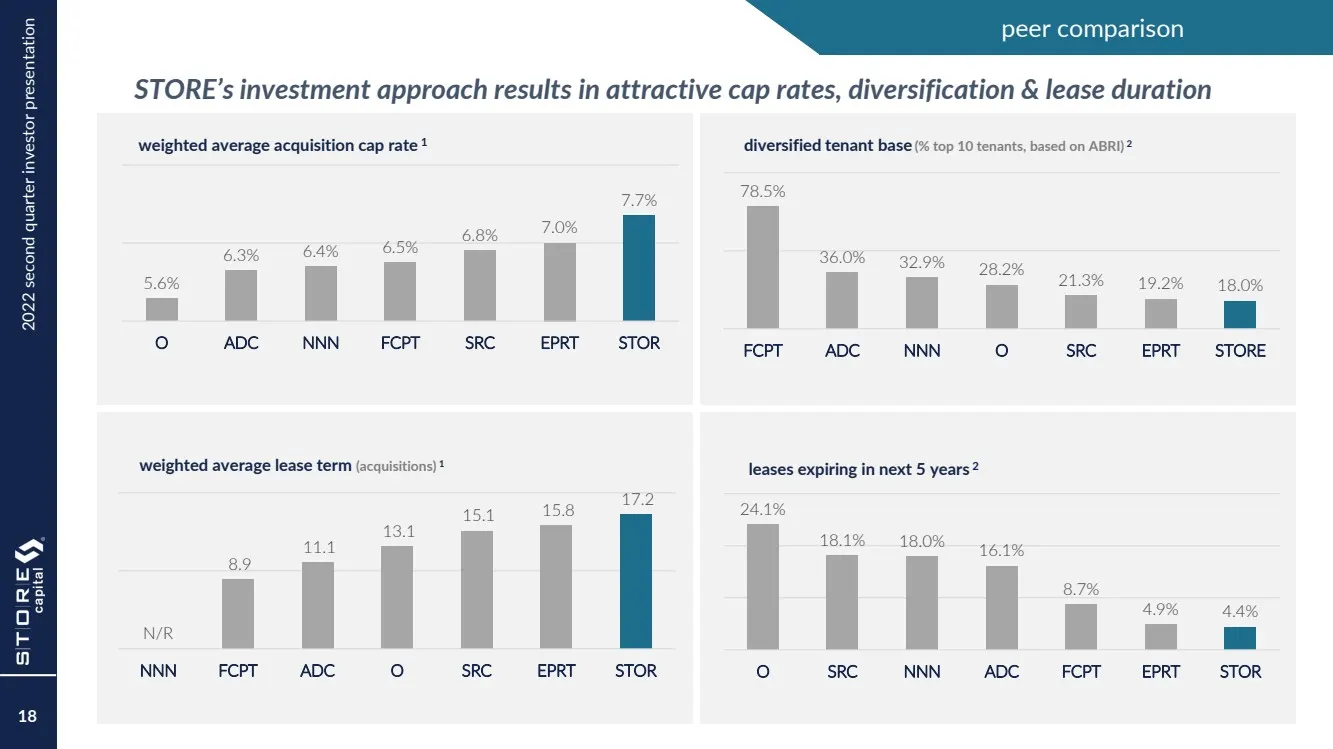
Slide 18: Peer comparison: cap rates, diversification and lease duration
2022 second quarter investor presentation PEER COMPARISON STORE’s investment approach results in attractive cap rates, diversification & lease duration 5.6% 6.3% 6.4% 6.5% 6.8% 7.0% 7.7% O ADC NNN FCPT SRC EPRT STOR weighted average acquisition cap rate 1 24.1% 18.1% 18.0% 16.1% 8.7% 4.9% 4.4% O SRC
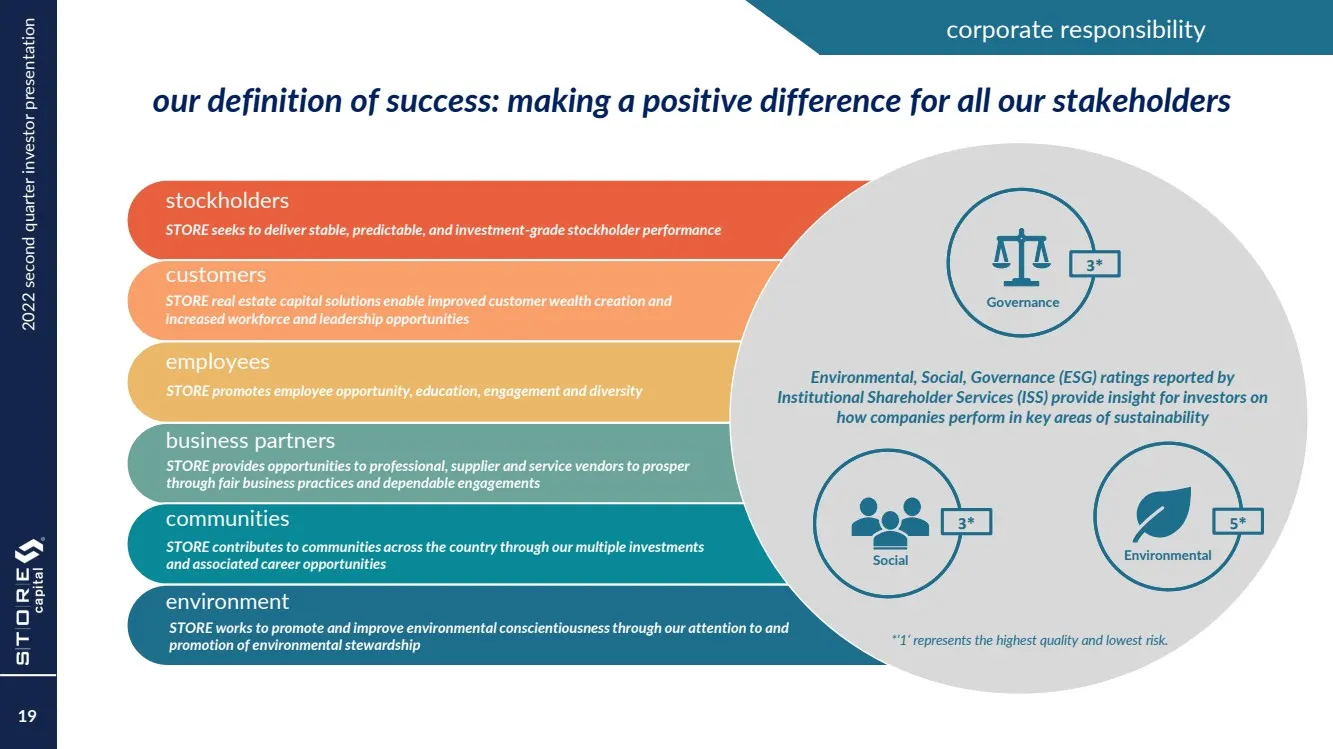
Slide 19: Corporate responsibility
2022 second quarter investor presentation corporate responsibility our definition of success: making a positive difference for all our stakeholders STORE seeks to deliver stable, predictable, and investment - grade stockholder performance stockholders STORE real estate capital solutions enable impro
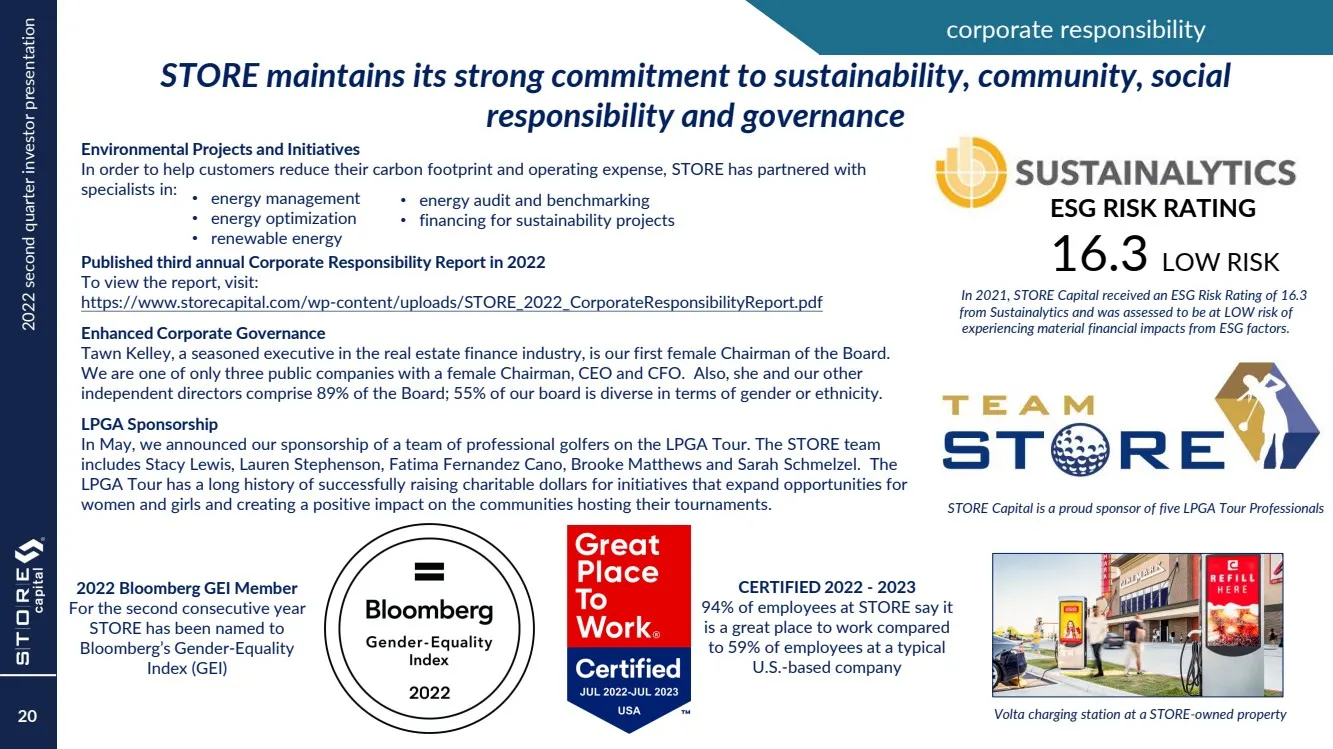
Slide 20: Corporate responsibility
2022 second quarter investor presentation corporate responsibility STORE maintains its strong commitment to sustainability, community, social responsibility and governance Environmental Projects and Initiatives In order to help customers reduce their carbon footprint and operating expense, STORE has

Slide 21: Supplemental information and footnotes
supplemental information and footnotes
Slide 22: Supplemental reporting measures
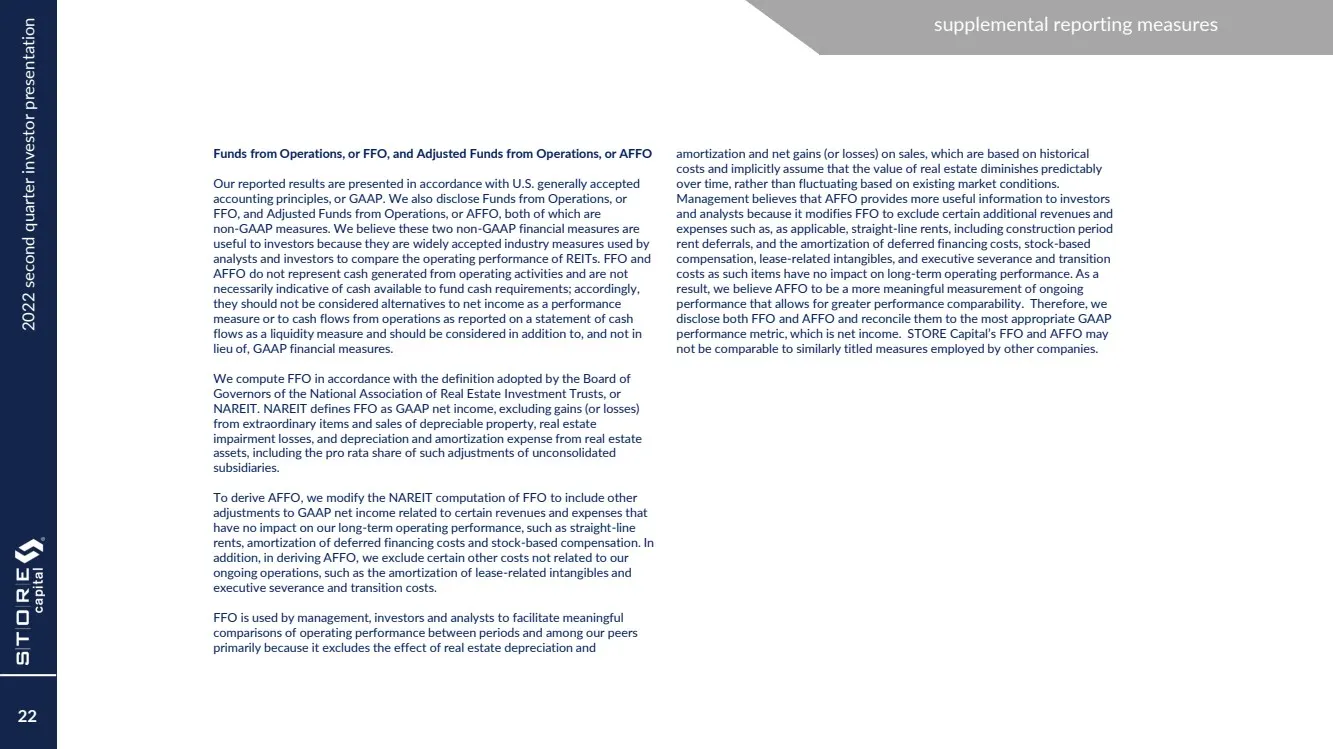
2022 second quarter investor presentation supplemental reporting measures Funds from Operations, or FFO, and Adjusted Funds from Operations, or AFFO Our reported results are presented in accordance with U.S. generally accepted accounting principles, or GAAP. We also disclose Funds from Operations, o
Slide 23: Supplemental reporting measures
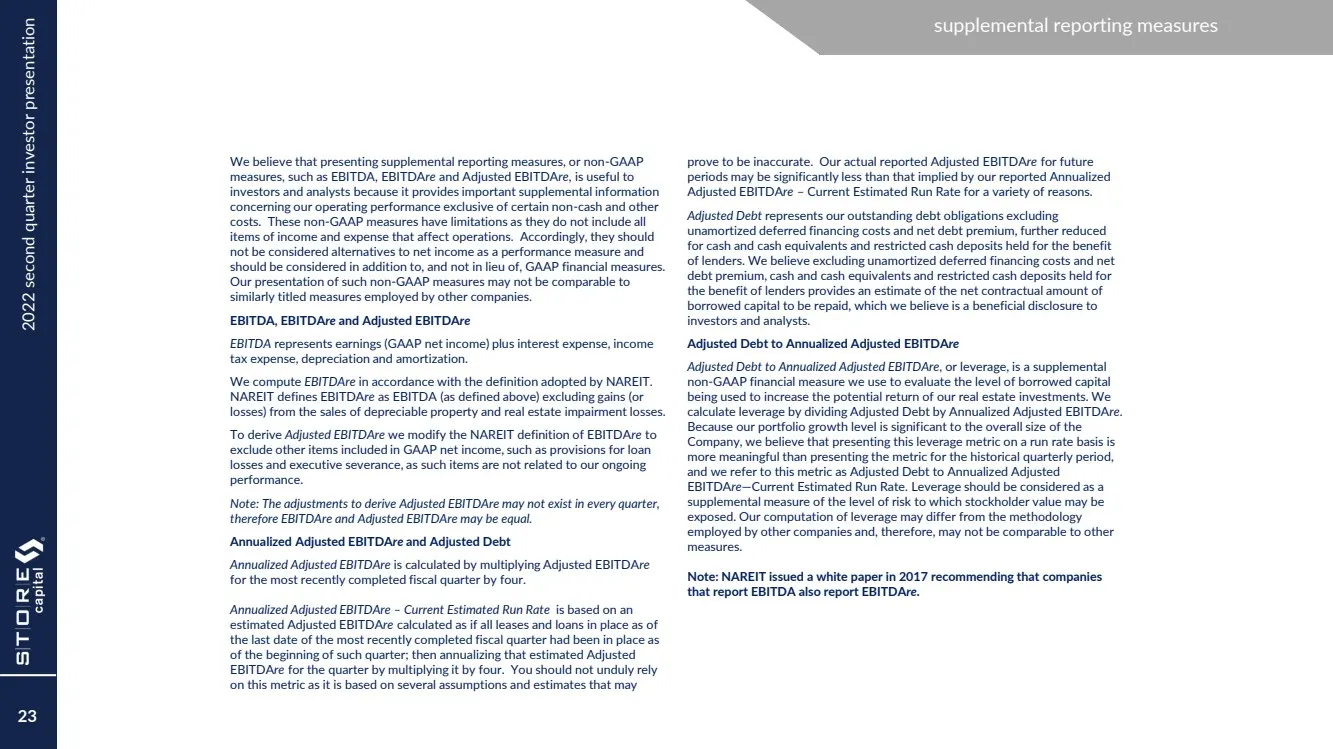
2022 second quarter investor presentation supplemental reporting measures We believe that presenting supplemental reporting measures, or non - GAAP measures, such as EBITDA, EBITDA re and Adjusted EBITDA re , is useful to investors and analysts because it provides important supplemental information
Slide 24: Footnotes
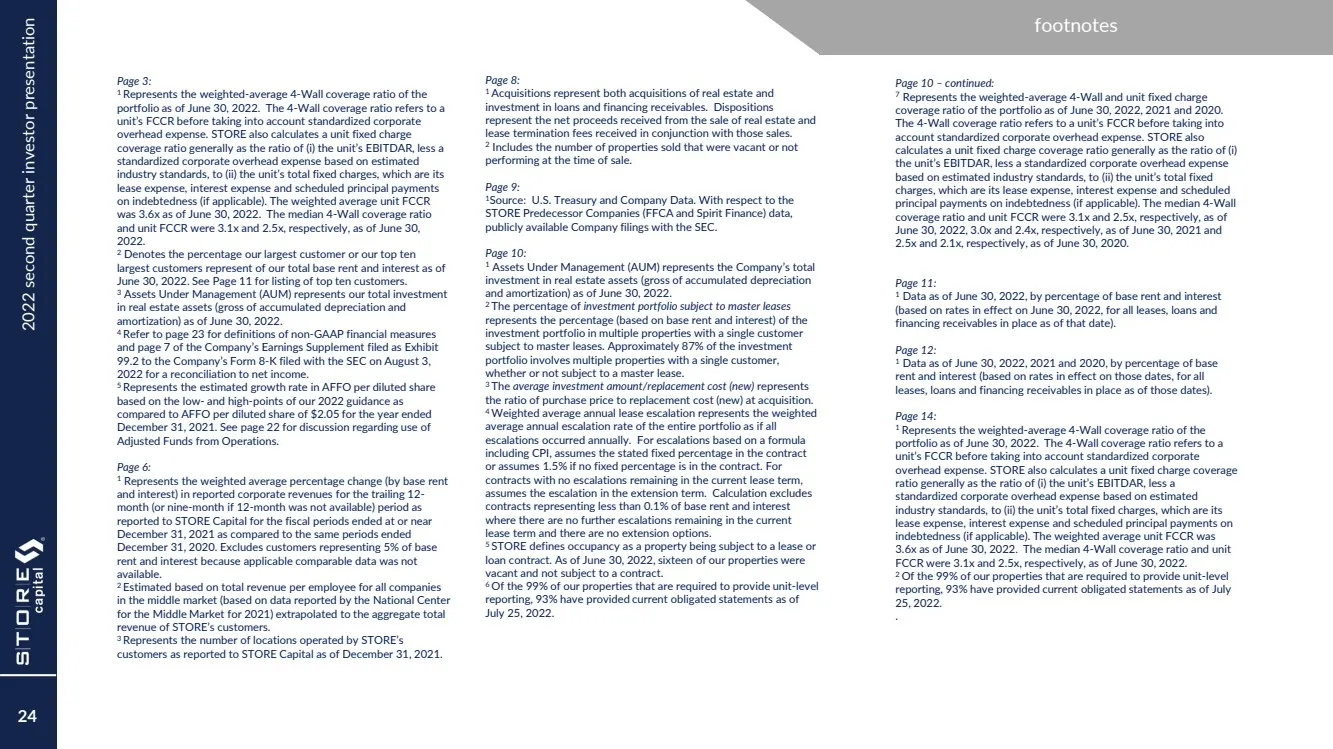
2022 second quarter investor presentation footnotes 24 Page 3: 1 Represents the weighted - average 4 - Wall coverage ratio of the portfolio as of June 30, 2022. The 4 - Wall coverage ratio refers to a unit’s FCCR before taking into account standardized corporate overhead expense. STORE also calculat
Slide 25: Footnotes continued
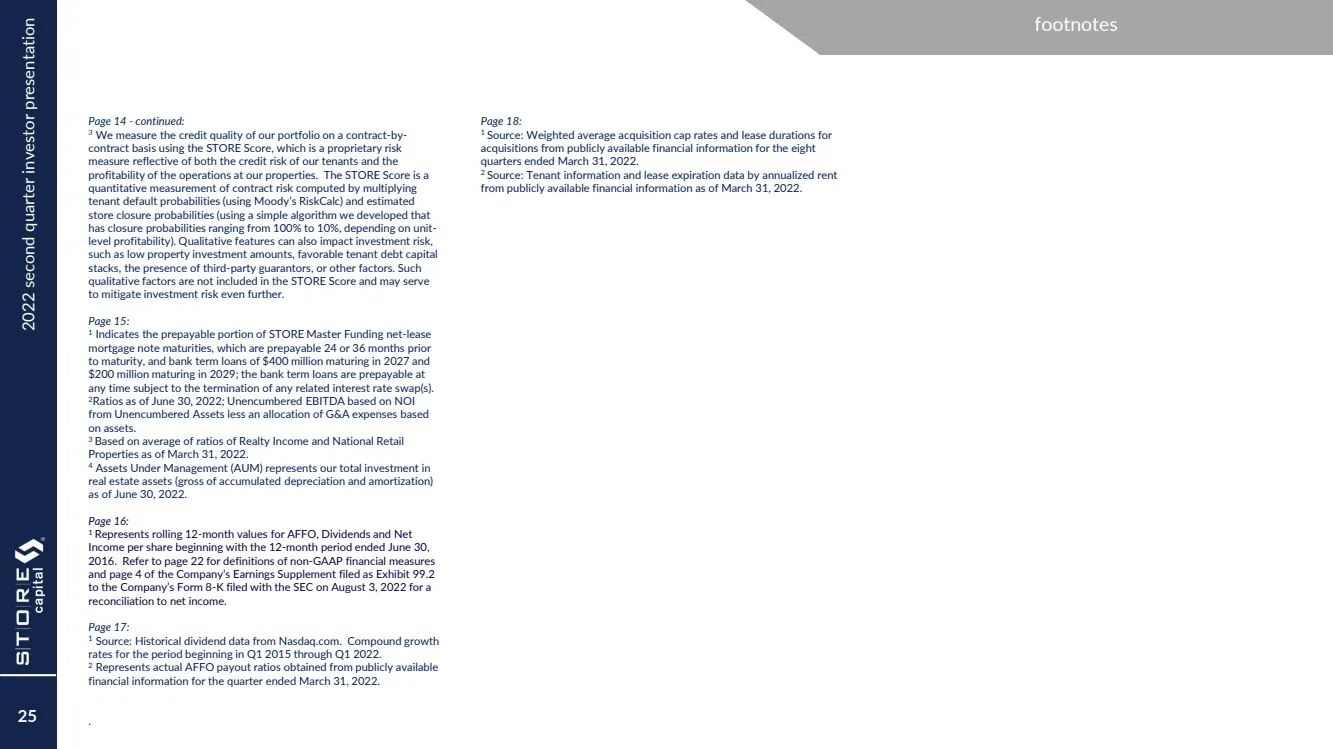
2022 second quarter investor presentation footnotes 25 Page 14 - continued: 3 We measure the credit quality of our portfolio on a contract - by - contract basis using the STORE Score, which is a proprietary risk measure reflective of both the credit risk of our tenants and the profitability of the o
Slide 26: Investor and Media Contacts
Investor and Media Contacts Financial Profiles, Inc. Moira Conlon, 310.622.8220 Megan McGrath, 310.622.8248 STORECapital@finprofiles.com Corporate Headquarters 8377 East Hartford Drive, Suite 100 Scottsdale, Arizona 85255 480.256.1100 www.STOREcapital.com
Source: SEC EDGAR · 8-K filed Aug 3, 2022
More decks from STORE Capital Corp
 Q2 2023 Earnings Presentation10 slides · Aug 4, 2023
 Q2 2022 Earnings Presentation22 slides · Aug 3, 2022
 Q1 2022 Earnings Presentation26 slides · May 4, 2022
 Q1 2022 Earnings Presentation22 slides · May 4, 2022
 Q4 2021 Earnings Presentation33 slides · Feb 23, 2022
 Q3 2021 Earnings Presentation38 slides · Nov 4, 2021