Alpha Natural Resources — J.P. Morgan Global High Yield & Leveraged Finance Conference (February 2013)
27 slides from Alpha Natural Resources's conference presentation, Feb 25, 2013
Slide 1: European Investor Presentation
1 Alpha Natural Resources European Investor Presentation February 25, 2013 Alpha Natural Resources J.P. Morgan Global High Yield & Leveraged Finance Conference
Slide 2: Forward-Looking Statements
2 Forward-Looking Statements Statements in this presentation which are not statements of historical fact are “forward-looking statements” within the Safe Harbor provision of the Private Securities Litigation Reform Act of 1995. Such statements are not guarantees of future performance. Many factors c
Slide 3: Alpha Natural Resources Highlights
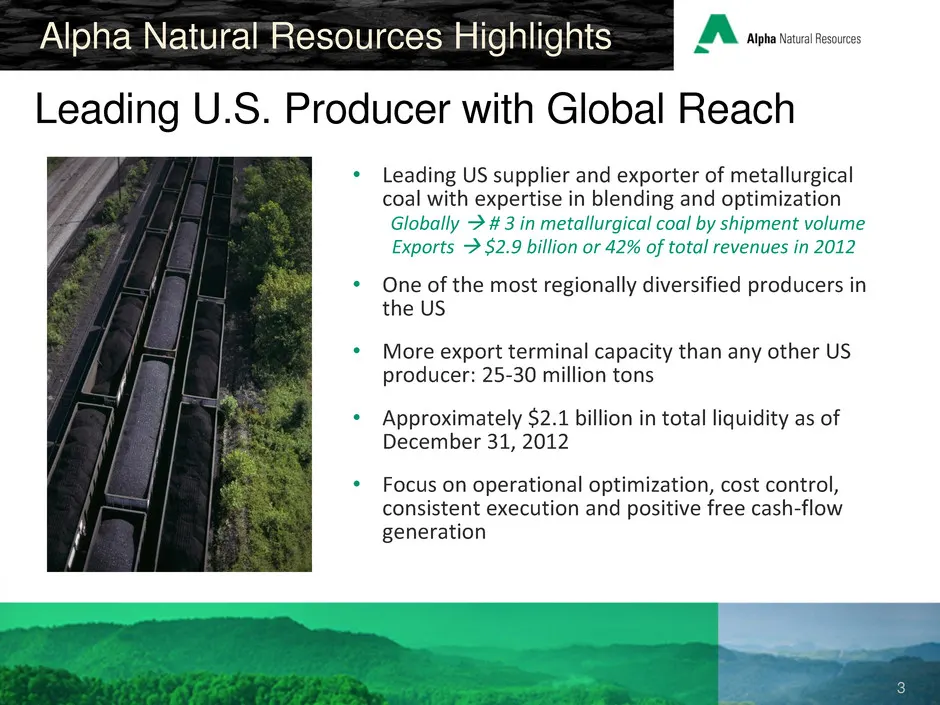
3 • Leading US supplier and exporter of metallurgical coal with expertise in blending and optimization Globally # 3 in metallurgical coal by shipment volume Exports $2.9 billion or 42% of total revenues in 2012 • One of the most regionally diversified producers in the US • More export terminal c
Slide 4: Overview: Strategy to Create an Industry Leader
4 Alpha Natural Resources European Investor Presentation Alpha Natural Resources Overview Strategy to Create an Industry Leader
Slide 5: Focus on Three-Pronged Strategy
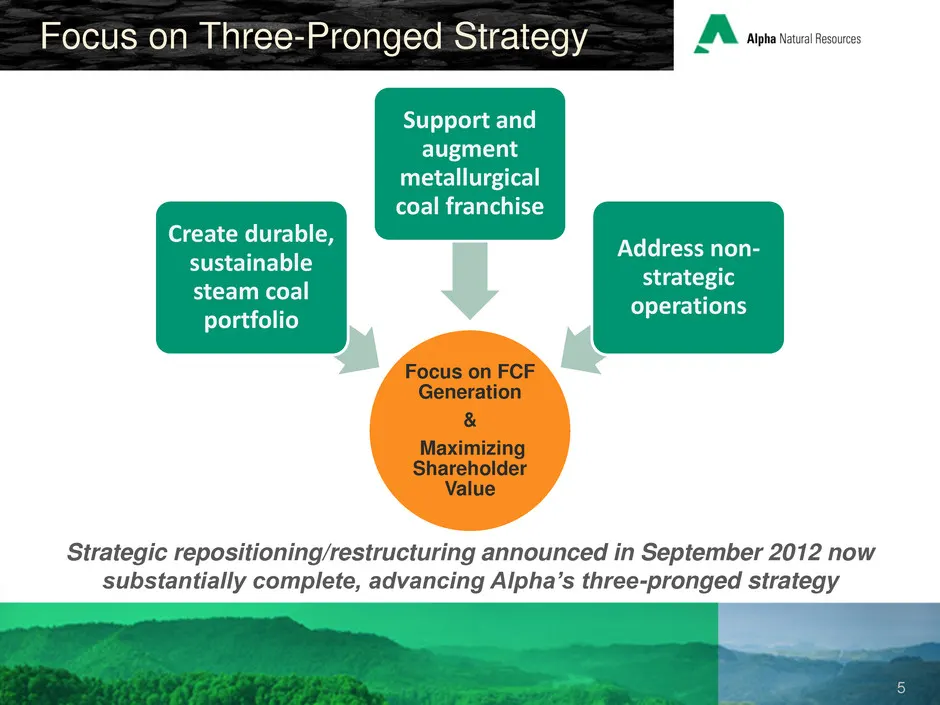
5 Focus on Three-Pronged Strategy Focus on FCF Generation & Maximizing Shareholder Value Create durable, sustainable steam coal portfolio Support and augment metallurgical coal franchise Address non- strategic operations Strategic repositioning/restructuring announced in September 2012 now substanti
Slide 6: Strategic Repositioning: Decisive Action
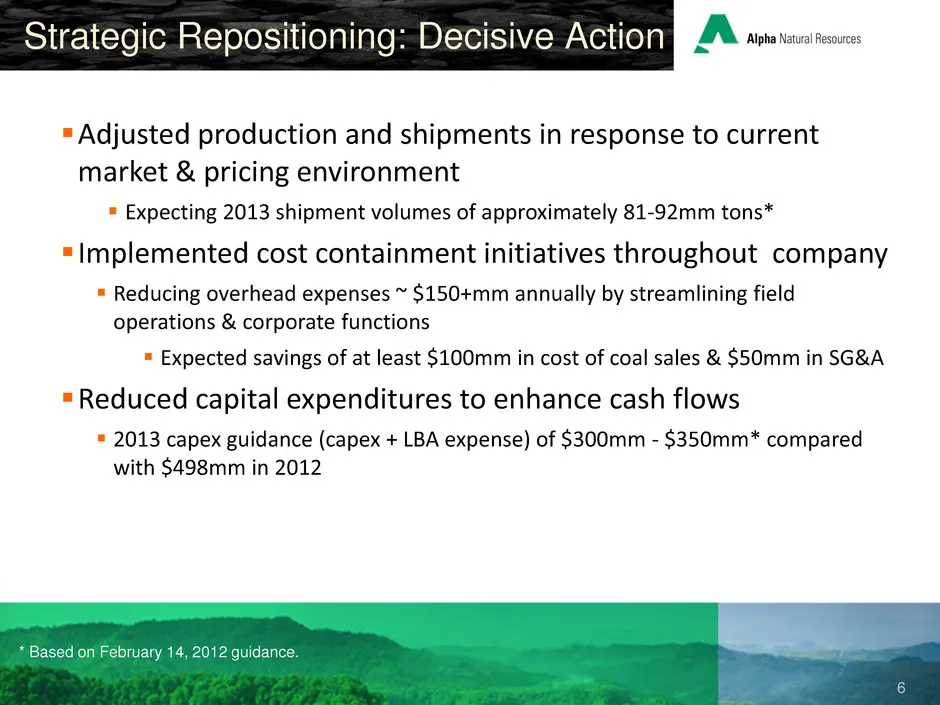
6 Strategic Repositioning: Decisive Action Adjusted production and shipments in response to current market & pricing environment Expecting 2013 shipment volumes of approximately 81-92mm tons* Implemented cost containment initiatives throughout company Reducing overhead expenses ~ $150+mm annua
Slide 7: Leading Global Supplier
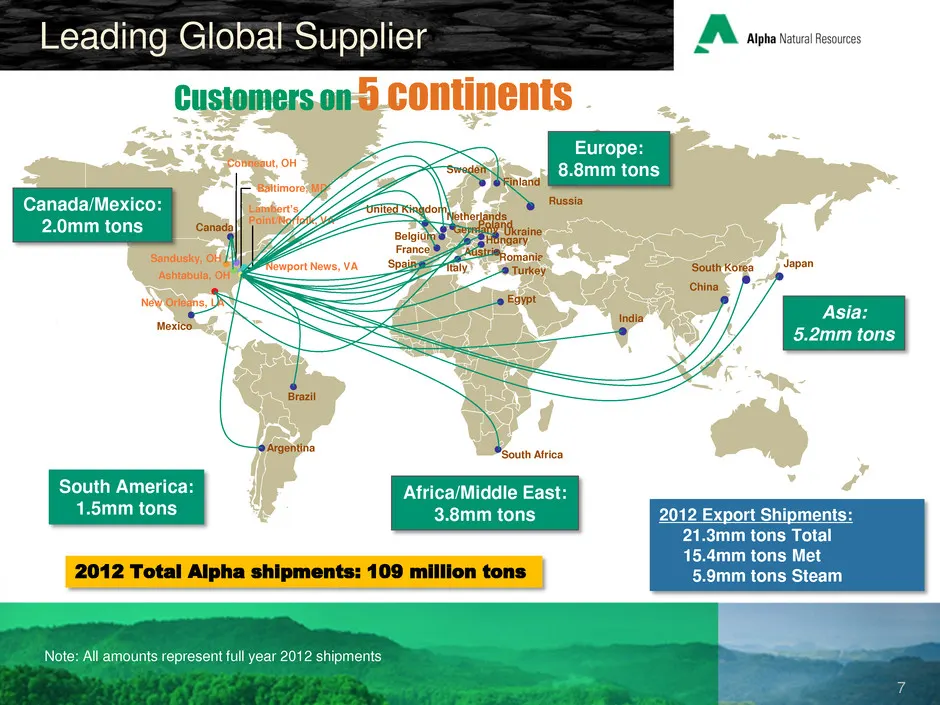
7 Leading Global Supplier Belgium Brazil Romania Canada France Egypt Sweden Netherlands Ukraine Spain Turkey United Kingdom Sandusky, OH Conneaut, OH Newport News, VA Lambert’s Point/Norfolk, VA Baltimore, MD Ashtabula, OH Russia New Orleans, LA Argentina Mexico Finland India Japan South Africa Chin
Slide 8: Logistics Flexibility Through Port Diversity
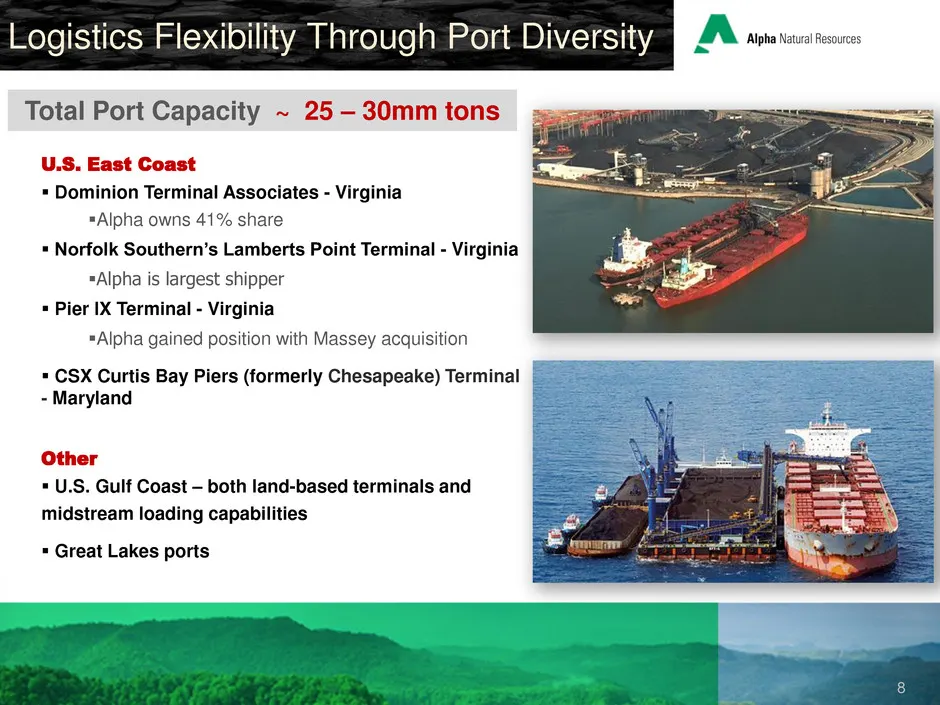
8 Logistics Flexibility Through Port Diversity Total Port Capacity ~ 25 – 30mm tons U.S. East Coast Dominion Terminal Associates - Virginia Alpha owns 41% share Norfolk Southern’s Lamberts Point Terminal - Virginia Alpha is largest shipper Pier IX Terminal - Virginia Alpha gained position w
Slide 9: Operational Diversification
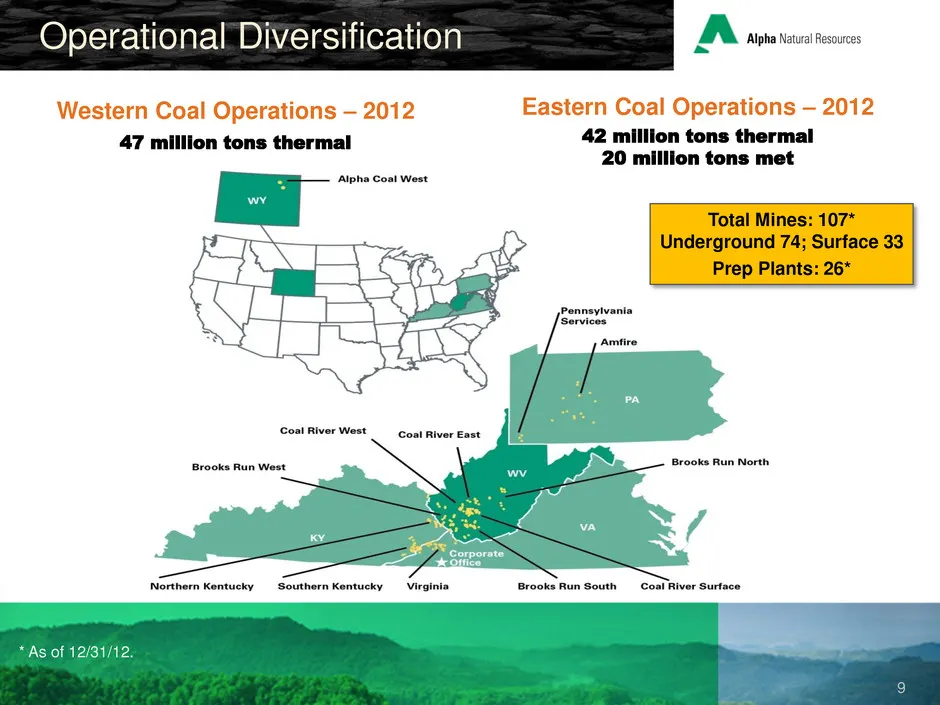
9 Operational Diversification Western Coal Operations – 2012 47 million tons thermal Eastern Coal Operations – 2012 42 million tons thermal 20 million tons met Total Mines: 107* Underground 74; Surface 33 Prep Plants: 26* * As of 12/31/12.
Slide 10: Operational Diversification: Revenue Mix and Reserves
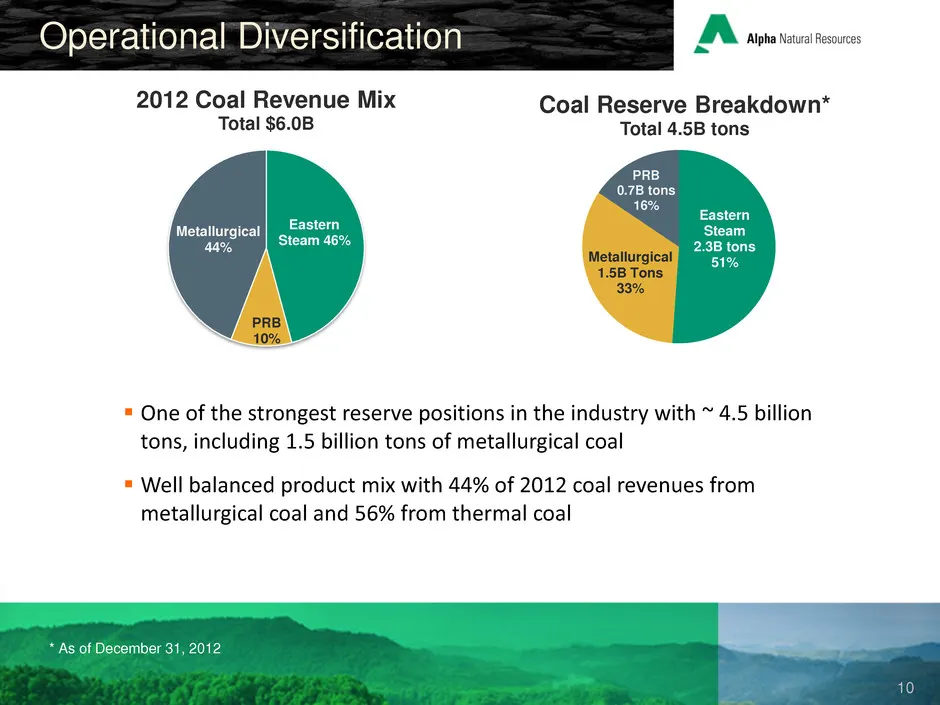
10 Operational Diversification * As of December 31, 2012 Eastern Steam 46% PRB 10% Metallurgical 44% 2012 Coal Revenue Mix Total $6.0B Eastern Steam 2.3B tons 51% Metallurgical 1.5B Tons 33% PRB 0.7B tons 16% Coal Reserve Breakdown* Total 4.5B tons One of the strongest reserve positions in the ind
Slide 11: Multiple Organic Met Coal Opportunities
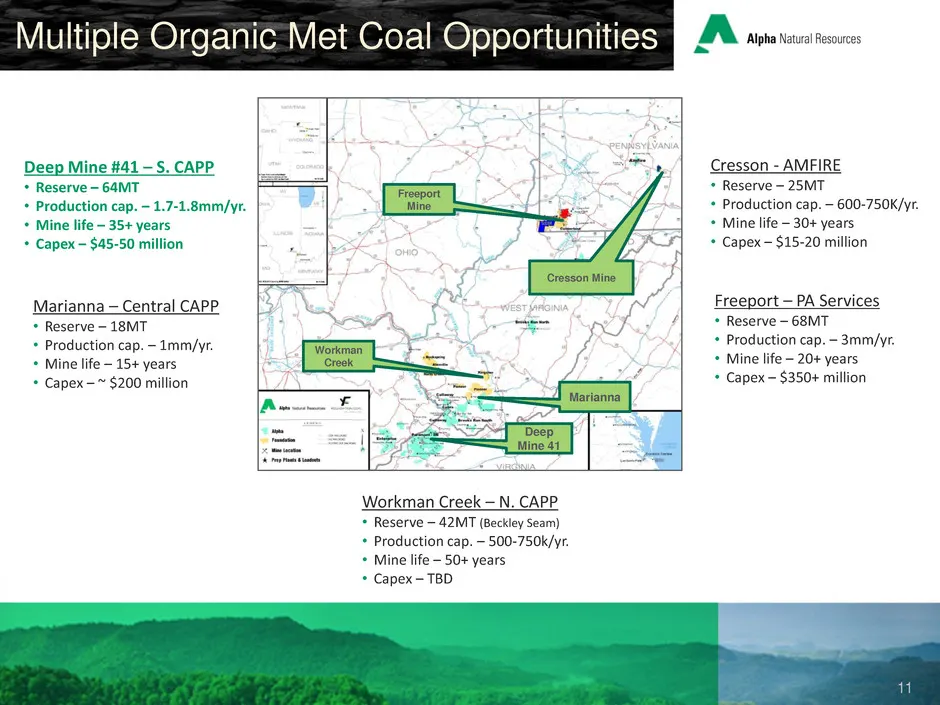
11 Multiple Organic Met Coal Opportunities Freeport – PA Services • Reserve – 68MT • Production cap. – 3mm/yr. • Mine life – 20+ years • Capex – $350+ million Cresson - AMFIRE • Reserve – 25MT • Production cap. – 600-750K/yr. • Mine life – 30+ years • Capex – $15-20 million Workman Creek – N. CAPP •
Slide 12: Market Overview: BRICS Drive Global Growth
12 Alpha Natural Resources European Investor Presentation Market Overview BRICS Drive Global Growth
Slide 13: Asia Drives Thermal Demand
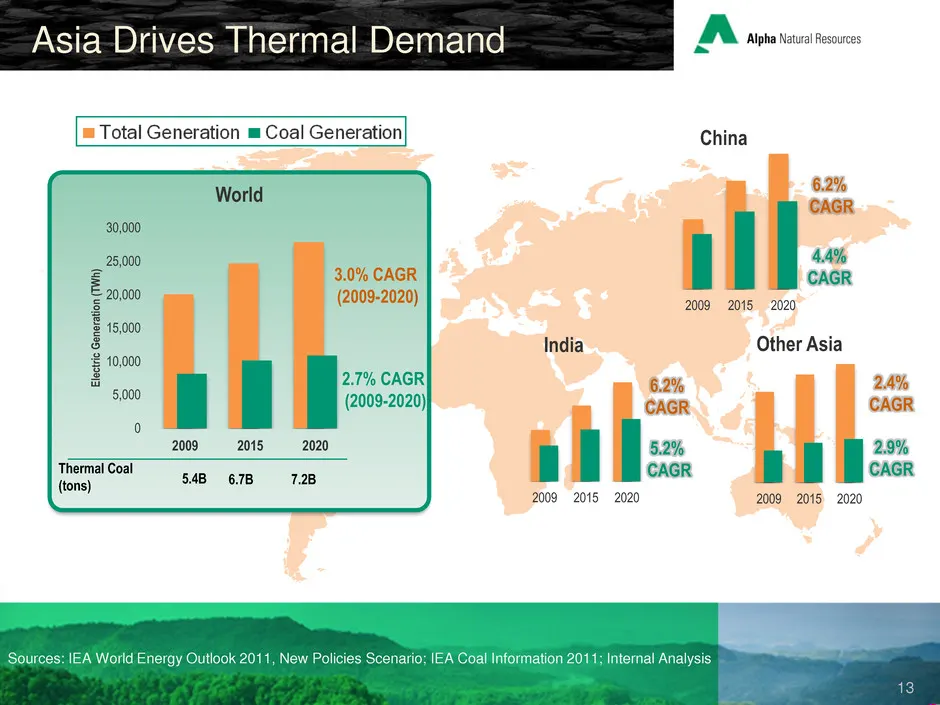
13 Asia Drives Thermal Demand Sources: IEA World Energy Outlook 2011, New Policies Scenario; IEA Coal Information 2011; Internal Analysis 2009 2015 2020 India 6.2% CAGR 5.2% CAGR 2009 2015 2020 China 4.4% CAGR 6.2% CAGR 0 5,000 10,000 15,000 20,000 25,000 30,000 2009 2015 2020 El ec tri c Ge n er at
Slide 14: Developing Nations Need Met Coal
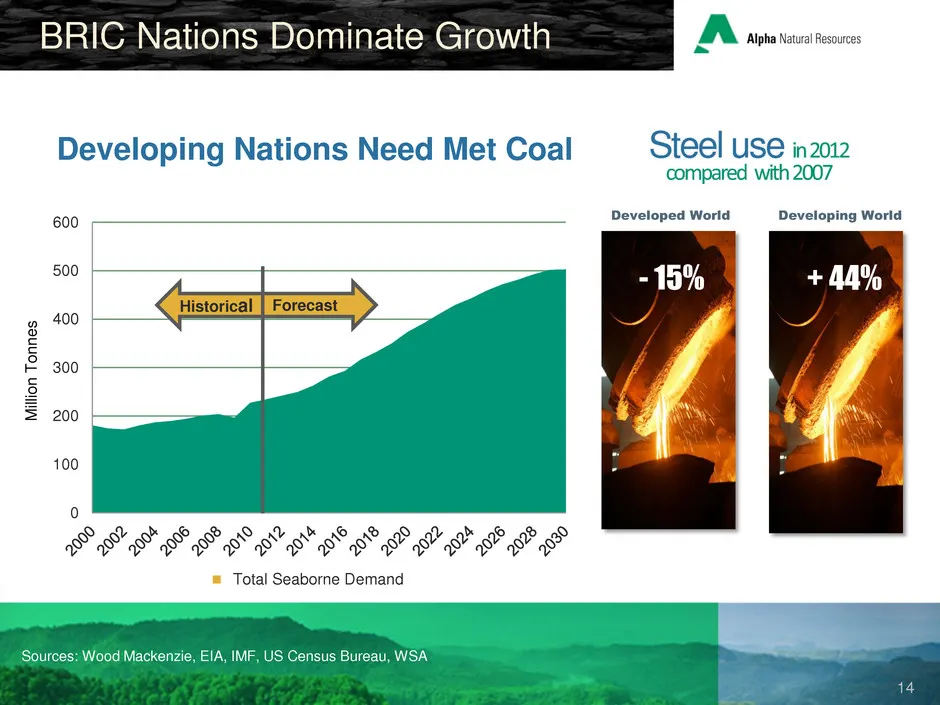
14 0 100 200 300 400 500 600 Total Seaborne Demand M ill io n T o n n e s - 15% Developed World Developing World + 44% BRIC Nations Dominate Growth Steel use in 2012 compared with 2007 Sources: Wood Mackenzie, EIA, IMF, US Census Bureau, WSA Developing Nations Need Met Coal Forecast Historical
Slide 15: Global Cutbacks Impacting Met Market
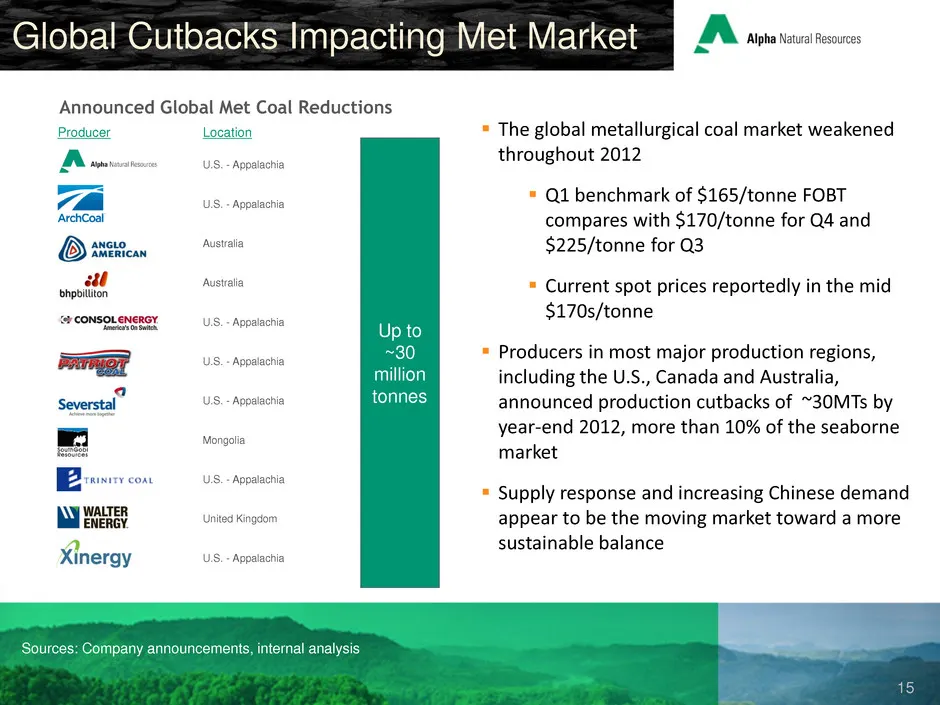
15 Global Cutbacks Impacting Met Market Sources: Company announcements, internal analysis Announced Global Met Coal Reductions Up to ~30 million tonnes U.S. - Appalachia U.S. - Appalachia Australia Australia U.S. - Appalachia U.S. - Appalachia U.S. - Appalachia Mongolia U.S. - Appalachia United King
Slide 16: CAPP Steam Facing Structural Challenges
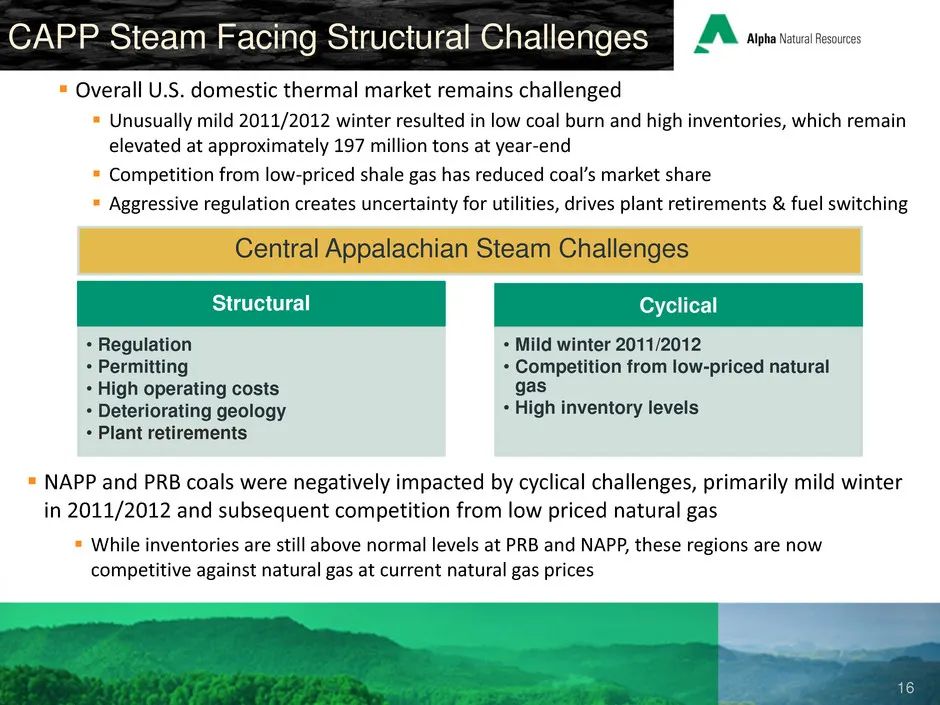
16 Overall U.S. domestic thermal market remains challenged Unusually mild 2011/2012 winter resulted in low coal burn and high inventories, which remain elevated at approximately 197 million tons at year-end Competition from low-priced shale gas has reduced coal’s market share Aggressive regu
Slide 17: Nat Gas Rebound Drives Thermal Coal Use
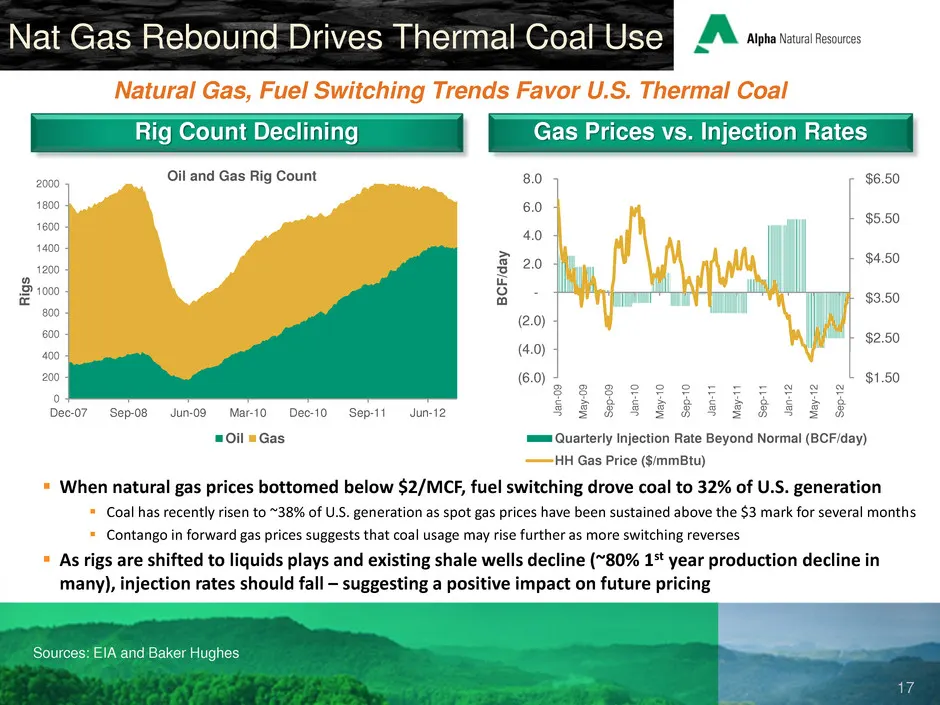
17 When natural gas prices bottomed below $2/MCF, fuel switching drove coal to 32% of U.S. generation Coal has recently risen to ~38% of U.S. generation as spot gas prices have been sustained above the $3 mark for several months Contango in forward gas prices suggests that coal usage may rise
Slide 18: Regulation Causing Coal Unit Retirements
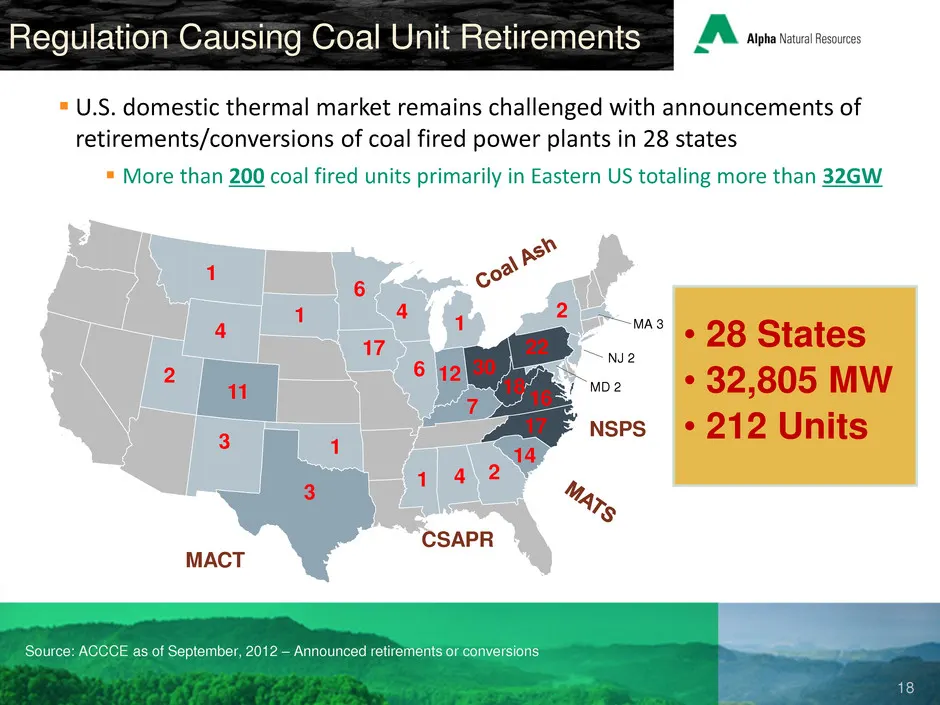
18 MA 3 MD 2 NJ 2 22 14 16 17 18 30 17 6 1 3 4 2 3 2 4 1 6 4 12 7 11 1 U.S. domestic thermal market remains challenged with announcements of retirements/conversions of coal fired power plants in 28 states More than 200 coal fired units primarily in Eastern US totaling more than 32GW Regulation C
Slide 19: Financial Overview: Resources to Enhance Shareholder Value
19 Alpha Natural Resources European Investor Presentation Financial Overview Resources to Enhance Shareholder Value
Slide 20: ANR: Strong Financial Results
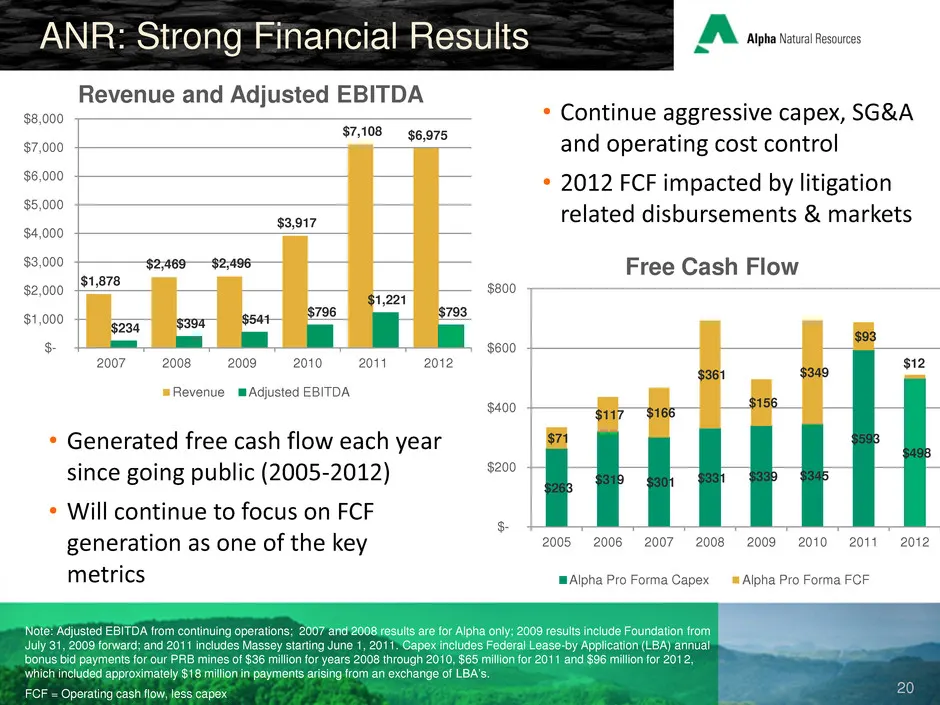
20 Note: Adjusted EBITDA from continuing operations; 2007 and 2008 results are for Alpha only; 2009 results include Foundation from July 31, 2009 forward; and 2011 includes Massey starting June 1, 2011. Capex includes Federal Lease-by Application (LBA) annual bonus bid payments for our PRB mines of
Slide 21: Liquidity Remains Strong
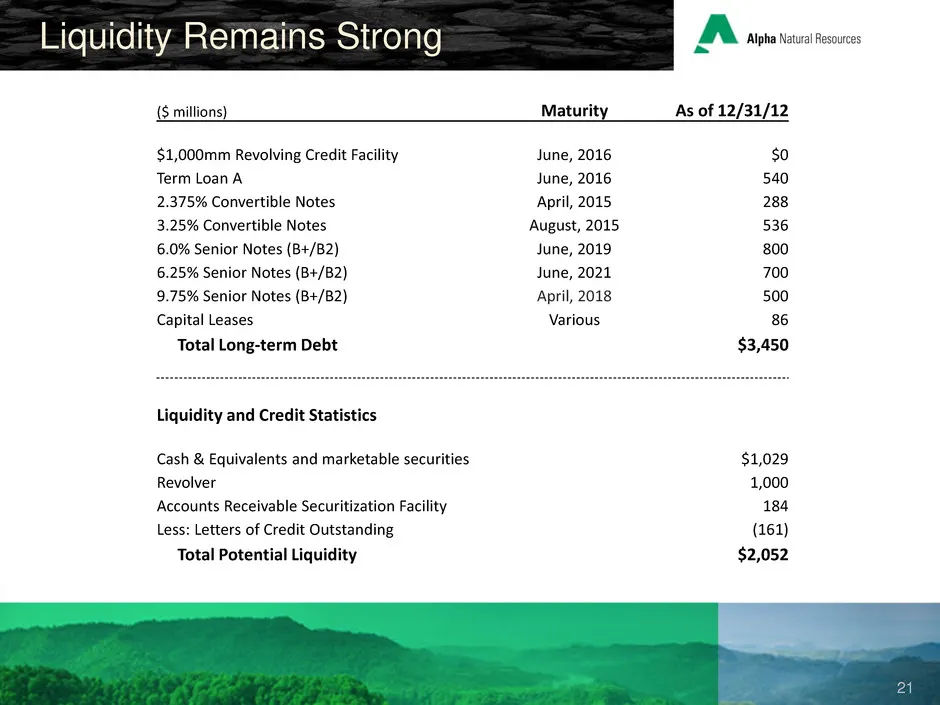
21 Liquidity Remains Strong ($ millions) Maturity As of 12/31/12 $1,000mm Revolving Credit Facility June, 2016 $0 Term Loan A June, 2016 540 2.375% Convertible Notes April, 2015 288 3.25% Convertible Notes August, 2015 536 6.0% Senior Notes (B+/B2) June, 2019 800 6.25% Senior Notes (B+/B2) June, 202
Slide 22: Well-Positioned for Future Growth
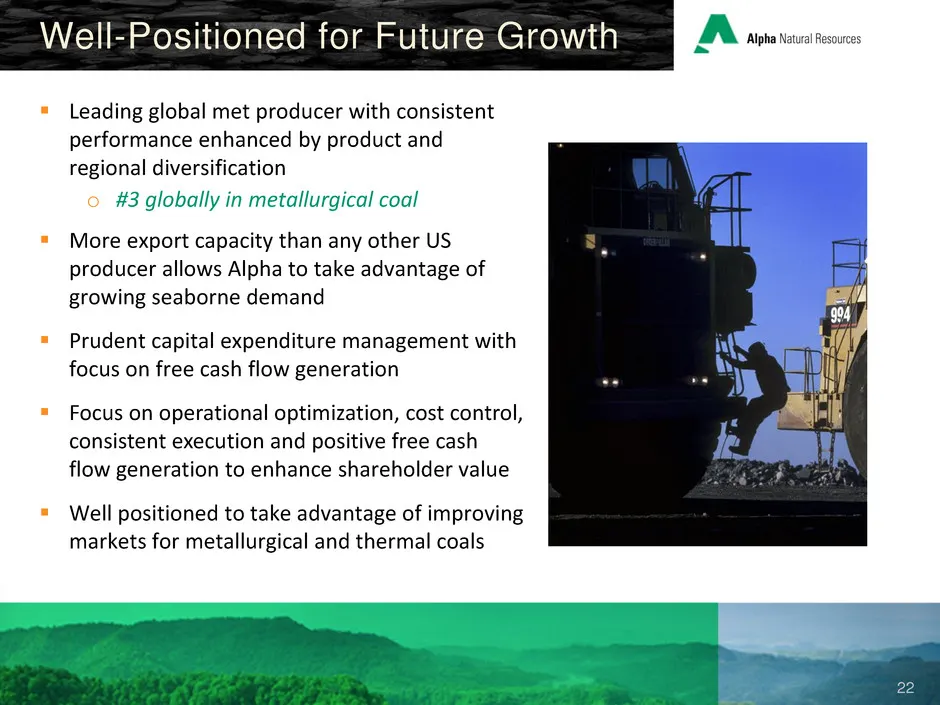
22 Leading global met producer with consistent performance enhanced by product and regional diversification o #3 globally in metallurgical coal More export capacity than any other US producer allows Alpha to take advantage of growing seaborne demand Prudent capital expenditure management with
Slide 23: Appendices
23 www.alphanr.com Appendices
Slide 24: 2013 Guidance Issued Feb. 14, 2013
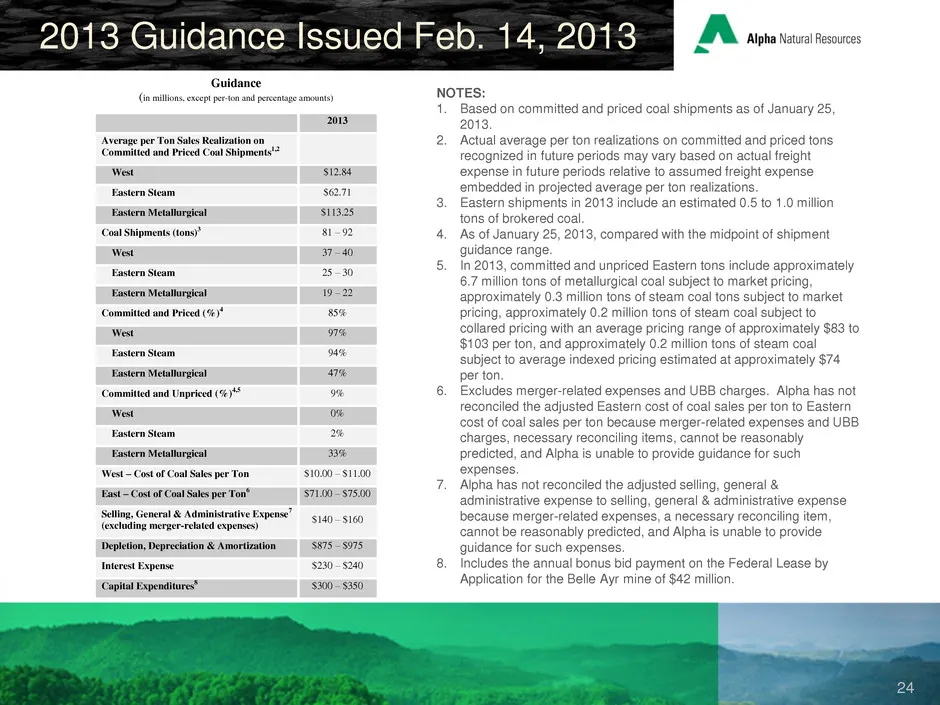
24 2013 Guidance Issued Feb. 14, 2013 NOTES: 1. Based on committed and priced coal shipments as of January 25, 2013. 2. Actual average per ton realizations on committed and priced tons recognized in future periods may vary based on actual freight expense in future periods relative to assumed freight
Slide 25: Reconciliation: Use of Non-GAAP Measures
25 Reconciliation Use of Non-GAAP Measures In addition to the results prepared in accordance with generally accepted accounting principles in the United States (GAAP) provided throughout this press release, Alpha has presented the following non-GAAP financial measures, which management uses to gauge
Slide 26: Reconciliation of Adjusted EBITDA
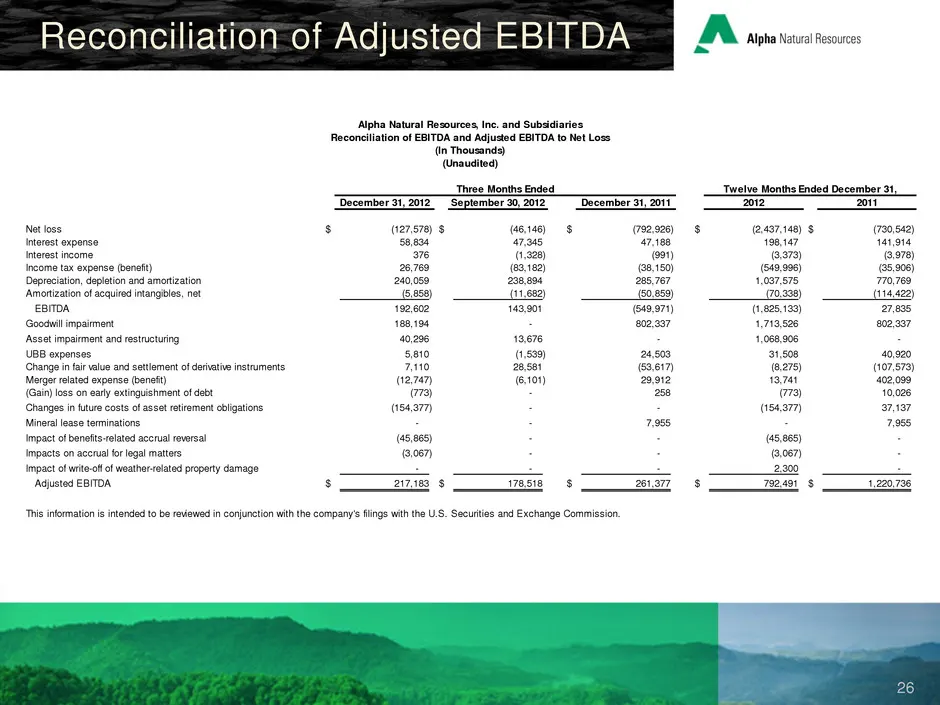
26 Reconciliation of Adjusted EBITDA Alpha Natural Resources, Inc. and Subsidiaries Reconciliation of EBITDA and Adjusted EBITDA to Net Loss (In Thousands) (Unaudited) December 31, 2012 September 30, 2012 December 31, 2011 2012 2011 Net loss $ (127,578) $ (46,146) $ (792,926) $ (2,437,148) $ (730,54
Slide 27: Reconciliation of Adjusted Income
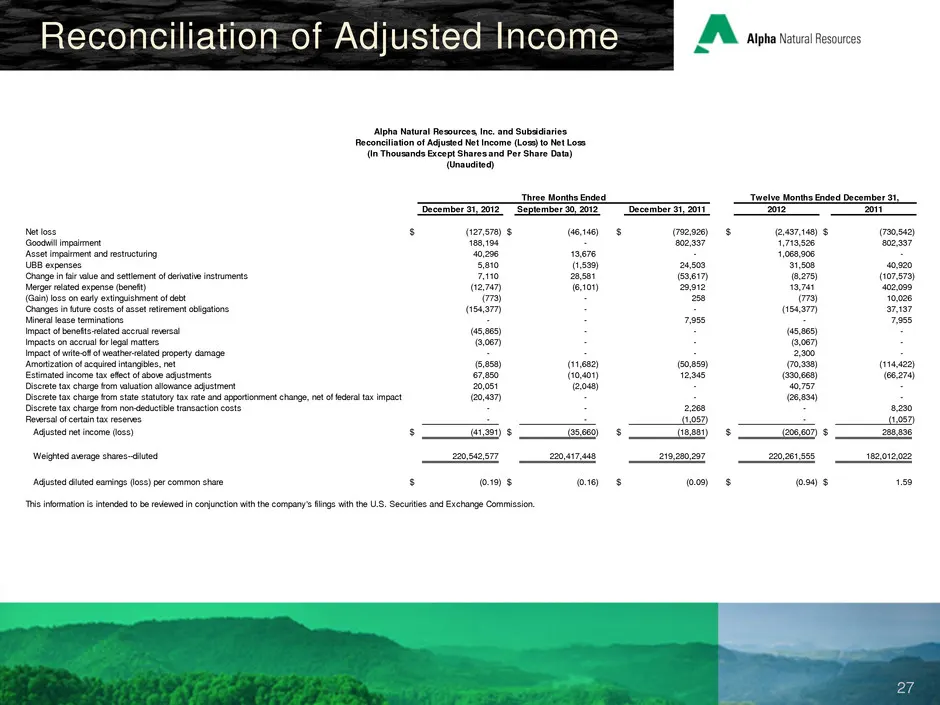
27 Reconciliation of Adjusted Income December 31, 2012 September 30, 2012 December 31, 2011 2012 2011 Net loss $ (127,578) $ (46,146) $ (792,926) $ (2,437,148) $ (730,542) Goodwill impairment 188,194 - 802,337 1,713,526 802,337 Asset impairment and restructuring 40,296 13,676 - 1,068,906 - UBB expen
Source: SEC EDGAR · 8-K filed Feb 25, 2013
More decks from Alpha Natural Resources Inc
 J.P. Morgan Global High Yield & Leveraged Finance Conference (February 2015)36 slides · Feb 23, 2015
 Barclays CEO Energy-Power Conference 201435 slides · Sep 2, 2014
 2014 BMO 23rd Global Metals and Mining Conference; Sterne Agee 2014 Boston Executive Summi33 slides · Jun 17, 2014
 2014 BMO 23rd Global Metals and Mining Conference / Brean Capital 2014 Global Resources &30 slides · May 28, 2014
 2014 BMO 23rd Global Metals and Mining Conference30 slides · Feb 24, 2014
 Tuohy Brothers' 4th Annual Energy Conference (August 2013)26 slides · Aug 5, 2013