Alpha Natural Resources — Barclays CEO Energy-Power Conference 2014
35 slides from Alpha Natural Resources's conference presentation, Sep 2, 2014
Slide 1: Barclays CEO Energy-Power Conference September 2, 2014
[September 2,] 2014 Barclays CEO Energy-Power Conference September 2, 2014
Slide 2: Forward-Looking Statements
2 Forward-Looking Statements Statements in this presentation which are not statements of historical fact are “forward-looking statements” within the Safe Harbor provision of the Private Securities Litigation Reform Act of 1995. Such statements are not guarantees of future performance. Many factors c

Slide 3: Well Managed and Strategically Diversified Global Producer
Well Managed and Strategically Diversified Global Producer
Slide 4: Moving Alpha Forward
4 Moving Alpha Forward • Experienced management team focused on rational portfolio management to mitigate near-term pressure and drive long-term shareholder value creation • Continued focus on managing balance sheet and liquidity - Preserving financial flexibility, maintaining resilience through com
Slide 5: Experienced Industry Leadership
5 Experienced Industry Leadership Management Team with Long Track Record and Deep Expertise • Track record of selective growth and conservative balance sheet management through all market cycles • Periodic portfolio reviews to proactively manage Alpha’s operating profile • Demonstrated ability to ma
Slide 6: Alpha's Inherent Strengths
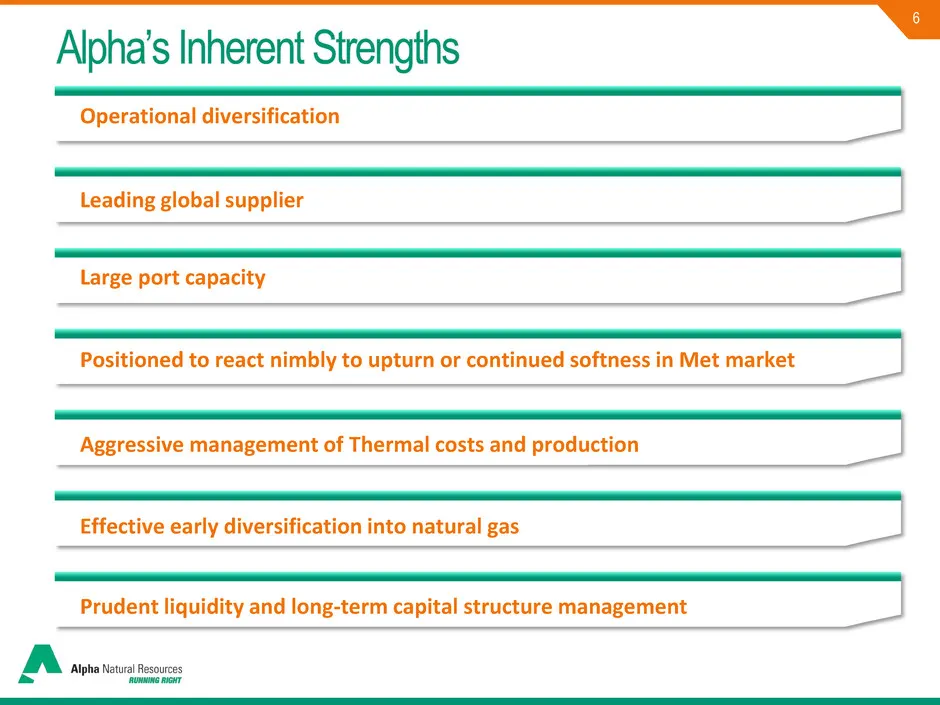
6 Alpha’s Inherent Strengths Operational diversification Leading global supplier Large port capacity Positioned to react nimbly to upturn or continued softness in Met market Aggressive management of Thermal costs and production Effective early diversification into natural gas Prudent liquidity and l
Slide 7: Operational Diversification – Revenues & Product Mix
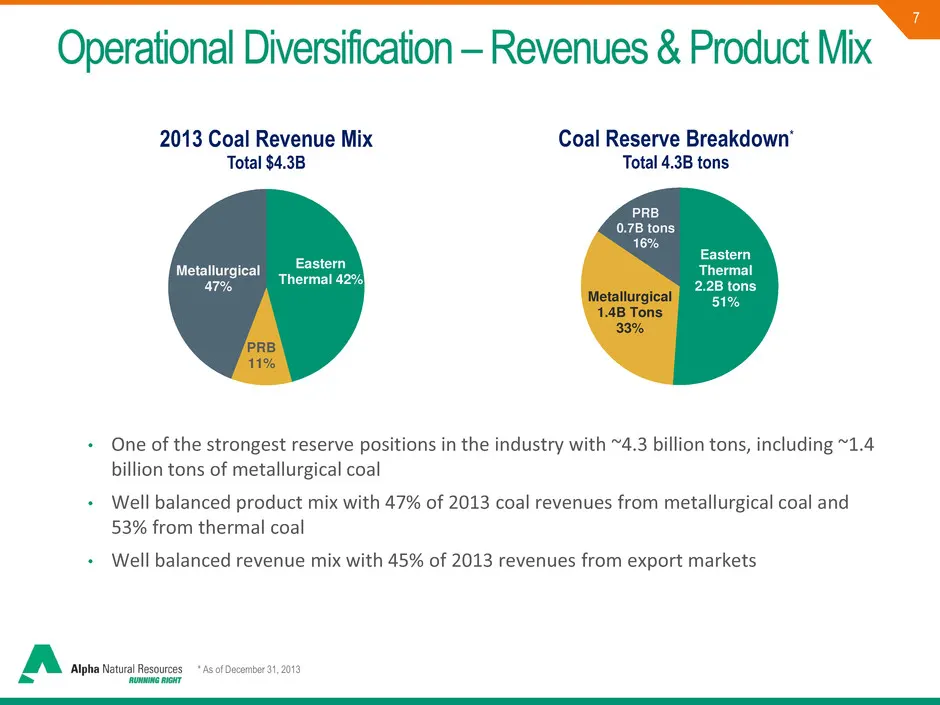
7 * As of December 31, 2013 Eastern Thermal 42% PRB 11% Metallurgical 47% 2013 Coal Revenue Mix Total $4.3B Eastern Thermal 2.2B tons 51% Metallurgical 1.4B Tons 33% PRB 0.7B tons 16% Coal Reserve Breakdown* Total 4.3B tons * As of December 31, 2013 Operational Diversification – Revenues & Product M
Slide 8: Operational Diversification – Geography
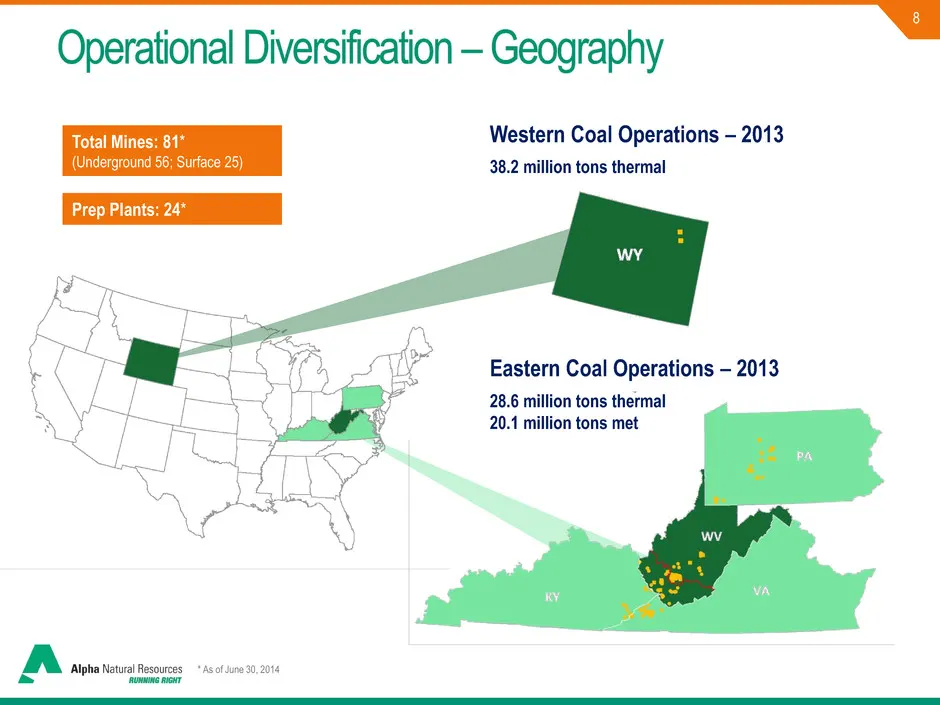
8 Western Coal Operations – 2013 38.2 million tons thermal * As of June 30, 2014 Total Mines: 81* (Underground 56; Surface 25) Prep Plants: 24* Operational Diversification – Geography Eastern Coal Operations – 2013 28.6 million tons thermal 20.1 million tons met
Slide 9: Leading Global Supplier
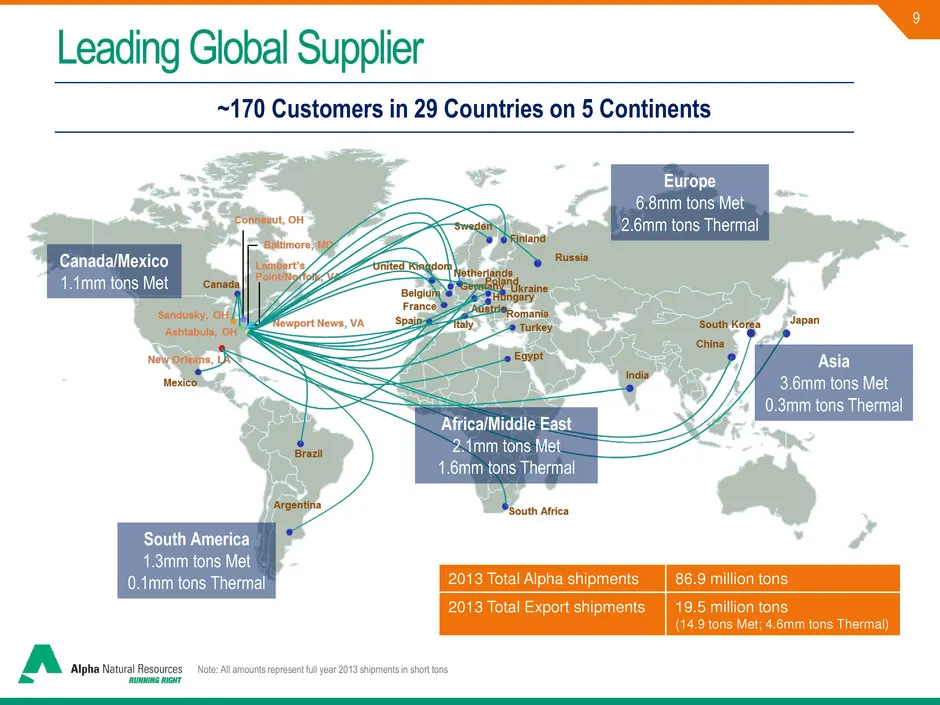
9 ~170 Customers in 29 Countries on 5 Continents Leading Global Supplier Note: All amounts represent full year 2013 shipments in short tons 2013 Total Alpha shipments 86.9 million tons 2013 Total Export shipments 19.5 million tons (14.9 tons Met; 4.6mm tons Thermal) Africa/Middle East 2.1mm tons Met
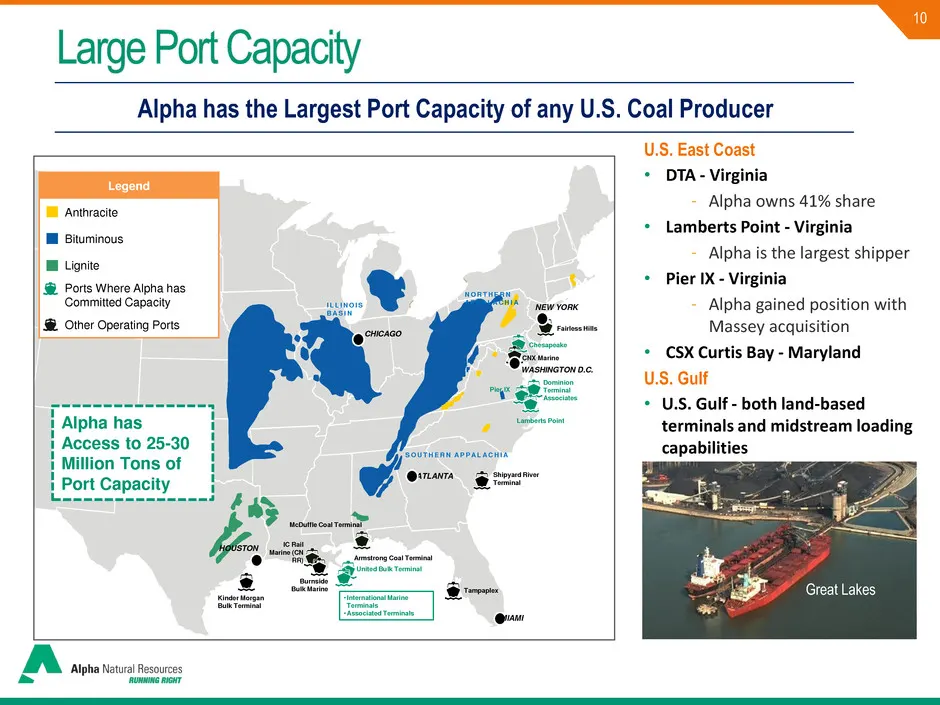
Slide 10: Alpha has the Largest Port Capacity of any U.S. Coal Producer
10 U.S. East Coast • DTA - Virginia - Alpha owns 41% share • Lamberts Point - Virginia - Alpha is the largest shipper • Pier IX - Virginia - Alpha gained position with Massey acquisition • CSX Curtis Bay - Maryland U.S. Gulf • U.S. Gulf - both land-based terminals and midstream loading capabilities
Slide 11: Global Coal Market Overview
11 Global Coal Market Overview
Slide 12: Global Coal Market Overview: Demand and Supply
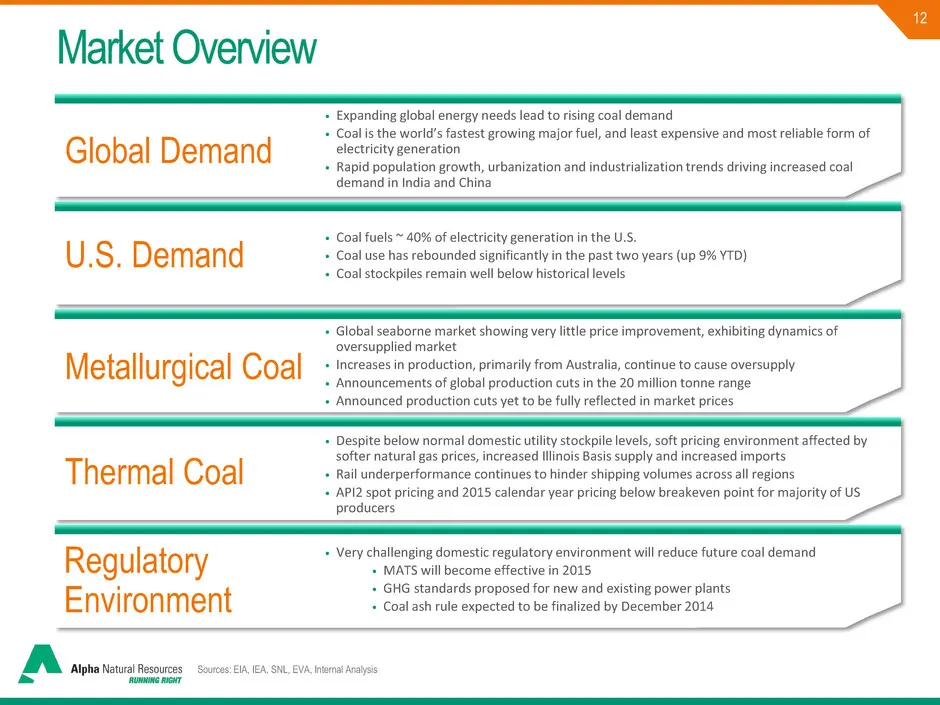
12 • Expanding global energy needs lead to rising coal demand • Coal is the world’s fastest growing major fuel, and least expensive and most reliable form of electricity generation • Rapid population growth, urbanization and industrialization trends driving increased coal demand in India and China G
Slide 13: Metallurgical Coal
Metallurgical Coal
Slide 14: Metallurgical Coal – Strategic Considerations
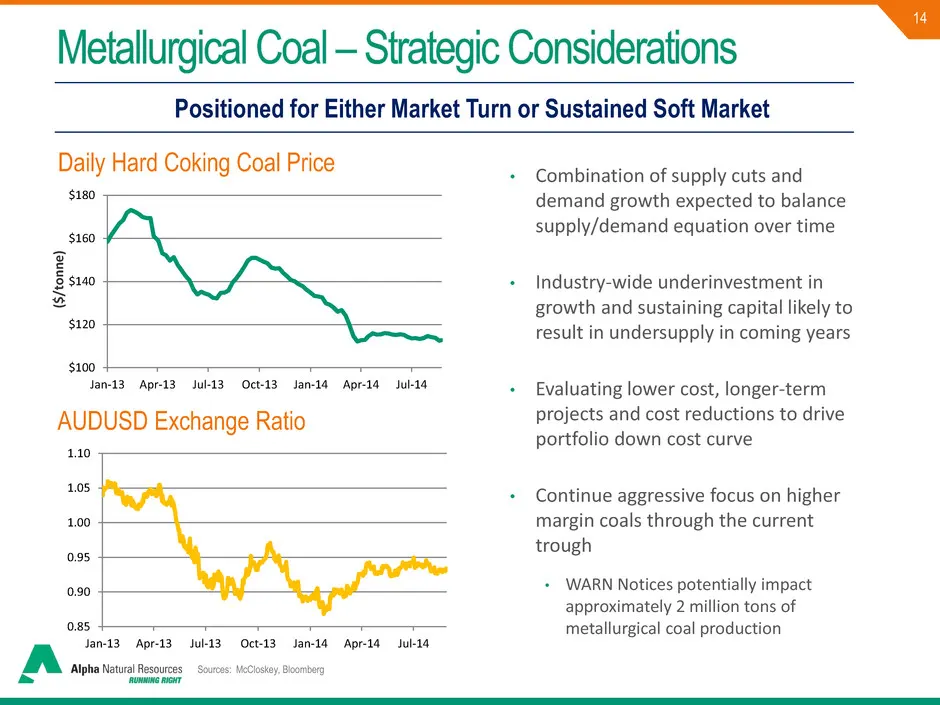
14 • Combination of supply cuts and demand growth expected to balance supply/demand equation over time • Industry-wide underinvestment in growth and sustaining capital likely to result in undersupply in coming years • Evaluating lower cost, longer-term projects and cost reductions to drive portfolio
Slide 15: Global Steel Growth Rates 2013-2015
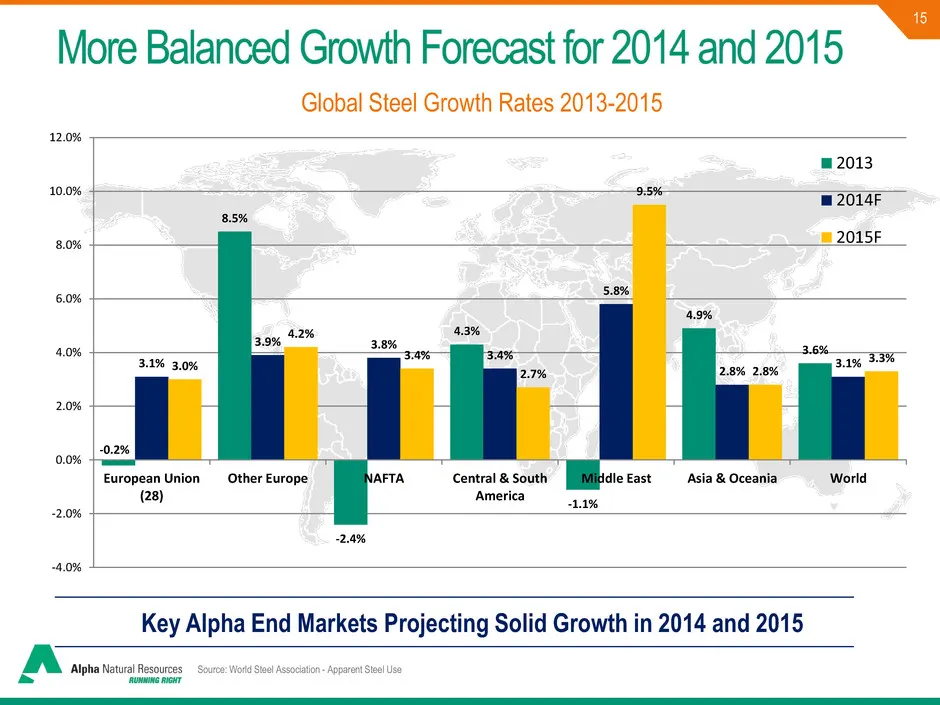
15 Global Steel Growth Rates 2013-2015 Key Alpha End Markets Projecting Solid Growth in 2014 and 2015 More Balanced Growth Forecast for 2014 and 2015 Source: World Steel Association - Apparent Steel Use -0.2% 8.5% -2.4% 4.3% -1.1% 4.9% 3.6% 3.1% 3.9% 3.8% 3.4% 5.8% 2.8% 3.1% 3.0% 4.2% 3.4% 2.7% 9.5%
Slide 16: Global Seaborne Metallurgical Growth Rate Nearly 4% from 2013 to 2020
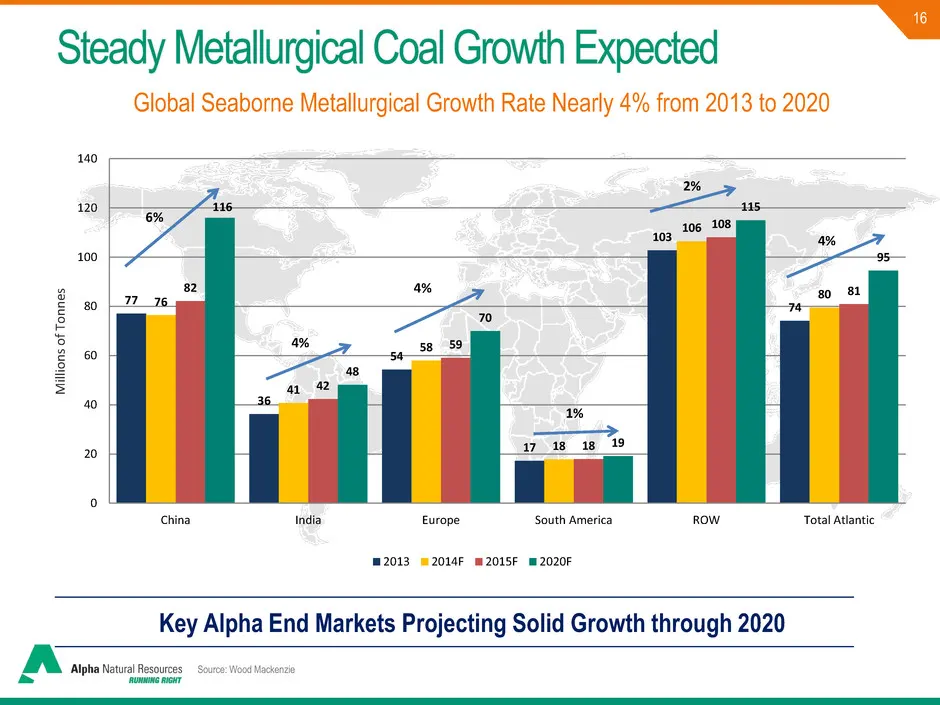
16 Global Seaborne Metallurgical Growth Rate Nearly 4% from 2013 to 2020 Key Alpha End Markets Projecting Solid Growth through 2020 Steady Metallurgical Coal Growth Expected Source: Wood Mackenzie 77 36 54 17 103 74 76 41 58 18 106 80 82 42 59 18 108 81 116 48 70 19 115 95 0 20 40 60 80 100 120 140
Slide 17: Thermal Coal
Thermal Coal
Slide 18: Thermal Coal Assets – Strategic Considerations
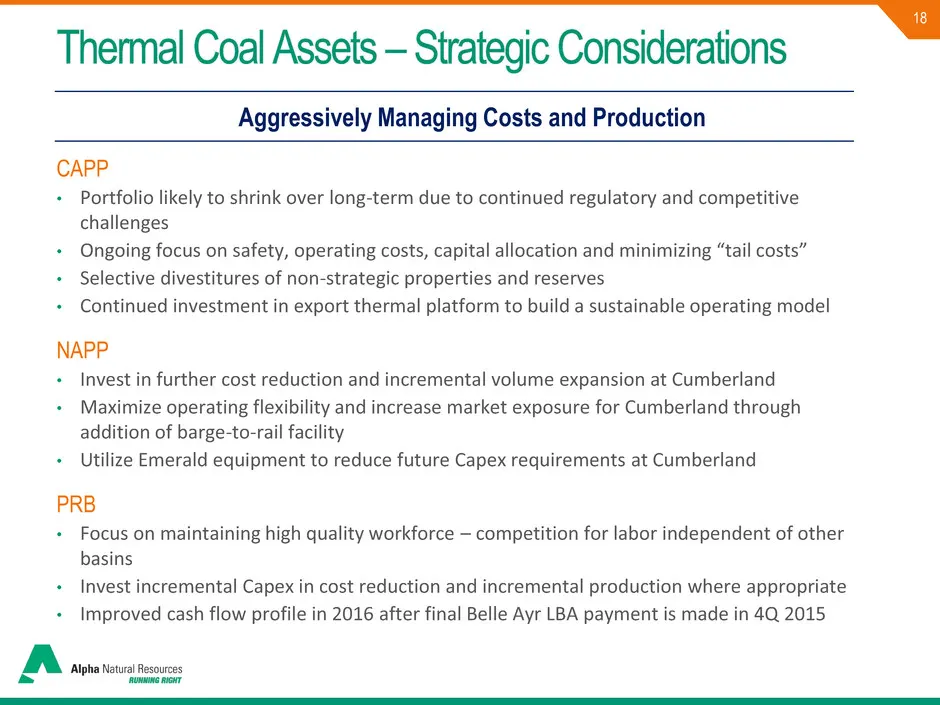
18 Aggressively Managing Costs and Production Thermal Coal Assets – Strategic Considerations CAPP • Portfolio likely to shrink over long-term due to continued regulatory and competitive challenges • Ongoing focus on safety, operating costs, capital allocation and minimizing “tail costs” • Selective
Slide 19: India & China Driving Global Demand
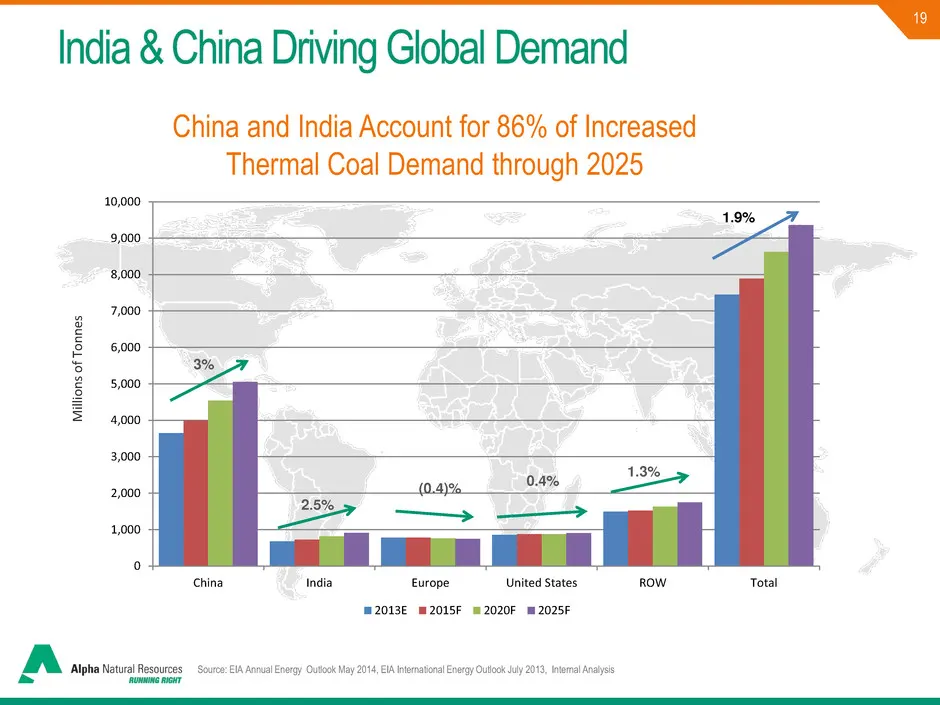
19 India & China Driving Global Demand China and India Account for 86% of Increased Thermal Coal Demand through 2025 Source: EIA Annual Energy Outlook May 2014, EIA International Energy Outlook July 2013, Internal Analysis 0 1,000 2,000 3,000 4,000 5,000 6,000 7,000 8,000 9,000 10,000 China India Eu
Slide 20: Evolving Domestic Coal Markets
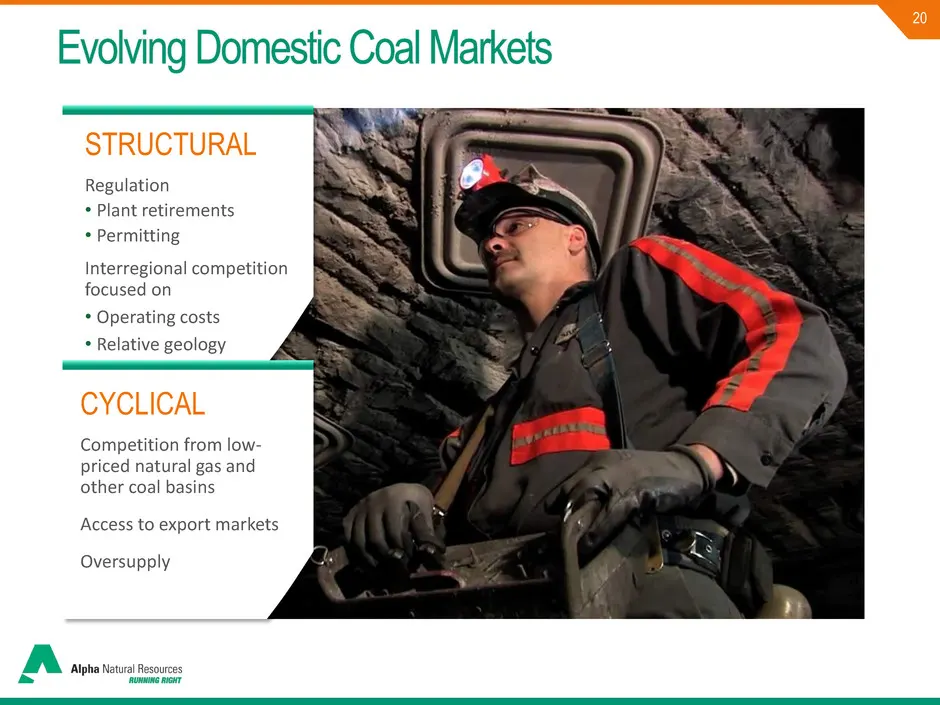
20 Evolving Domestic Coal Markets STRUCTURAL Regulation • Plant retirements • Permitting Interregional competition focused on • Operating costs • Relative geology CYCLICAL Competition from low- priced natural gas and other coal basins Access to export markets Oversupply
Slide 21: Coal Remains #1 Fuel for Electricity Generation
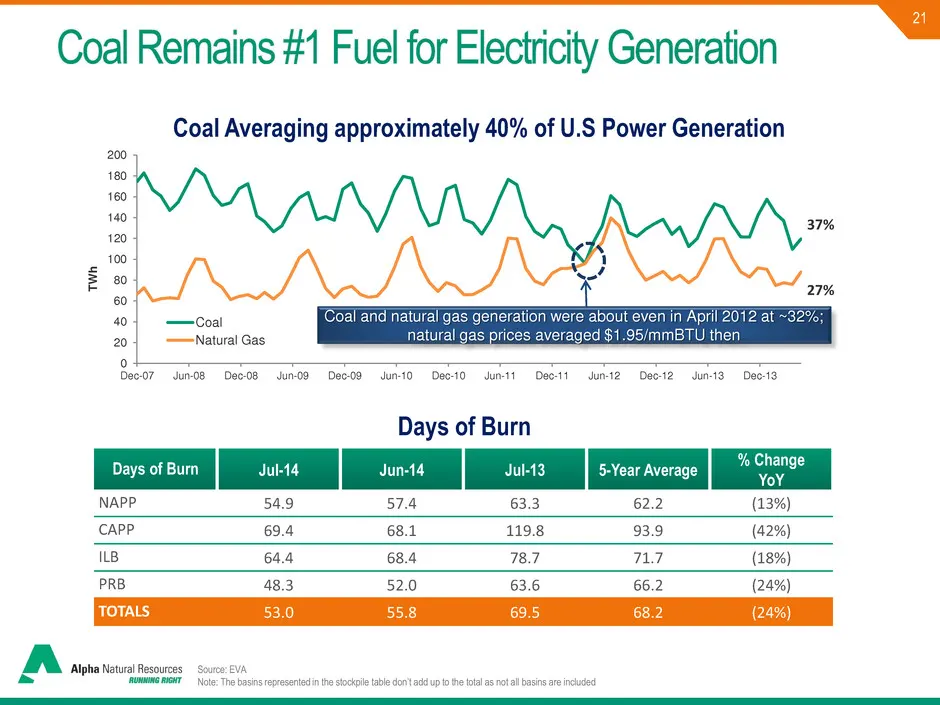
21 Days of Burn Jul-14 Jun-14 Jul-13 5-Year Average % Change YoY NAPP 54.9 57.4 63.3 62.2 (13%) CAPP 69.4 68.1 119.8 93.9 (42%) ILB 64.4 68.4 78.7 71.7 (18%) PRB 48.3 52.0 63.6 66.2 (24%) TOTALS 53.0 55.8 69.5 68.2 (24%) Coal Remains #1 Fuel for Electricity Generation Coal Averaging approximately 40
Slide 22: Natural Gas
Natural Gas
Slide 23: Monetize, Maintain and Grow Natural Gas
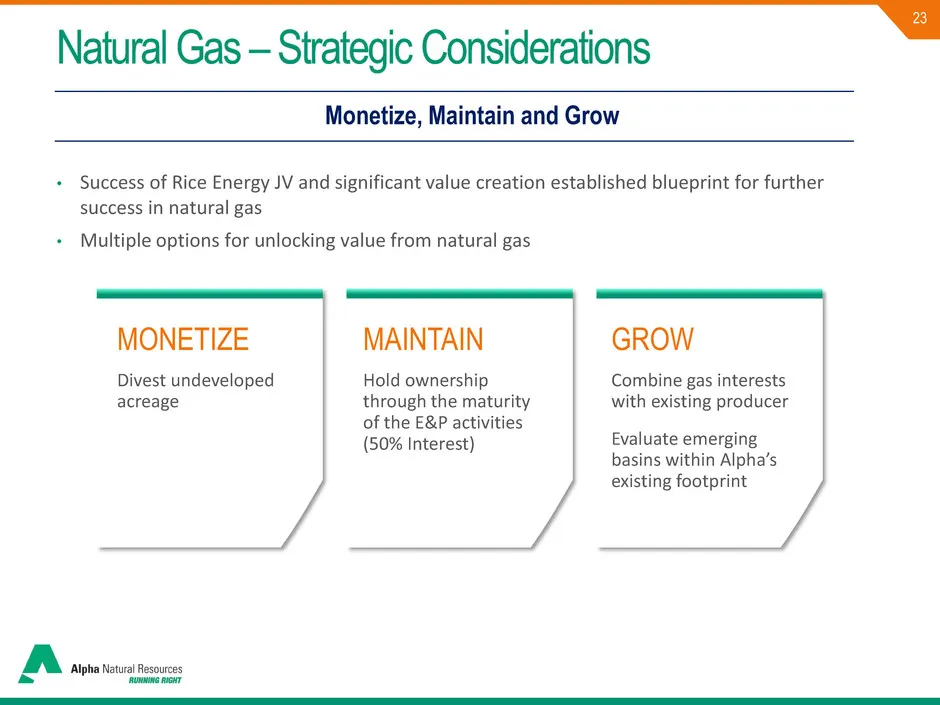
23 MONETIZE Divest undeveloped acreage MAINTAIN Hold ownership through the maturity of the E&P activities (50% Interest) GROW Combine gas interests with existing producer Evaluate emerging basins within Alpha’s existing footprint Monetize, Maintain and Grow Natural Gas – Strategic Considerations • S
Slide 24: Monetized Portion of Alpha's Natural Gas Portfolio
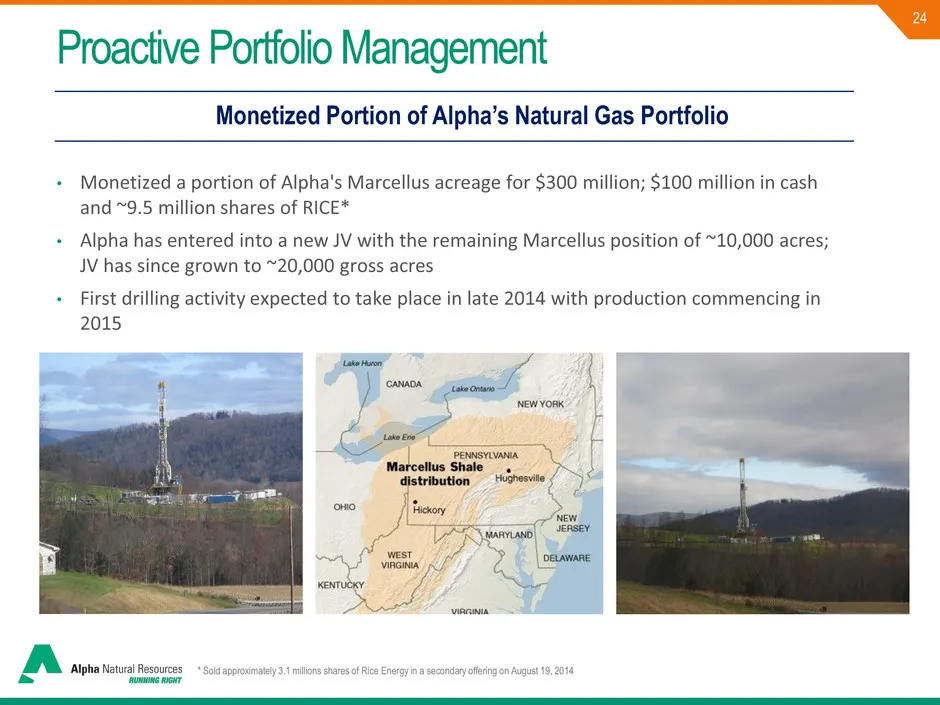
24 Monetized Portion of Alpha’s Natural Gas Portfolio Proactive Portfolio Management • Monetized a portion of Alpha's Marcellus acreage for $300 million; $100 million in cash and ~9.5 million shares of RICE* • Alpha has entered into a new JV with the remaining Marcellus position of ~10,000 acres; JV
Slide 25: Cost Control, Capital Structure and Liquidity Management
Cost Control, Capital Structure and Liquidity Management
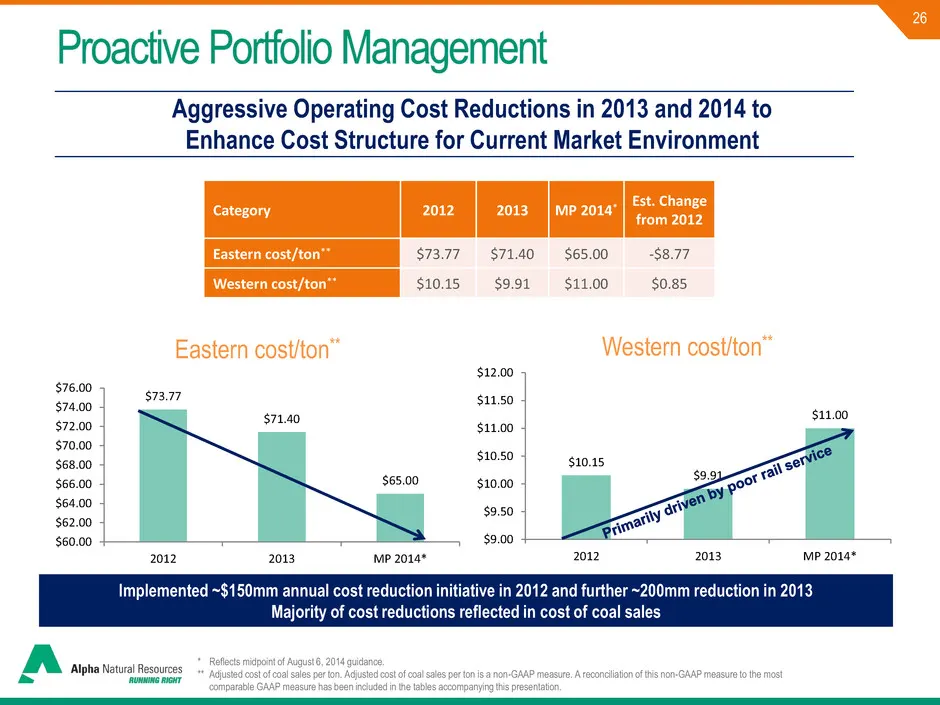
Slide 26: Aggressive Operating Cost Reductions in 2013 and 2014
26 $73.77 $71.40 $65.00 $60.00 $62.00 $64.00 $66.00 $68.00 $70.00 $72.00 $74.00 $76.00 2012 2013 MP 2014* Eastern cost/ton** Category 2012 2013 MP 2014* Est. Change from 2012 Eastern cost/ton** $73.77 $71.40 $65.00 -$8.77 Western cost/ton** $10.15 $9.91 $11.00 $0.85 Implemented ~$150mm annual cost r
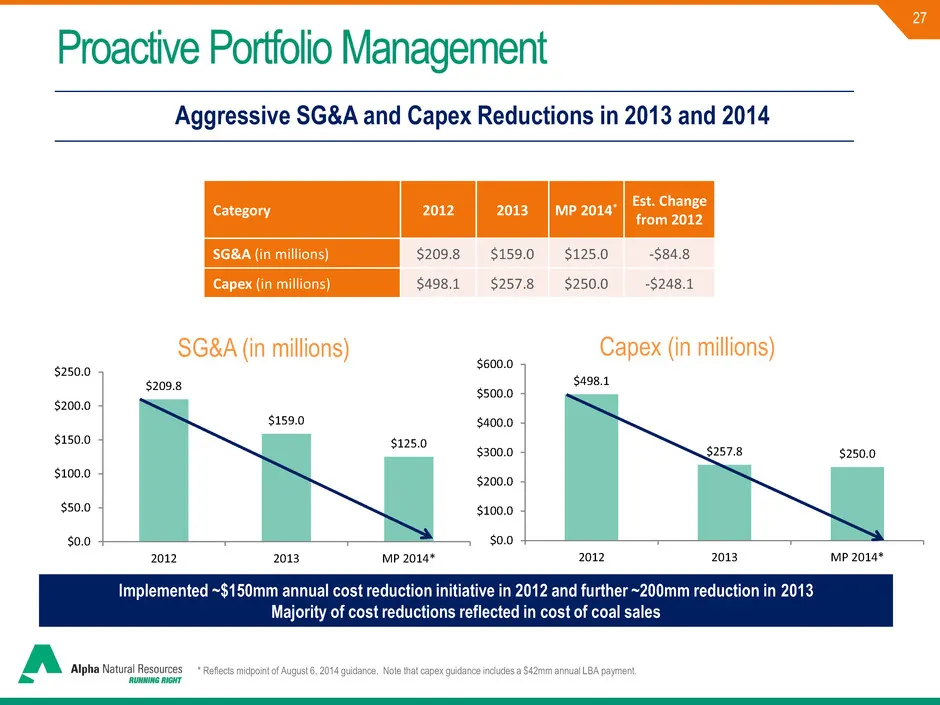
Slide 27: Aggressive SG&A and Capex Reductions in 2013 and 2014
27 $498.1 $257.8 $250.0 $0.0 $100.0 $200.0 $300.0 $400.0 $500.0 $600.0 2012 2013 MP 2014* Capex (in millions) $209.8 $159.0 $125.0 $0.0 $50.0 $100.0 $150.0 $200.0 $250.0 2012 2013 MP 2014* SG&A (in millions) Category 2012 2013 MP 2014* Est. Change from 2012 SG&A (in millions) $209.8 $159.0 $125.0 -$
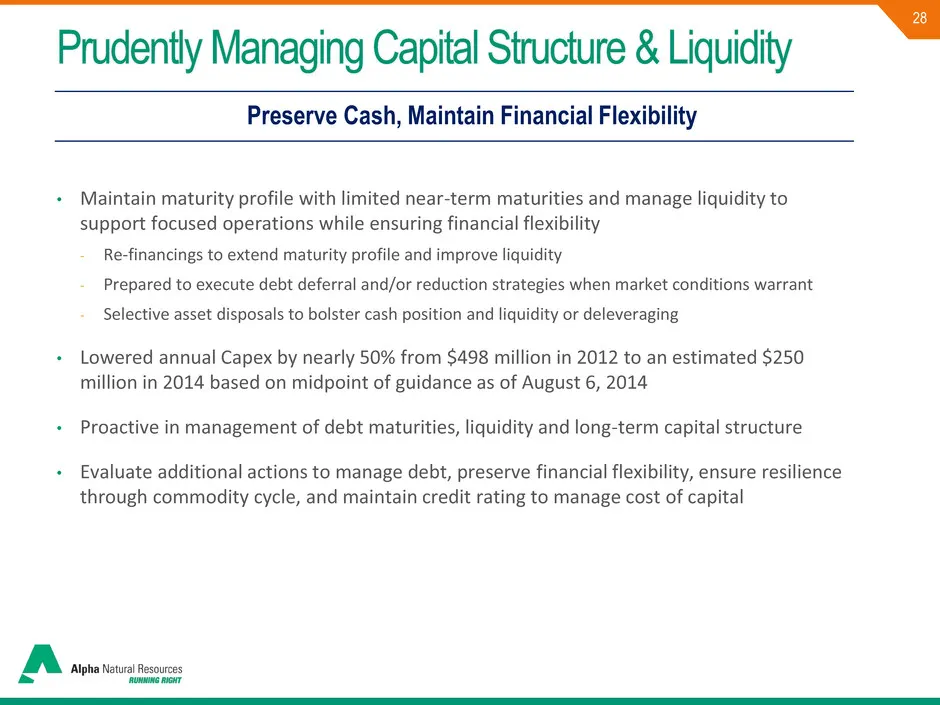
Slide 28: Prudently Managing Capital Structure & Liquidity
28 Prudently Managing Capital Structure & Liquidity • Maintain maturity profile with limited near-term maturities and manage liquidity to support focused operations while ensuring financial flexibility - Re-financings to extend maturity profile and improve liquidity - Prepared to execute debt deferr
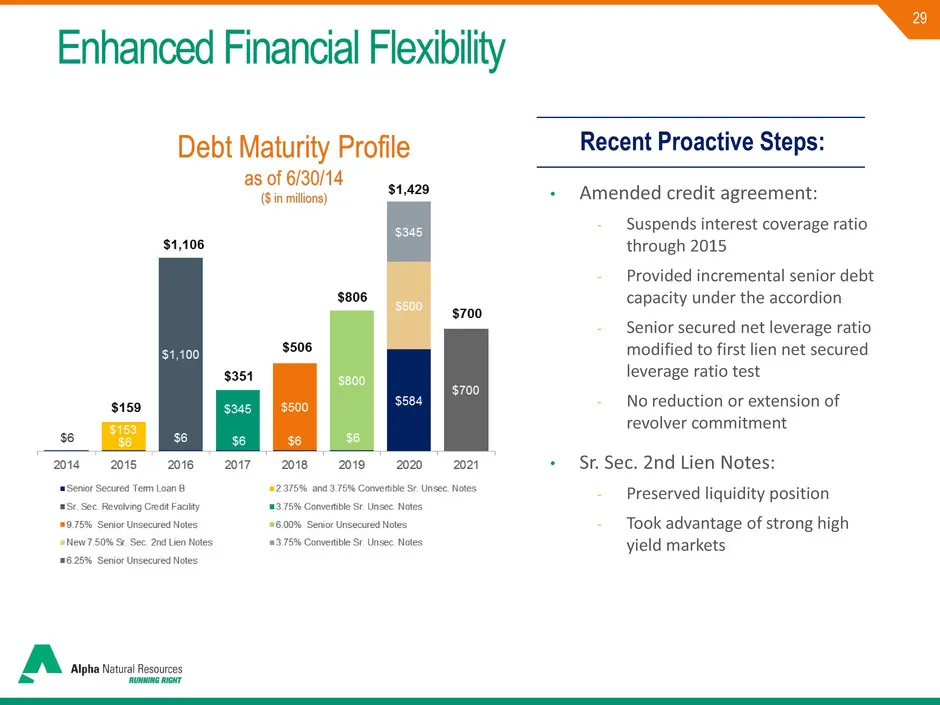
Slide 29: Enhanced Financial Flexibility
29 • Amended credit agreement: - Suspends interest coverage ratio through 2015 - Provided incremental senior debt capacity under the accordion - Senior secured net leverage ratio modified to first lien net secured leverage ratio test - No reduction or extension of revolver commitment • Sr. Sec. 2nd
Slide 30: Liquidity & Debt Profile
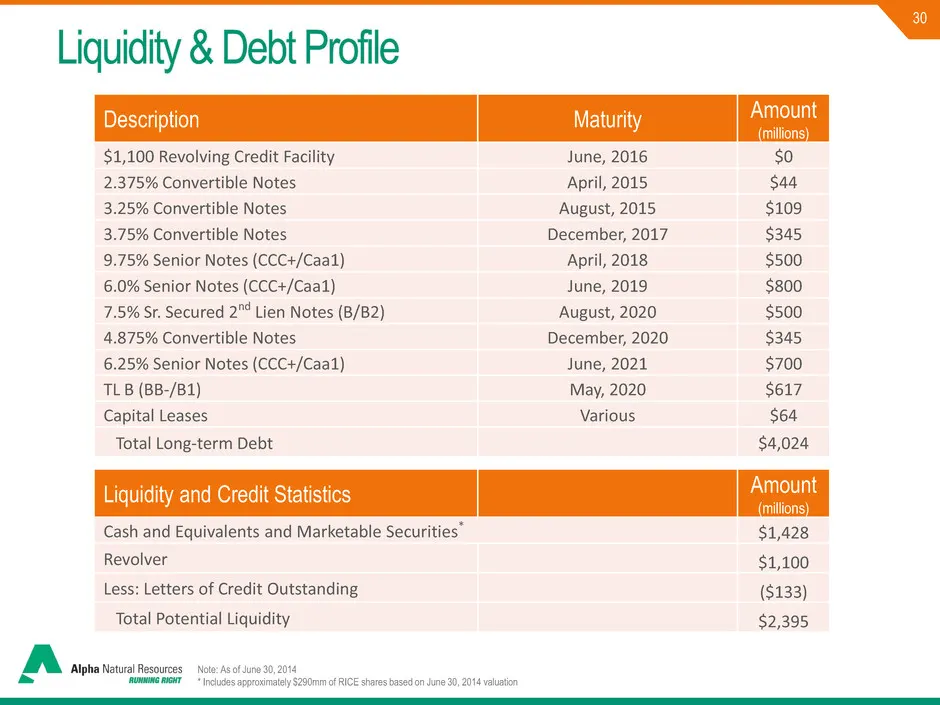
30 Description Maturity Amount (millions) $1,100 Revolving Credit Facility June, 2016 $0 2.375% Convertible Notes April, 2015 $44 3.25% Convertible Notes August, 2015 $109 3.75% Convertible Notes December, 2017 $345 9.75% Senior Notes (CCC+/Caa1) April, 2018 $500 6.0% Senior Notes (CCC+/Caa1) June,
Slide 31: Key Takeaways
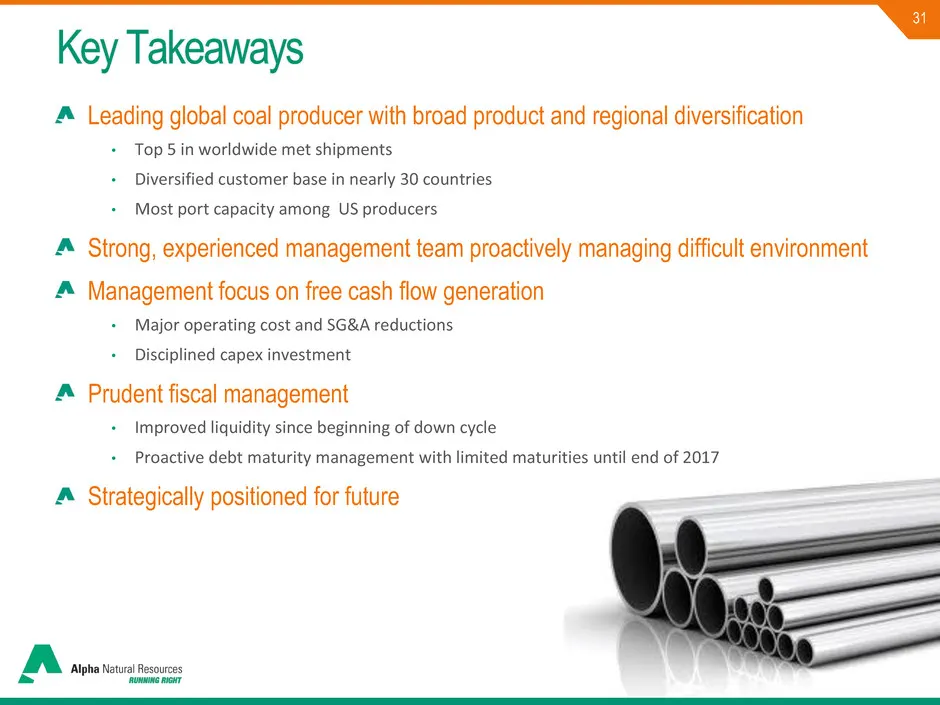
31 Key Takeaways Leading global coal producer with broad product and regional diversification • Top 5 in worldwide met shipments • Diversified customer base in nearly 30 countries • Most port capacity among US producers Strong, experienced management team proactively managing difficult environment M

Slide 32: Appendices
alphanr.com Appendices
Slide 33: Use of Non-GAAP Measures
33 Use of Non-GAAP Measures In addition to information prepared in accordance with generally accepted accounting principles in the United States (GAAP) provided throughout this presentation, Alpha has presented the following non-GAAP financial measures, which management uses to gauge operating perfo
Slide 34: Reconciliation of Adjusted Cost of Coal Sales Per Ton
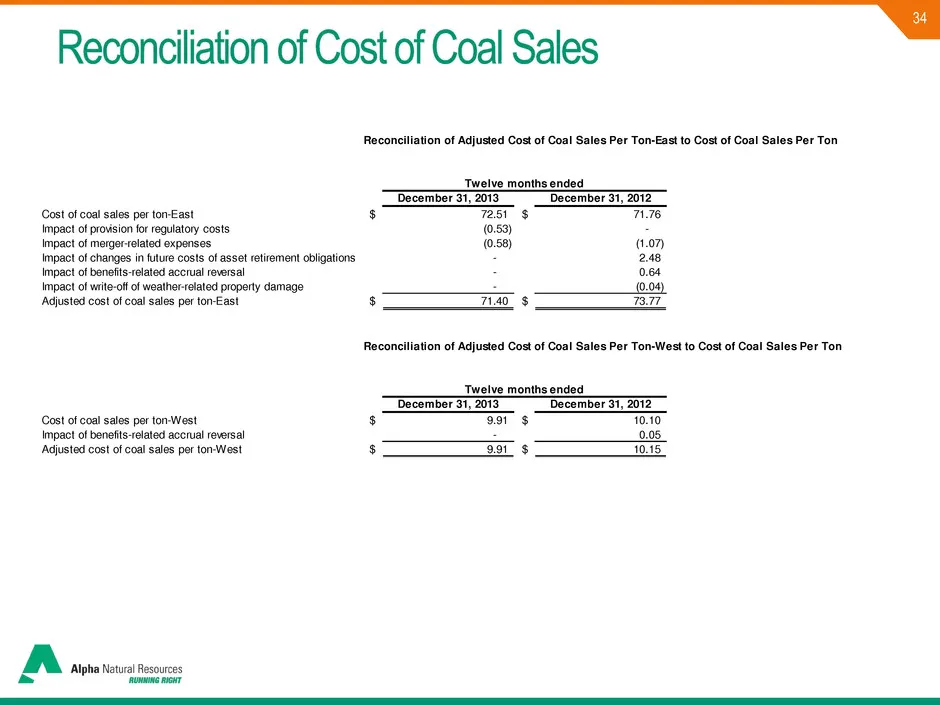
34 Reconciliation of Adjusted Cost of Coal Sales Per Ton-East to Cost of Coal Sales Per Ton December 31, 2013 December 31, 2012 Cost of coal sales per ton-East $ 72.51 $ 71.76 Impact of provision for regulatory costs (0.53) - Impact of merger-related expenses (0.58) (1.07) Impact of changes in futur

Slide 35: alphanr.com
alphanr.com
Source: SEC EDGAR · 8-K filed Sep 2, 2014
More decks from Alpha Natural Resources Inc
 J.P. Morgan Global High Yield & Leveraged Finance Conference (February 2015)36 slides · Feb 23, 2015
 2014 BMO 23rd Global Metals and Mining Conference; Sterne Agee 2014 Boston Executive Summi33 slides · Jun 17, 2014
 2014 BMO 23rd Global Metals and Mining Conference / Brean Capital 2014 Global Resources &30 slides · May 28, 2014
 2014 BMO 23rd Global Metals and Mining Conference30 slides · Feb 24, 2014
 Tuohy Brothers' 4th Annual Energy Conference (August 2013)26 slides · Aug 5, 2013
 J.P. Morgan Global High Yield & Leveraged Finance Conference (February 2013)27 slides · Feb 25, 2013