Yadkin Financial — Sandler O'Neill Conference 2014
19 slides from Yadkin Financial's conference presentation, Nov 13, 2014
Slide 1: Sandler O'Neill Conference November 13, 2014
Sandler O’Neill Conference November 13, 2014
Slide 2: Forward Looking Statements
Forward Looking Statements Information in this presentation contains forward-looking statements within the meaning of the Private Securities Litigation Reform Act of 1995. These statements involve risks and uncertainties that could cause actual results to differ materially, including without limitat
Slide 3: Investment Thesis
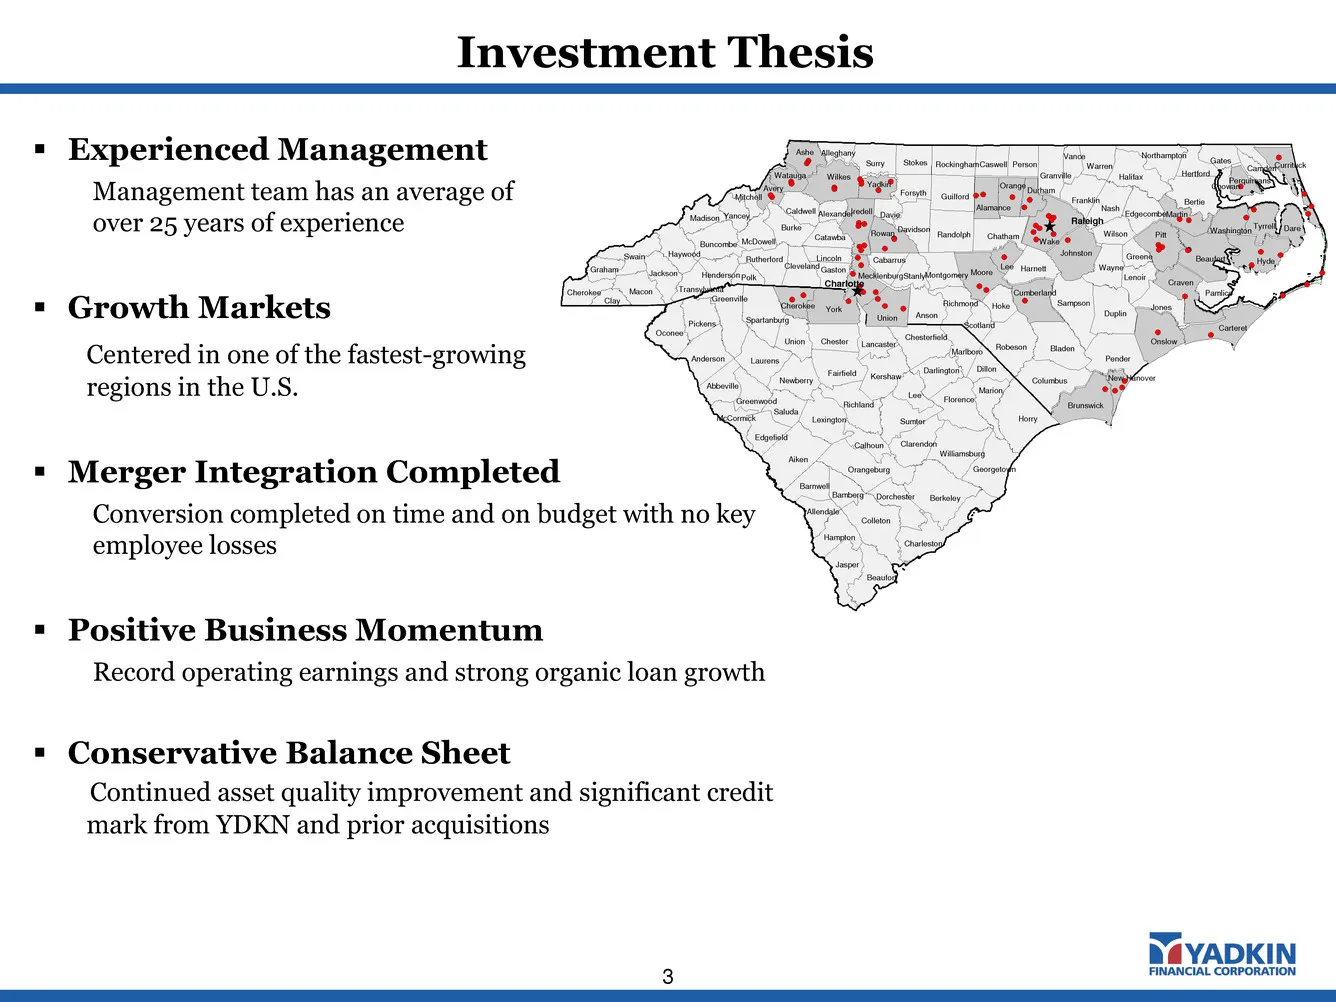
Investment Thesis 3 Stanly Cabarrus Vance Richmond Anson Florence Marion Darlington Marlboro Barnwell Greenwood Dillon Chesterfield Lancaster Columbus Lenoir Wayne Cleveland Rutherford Sampson Union Brunswick Cumberland Moore Lee Alamance Orange Iredell Wake Pitt Carteret Onslow Craven Watauga Perqu
Slide 4: Experienced Management With Deep Local Ties
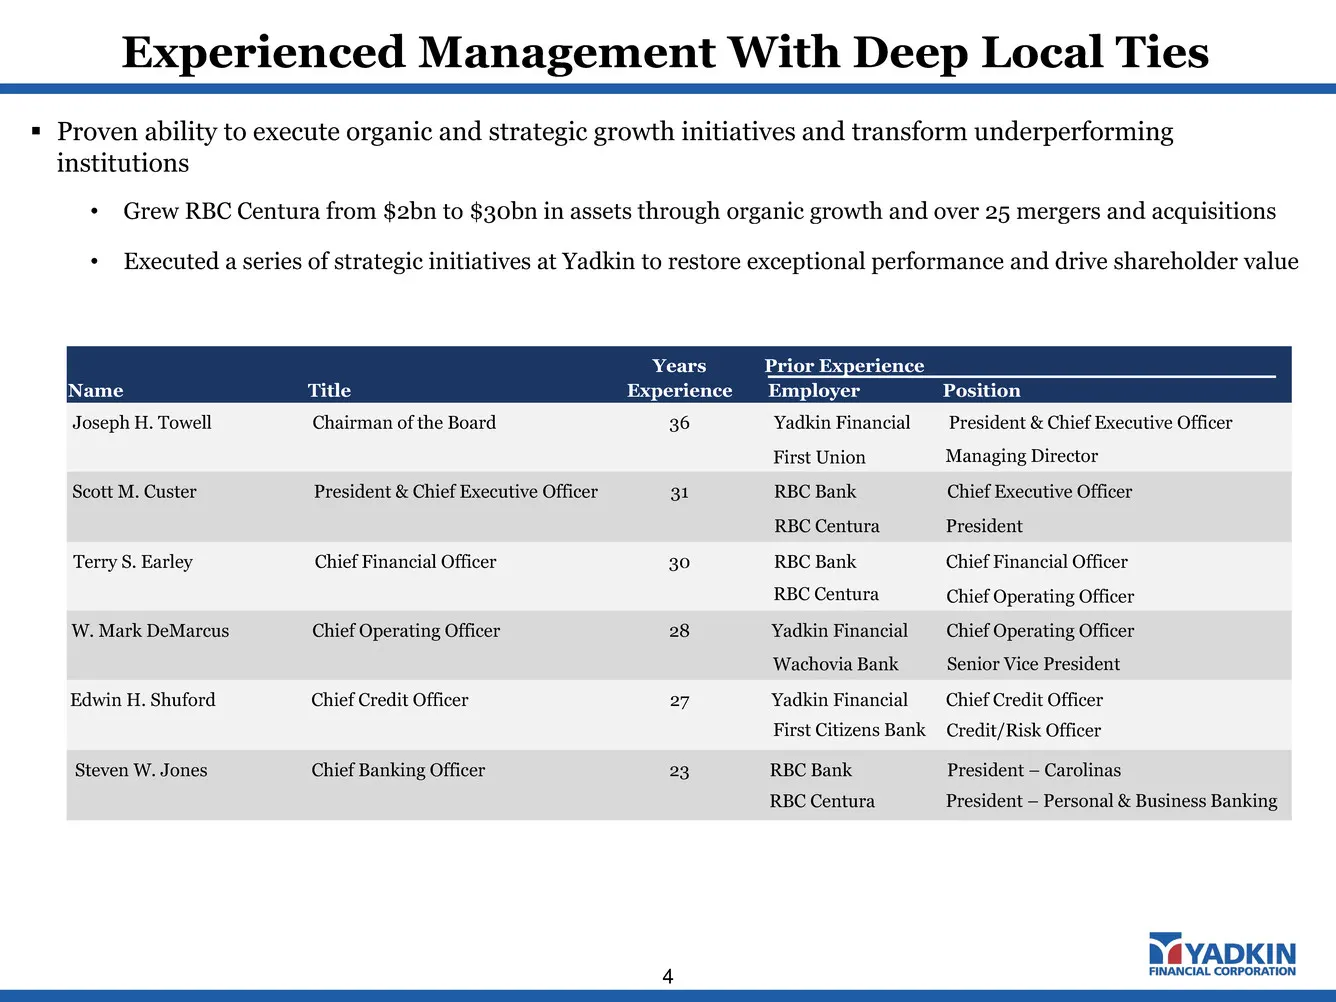
Experienced Management With Deep Local Ties 4 Proven ability to execute organic and strategic growth initiatives and transform underperforming institutions • Grew RBC Centura from $2bn to $30bn in assets through organic growth and over 25 mergers and acquisitions • Executed a series of strategic i
Slide 5: Growth Markets: Population
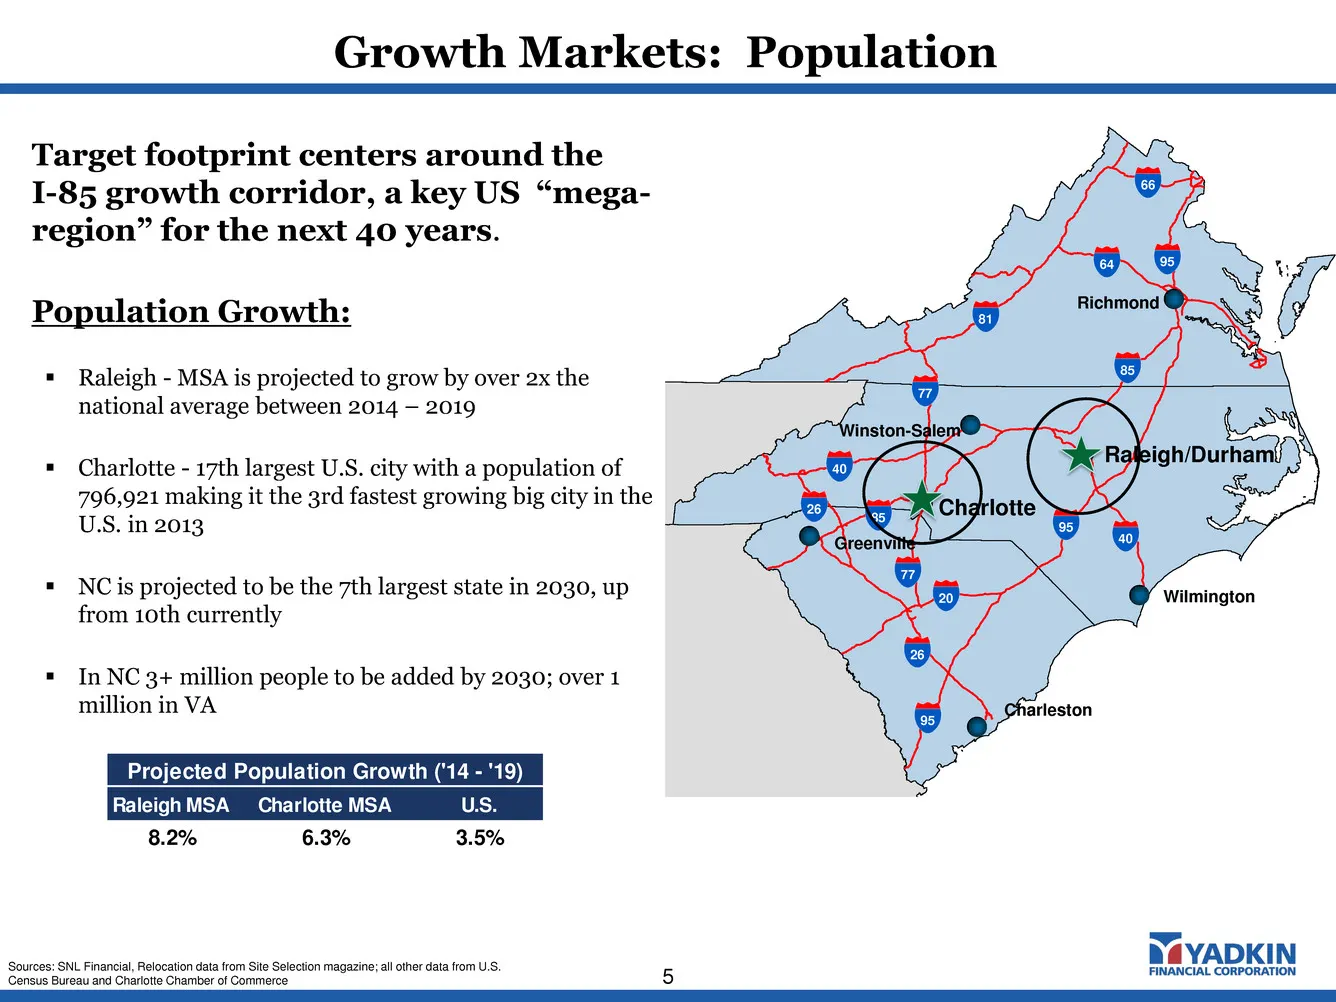
Growth Markets: Population 5 Target footprint centers around the I-85 growth corridor, a key US “mega- region” for the next 40 years. Population Growth: Raleigh - MSA is projected to grow by over 2x the national average between 2014 – 2019 Charlotte - 17th largest U.S. city with a population of
Slide 6: Growth Markets: Business Climate
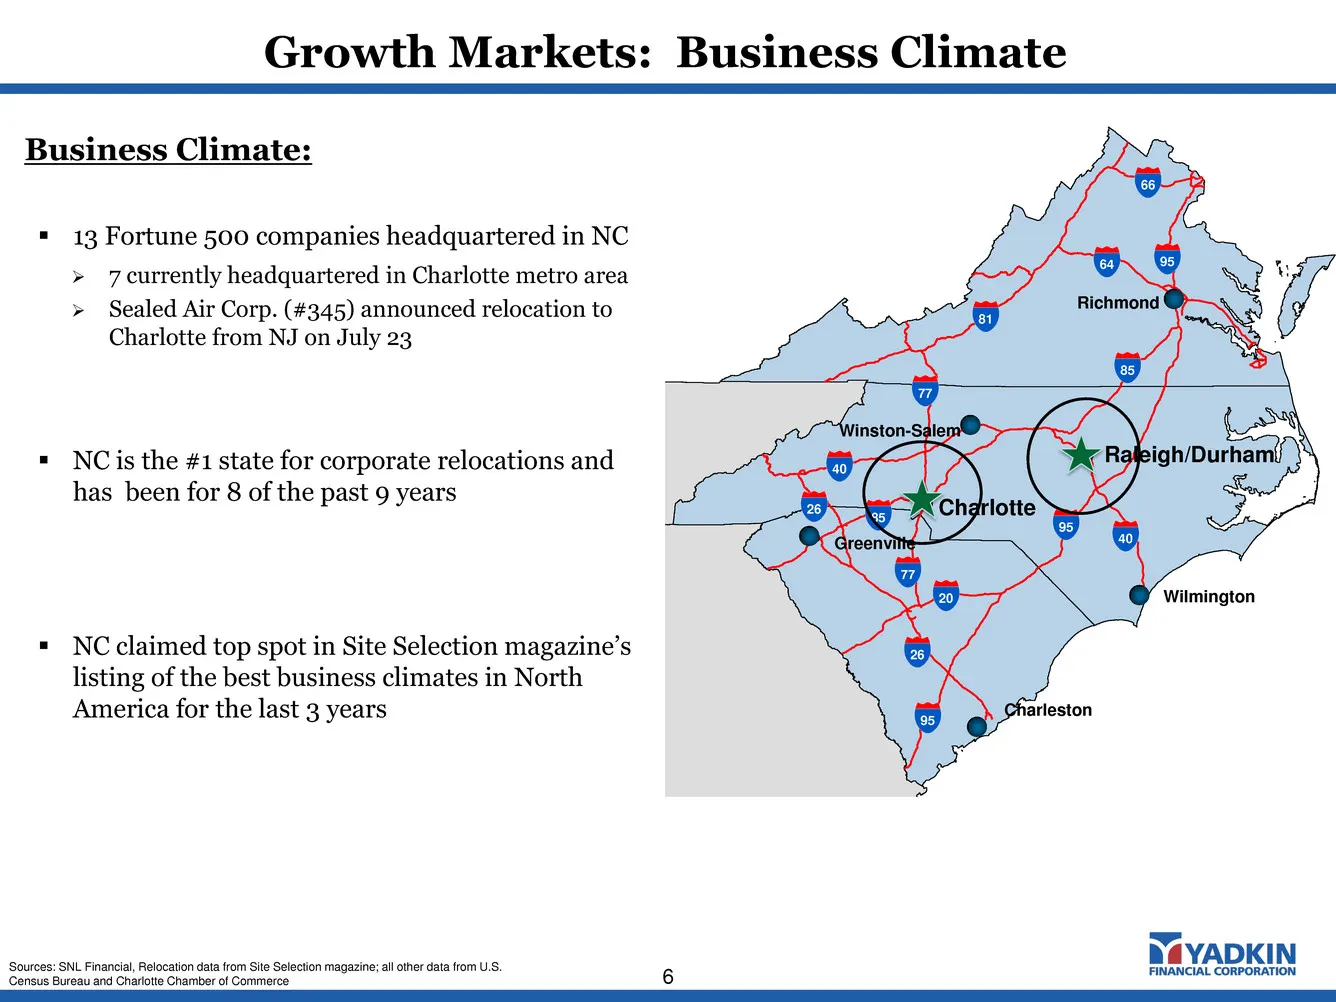
Growth Markets: Business Climate 6 438430_1.WOR Richmond Winston-Salem Greenville Wilmington 20 81 64 66 95 95 85 77 40 40 85 26 77 95 26 Charleston Raleigh/Durham Charlotte Business Climate: 13 Fortune 500 companies headquartered in NC 7 currently headquartered in Charlotte metro area Sealed
Slide 7: Positive Business Momentum
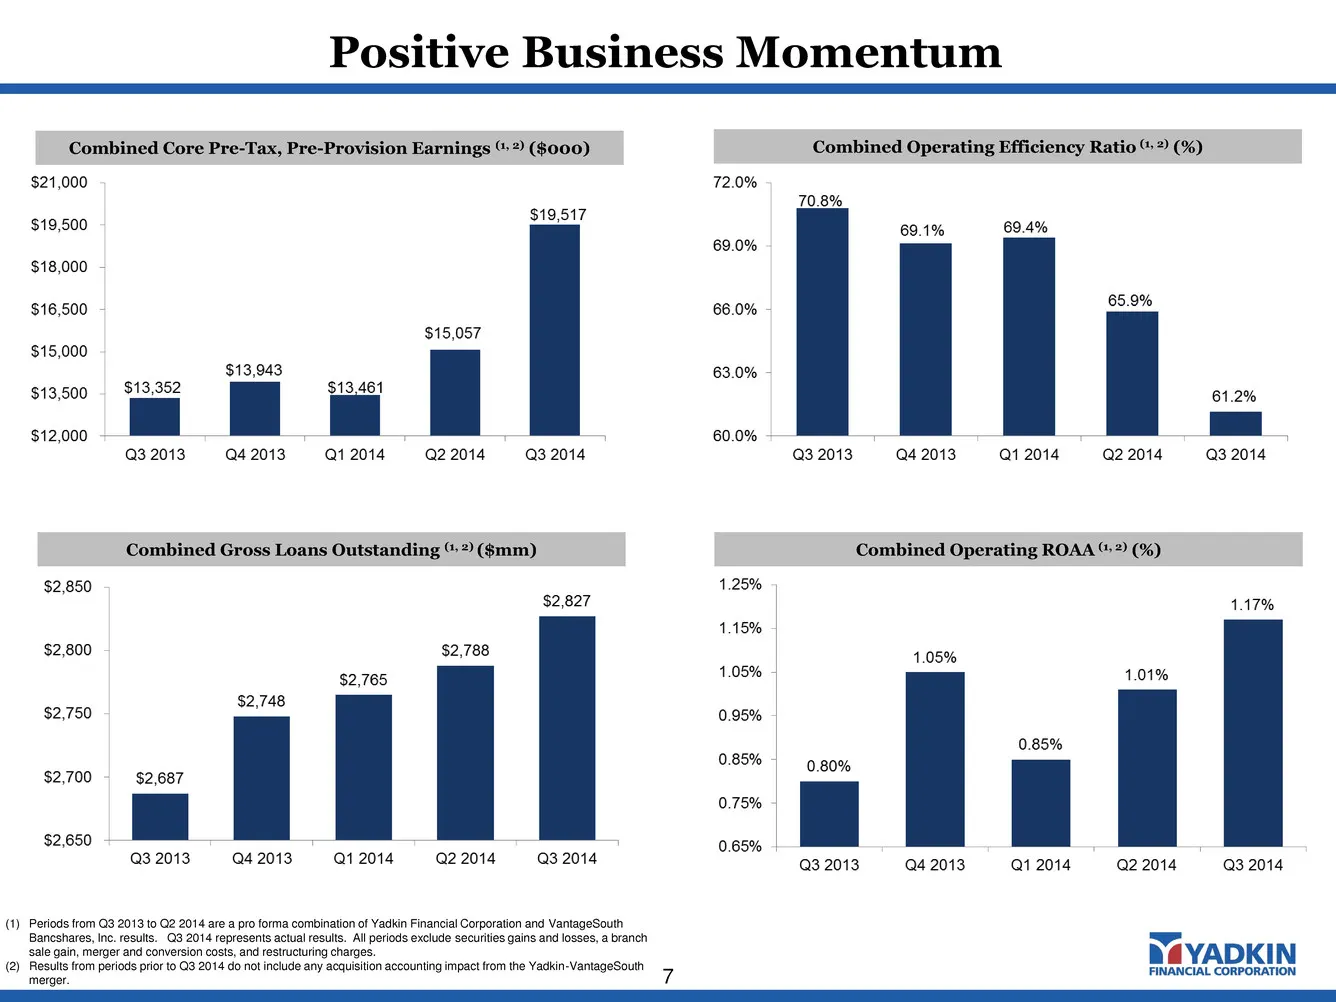
Positive Business Momentum 7 Combined Core Pre-Tax, Pre-Provision Earnings (1, 2) ($000) Combined Operating Efficiency Ratio (1, 2) (%) Combined Gross Loans Outstanding (1, 2) ($mm) Combined Operating ROAA (1, 2) (%) (1) Periods from Q3 2013 to Q2 2014 are a pro forma combination of Yadkin Financial
Slide 8: Diversified Business Lines
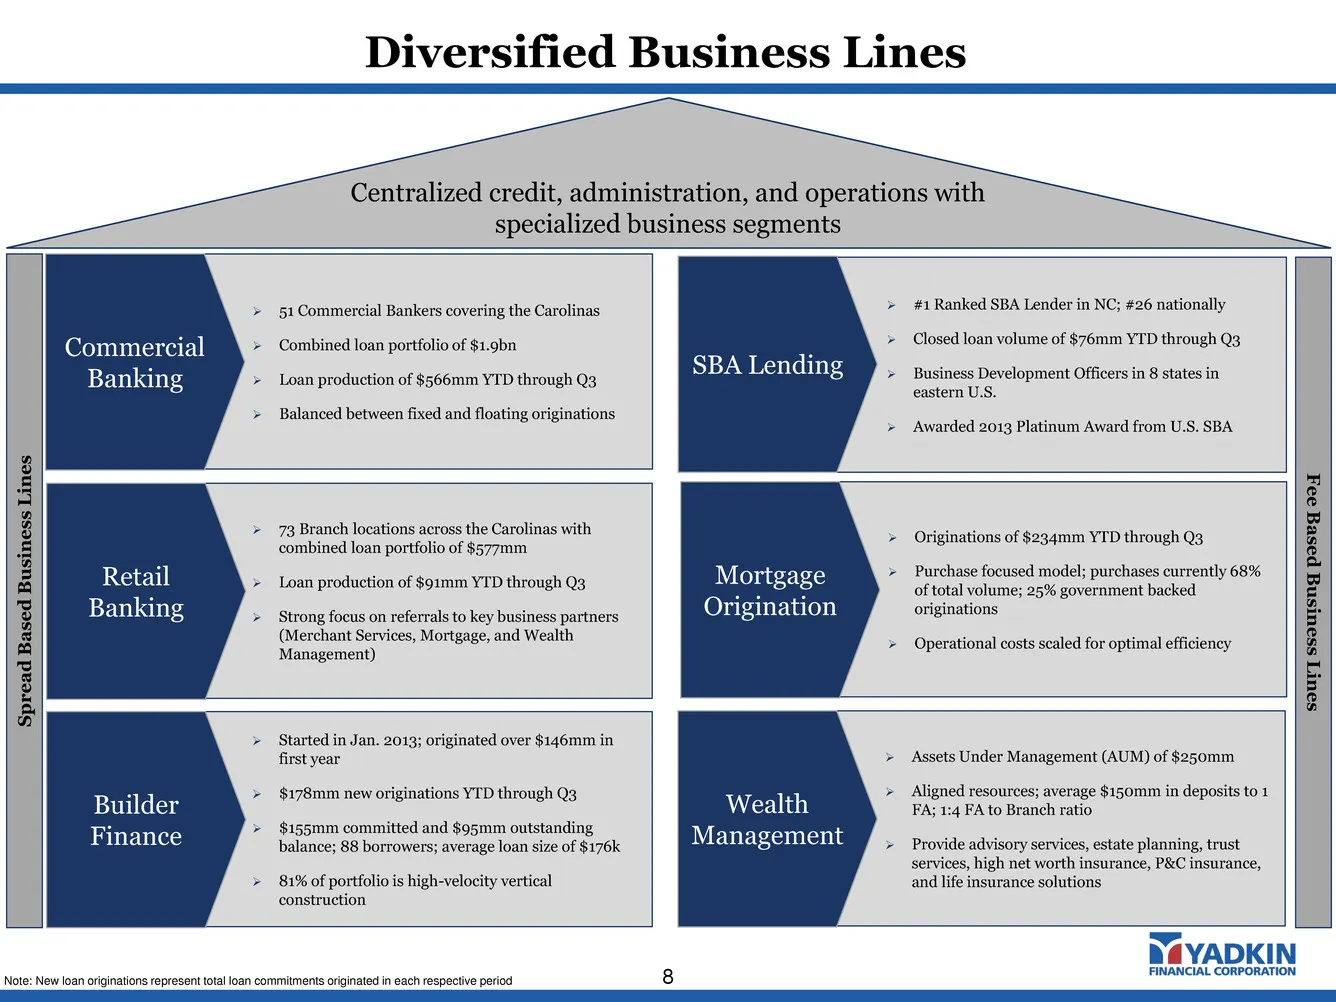
Diversified Business Lines 8 Assets Under Management (AUM) of $250mm Aligned resources; average $150mm in deposits to 1 FA; 1:4 FA to Branch ratio Provide advisory services, estate planning, trust services, high net worth insurance, P&C insurance, and life insurance solutions Originations of
Slide 9: Q3 2014 Results Highlights
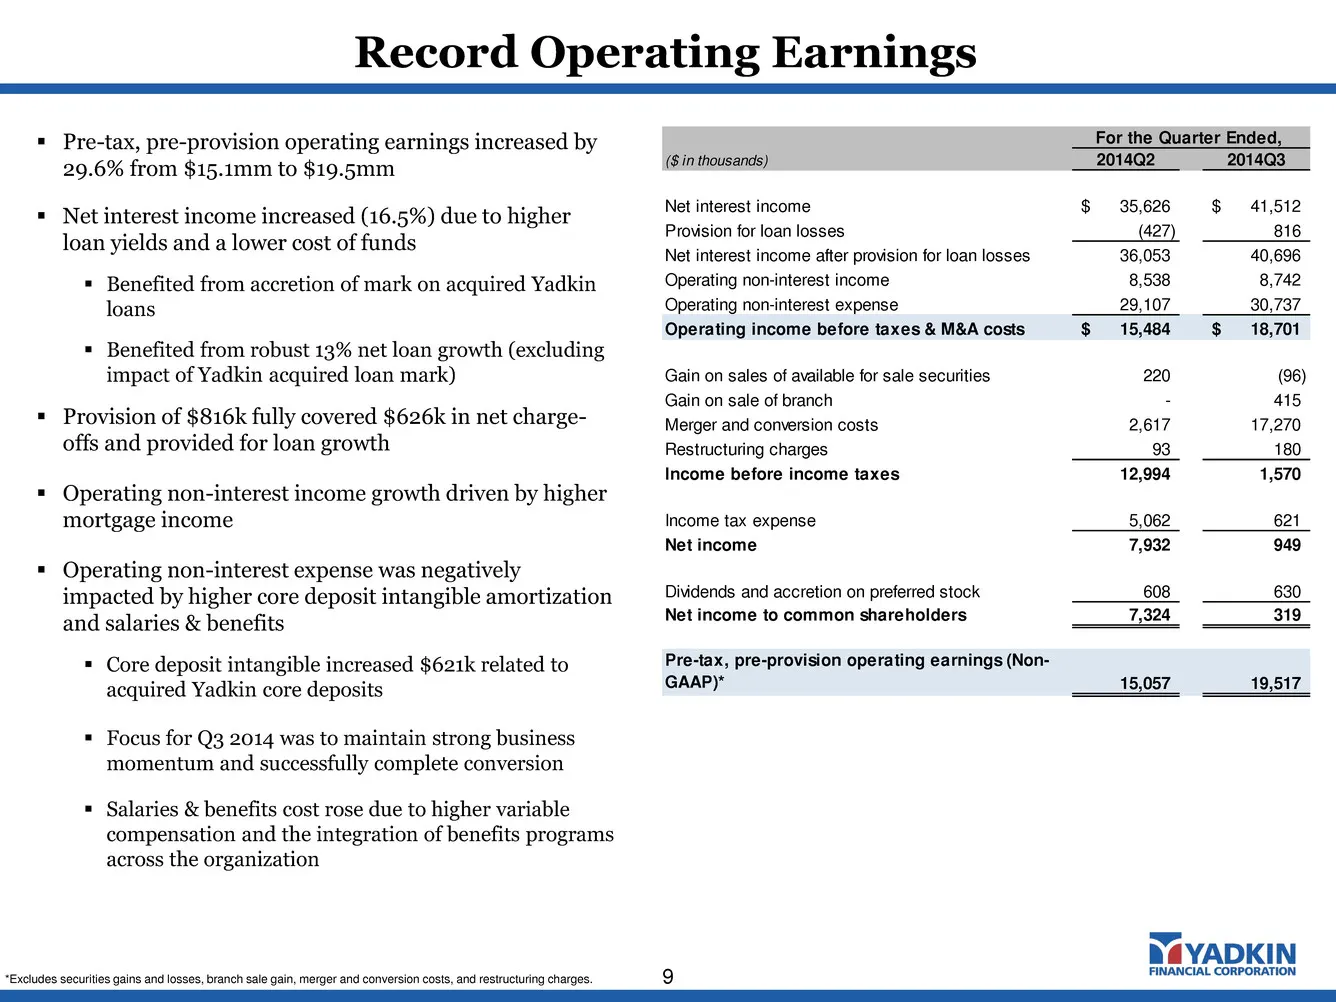
Pre-tax, pre-provision operating earnings increased by 29.6% from $15.1mm to $19.5mm Net interest income increased (16.5%) due to higher loan yields and a lower cost of funds Benefited from accretion of mark on acquired Yadkin loans Benefited from robust 13% net loan growth (excluding impact
Slide 10: Net Interest Income
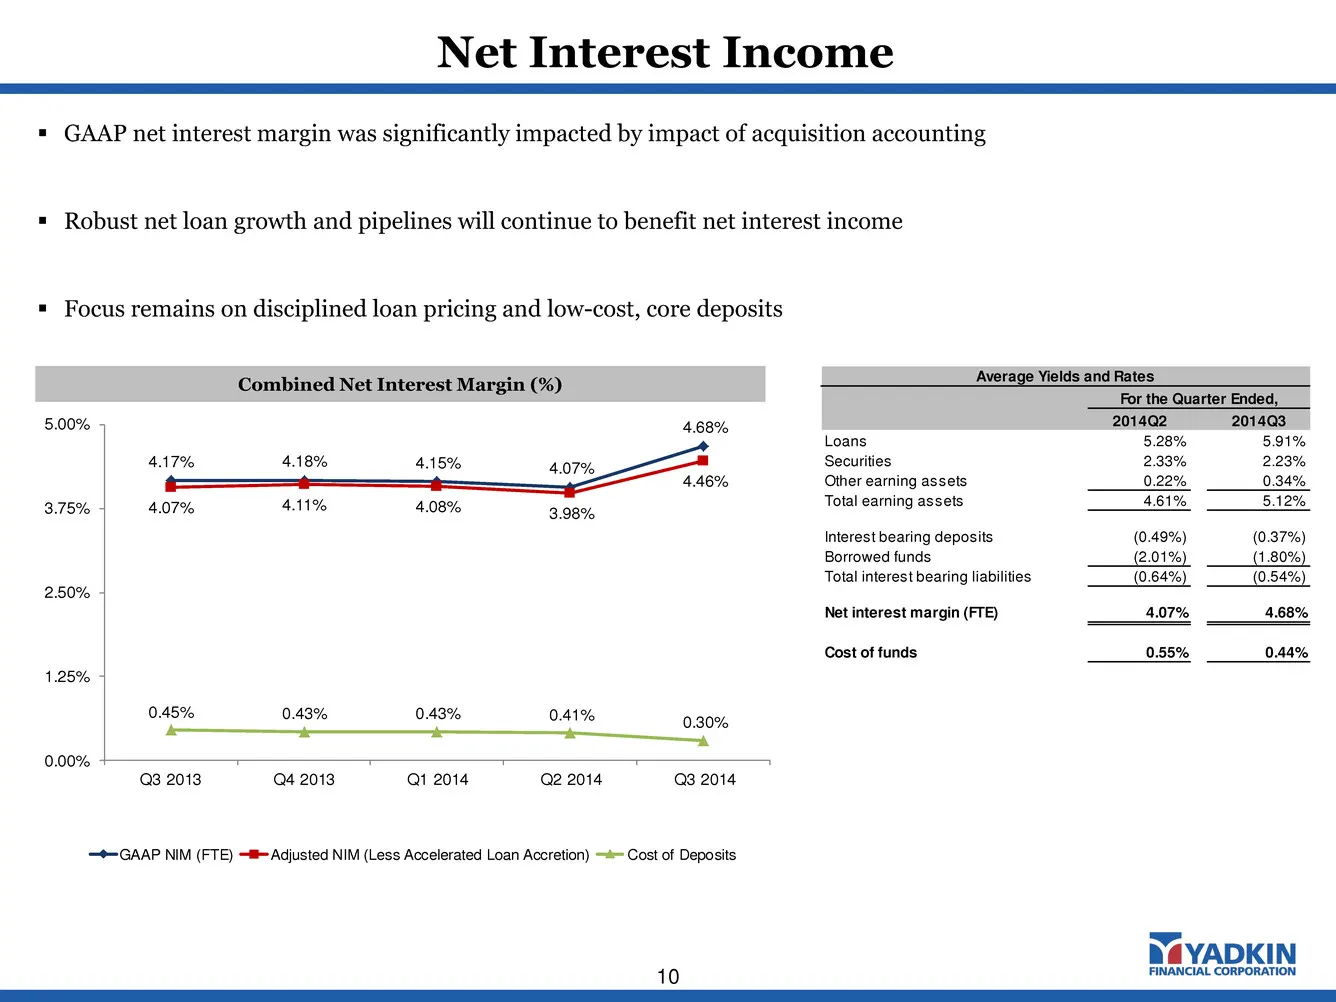
Net Interest Income 10 4.17% 4.18% 4.15% 4.07% 4.68% 4.07% 4.11% 4.08% 3.98% 4.46% 0.45% 0.43% 0.43% 0.41% 0.30% 0.00% 1.25% 2.50% 3.75% 5.00% Q3 2013 Q4 2013 Q1 2014 Q2 2014 Q3 2014 GAAP NIM (FTE) Adjusted NIM (Less Accelerated Loan Accretion) Cost of Deposits Combined Net Interest Margin (%) GAA
Slide 11: Diverse Drivers of Non-Interest Income Growth
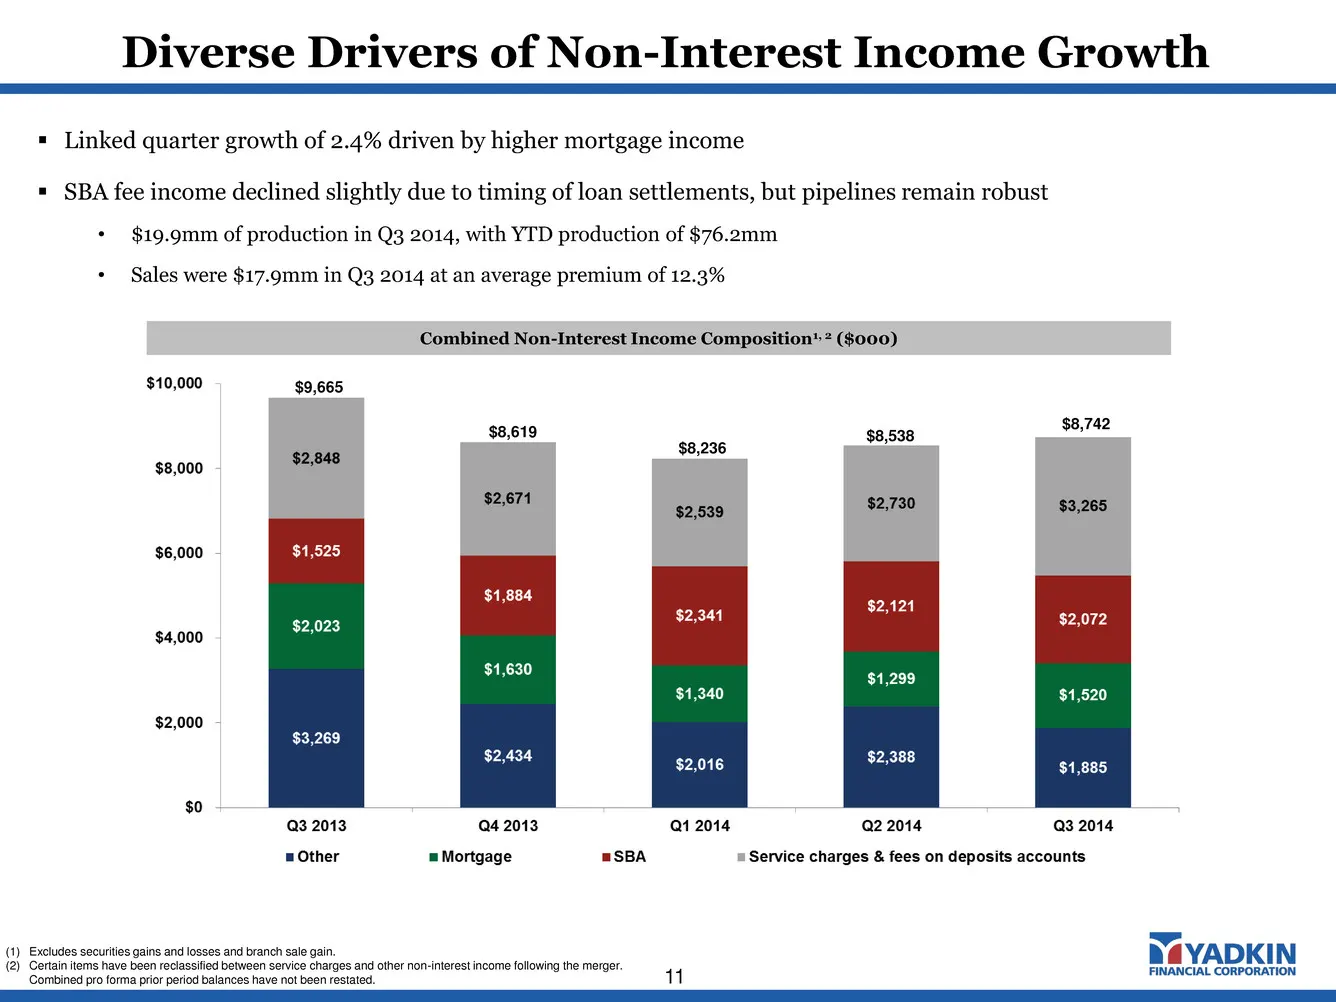
Diverse Drivers of Non-Interest Income Growth 11 Combined Non-Interest Income Composition1, 2 ($000) $8,619 $9,665 $8,236 $8,538 Linked quarter growth of 2.4% driven by higher mortgage income SBA fee income declined slightly due to timing of loan settlements, but pipelines remain robust • $19.9m
Slide 12: Non-Interest Expense
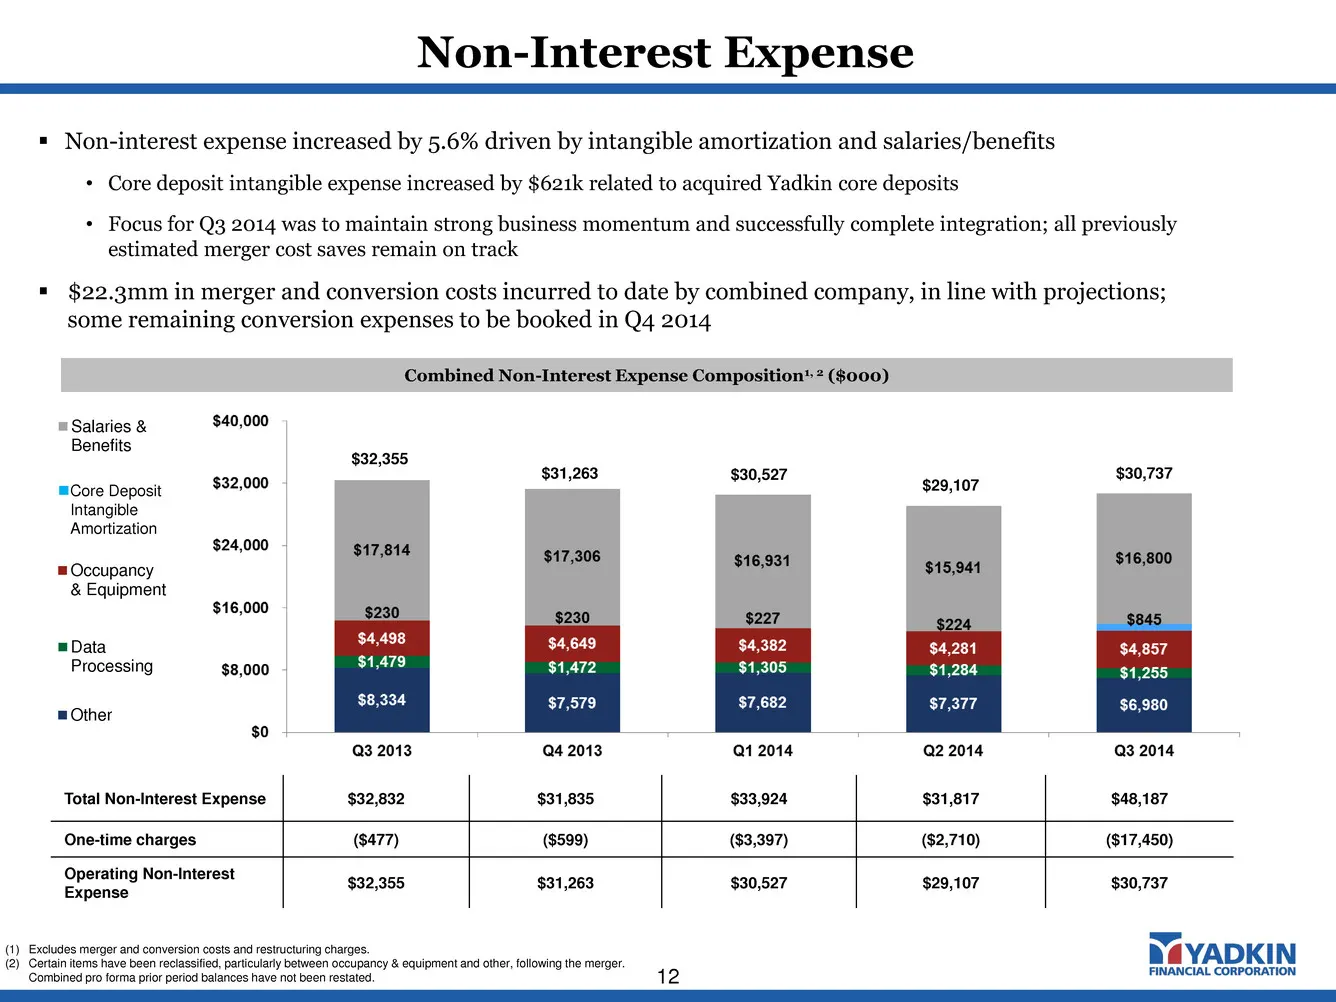
Non-Interest Expense 12 Combined Non-Interest Expense Composition1, 2 ($000) Non-interest expense increased by 5.6% driven by intangible amortization and salaries/benefits • Core deposit intangible expense increased by $621k related to acquired Yadkin core deposits • Focus for Q3 2014 was to maint
Slide 13: Conservative Balance Sheet
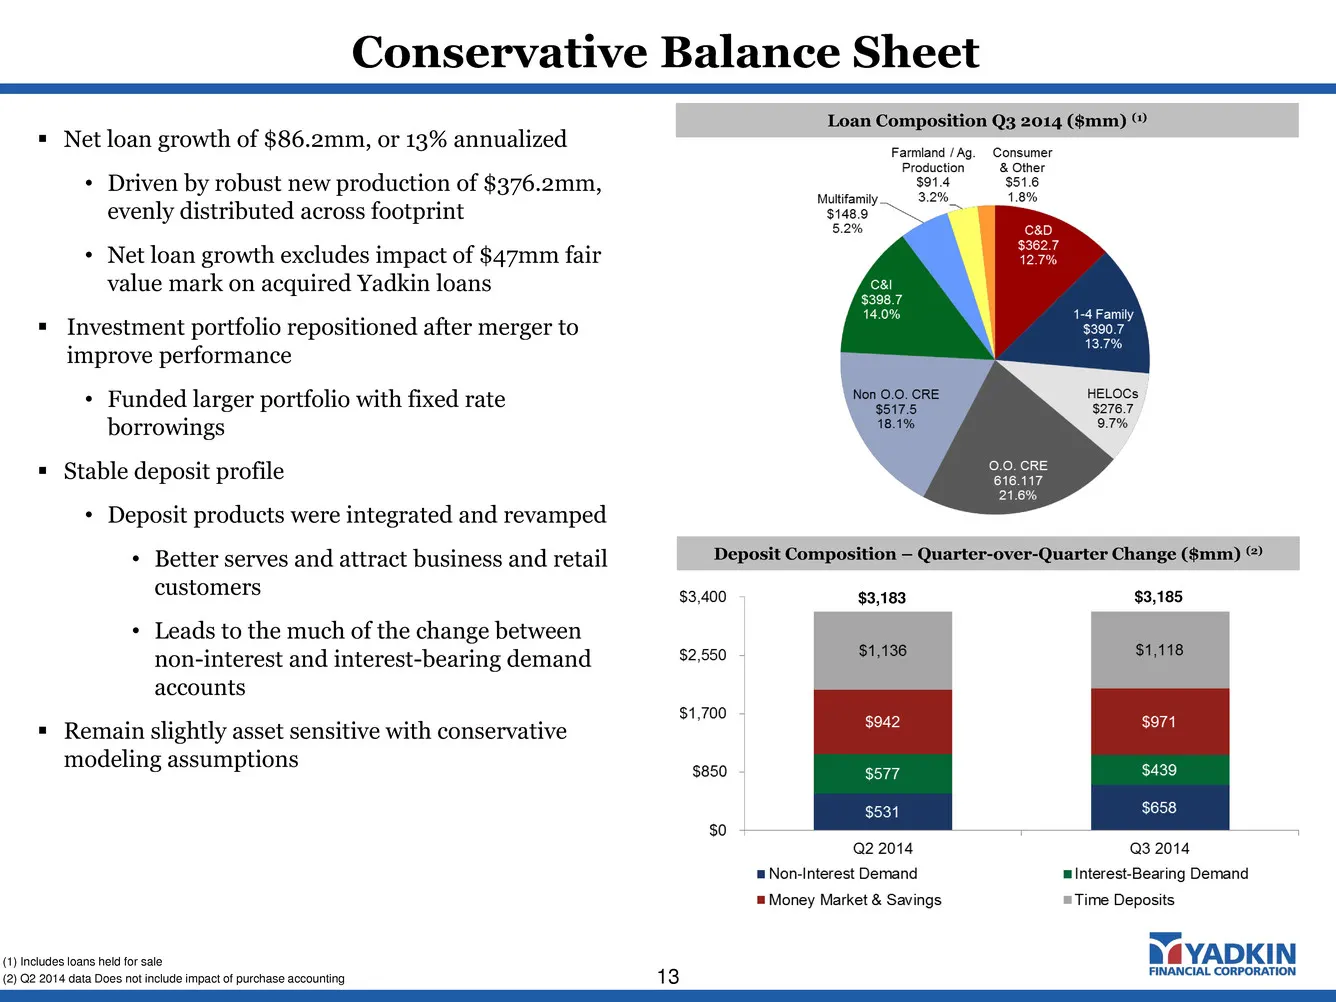
Conservative Balance Sheet 13 Deposit Composition – Quarter-over-Quarter Change ($mm) (2) Loan Composition Q3 2014 ($mm) (1) $3,183 $3,185 Net loan growth of $86.2mm, or 13% annualized • Driven by robust new production of $376.2mm, evenly distributed across footprint • Net loan growth excludes imp
Slide 14: Strong Capital Position
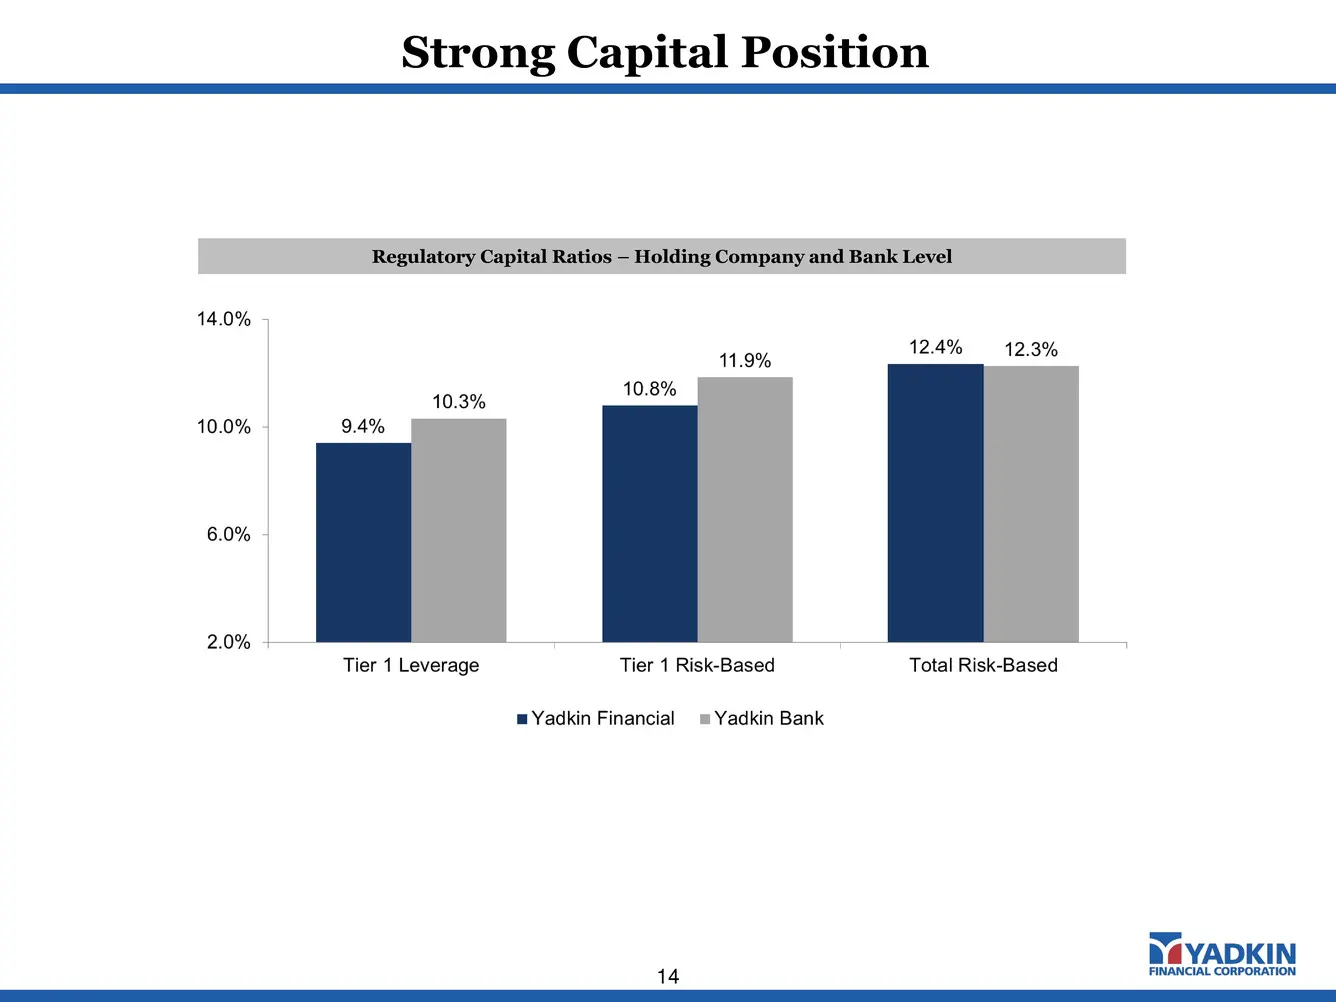
Strong Capital Position 14 Regulatory Capital Ratios – Holding Company and Bank Level
Slide 15: Asset Quality Improving
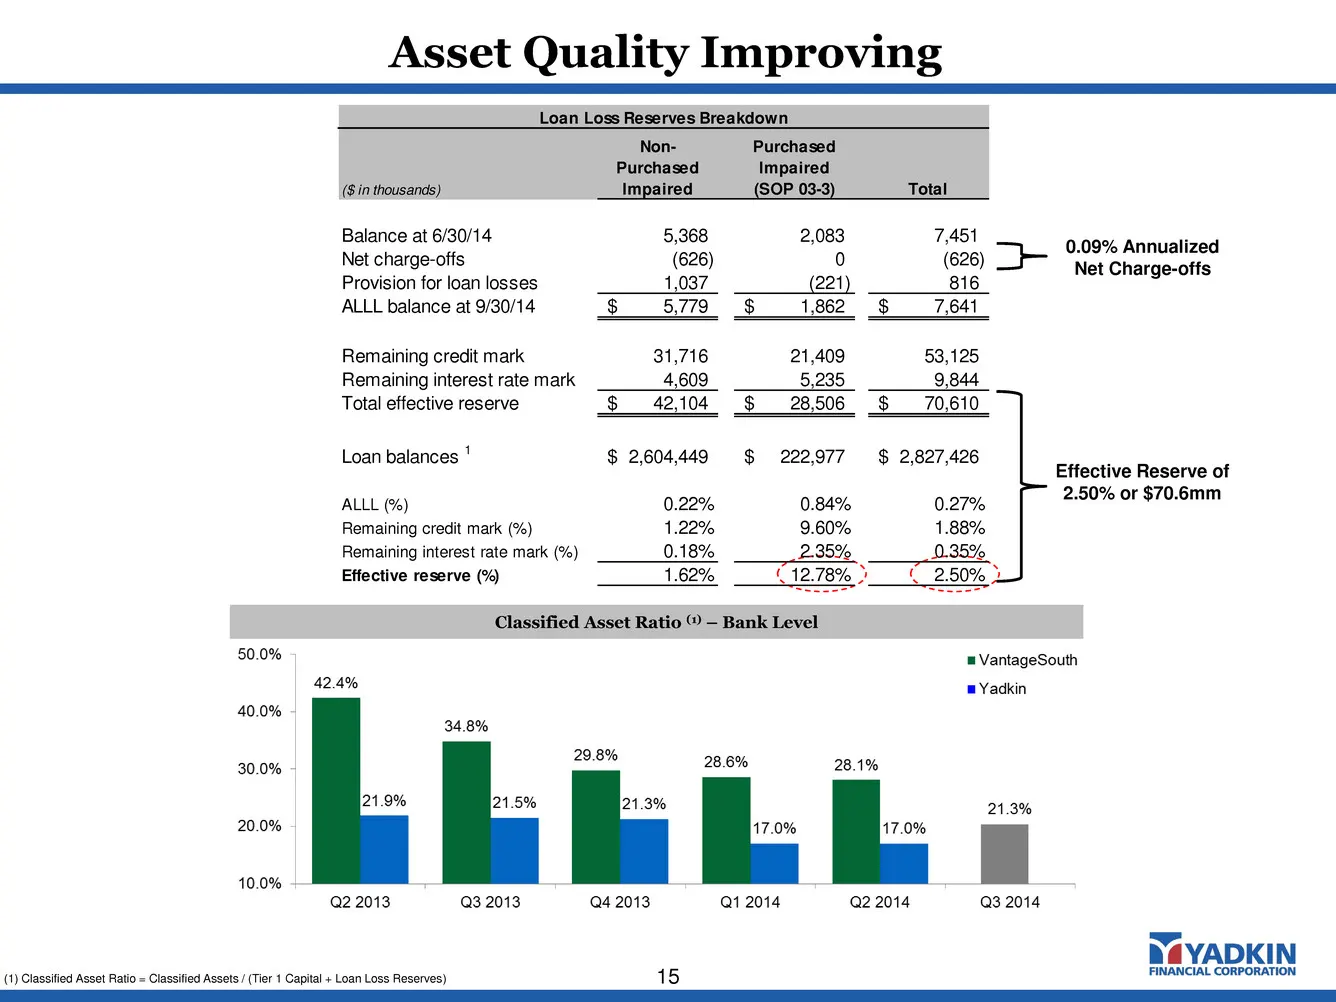
Asset Quality Improving 15 Effective Reserve of 2.50% or $70.6mm Classified Asset Ratio (1) – Bank Level (1) Classified Asset Ratio = Classified Assets / (Tier 1 Capital + Loan Loss Reserves) Loan Loss Reserves Breakdown ($ in thousands) Non- Purchased Impaired Purchased Impaired (SOP 03-3) Total Ba
Slide 16: Key Financial Targets
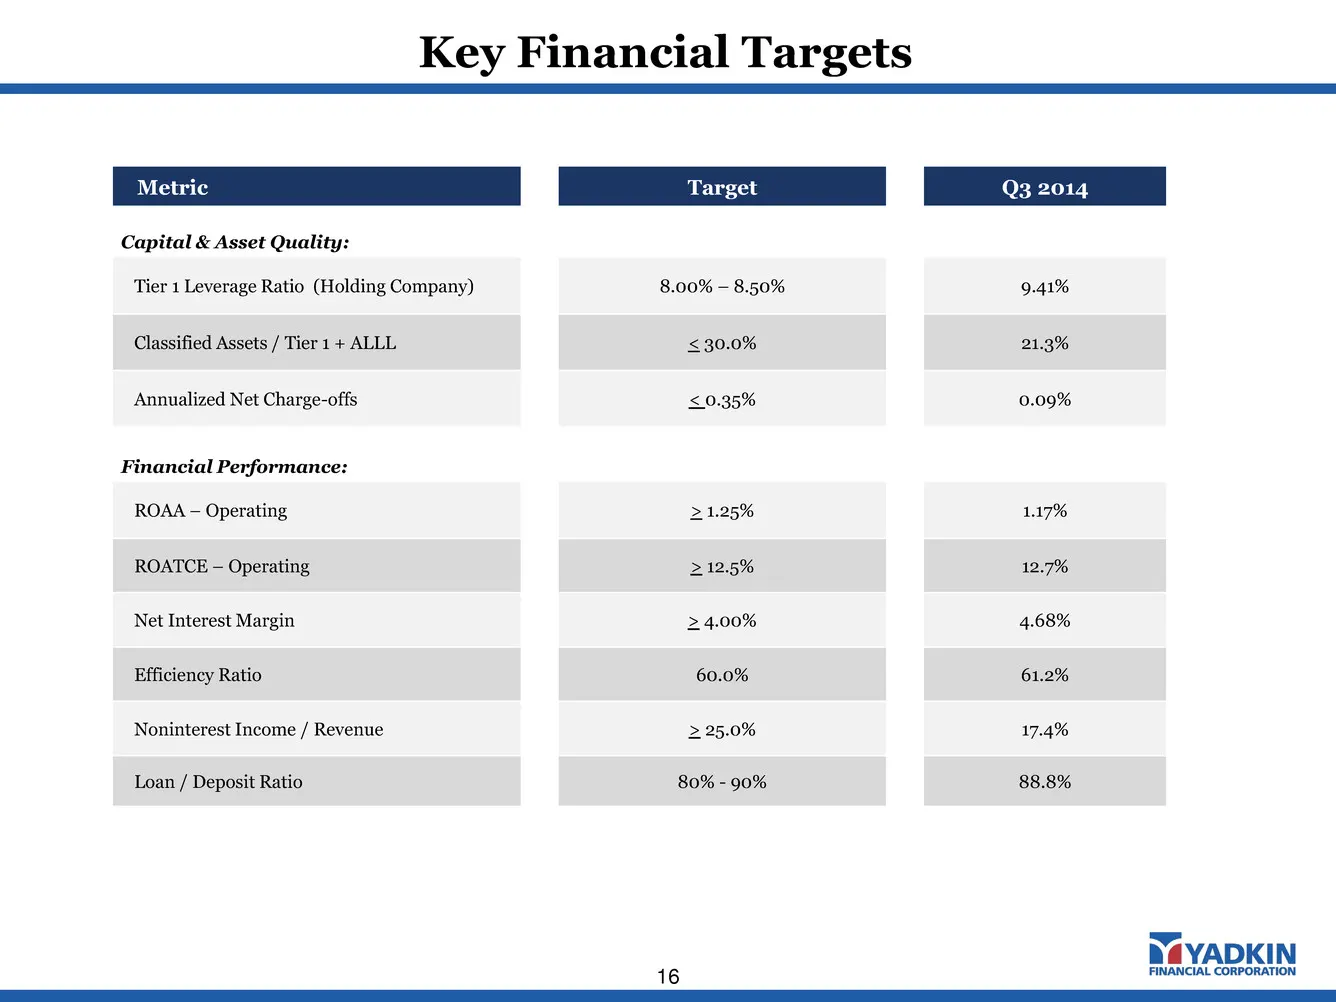
Key Financial Targets 16 Metric Target Q3 2014 Capital & Asset Quality: Tier 1 Leverage Ratio (Holding Company) 8.00% – 8.50% 9.41% Classified Assets / Tier 1 + ALLL < 30.0% 21.3% Annualized Net Charge-offs < 0.35% 0.09% Financial Performance: ROAA – Operating > 1.25% 1.17% ROATCE – Operating > 12.5
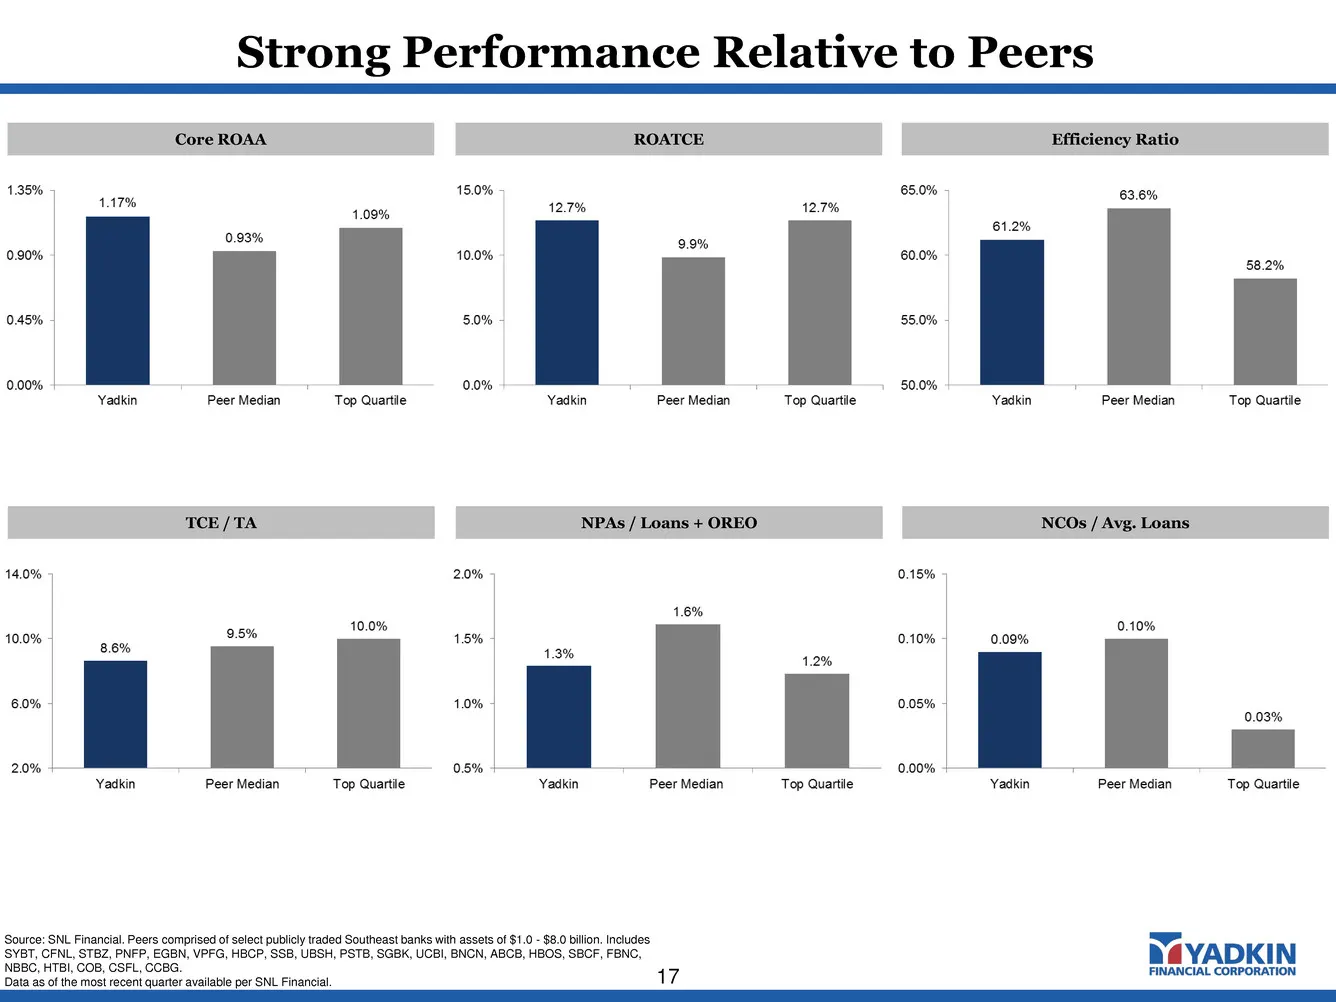
Slide 17: Strong Performance Relative to Peers
Strong Performance Relative to Peers 17 Core ROAA ROATCE Efficiency Ratio TCE / TA NPAs / Loans + OREO NCOs / Avg. Loans Source: SNL Financial. Peers comprised of select publicly traded Southeast banks with assets of $1.0 - $8.0 billion. Includes SYBT, CFNL, STBZ, PNFP, EGBN, VPFG, HBCP, SSB, UBSH,
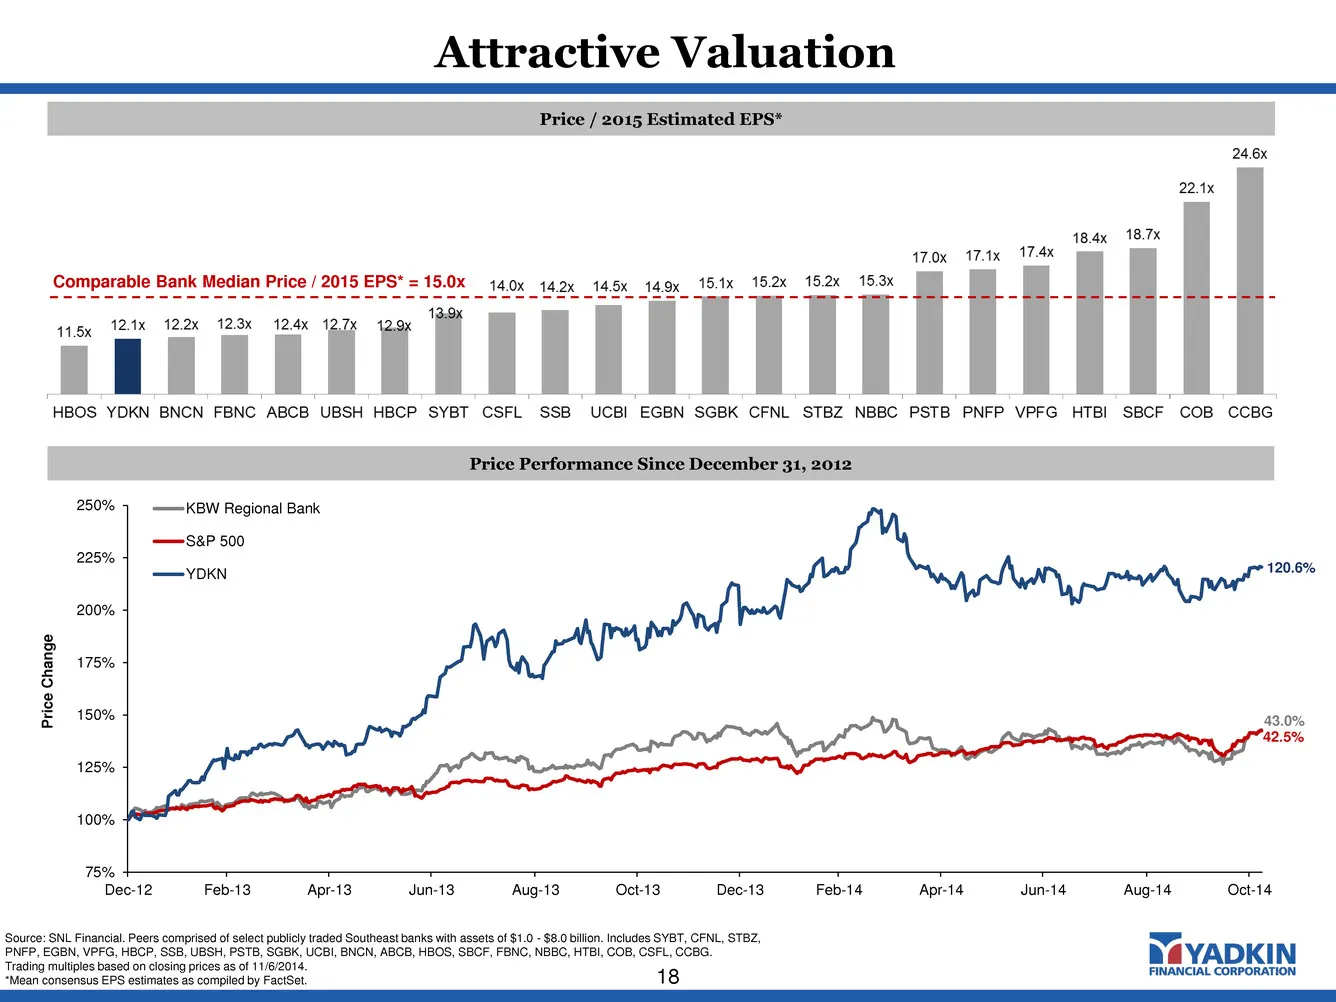
Slide 18: Attractive Valuation
75% 100% 125% 150% 175% 200% 225% 250% Dec-12 Feb-13 Apr-13 Jun-13 Aug-13 Oct-13 Dec-13 Feb-14 Apr-14 Jun-14 Aug-14 Oct-14 Pric e C han ge KBW Regional Bank S&P 500 YDKN Attractive Valuation 18 Price Performance Since December 31, 2012 Price / 2015 Estimated EPS* Comparable Bank Median Price / 2015

Slide 19: Contact: Terry Earley
Contact: Terry Earley (919) 659-9015 terry.earley@yadkinbank.com
Source: SEC EDGAR · 8-K filed Nov 13, 2014
More decks from Yadkin Financial Corp
 Merger or Acquisition (August 2016)38 slides · Aug 16, 2016
 Merger or Acquisition (July 2016)20 slides · Jul 21, 2016
 Gulf South Bank Conference 201624 slides · May 2, 2016
 Q1 2016 Earnings Presentation10 slides · Apr 21, 2016
 Q4 2015 Earnings Presentation13 slides · Jan 28, 2016
 Q3 2015 Earnings Presentation29 slides · Nov 10, 2015