Yadkin Financial — Merger or Acquisition (July 2016)
20 slides from Yadkin Financial's merger presentation, Jul 21, 2016
Slide 1: F.N.B. Corporation Announces Agreement to Acquire Yadkin Financial Corporation
F.N.B. Corporation Announces Agreement to Acquire Yadkin Financial Corporation July 21, 2016 Exhibit 99.2
Slide 2: Cautionary Statement Regarding Forward-Looking Information and Non-GAAP Financial Information
Cautionary Statement Regarding Forward-Looking Information and Non-GAAP Financial Information This presentation contains "forward-looking statements" within the meaning of the Private Securities Litigation Reform Act, relating to present or future trends or factors affecting the banking industry and
Slide 3: Compelling Strategic and Financial Rationale
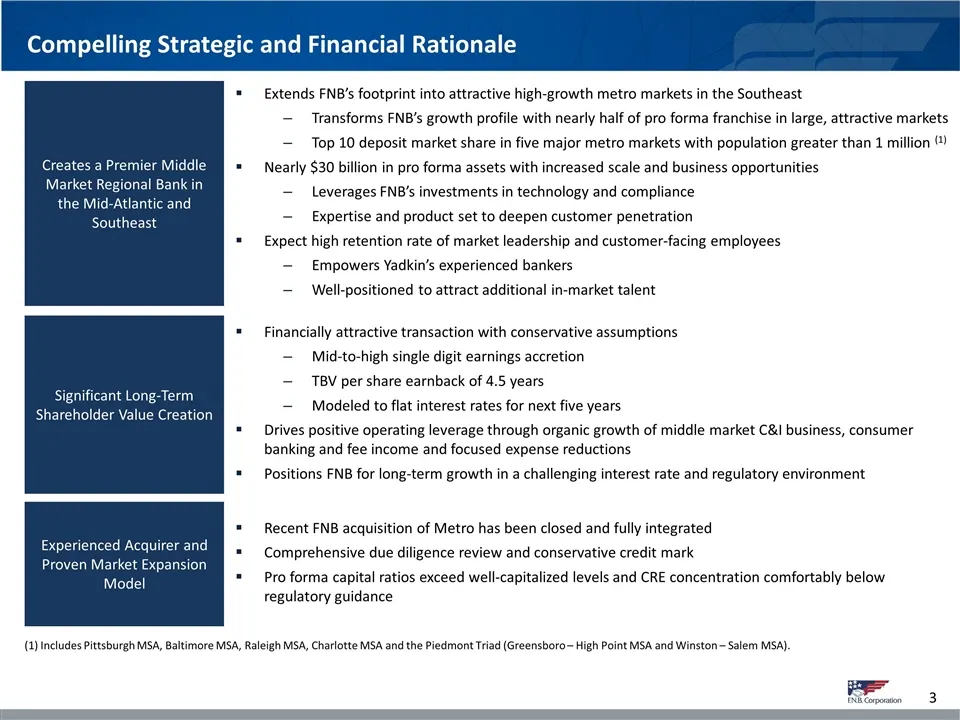
Compelling Strategic and Financial Rationale Extends FNB’s footprint into attractive high-growth metro markets in the Southeast Transforms FNB’s growth profile with nearly half of pro forma franchise in large, attractive markets Top 10 deposit market share in five major metro markets with population
Slide 4: North Carolina – A Robust Banking Market, Well-Positioned For Growth
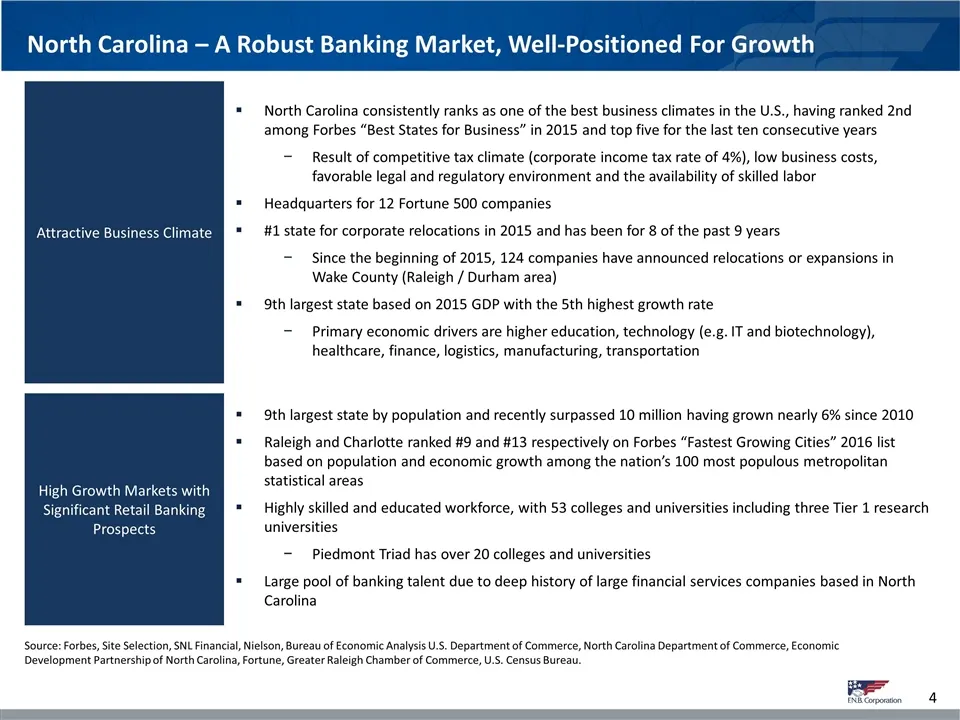
North Carolina – A Robust Banking Market, Well-Positioned For Growth North Carolina consistently ranks as one of the best business climates in the U.S., having ranked 2nd among Forbes “Best States for Business” in 2015 and top five for the last ten consecutive years Result of competitive tax climate
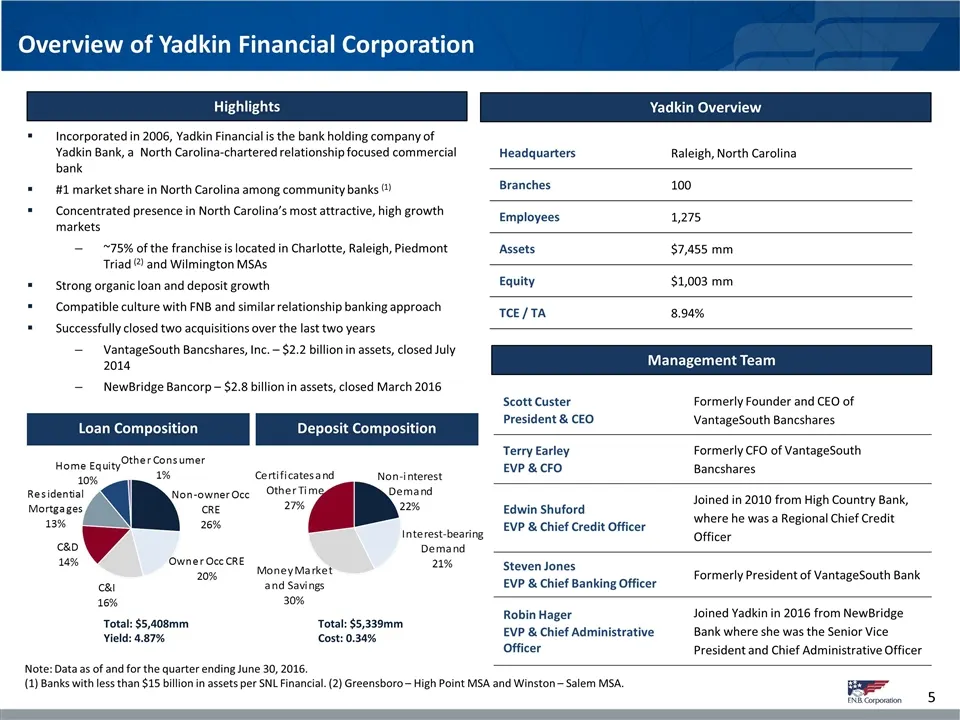
Slide 5: Overview of Yadkin Financial Corporation
Scott Custer President & CEO Formerly Founder and CEO of VantageSouth Bancshares Terry Earley EVP & CFO Formerly CFO of VantageSouth Bancshares Edwin Shuford EVP & Chief Credit Officer Joined in 2010 from High Country Bank, where he was a Regional Chief Credit Officer Steven Jones EVP & Chief Bankin
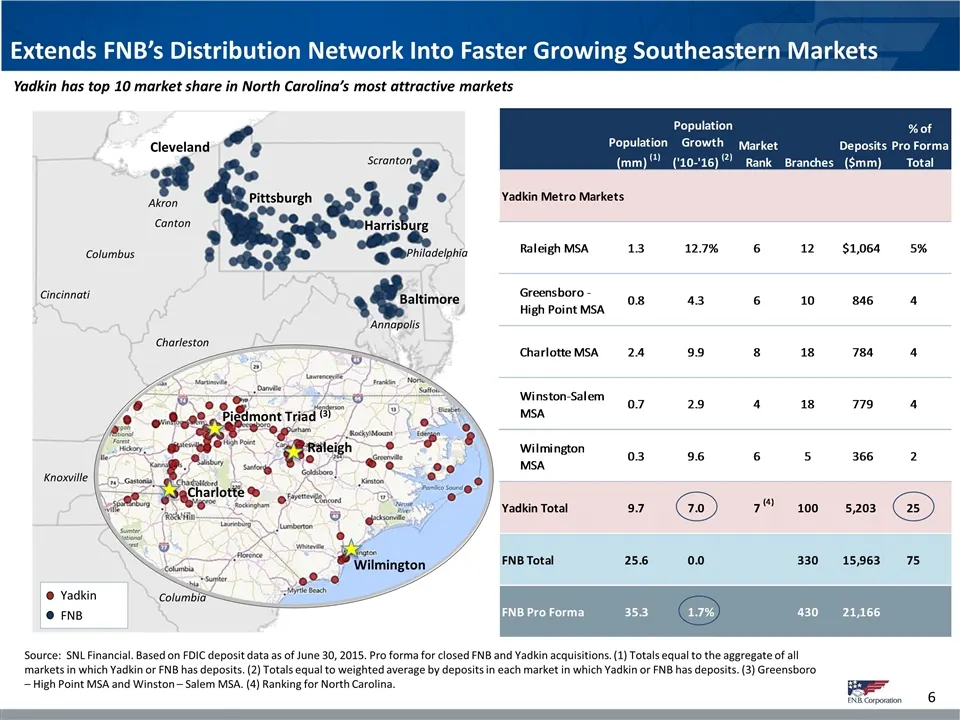
Slide 6: Yadkin has top market share in North Carolina's most attractive markets
Yadkin FNB Cleveland Pittsburgh Baltimore Yadkin has top 10 market share in North Carolina’s most attractive markets Extends FNB’s Distribution Network Into Faster Growing Southeastern Markets Source: SNL Financial. Based on FDIC deposit data as of June 30, 2015. Pro forma for closed FNB and Yadkin
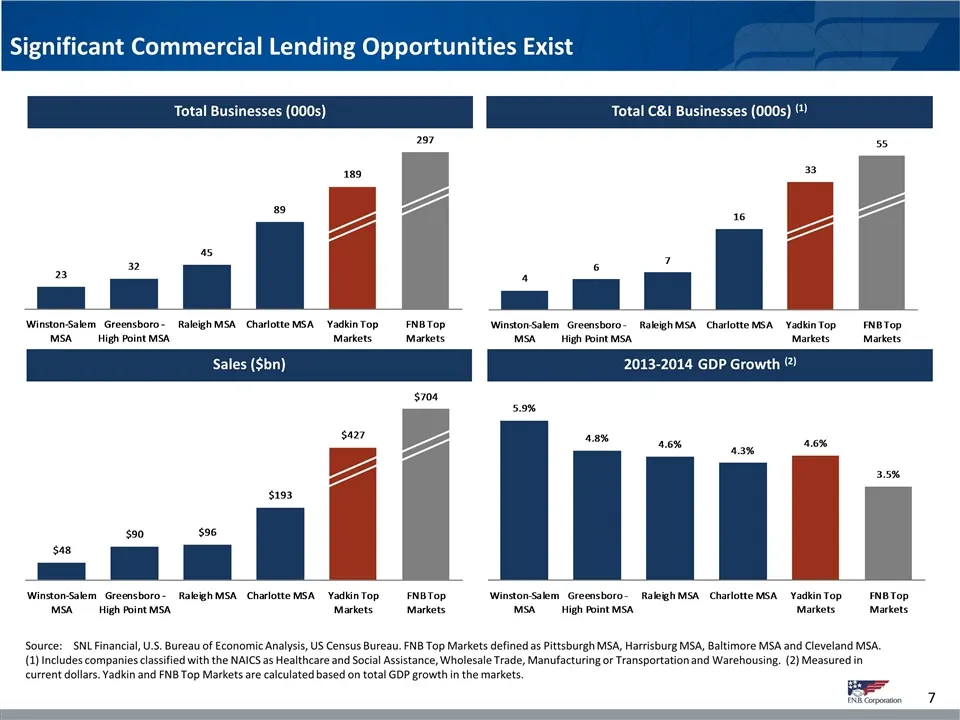
Slide 7: Significant Commercial Lending Opportunities Exist
Significant Commercial Lending Opportunities Exist Total C&I Businesses (000s) (1) Total Businesses (000s) 2013-2014 GDP Growth (2) Sales ($bn) Source:SNL Financial, U.S. Bureau of Economic Analysis, US Census Bureau. FNB Top Markets defined as Pittsburgh MSA, Harrisburg MSA, Baltimore MSA and Cleve
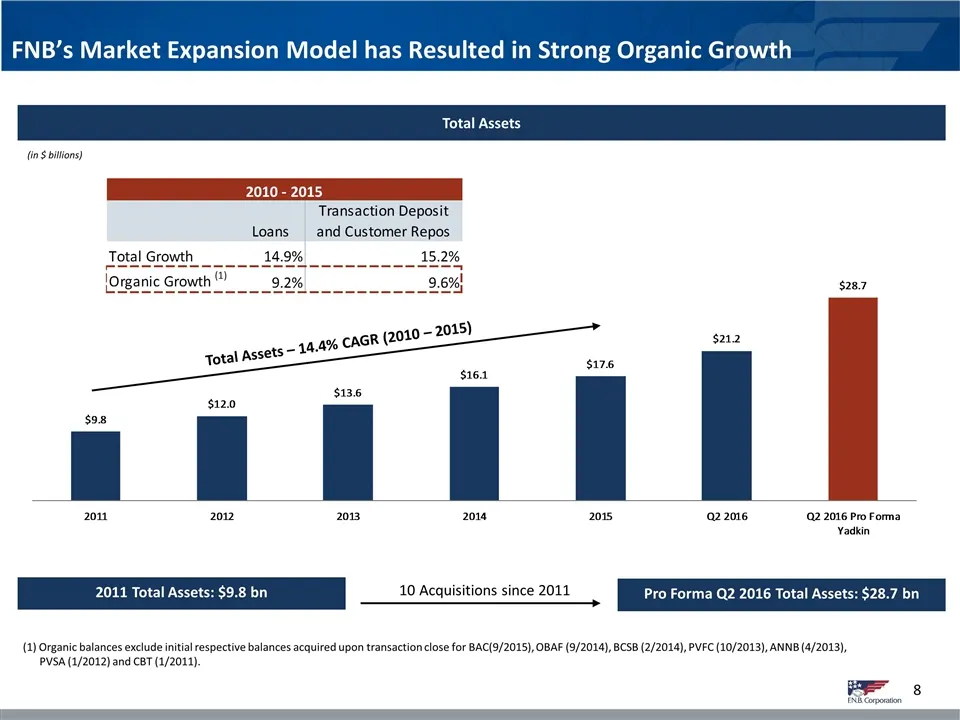
Slide 8: FNB's Market Expansion Model has Resulted in Strong Organic Growth
FNB’s Market Expansion Model has Resulted in Strong Organic Growth 2011 Total Assets: $9.8 bn Pro Forma Q2 2016 Total Assets: $28.7 bn 10 Acquisitions since 2011 Total Assets (in $ billions) (1) Organic balances exclude initial respective balances acquired upon transaction close for BAC(9/2015), OBA
Slide 9: Enhanced Product Offering Positions Company For Future Revenue Growth
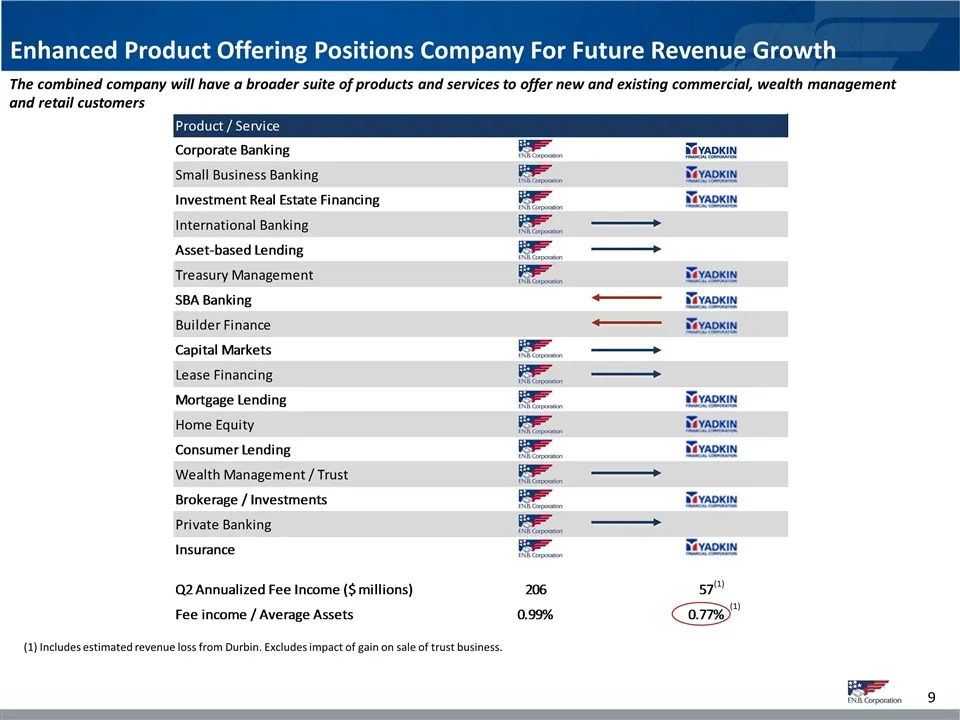
Enhanced Product Offering Positions Company For Future Revenue Growth The combined company will have a broader suite of products and services to offer new and existing commercial, wealth management and retail customers (1) Includes estimated revenue loss from Durbin. Excludes impact of gain on sale
Slide 10: Transaction Overview
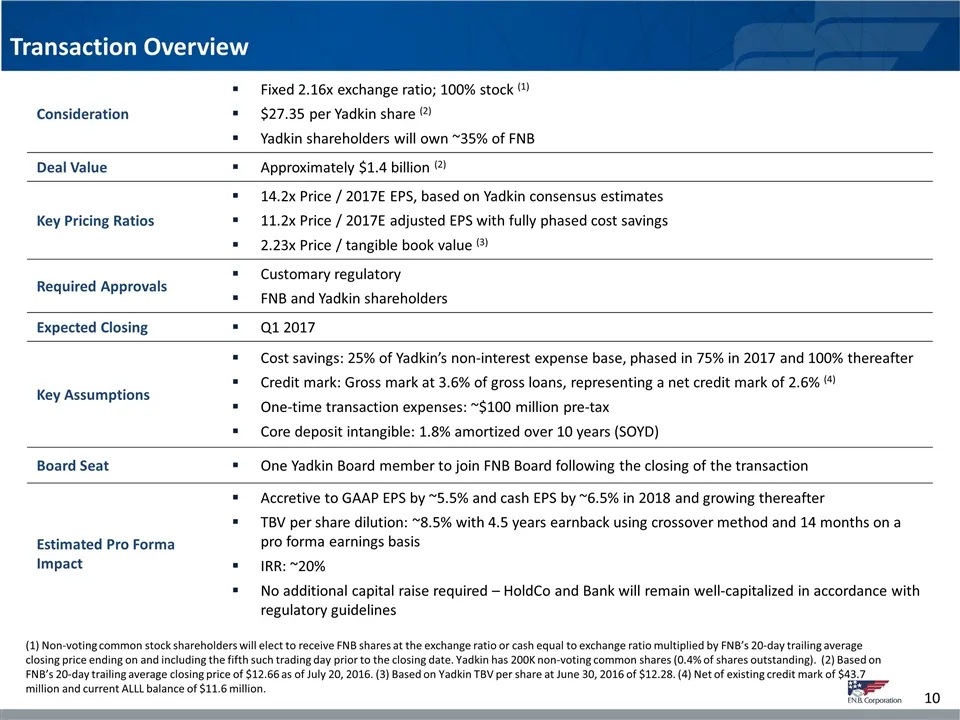
Transaction Overview (1) Non-voting common stock shareholders will elect to receive FNB shares at the exchange ratio or cash equal to exchange ratio multiplied by FNB’s 20-day trailing average closing price ending on and including the fifth such trading day prior to the closing date. Yadkin has 200K
Slide 11: Comprehensive Due Diligence Approach
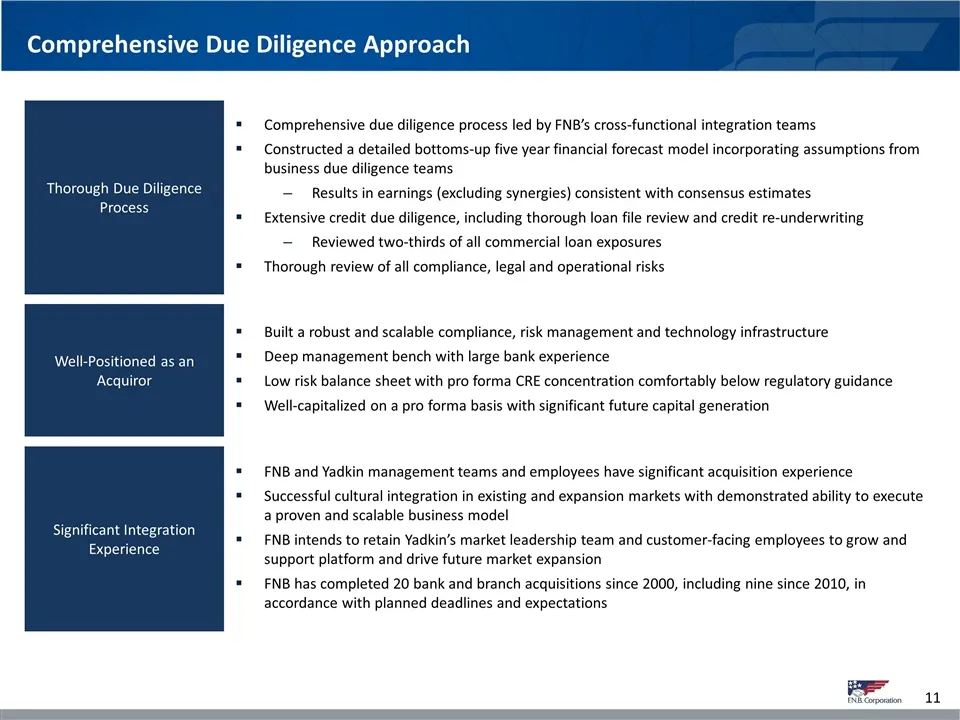
Comprehensive Due Diligence Approach Comprehensive due diligence process led by FNB’s cross-functional integration teams Constructed a detailed bottoms-up five year financial forecast model incorporating assumptions from business due diligence teams Results in earnings (excluding synergies) consiste
Slide 12: Pro Forma Capital Levels Position FNB for Future Growth
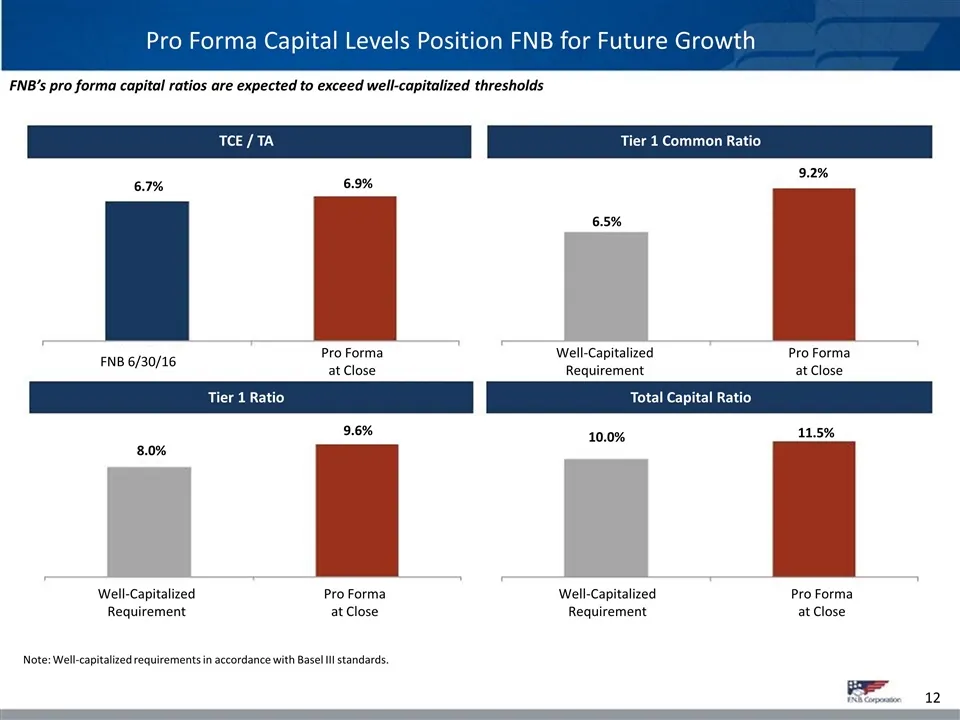
12 Note: Well-capitalized requirements in accordance with Basel III standards. FNB’s pro forma capital ratios are expected to exceed well-capitalized thresholds Total Capital Ratio Tier 1 Common Ratio TCE / TA Tier 1 Ratio Pro Forma Capital Levels Position FNB for Future Growth 6.7% 6.9% 6.5% 9.2% 8
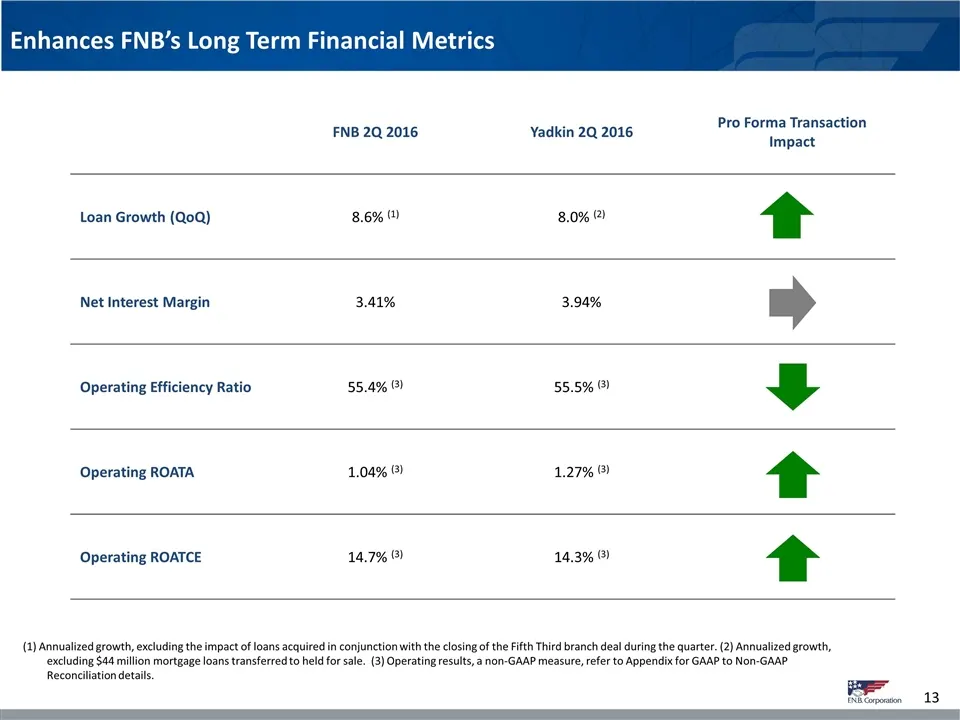
Slide 13: Enhances FNB's Long Term Financial Metrics
Enhances FNB’s Long Term Financial Metrics (1) Annualized growth, excluding the impact of loans acquired in conjunction with the closing of the Fifth Third branch deal during the quarter. (2) Annualized growth, excluding $44 million mortgage loans transferred to held for sale. (3) Operating results,
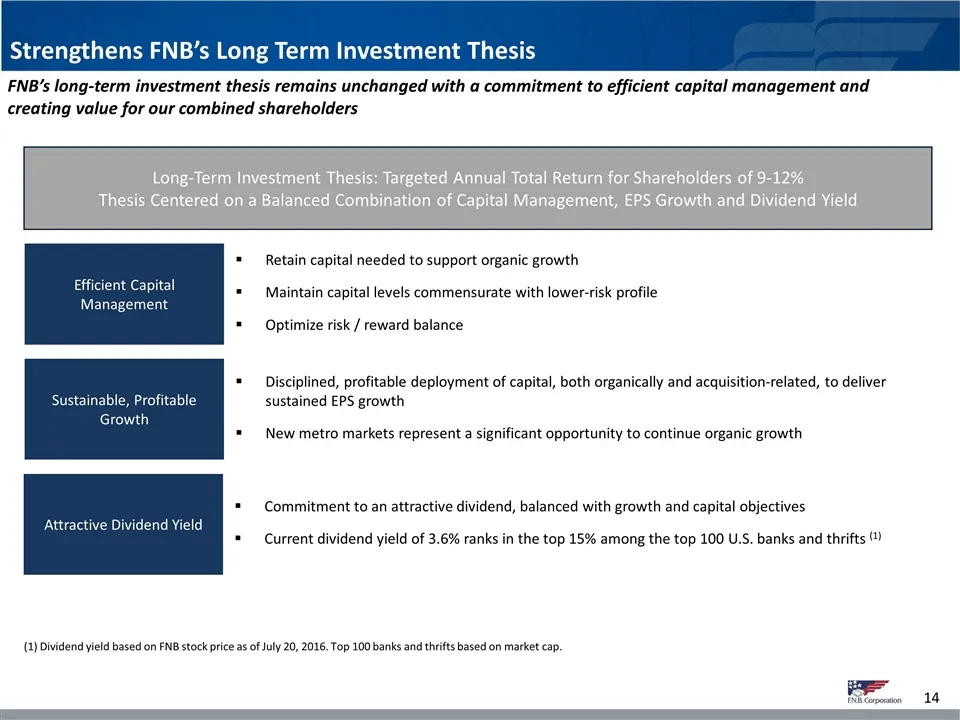
Slide 14: Strengthens FNB's Long Term Investment Thesis
Strengthens FNB’s Long Term Investment Thesis FNB’s long-term investment thesis remains unchanged with a commitment to efficient capital management and creating value for our combined shareholders Long-Term Investment Thesis: Targeted Annual Total Return for Shareholders of 9-12% Thesis Centered on
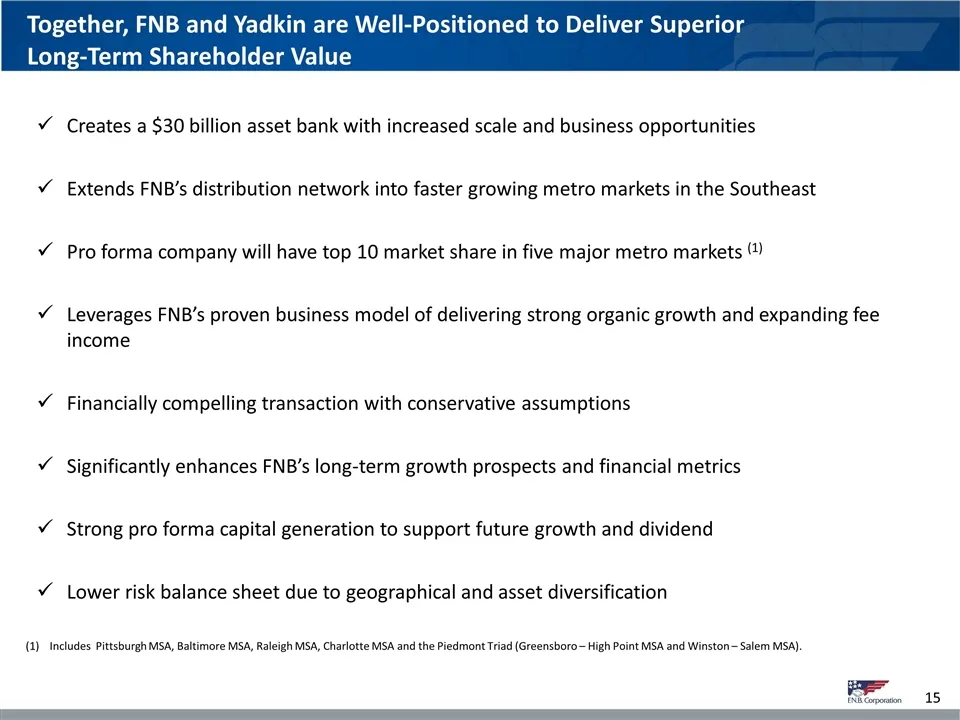
Slide 15: Together, FNB and Yadkin are Well-Positioned to Deliver Superior Long-Term Shareholder Value
Together, FNB and Yadkin are Well-Positioned to Deliver Superior Long-Term Shareholder Value Creates a $30 billion asset bank with increased scale and business opportunities Extends FNB’s distribution network into faster growing metro markets in the Southeast Pro forma company will have top 10 marke
Slide 16: Appendix
Appendix er 16
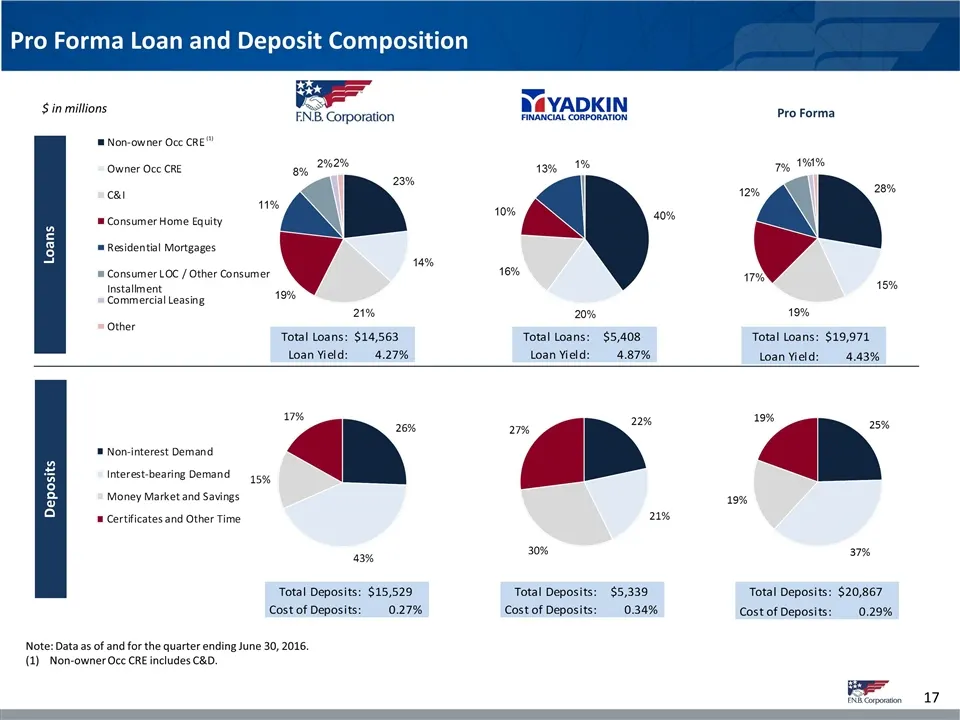
Slide 17: Pro Forma Loan and Deposit Composition
Pro Forma Loan and Deposit Composition Note: Data as of and for the quarter ending June 30, 2016. Non-owner Occ CRE includes C&D. Loans Pro Forma $ in millions Deposits (1)
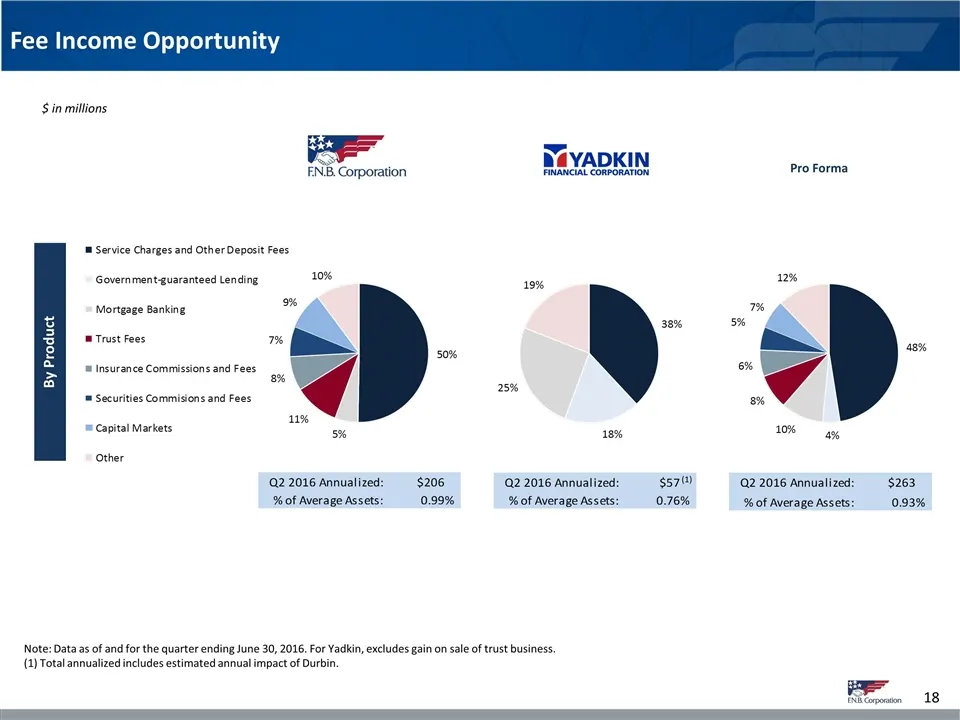
Slide 18: Fee Income Opportunity
Fee Income Opportunity Note: Data as of and for the quarter ending June 30, 2016. For Yadkin, excludes gain on sale of trust business. (1) Total annualized includes estimated annual impact of Durbin. Pro Forma $ in millions By Product (1)
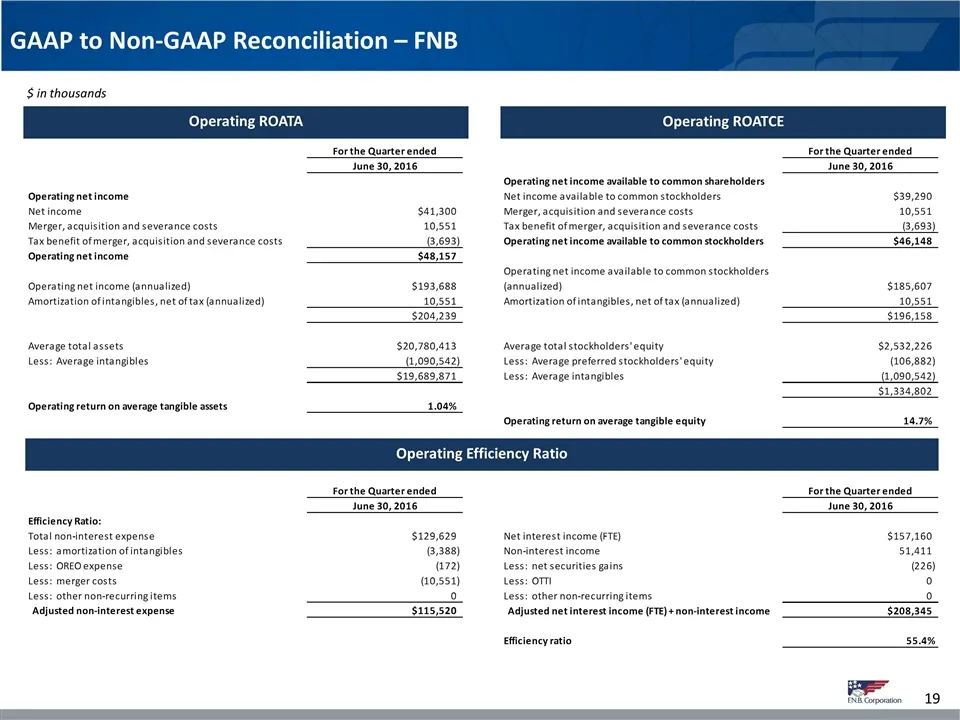
Slide 19: GAAP to Non-GAAP Reconciliation – FNB
GAAP to Non-GAAP Reconciliation – FNB Operating ROATA Operating ROATCE $ in thousands Operating Efficiency Ratio
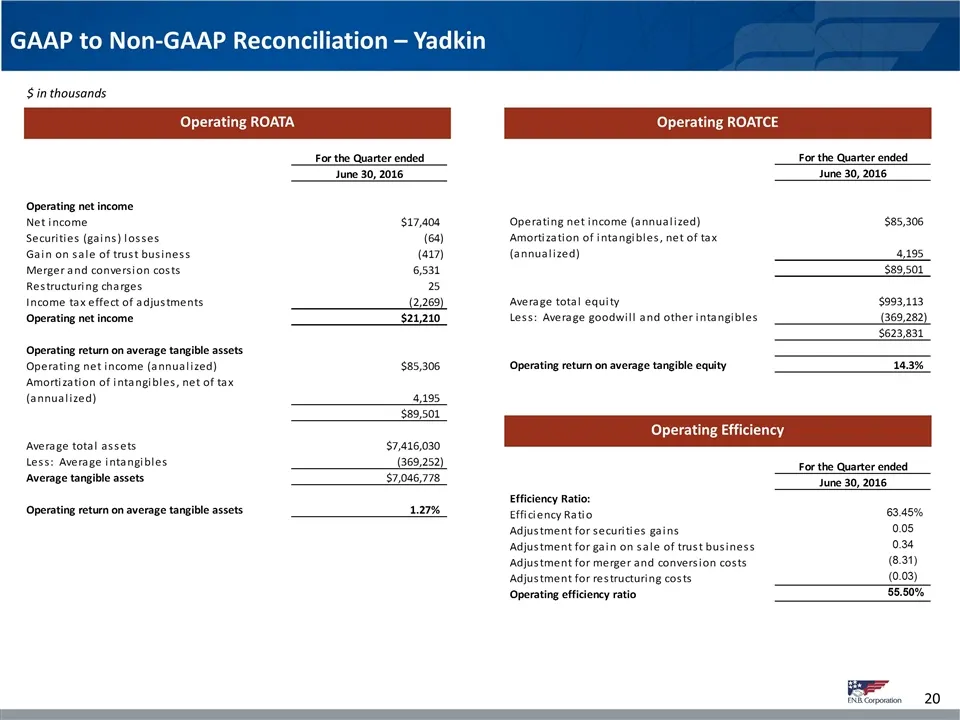
Slide 20: GAAP to Non-GAAP Reconciliation – Yadkin
GAAP to Non-GAAP Reconciliation – Yadkin Operating ROATA Operating ROATCE Operating Efficiency $ in thousands
Source: SEC EDGAR · 425 filed Jul 21, 2016
More decks from Yadkin Financial Corp
 Merger or Acquisition (August 2016)38 slides · Aug 16, 2016
 Gulf South Bank Conference 201624 slides · May 2, 2016
 Q1 2016 Earnings Presentation10 slides · Apr 21, 2016
 Q4 2015 Earnings Presentation13 slides · Jan 28, 2016
 Q3 2015 Earnings Presentation29 slides · Nov 10, 2015
 Q3 2015 Earnings Presentation16 slides · Oct 22, 2015