Yadkin Financial — Gulf South Bank Conference 2016
24 slides from Yadkin Financial's conference presentation, May 2, 2016
Slide 1: Gulf South Bank Conference May 2-3, 2016
(NYSE: YDKN) Gulf South Bank Conference May 2 – 3, 2016
Slide 2: Forward Looking Statements
Forward Looking Statements Information in this presentation contains forward-looking statements within the meaning of the Private Securities Litigation Reform Act of 1995. These statements involve risks and uncertainties that could cause actual results to differ materially, including without limitat
Slide 3: Investment Thesis
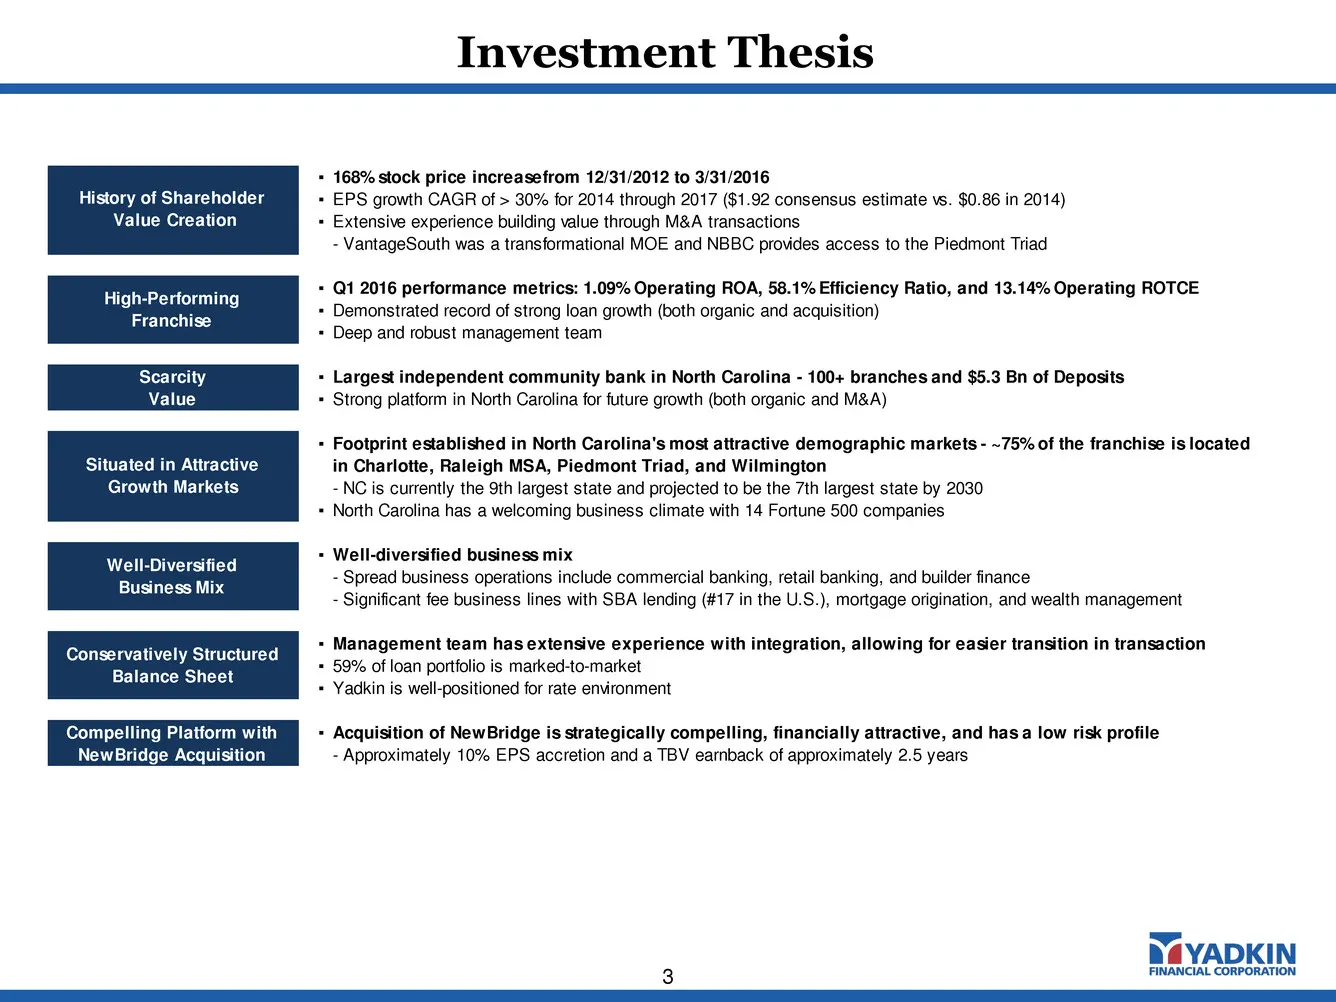
Investment Thesis 3 ▪ 168% stock price increasefrom 12/31/2012 to 3/31/2016 ▪ EPS growth CAGR of > 30% for 2014 through 2017 ($1.92 consensus estimate vs. $0.86 in 2014) ▪ Extensive experience building value through M&A transactions - VantageSouth was a transformational MOE and NBBC provides access
Slide 4: NewBridge Integration Update
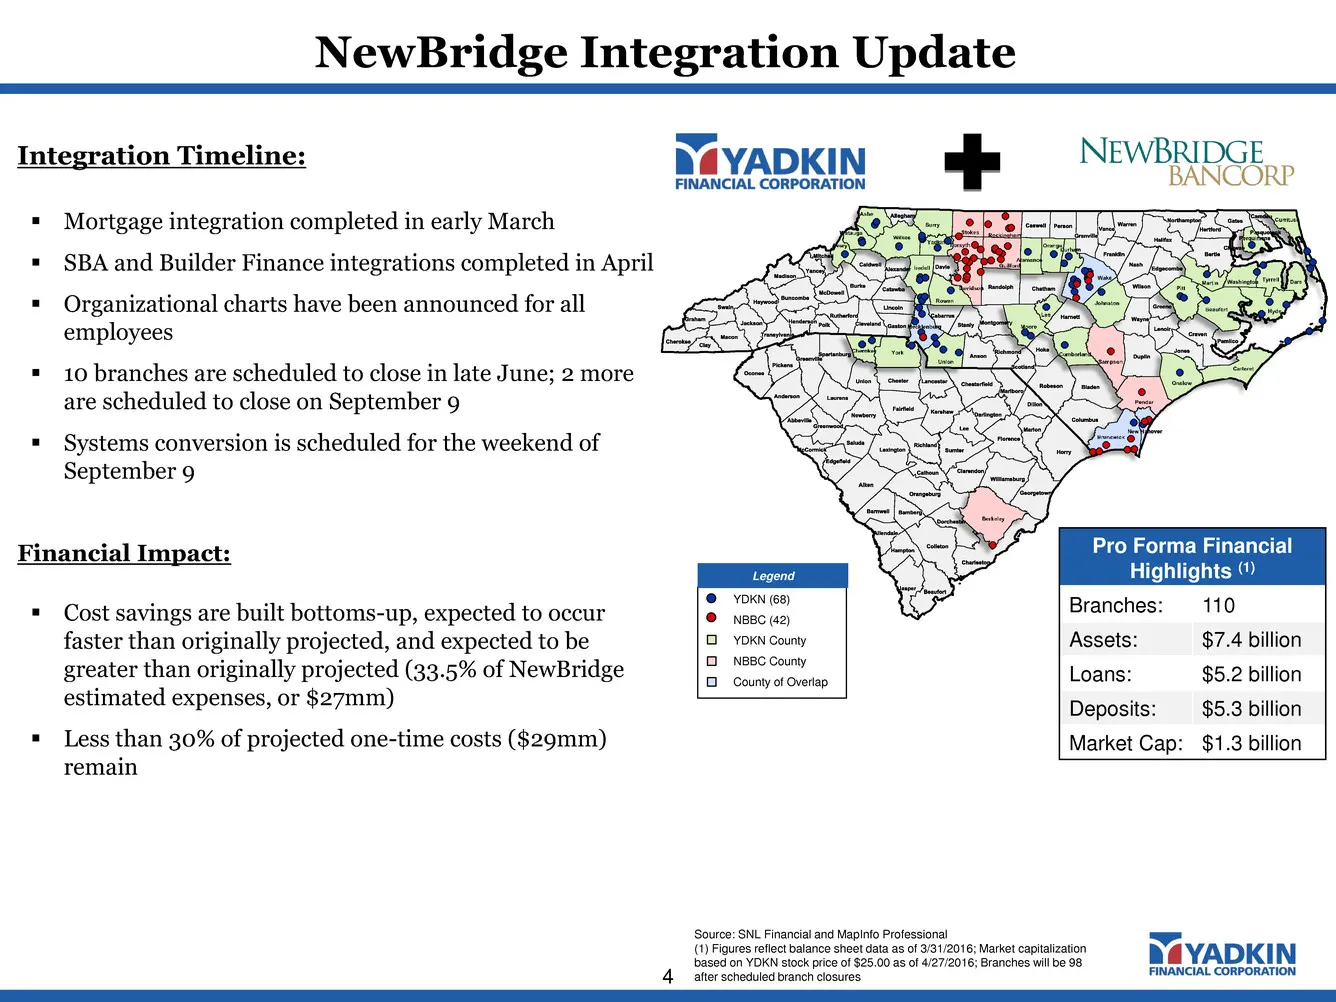
NewBridge Integration Update 4 YDKN (68) NBBC (42) YDKN County NBBC County County of Overlap Legend Pro Forma Financial Highlights (1) Branches: 110 Assets: $7.4 billion Loans: $5.2 billion Deposits: $5.3 billion Market Cap: $1.3 billion Source: SNL Financial and MapInfo Professional (1) Figures ref
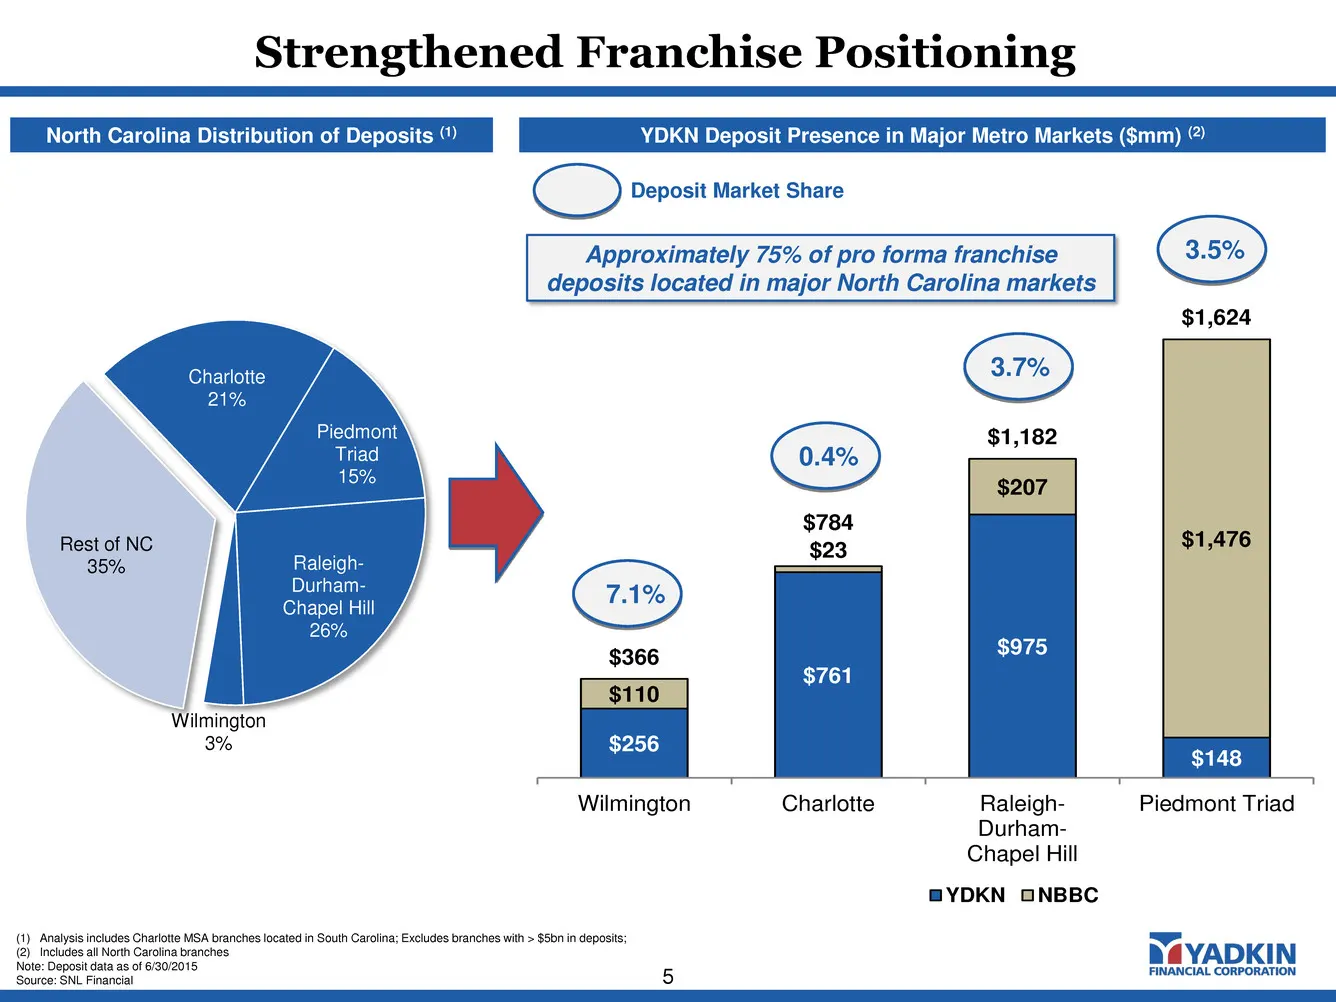
Slide 5: Strengthened Franchise Positioning
5 Charlotte 21% Piedmont Triad 15% Raleigh- Durham- Chapel Hill 26% Wilmington 3% Rest of NC 35% Strengthened Franchise Positioning $256 $761 $975 $148 $110 $23 $207 $1,476 $366 $784 $1,182 $1,624 Wilmington Charlotte Raleigh- Durham- Chapel Hill Piedmont Triad YDKN NBBC (1) Analysis includes Charlo
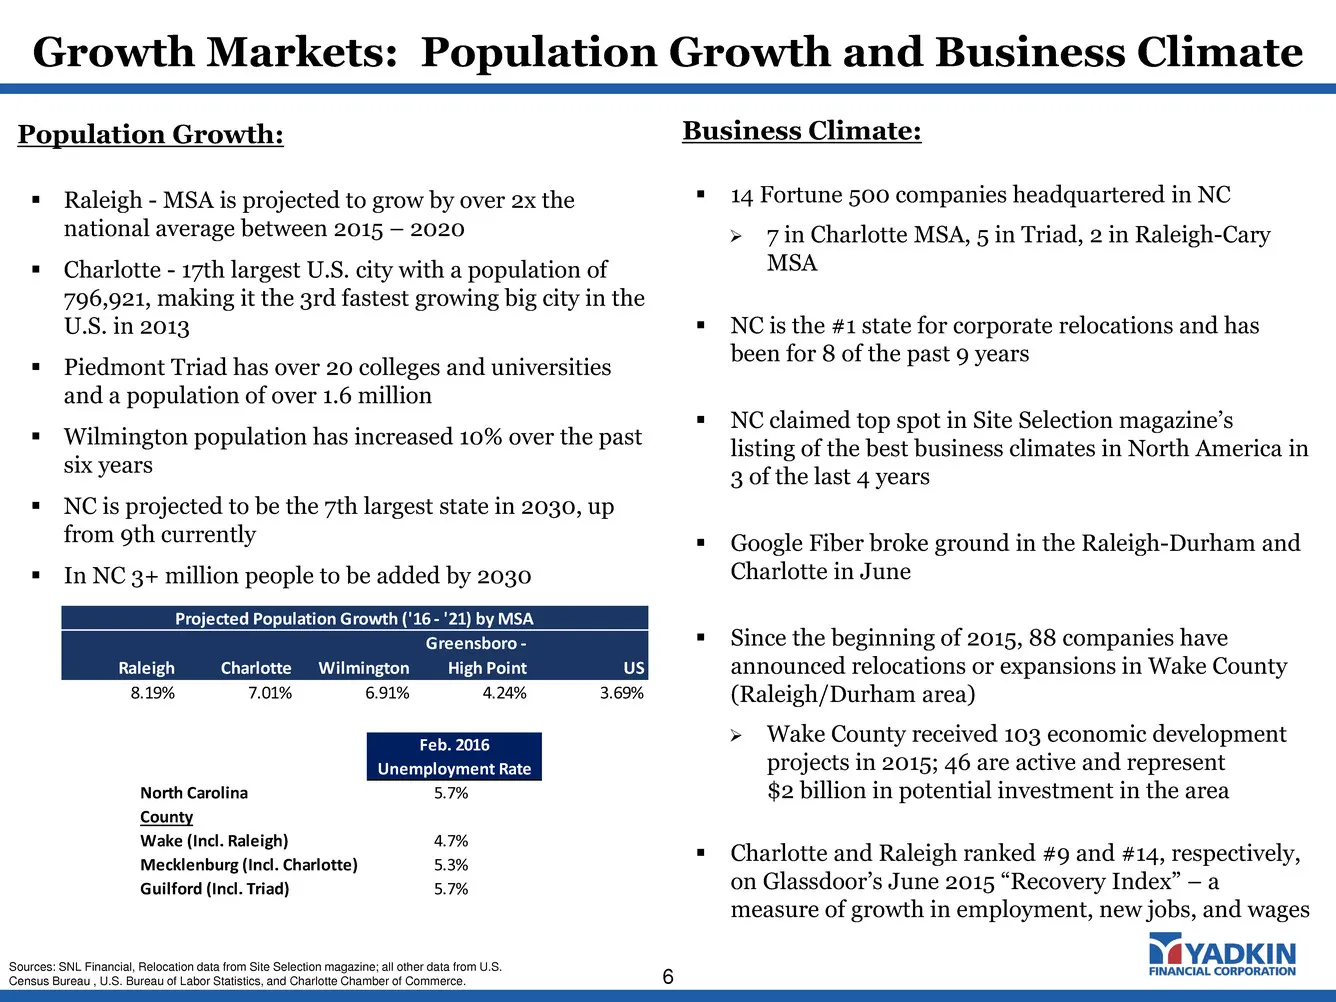
Slide 6: Growth Markets: Population Growth and Business Climate
Growth Markets: Population Growth and Business Climate 6 Business Climate: 14 Fortune 500 companies headquartered in NC 7 in Charlotte MSA, 5 in Triad, 2 in Raleigh-Cary MSA NC is the #1 state for corporate relocations and has been for 8 of the past 9 years NC claimed top spot in Site Select
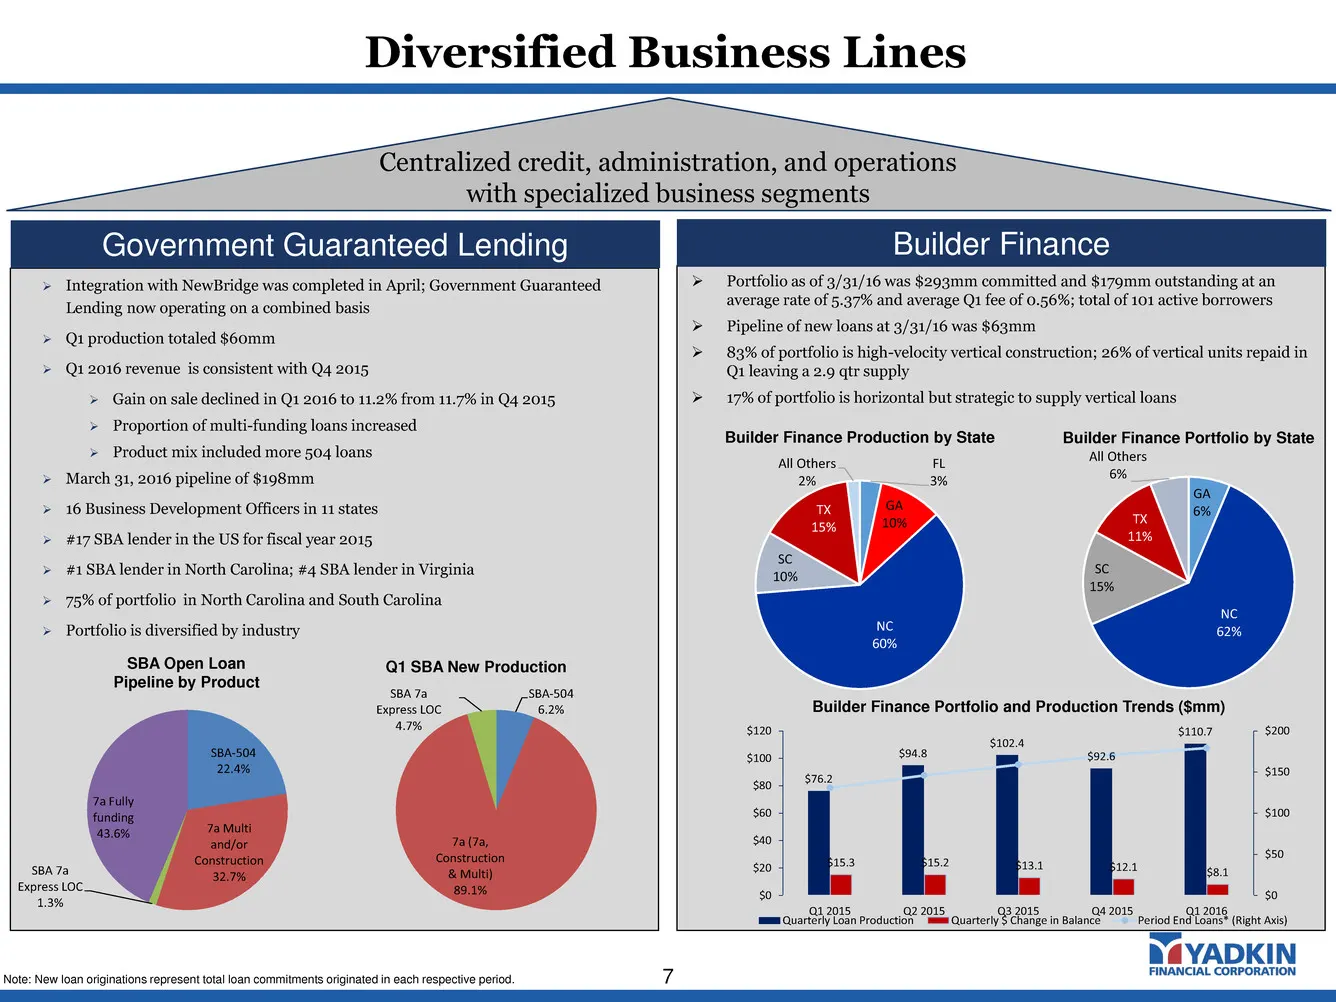
Slide 7: Government Guaranteed Lending and Builder Finance
Integration with NewBridge was completed in April; Government Guaranteed Lending now operating on a combined basis Q1 production totaled $60mm Q1 2016 revenue is consistent with Q4 2015 Gain on sale declined in Q1 2016 to 11.2% from 11.7% in Q4 2015 Proportion of multi-funding loans increa
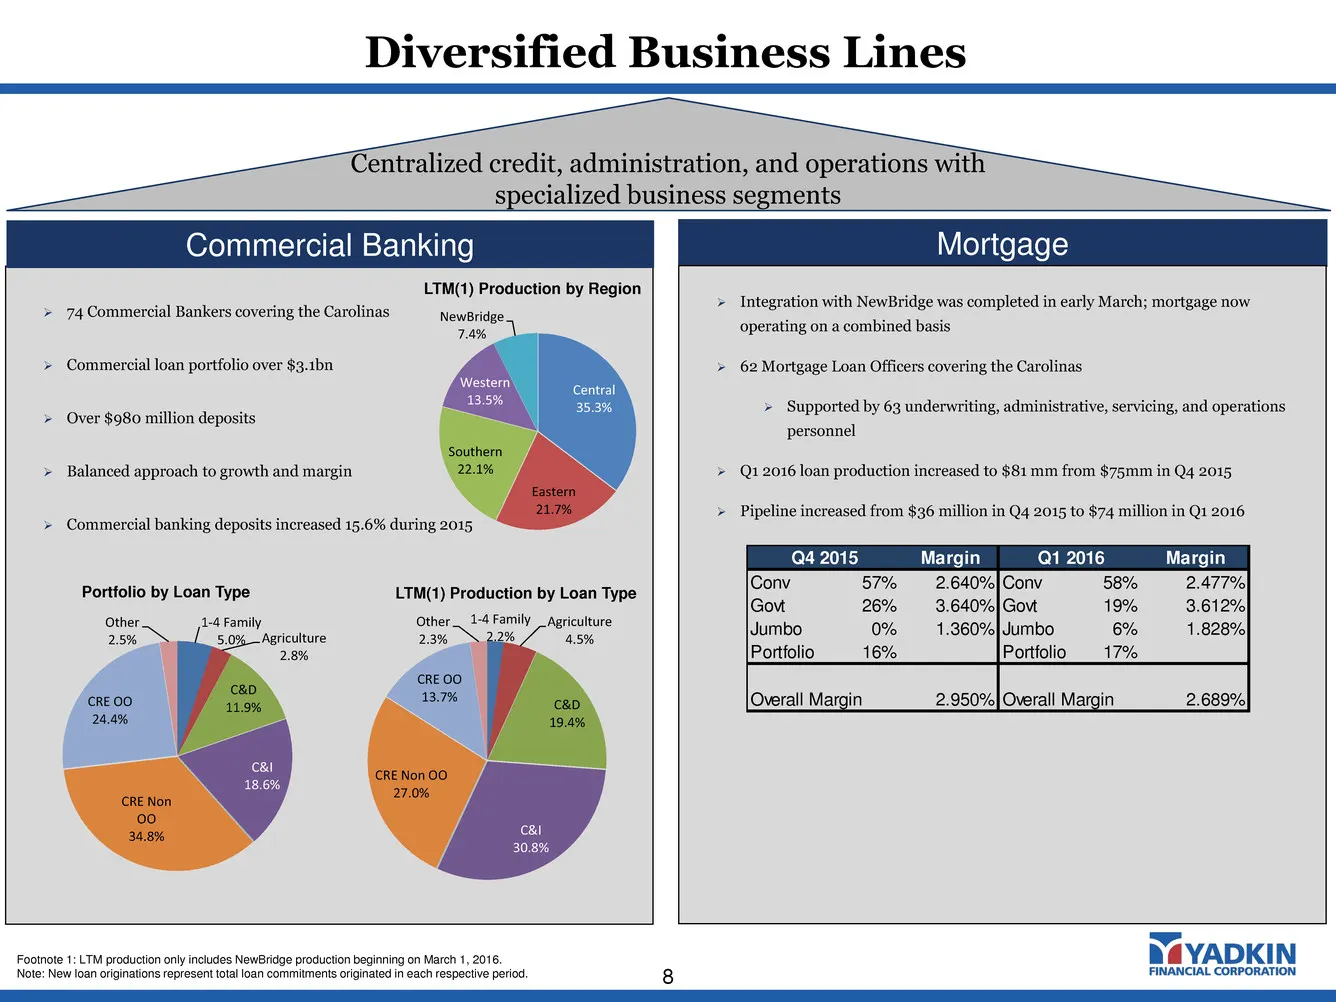
Slide 8: Diversified Business Lines
Diversified Business Lines 8 Footnote 1: LTM production only includes NewBridge production beginning on March 1, 2016. Note: New loan originations represent total loan commitments originated in each respective period. Centralized credit, administration, and operations with specialized business segme
Slide 9: Q1 2016 Highlights
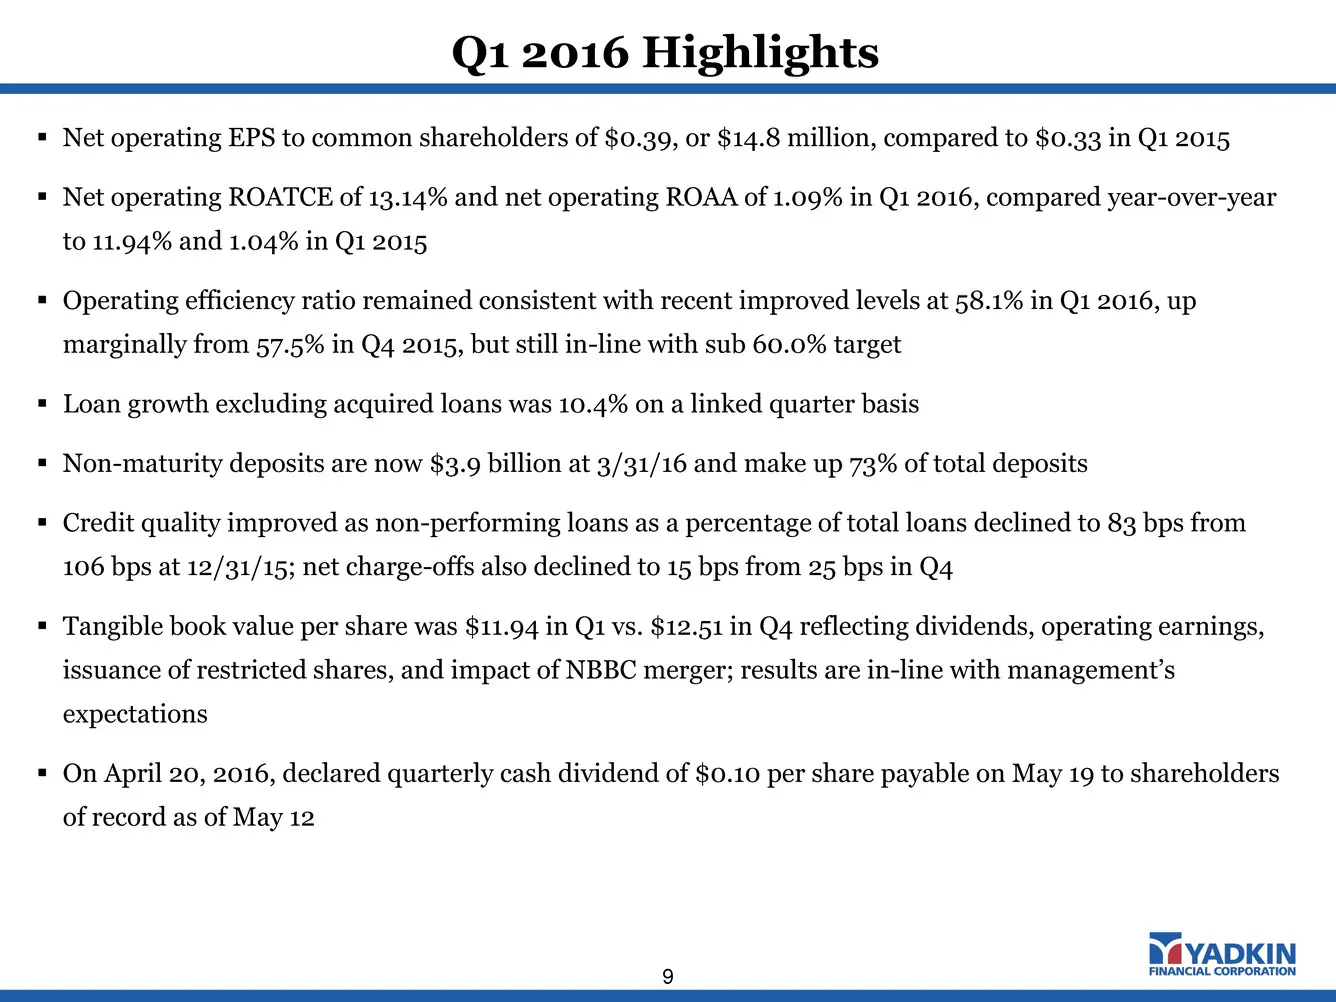
Q1 2016 Highlights 9 Net operating EPS to common shareholders of $0.39, or $14.8 million, compared to $0.33 in Q1 2015 Net operating ROATCE of 13.14% and net operating ROAA of 1.09% in Q1 2016, compared year-over-year to 11.94% and 1.04% in Q1 2015 Operating efficiency ratio remained consisten
Slide 10: Q1 2016 Operating Earnings
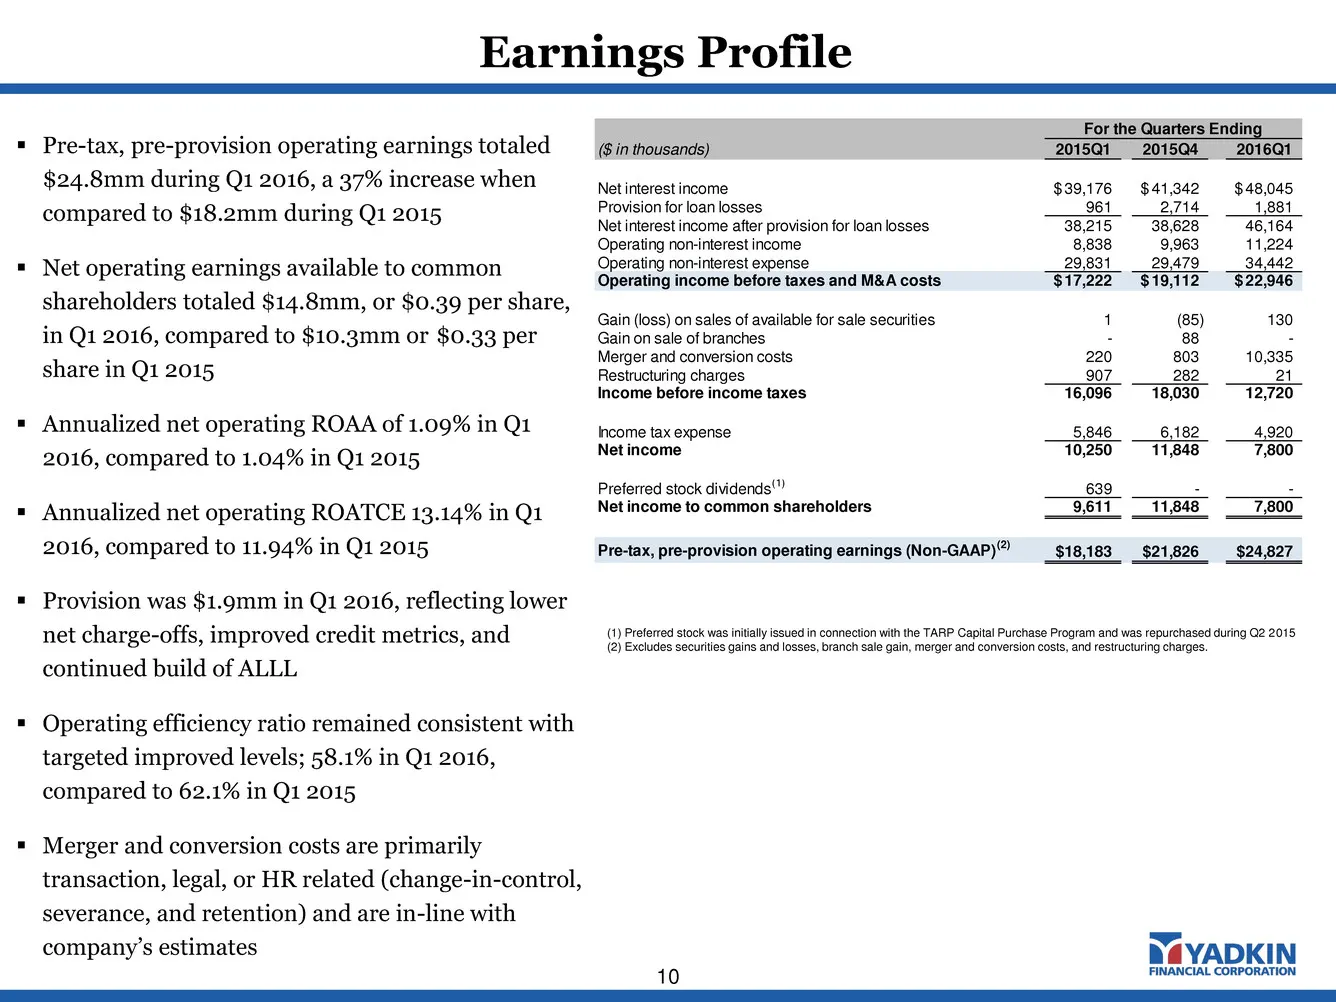
Pre-tax, pre-provision operating earnings totaled $24.8mm during Q1 2016, a 37% increase when compared to $18.2mm during Q1 2015 Net operating earnings available to common shareholders totaled $14.8mm, or $0.39 per share, in Q1 2016, compared to $10.3mm or $0.33 per share in Q1 2015 Annualized
Slide 11: Net Interest Income and Net Interest Margin
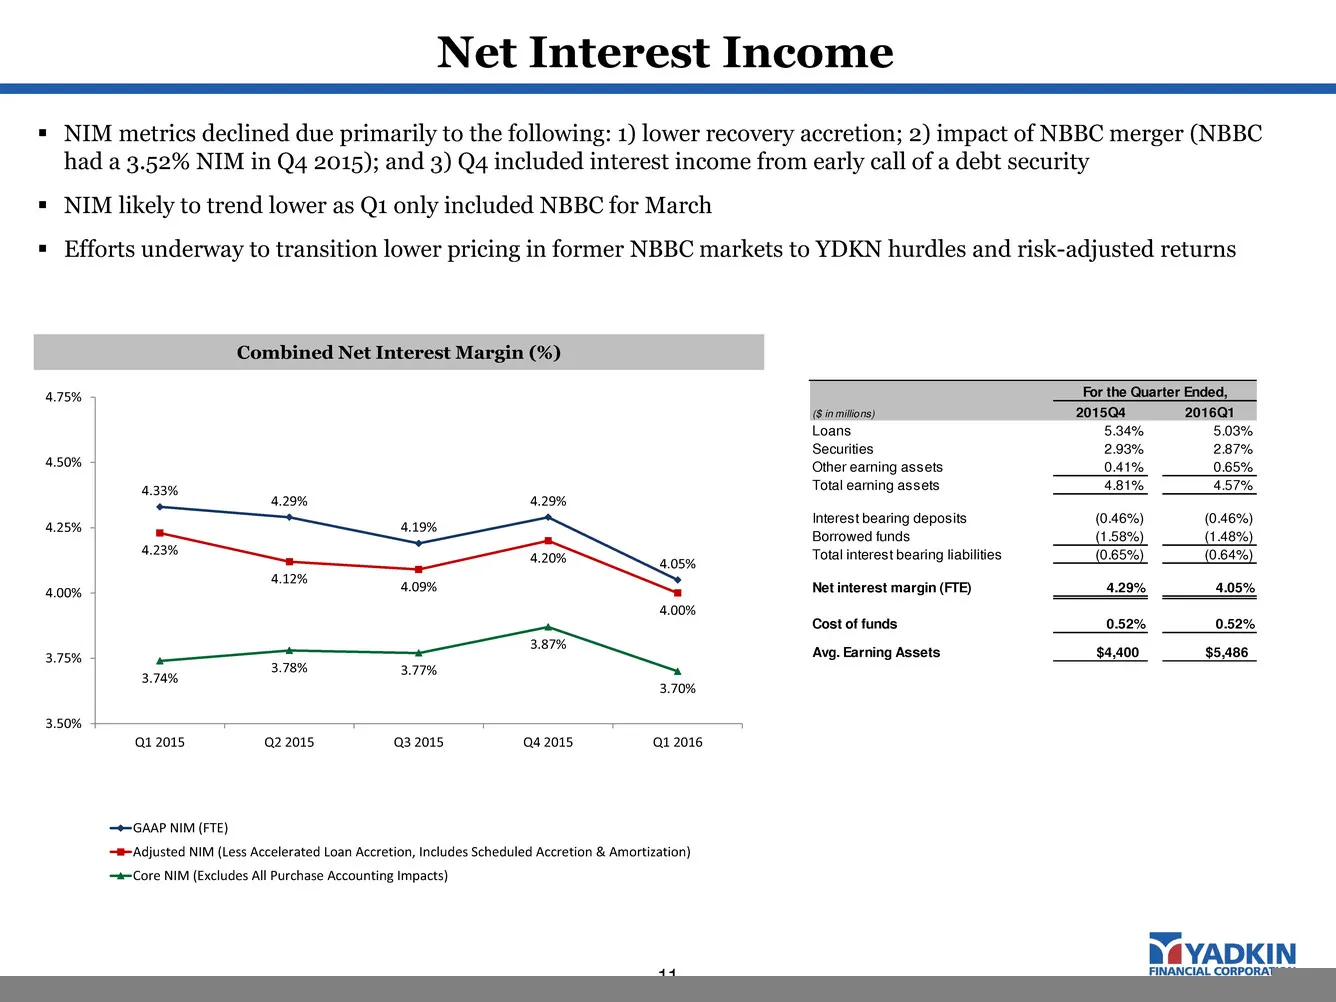
Net Interest Income 11 Combined Net Interest Margin (%) NIM metrics declined due primarily to the following: 1) lower recovery accretion; 2) impact of NBBC merger (NBBC had a 3.52% NIM in Q4 2015); and 3) Q4 included interest income from early call of a debt security NIM likely to trend lower as
Slide 12: Diverse Drivers of Non-Interest Income Growth
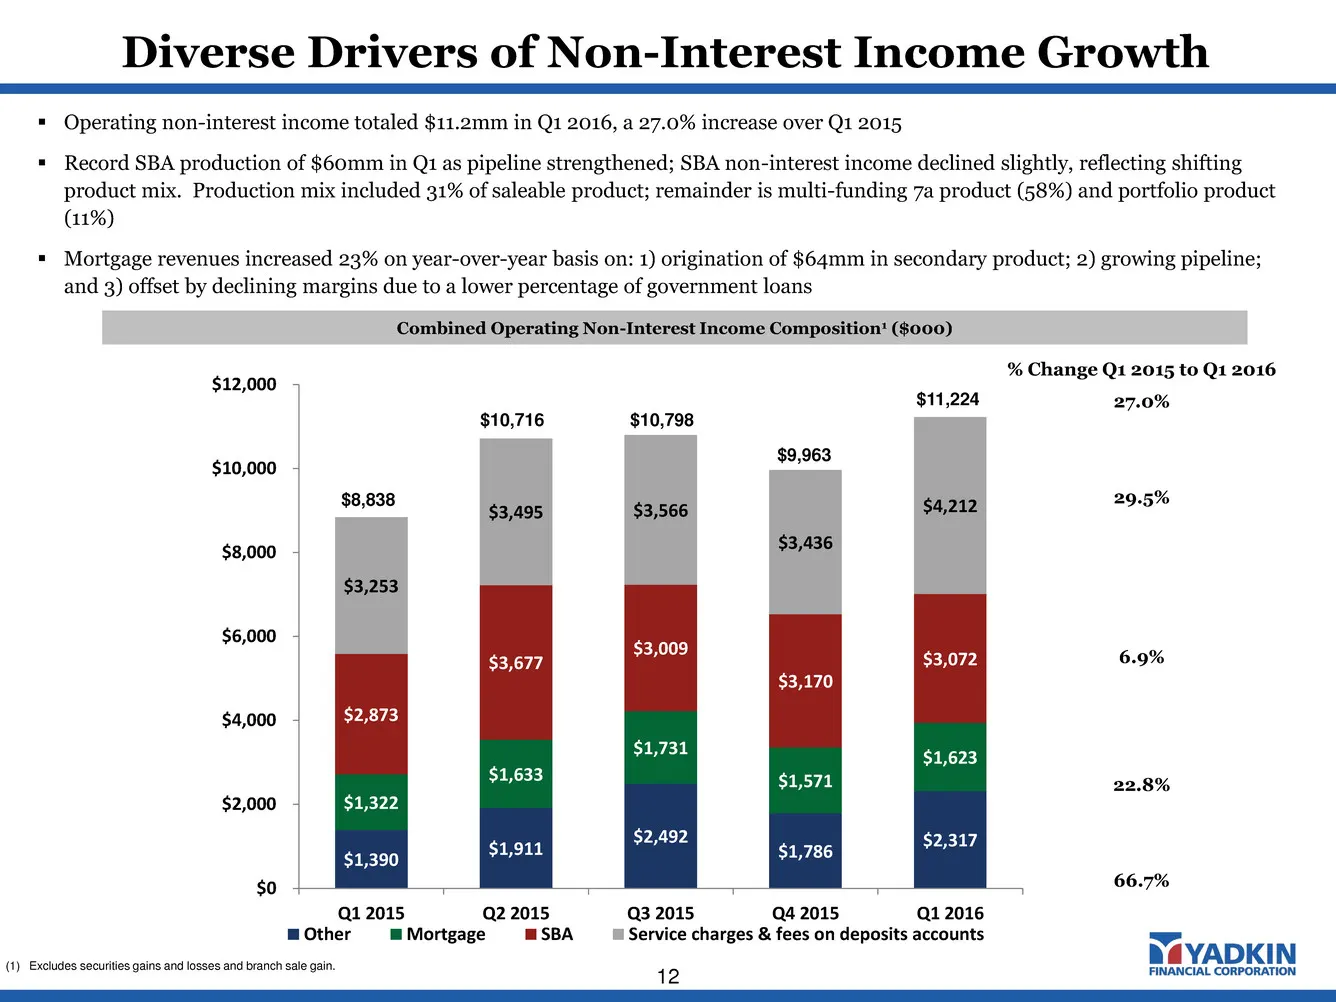
$1,390 $1,911 $2,492 $1,786 $2,317 $1,322 $1,633 $1,731 $1,571 $1,623 $2,873 $3,677 $3,009 $3,170 $3,072 $3,253 $3,495 $3,566 $3,436 $4,212 $0 $2,000 $4,000 $6,000 $8,000 $10,000 $12,000 Q1 2015 Q2 2015 Q3 2015 Q4 2015 Q1 2016 Other Mortgage SBA Service charges & fees on deposits accounts Diverse Dr
Slide 13: Non-Interest Expense
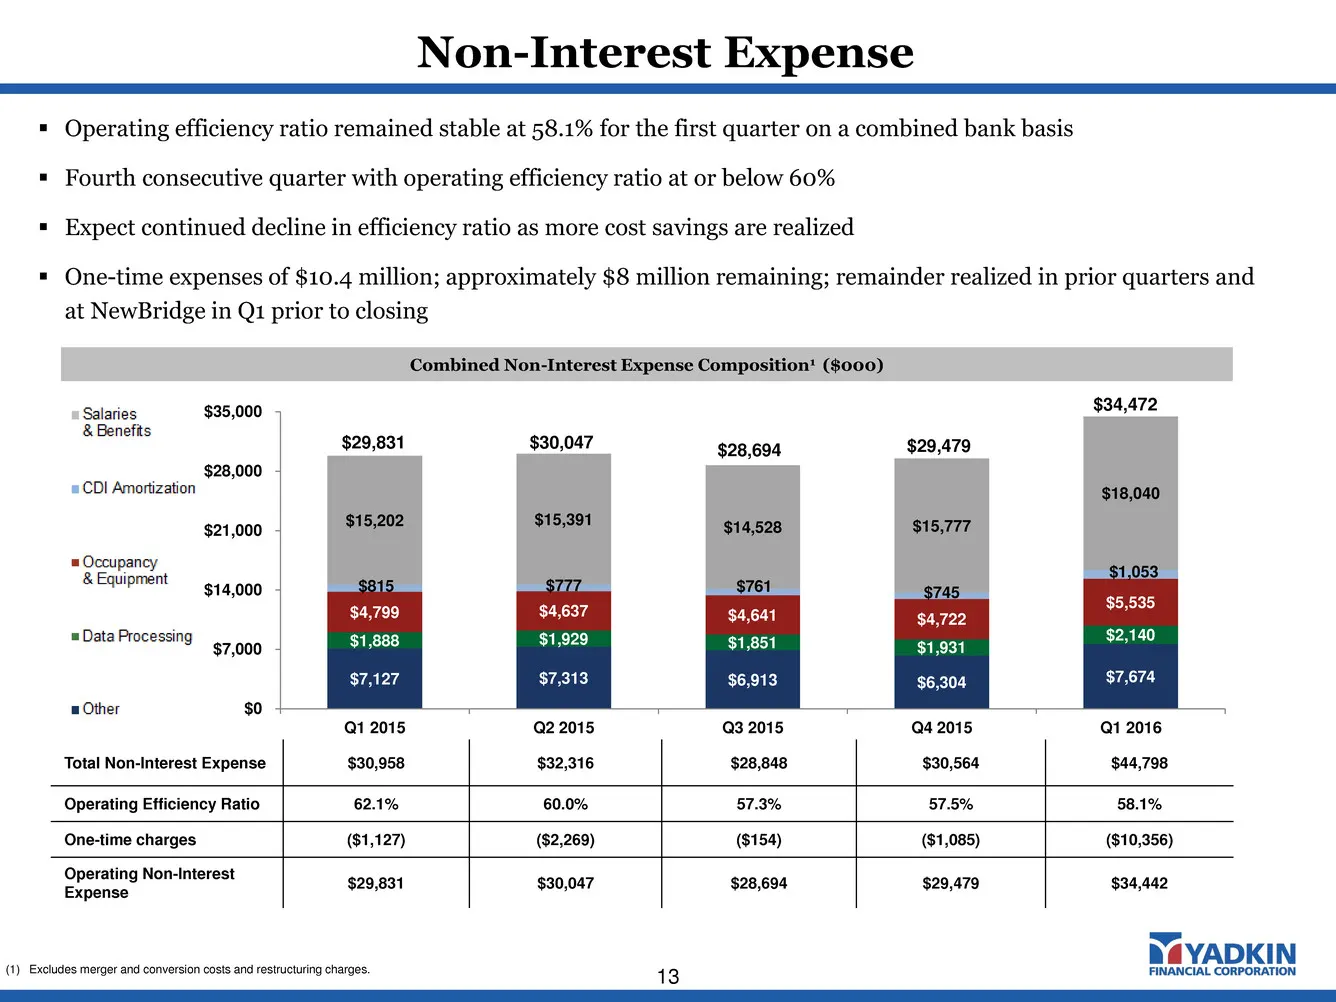
$7,127 $7,313 $6,913 $6,304 $7,674 $1,888 $1,929 $1,851 $1,931 $2,140 $4,799 $4,637 $4,641 $4,722 $5,535 $815 $777 $761 $745 $1,053 $15,202 $15,391 $14,528 $15,777 $18,040 $0 $7,000 $14,000 $21,000 $28,000 $35,000 Q1 2015 Q2 2015 Q3 2015 Q4 2015 Q1 2016 Non-Interest Expense 13 Combined Non-Interest
Slide 14: Balance Sheet
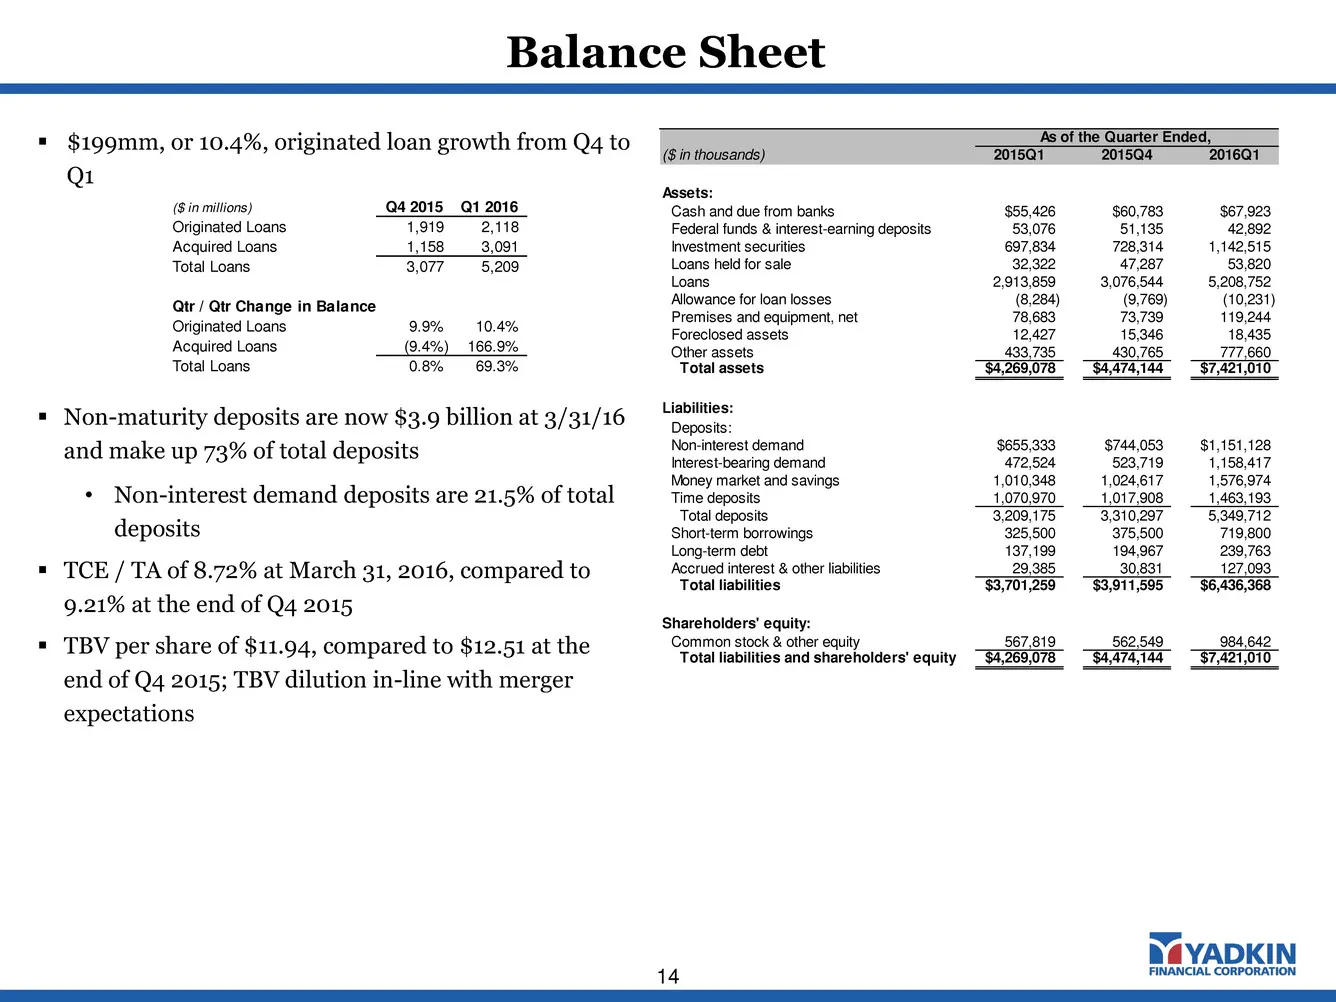
Balance Sheet 14 $199mm, or 10.4%, originated loan growth from Q4 to Q1 Non-maturity deposits are now $3.9 billion at 3/31/16 and make up 73% of total deposits • Non-interest demand deposits are 21.5% of total deposits TCE / TA of 8.72% at March 31, 2016, compared to 9.21% at the end of Q4 201
Slide 15: Positive Balance Sheet Trends
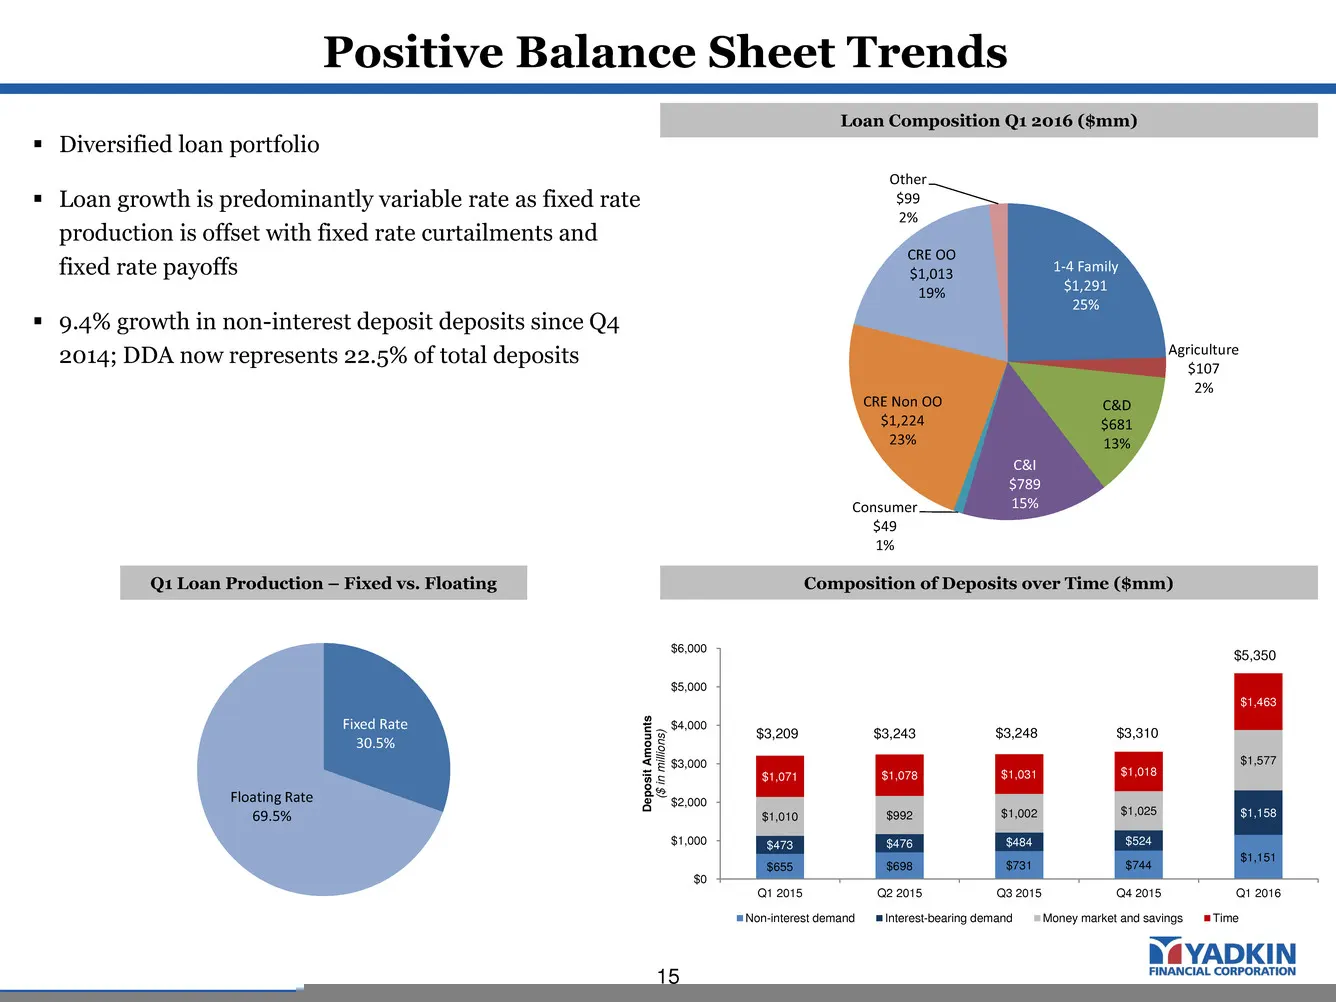
$655 $698 $731 $744 $1,151 $473 $476 $484 $524 $1,158 $1,010 $992 $1,002 $1,025 $1,577 $1,071 $1,078 $1,031 $1,018 $1,463 $0 $1,000 $2,000 $3,000 $4,000 $5,000 $6,000 Q1 2015 Q2 2015 Q3 2015 Q4 2015 Q1 2016 De po sit Am ou nts ($ in mi llio ns ) Non-interest demand Interest-bearing demand Money mark
Slide 16: Asset Sensitive Balance Sheet
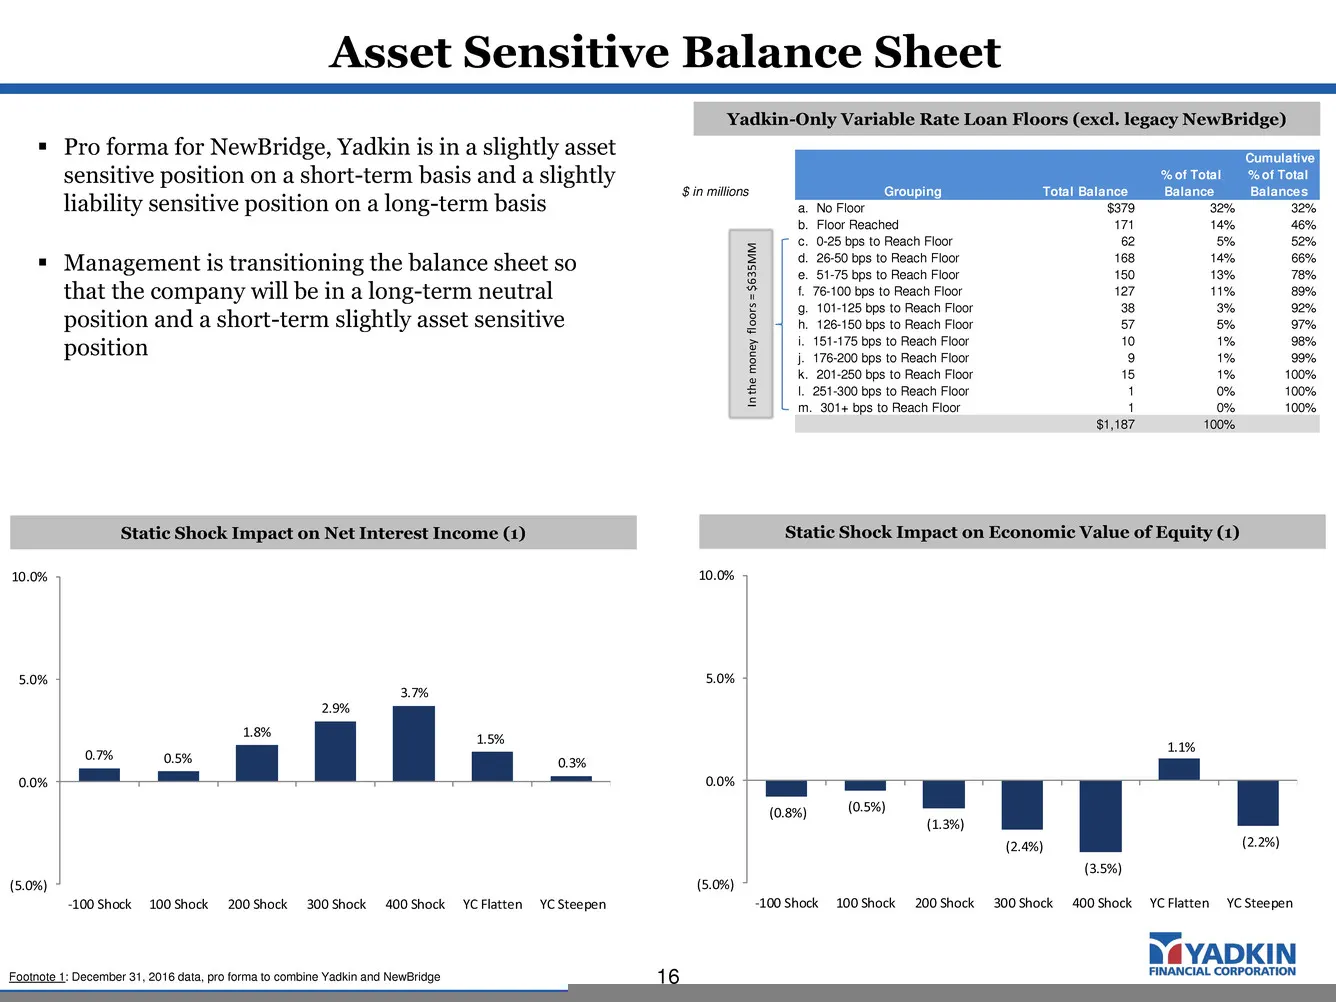
Asset Sensitive Balance Sheet 16 Static Shock Impact on Economic Value of Equity (1) Static Shock Impact on Net Interest Income (1) Yadkin-Only Variable Rate Loan Floors (excl. legacy NewBridge) Pro forma for NewBridge, Yadkin is in a slightly asset sensitive position on a short-term basis and a s
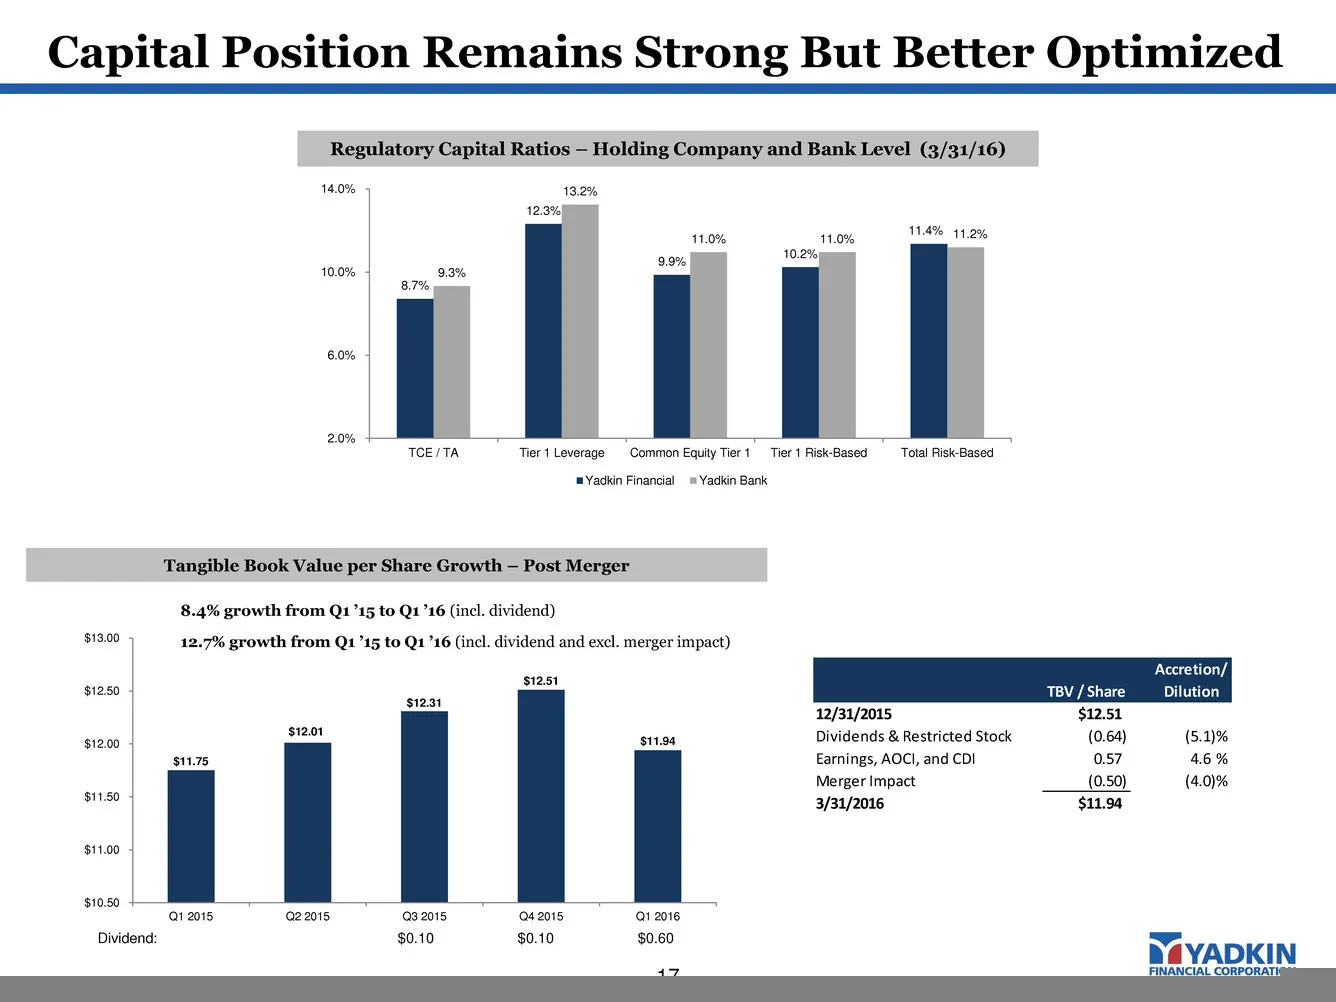
Slide 17: Capital Position Remains Strong But Better Optimized
$11.75 $12.01 $12.31 $12.51 $11.94 $10.50 $11.00 $11.50 $12.00 $12.50 $13.00 Q1 2015 Q2 2015 Q3 2015 Q4 2015 Q1 2016 Capital Position Remains Strong But Better Optimized 17 Regulatory Capital Ratios – Holding Company and Bank Level (3/31/16) Tangible Book Value per Share Growth – Post Merger Dividen
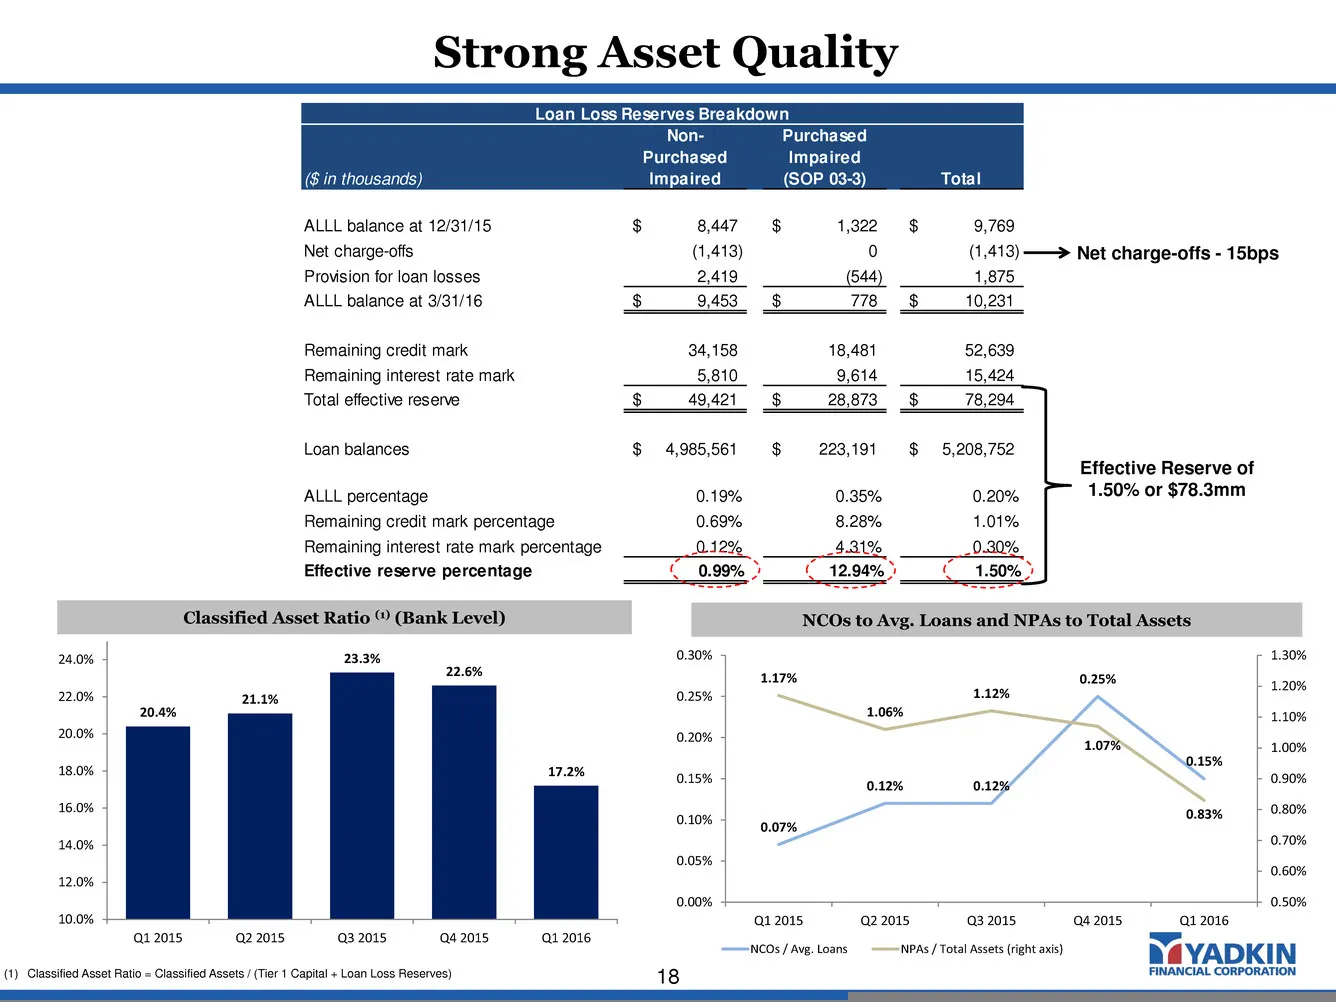
Slide 18: Strong Asset Quality
Loan Loss Reserves Breakdown ($ in thousands) Non- Purchased Impaired Purchased Impaired (SOP 03-3) Total ALLL balance at 12/31/15 8,447$ 1,322$ 9,769$ Net charge-offs (1,413) 0 (1,413) Provision for loan losses 2,419 (544) 1,875 ALLL balance at 3/31/16 9,453$ 778$ 10,231$ Remaining credit mark 34,1
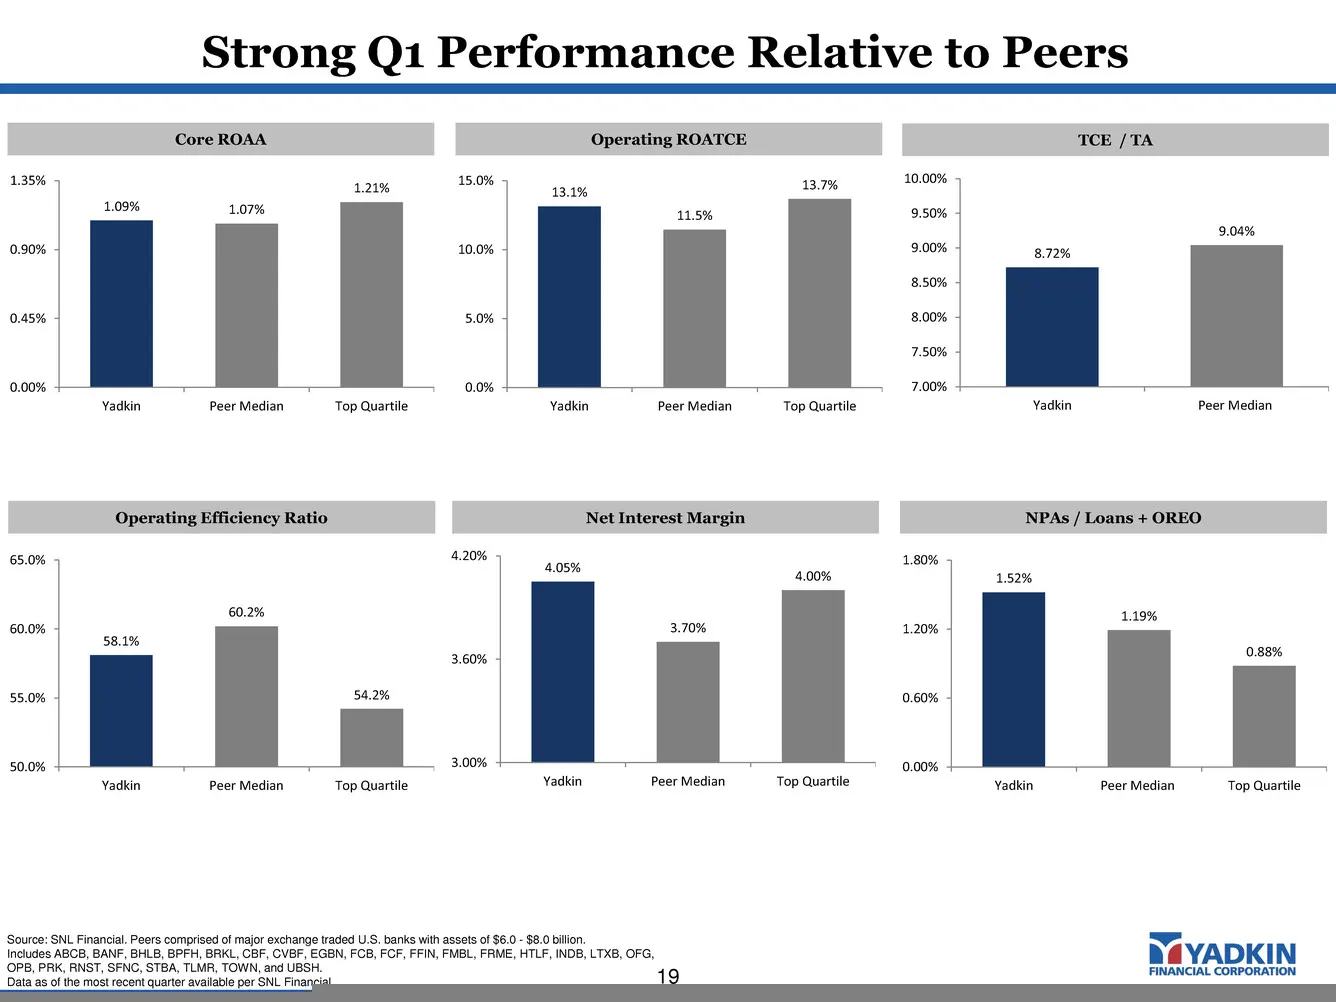
Slide 19: Strong Q1 Performance Relative to Peers
Strong Q1 Performance Relative to Peers 19 Core ROAA Operating ROATCE Operating Efficiency Ratio Net Interest Margin NPAs / Loans + OREO TCE / TA Source: SNL Financial. Peers comprised of major exchange traded U.S. banks with assets of $6.0 - $8.0 billion. Includes ABCB, BANF, BHLB, BPFH, BRKL, CBF,
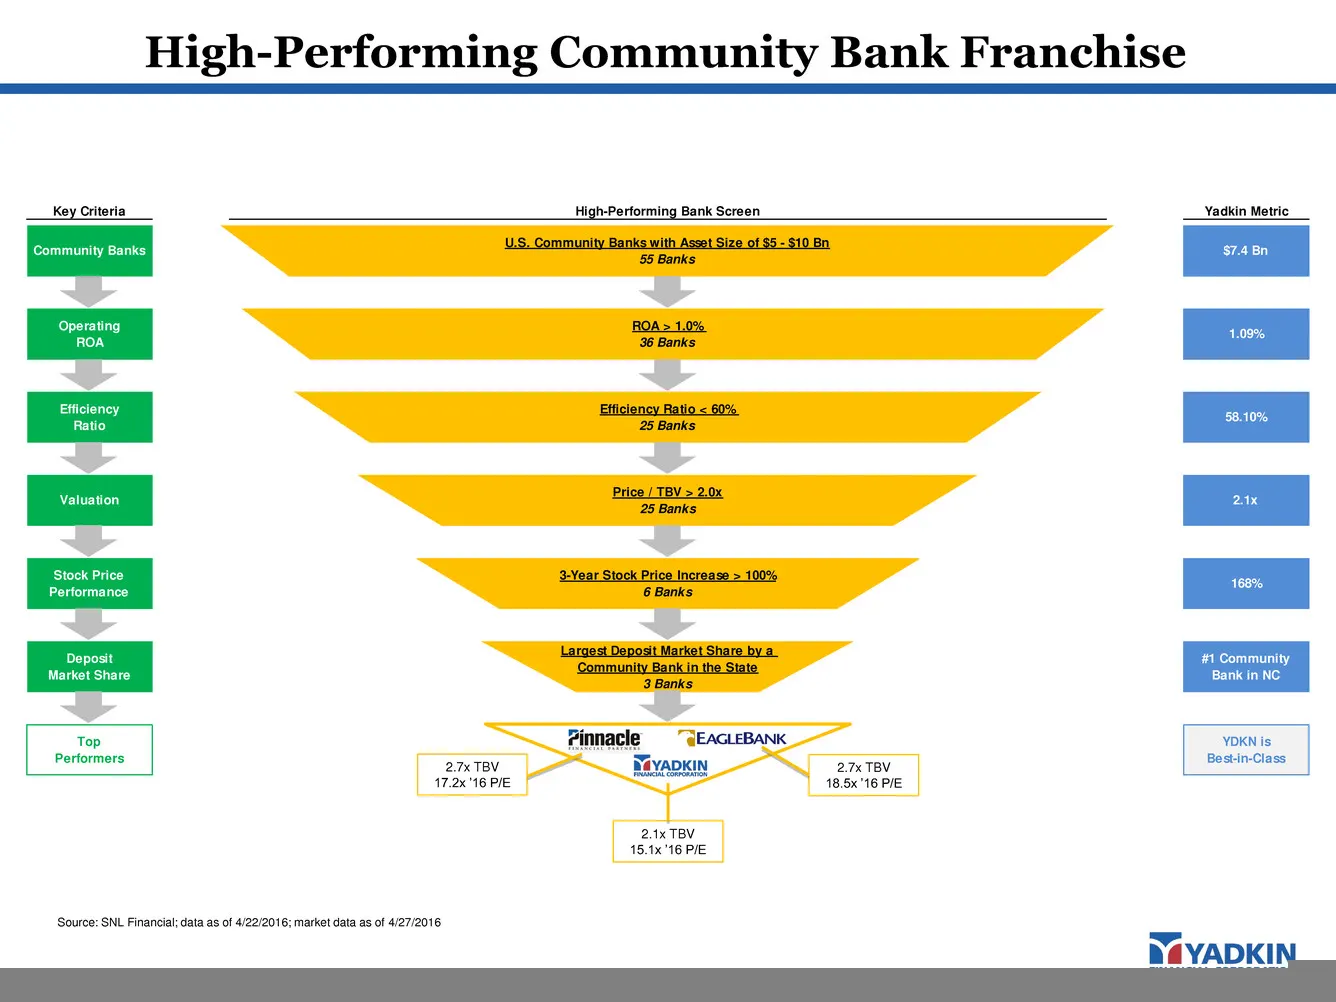
Slide 20: High-Performing Community Bank Franchise
Key Criteria High-Performing Bank Screen Yadkin Metric Top Performers YDKN is Best-in-Class Efficiency Ratio < 60% 25 Banks Price / TBV > 2.0x 25 Banks 3-Year Stock Price Increase > 100% 6 Banks Largest Deposit Market Share by a Community Bank in the State 3 Banks 58.10% 2.1x 168% #1 Community Bank
Slide 21: Attractive Valuation
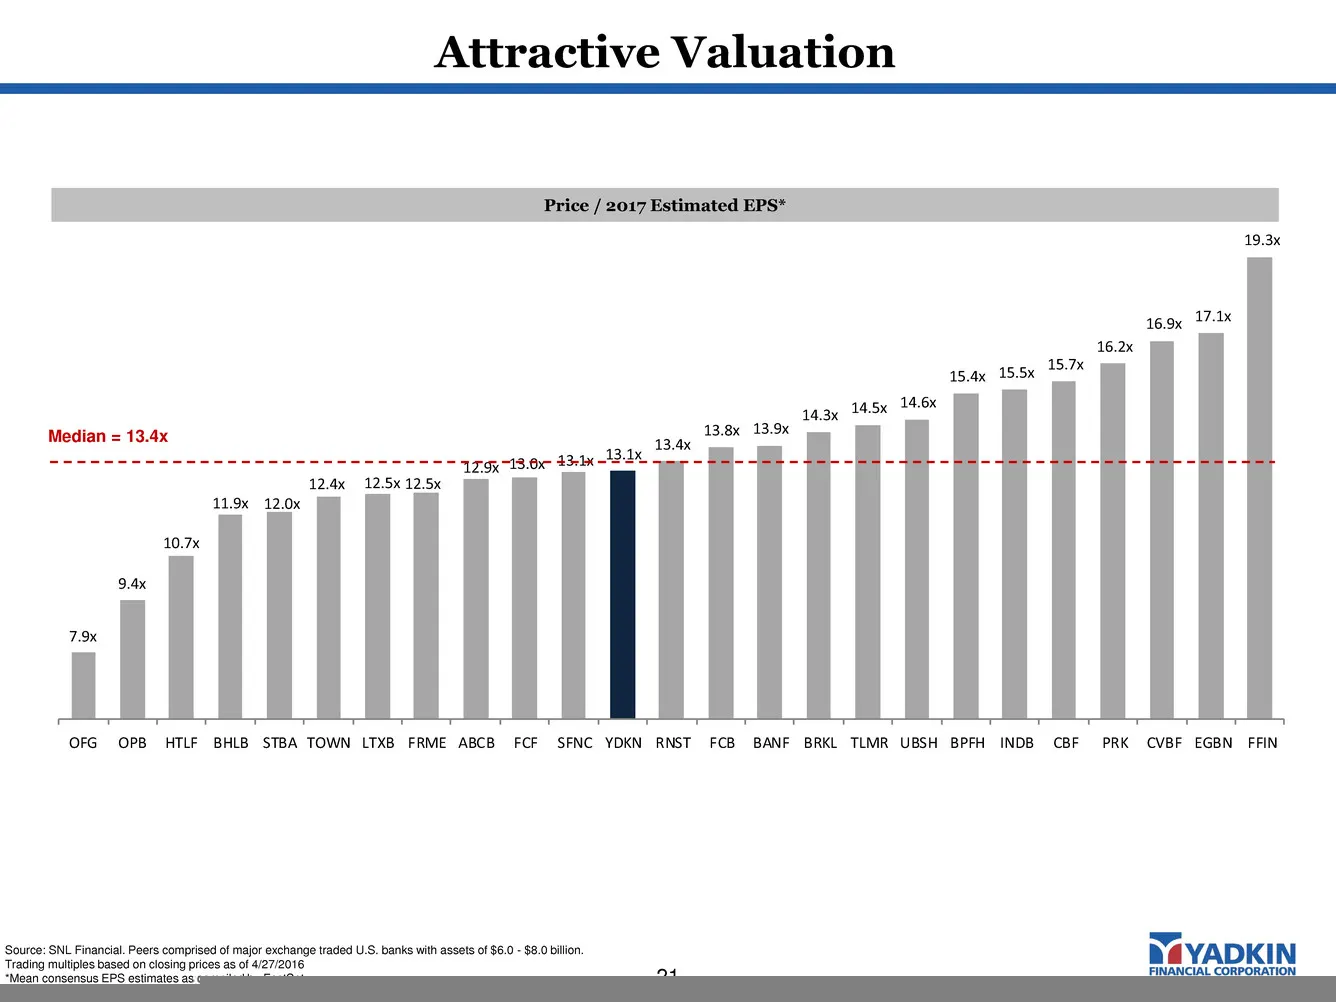
Attractive Valuation 21 7.9x 9.4x 10.7x 11.9x 12.0x 12.4x 12.5x 12.5x 12.9x 13.0x 13.1x 13.1x 13.4x 13.8x 13.9x 14.3x 14.5x 14.6x 15.4x 15.5x 15.7x 16.2x 16.9x 17.1x 19.3x OFG OPB HTLF BHLB STBA TOWN LTXB FRME ABCB FCF SFNC YDKN RNST FCB BANF BRKL TLMR UBSH BPFH INDB CBF PRK CVBF EGBN FFIN Price / 2
Slide 22: Analysts Remain Bullish Post 1Q16 Earnings Release
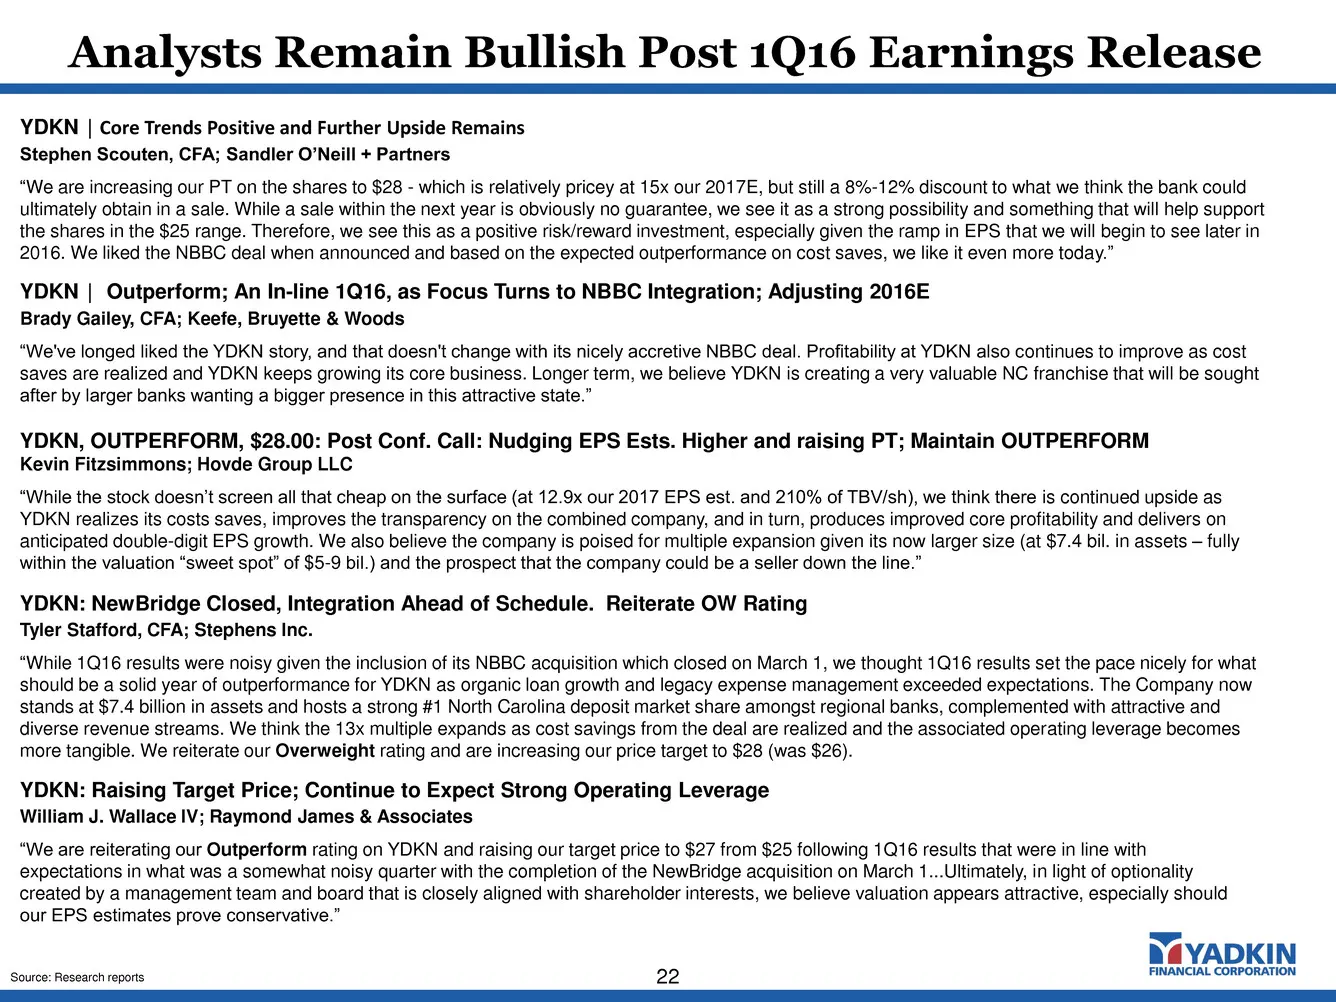
Analysts Remain Bullish Post 1Q16 Earnings Release 22 YDKN, OUTPERFORM, $28.00: Post Conf. Call: Nudging EPS Ests. Higher and raising PT; Maintain OUTPERFORM Kevin Fitzsimmons; Hovde Group LLC “While the stock doesn’t screen all that cheap on the surface (at 12.9x our 2017 EPS est. and 210% of TBV/s
Slide 23: Analyst Recommendations
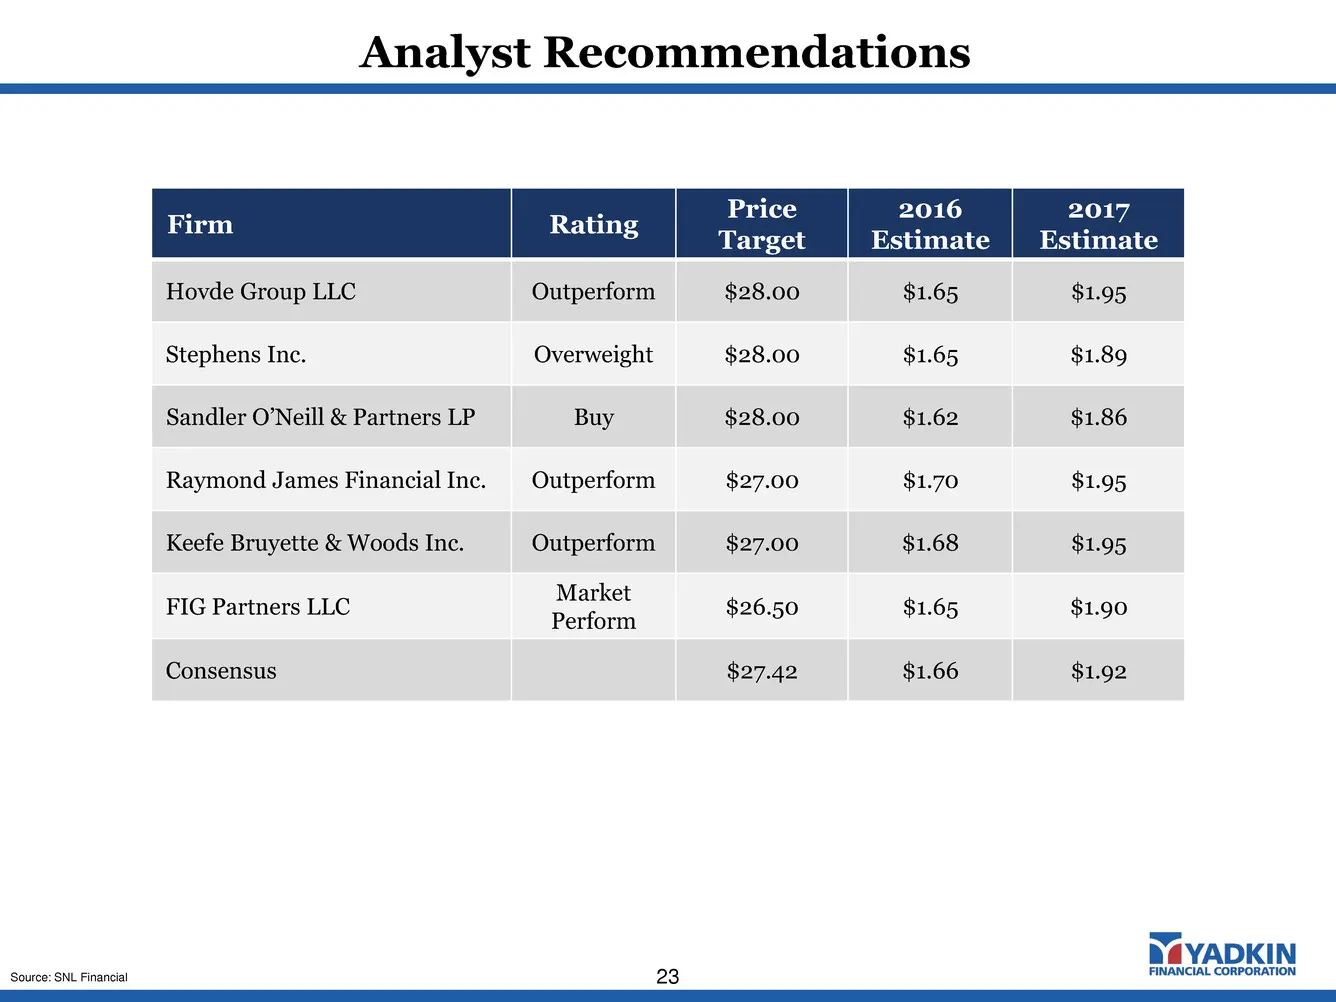
Analyst Recommendations 23 Firm Rating Price Target 2016 Estimate 2017 Estimate Hovde Group LLC Outperform $28.00 $1.65 $1.95 Stephens Inc. Overweight $28.00 $1.65 $1.89 Sandler O’Neill & Partners LP Buy $28.00 $1.62 $1.86 Raymond James Financial Inc. Outperform $27.00 $1.70 $1.95 Keefe Bruyette & W
Slide 24: Contact
Contact: Terry Earley (919) 659-9015 terry.earley@yadkinbank.com
Source: SEC EDGAR · 8-K filed May 2, 2016
More decks from Yadkin Financial Corp
 Merger or Acquisition (August 2016)38 slides · Aug 16, 2016
 Merger or Acquisition (July 2016)20 slides · Jul 21, 2016
 Q1 2016 Earnings Presentation10 slides · Apr 21, 2016
 Q4 2015 Earnings Presentation13 slides · Jan 28, 2016
 Q3 2015 Earnings Presentation29 slides · Nov 10, 2015
 Q3 2015 Earnings Presentation16 slides · Oct 22, 2015