Nick Scali Limited · ASX:NCK
Nick Scali — FY2010 Earnings Presentation
6 slides from Nick Scali's earnings presentation, 2010

Slide 1: Results Presentation
Results Presentation Year Ended 30 June 2010 (FY10)
Slide 2: Key points - FY10
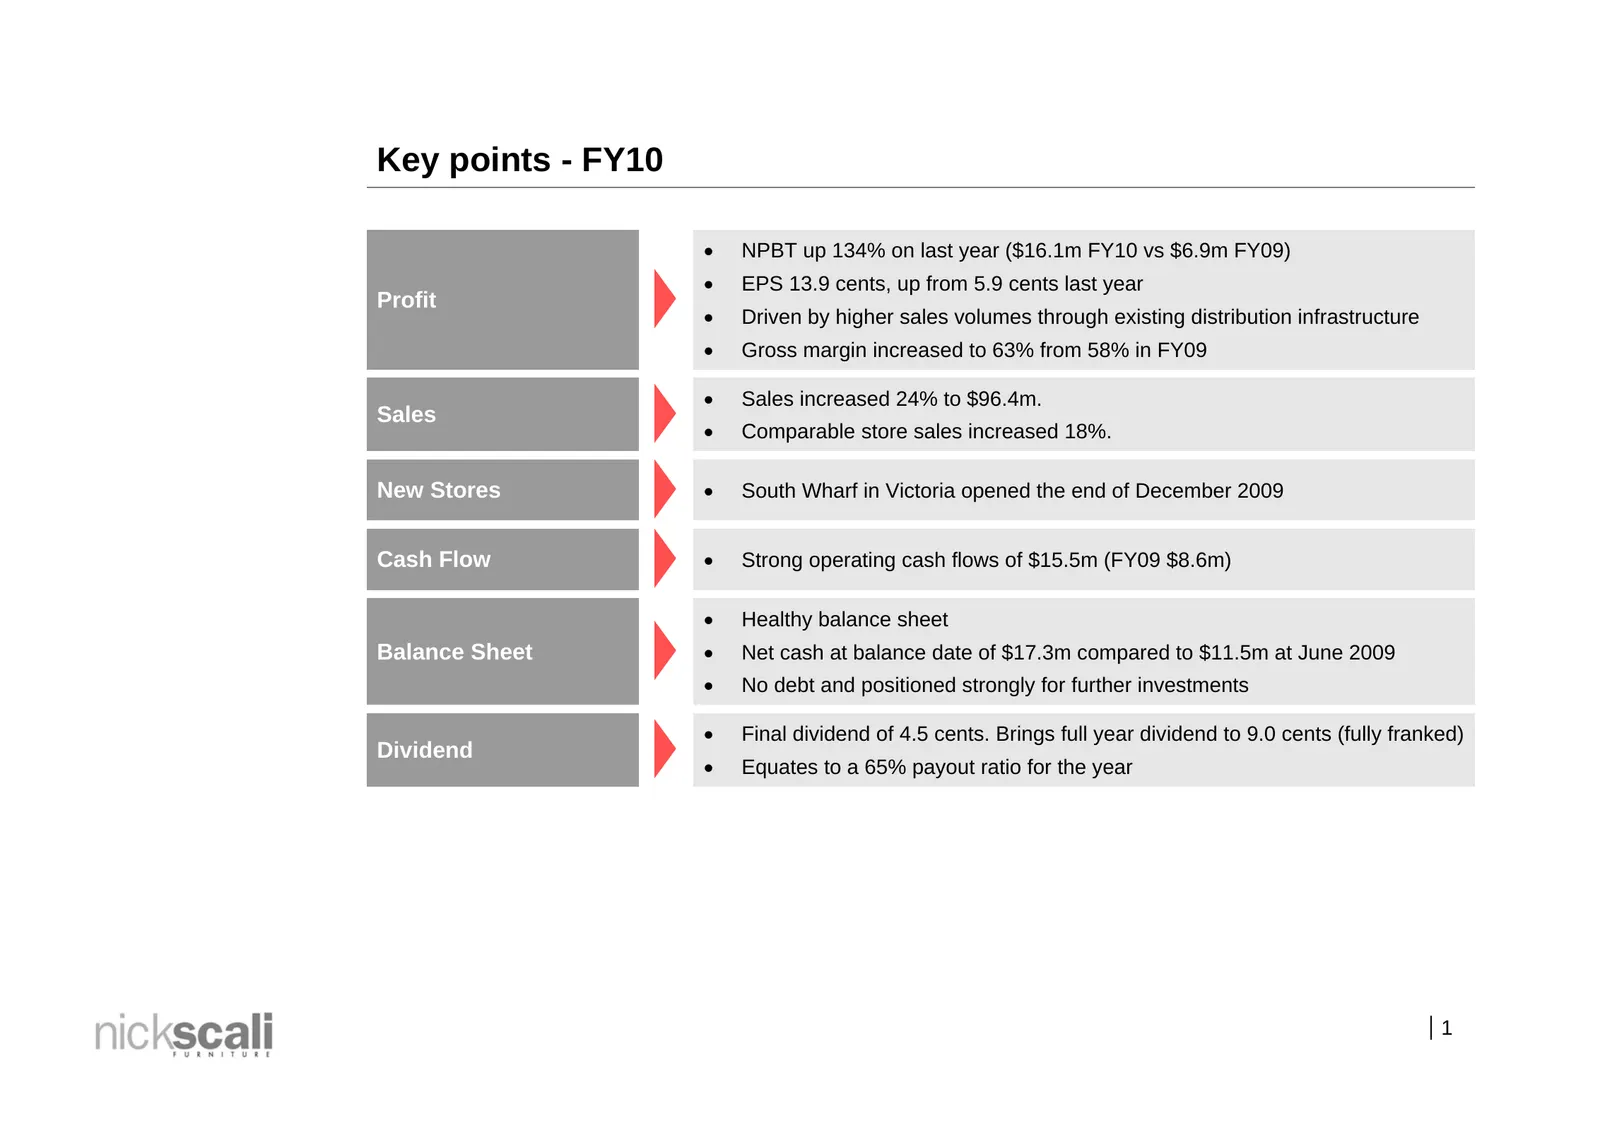
Key points - FY10 NPBT up 134% on last year ($16.1m FY10 vs $6.9m FY09) EPS 13.9 cents, up from 5.9 cents last year Profit Driven by higher sales volumes through existing distribution infrastructure Gross margin increased to 63% from 58% in FY09 Sales increased 24% to $96.4m. Sales Compa
Slide 3: Earnings Summary
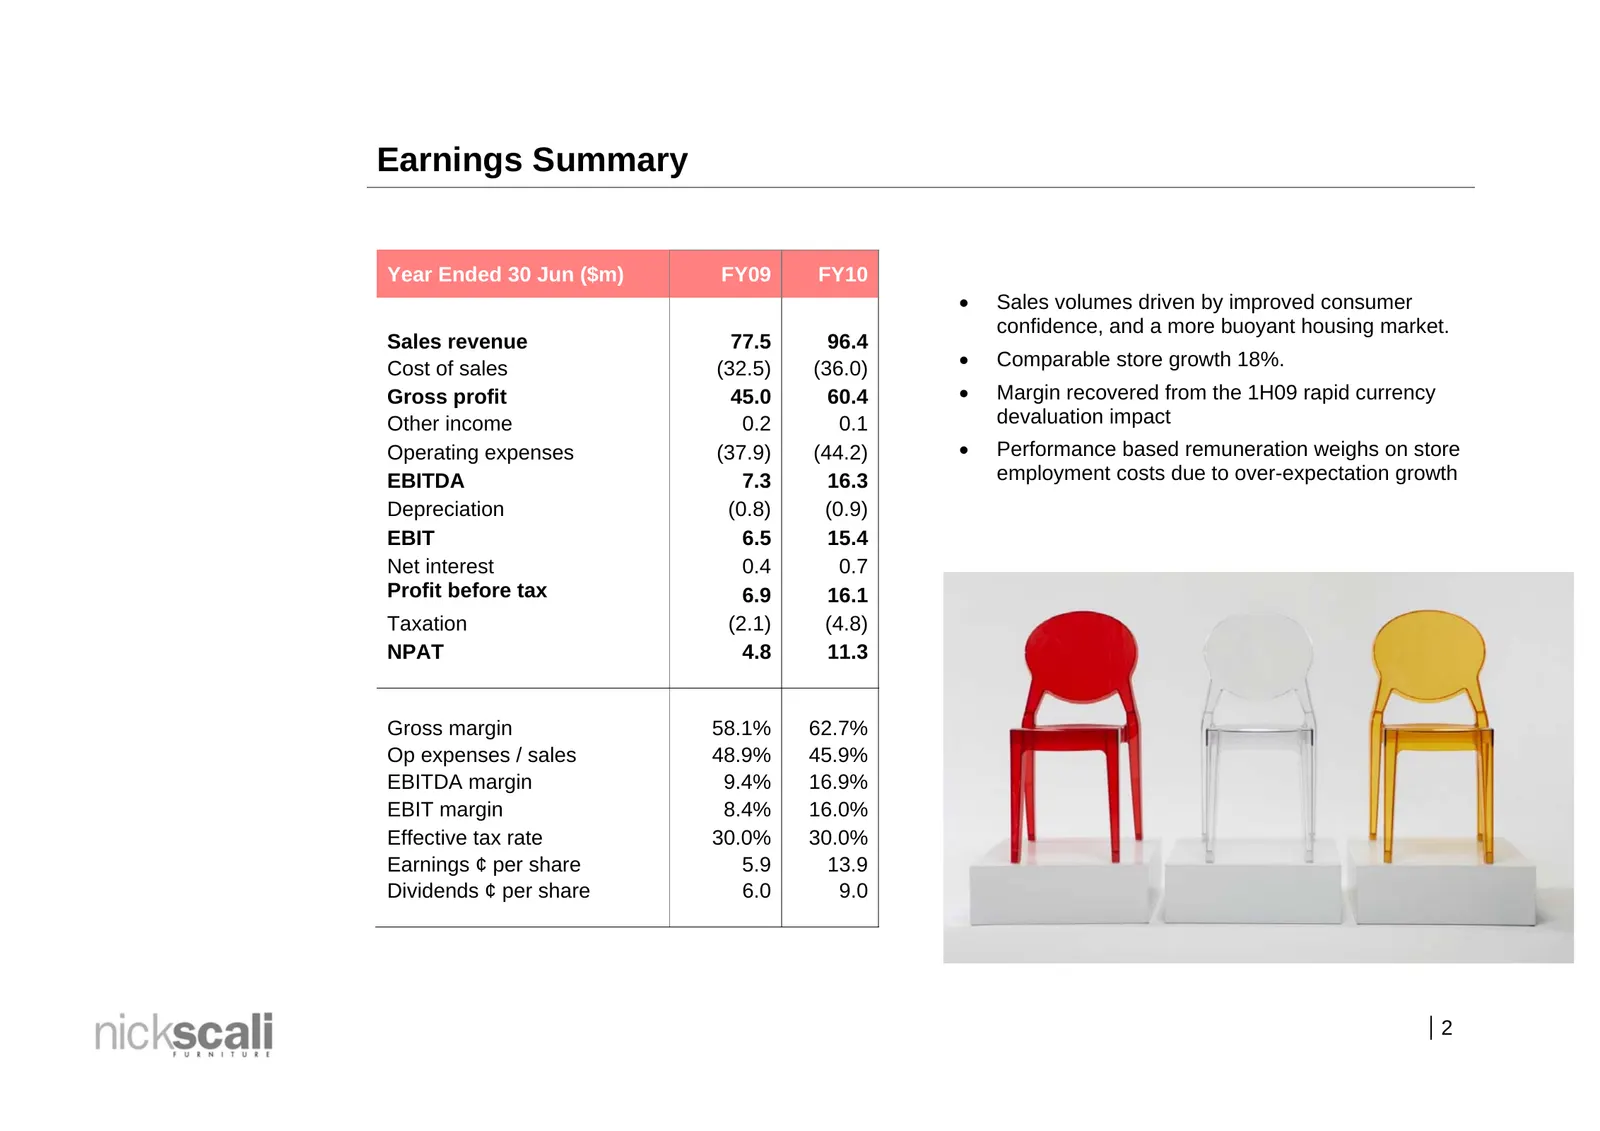
Earnings Summary Year Ended 30 Jun ($m) FY09 FY10 Sales volumes driven by improved consumer confidence, and a more buoyant housing market. Sales revenue 77.5 96.4 Cost of sales (32.5) (36.0) Comparable store growth 18%. Gross profit 45.0 60.4 Margin recovered from the 1H09 rapid currency Other
Slide 4: Cash flow
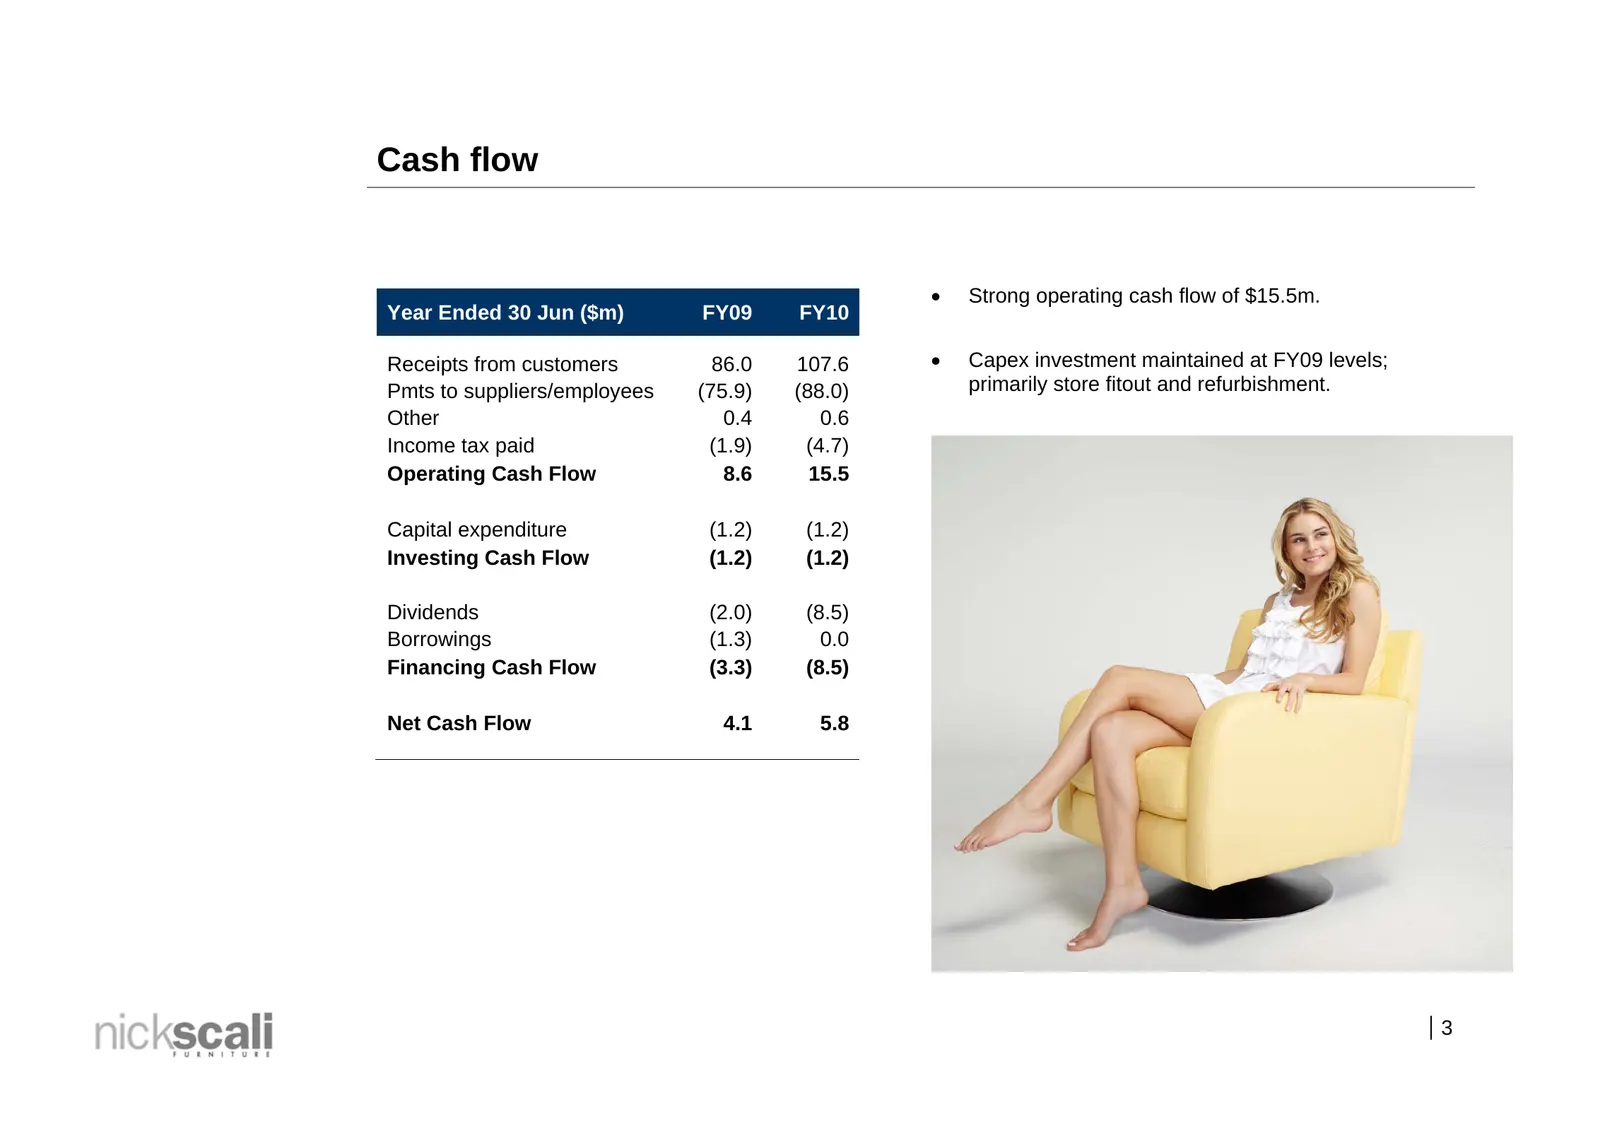
Cash flow Strong operating cash flow of $15.5m. Year Ended 30 Jun ($m) FY09 FY10 Receipts from customers 86.0 107.6 Capex investment maintained at FY09 levels; Pmts to suppliers/employees (75.9) (88.0) primarily store fitout and refurbishment. Other 0.4 0.6 Income tax paid (1.9) (4.7) Operating
Slide 5: Balance Sheet
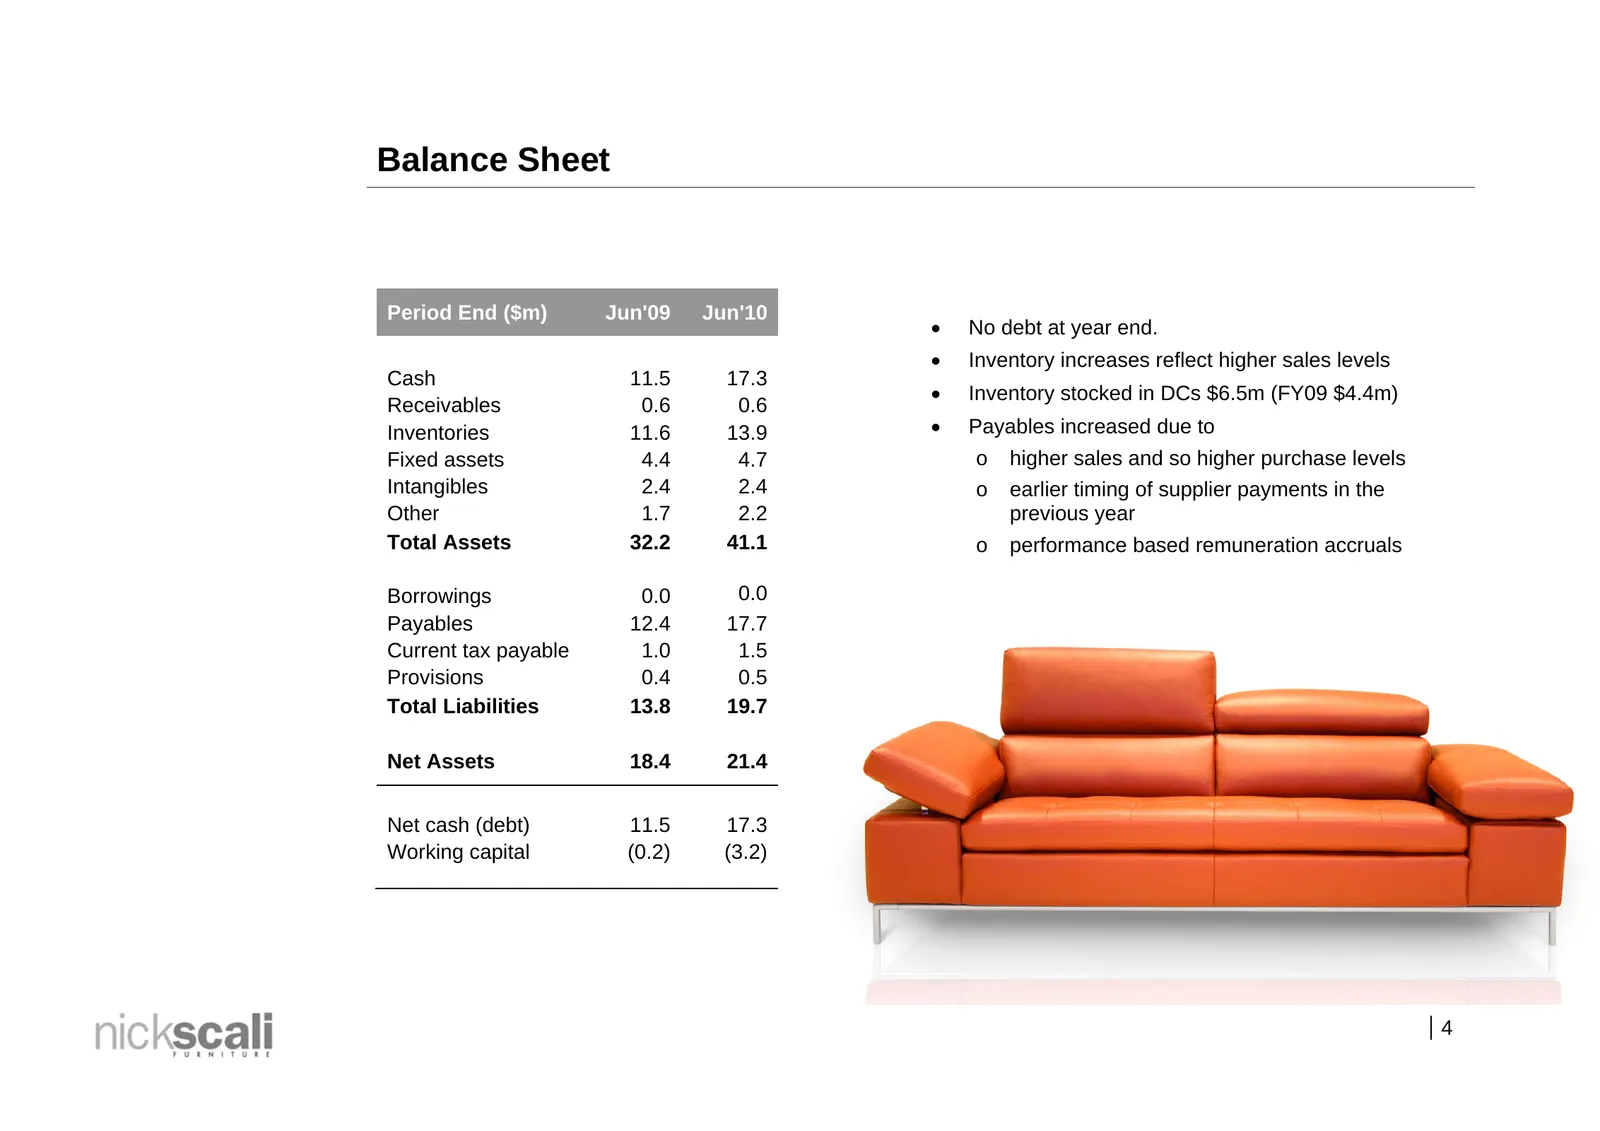
Balance Sheet Period End ($m) Jun'09 Jun'10 No debt at year end. Inventory increases reflect higher sales levels Cash 11.5 17.3 Inventory stocked in DCs $6.5m (FY09 $4.4m) Receivables 0.6 0.6 Inventories 11.6 13.9 Payables increased due to Fixed assets 4.4 4.7 o higher sales and so higher pu
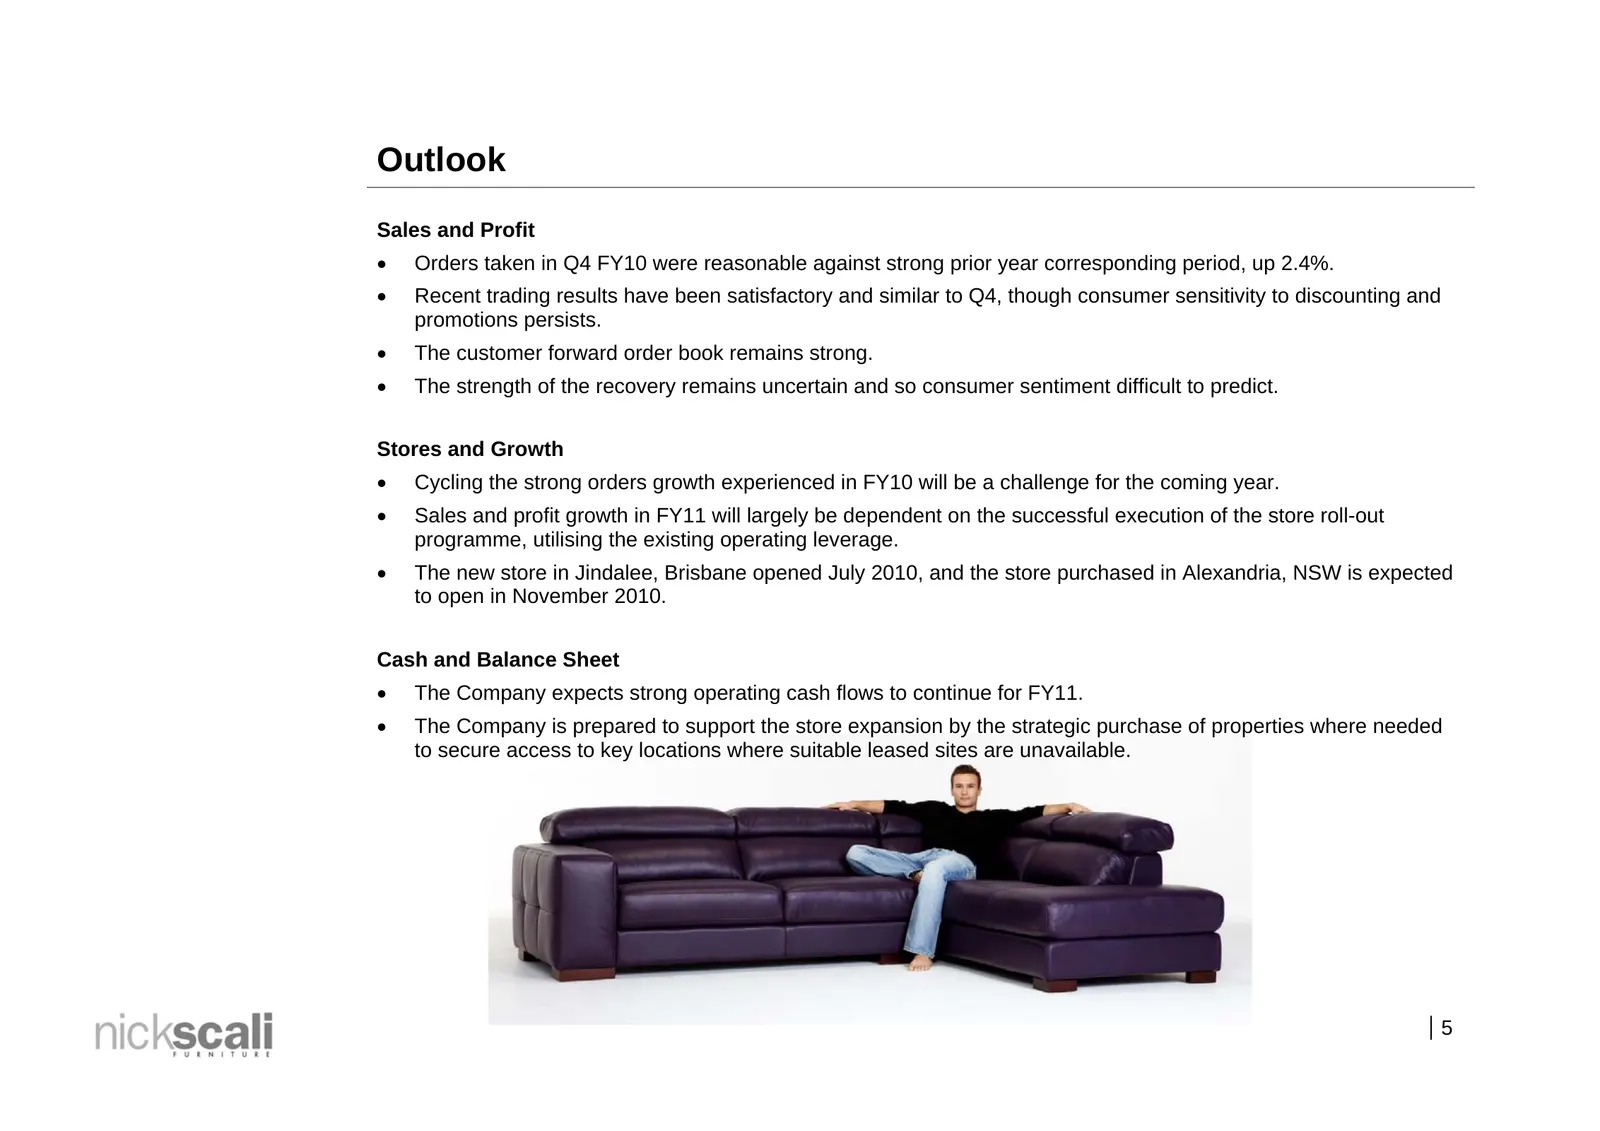
Slide 6: Outlook
Outlook Sales and Profit Orders taken in Q4 FY10 were reasonable against strong prior year corresponding period, up 2.4%. Recent trading results have been satisfactory and similar to Q4, though consumer sensitivity to discounting and promotions persists. The customer forward order book remains
Source: Internet Archive copy of nickscali.com.au
More decks from Nick Scali Limited
 FY2026 Earnings Presentation17 slides · Aug 7, 2026
 Investor Presentation (February 2026)16 slides · Feb 13, 2026
 FY2025 Earnings Presentation18 slides · Aug 8, 2025
 Investor Presentation (February 2025)17 slides · Feb 7, 2025
 FY2024 Earnings Presentation17 slides · Aug 9, 2024
 Investor Presentation (April 2024)42 slides · Apr 24, 2024