Compass Bancshares — Merger or Acquisition (September 2005)
26 slides from Compass Bancshares's merger presentation, Sep 19, 2005
Slide 1: Positioned in High-Growth Texas Markets
September 19, 2005 Positioned in High-Growth Texas Markets Filed by Compass Bancshares, Inc. Pursuant to Rule 425 under the Securities Act of 1933, as amended Subject Company: Compass Bancshares, Inc. Commission File No. 01-31272 Dated: September 19, 2005
Slide 2: Forward-Looking Statement Disclosure
Private Securities Litigation Reform Act of 1995 Forward-Looking Statement Disclosure This presentation contains forward-looking statements about Compass Bancshares, Inc. ("Compass"), TexasBanc Holding Co. ("TexasBanc") and/or the combined company that involve inherent risks and uncertainties. These
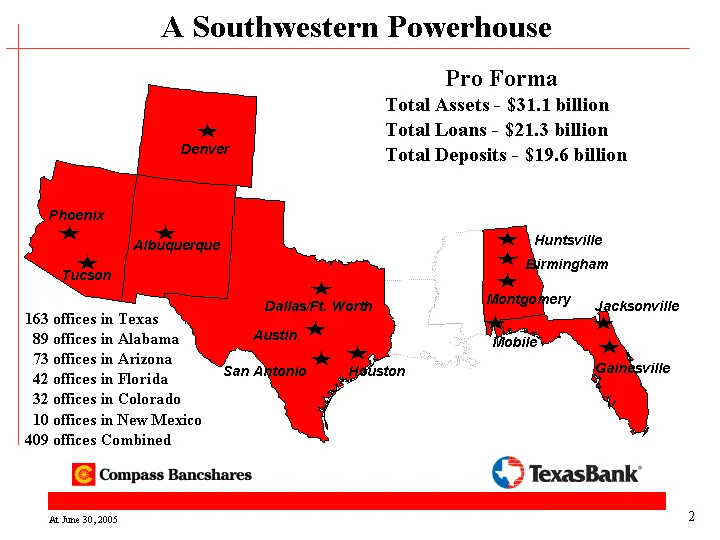
Slide 3: A Southwestern Powerhouse
Pro Forma Total Assets - $31.1 billion Total Loans - $21.3 billion Total Deposits - $19.6 billion Denver Albuquerque Tucson Phoenix San Antonio Austin Dallas/Ft. Worth Houston Mobile Montgomery Birmingham Gainesville Huntsville Jacksonville A Southwestern Powerhouse 163 offices in Texas 89 offices i
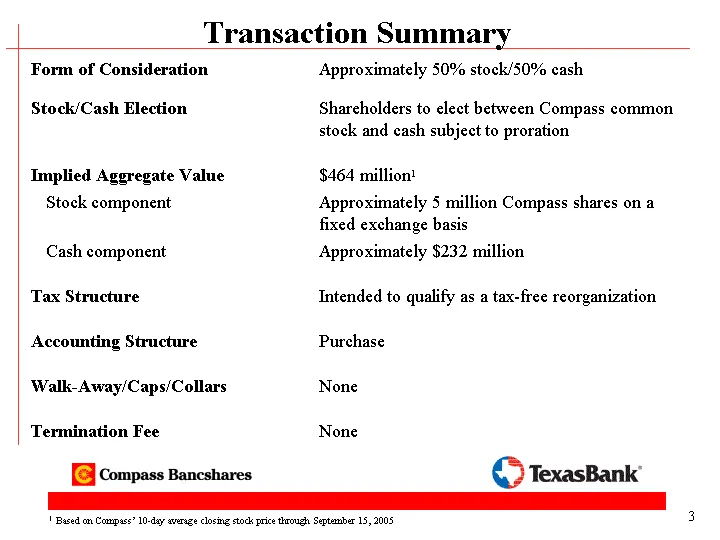
Slide 4: Transaction Summary
1 Based on Compass' 10-day average closing stock price through September 15, 2005 Form of Consideration Approximately 50% stock/50% cash Stock/Cash Election Shareholders to elect between Compass common stock and cash subject to proration Implied Aggregate Value $464 million1 Stock component Approxim
Slide 5: Transaction Summary
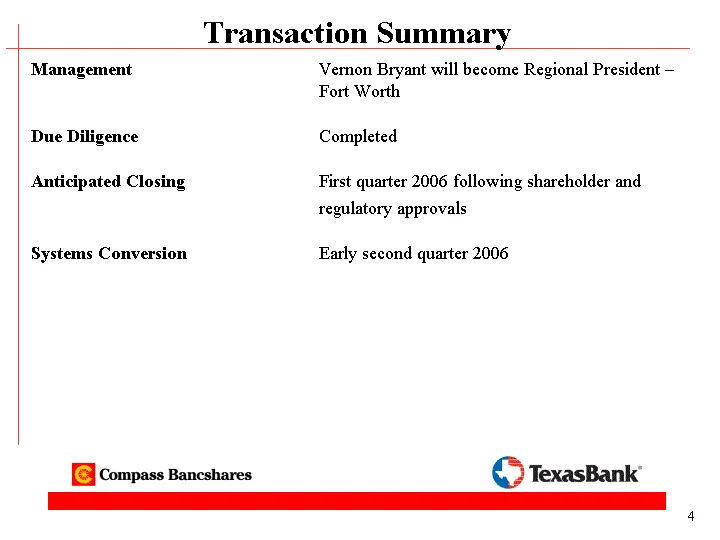
Transaction Summary Management Vernon Bryant will become Regional President - Fort Worth Due Diligence Completed Anticipated Closing First quarter 2006 following shareholder and regulatory approvals Systems Conversion Early second quarter 2006 4
Slide 6: Transaction Rationale
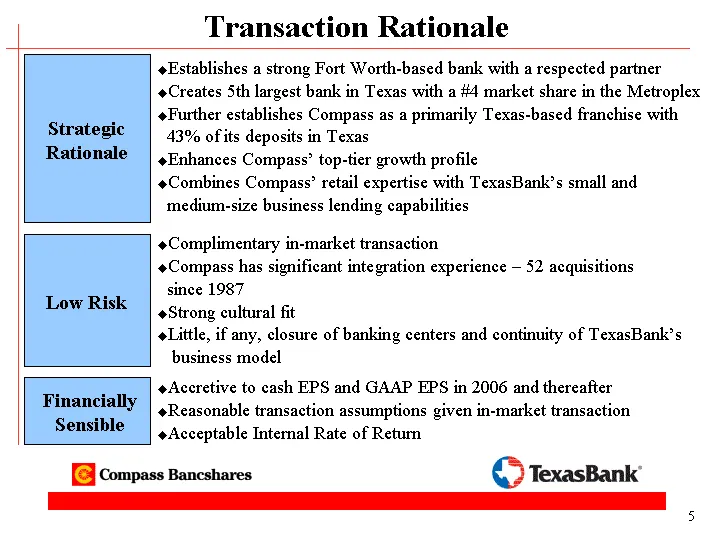
Transaction Rationale Strategic Rationale Financially Sensible Establishes a strong Fort Worth-based bank with a respected partner Creates 5th largest bank in Texas with a #4 market share in the Metroplex Further establishes Compass as a primarily Texas-based franchise with 43% of its deposits in Te
Slide 7: Overview of TexasBank
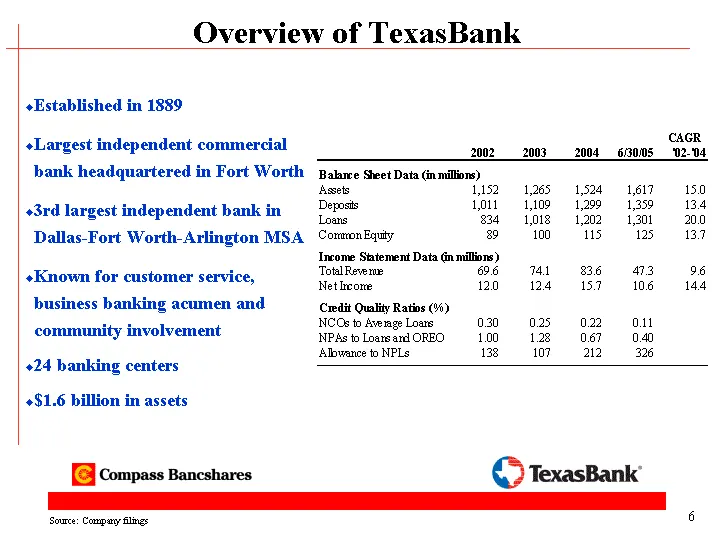
Overview of TexasBank Source: Company filings Established in 1889 Largest independent commercial bank headquartered in Fort Worth 3rd largest independent bank in Dallas-Fort Worth-Arlington MSA Known for customer service, business banking acumen and community involvement 24 banking centers $1.6 bill
Slide 8: Enhances Footprint in Metroplex and Creates Strong Fort Worth Bank
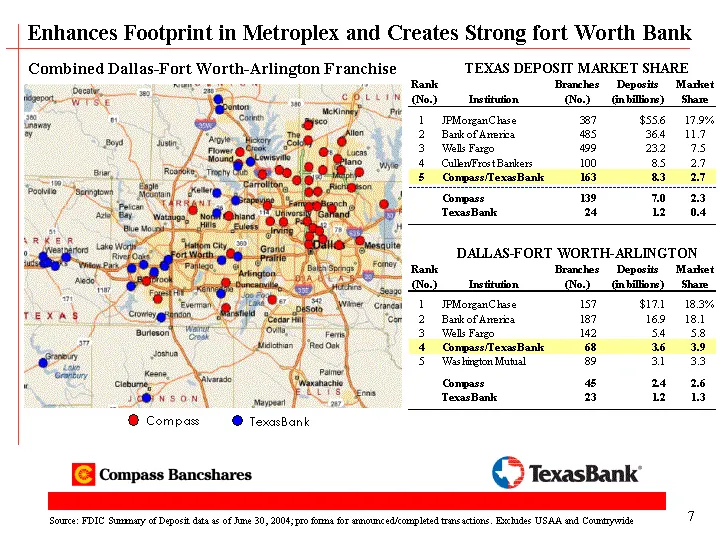
Enhances Footprint in Metroplex and Creates Strong fort Worth Bank Combined Dallas-Fort Worth-Arlington Franchise Source: FDIC Summary of Deposit data as of June 30, 2004; pro forma for announced/completed transactions. Excludes USAA and Countrywide 7
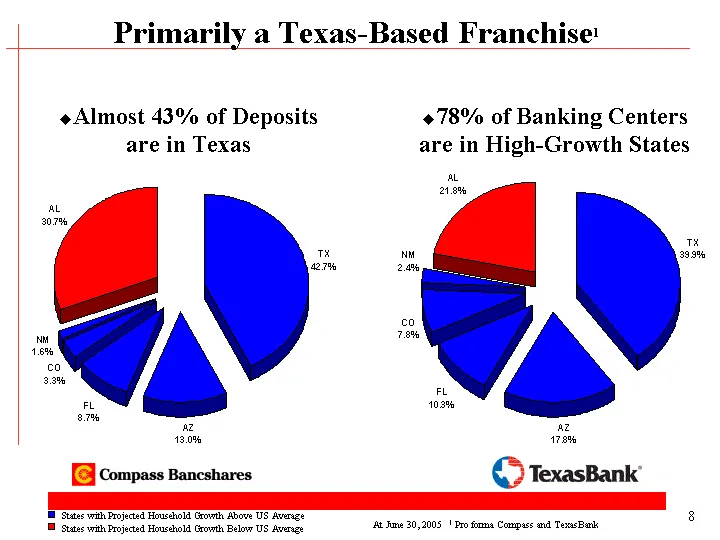
Slide 9: Primarily a Texas-Based Franchise
Primarily a Texas-Based Franchise1 Almost 43% of Deposits are in Texas TX AZ FL CO NM AL Deposits 0.427 0.13 0.087 0.033 0.016 0.307 TX AZ FL CO NM AL Deposits 0.399 0.178 0.103 0.078 0.024 0.218 78% of Banking Centers are in High-Growth States States with Projected Household Growth Above US Average
Slide 10: Texas - A Significant Growth Market
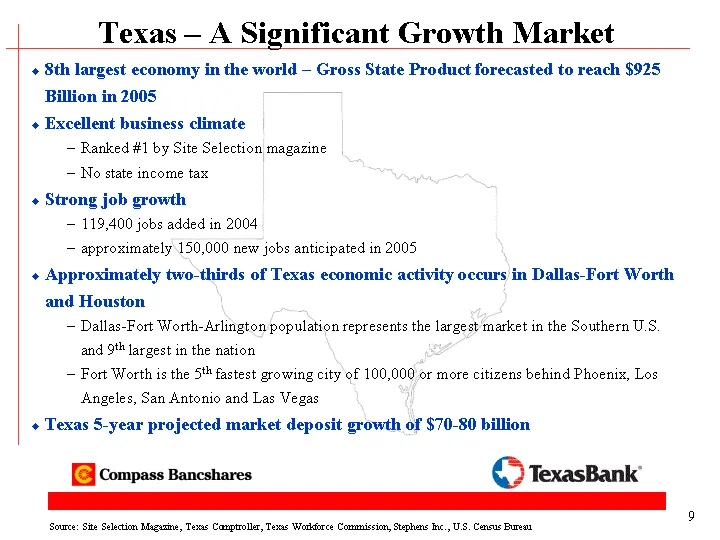
Texas - A Significant Growth Market 8th largest economy in the world - Gross State Product forecasted to reach $925 Billion in 2005 Excellent business climate Ranked #1 by Site Selection magazine No state income tax Strong job growth 119,400 jobs added in 2004 approximately 150,000 new jobs anticipa
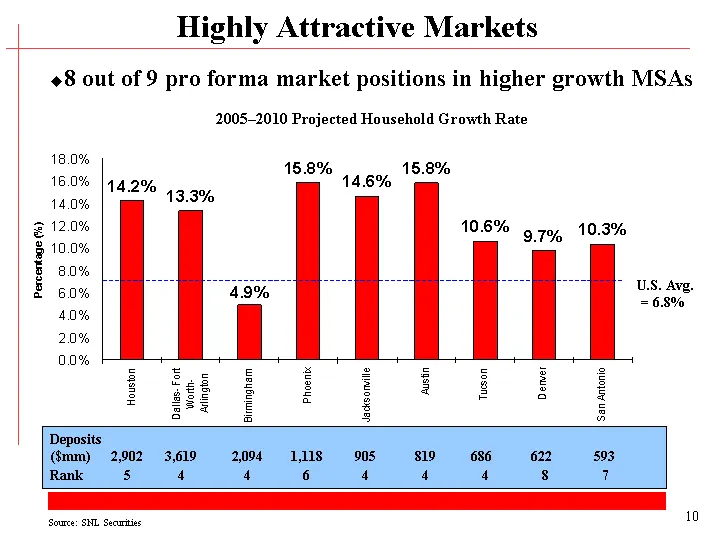
Slide 11: Highly Attractive Markets
Highly Attractive Markets 2005-2010 Projected Household Growth Rate Source: SNL Securities 8 out of 9 pro forma market positions in higher growth MSAs Houston Dallas- Fort Worth-Arlington Birmingham Phoenix Jacksonville Austin Tucson Denver San Antonio Huntsville 0.142 0.133 0.049 0.158 0.146 0.158
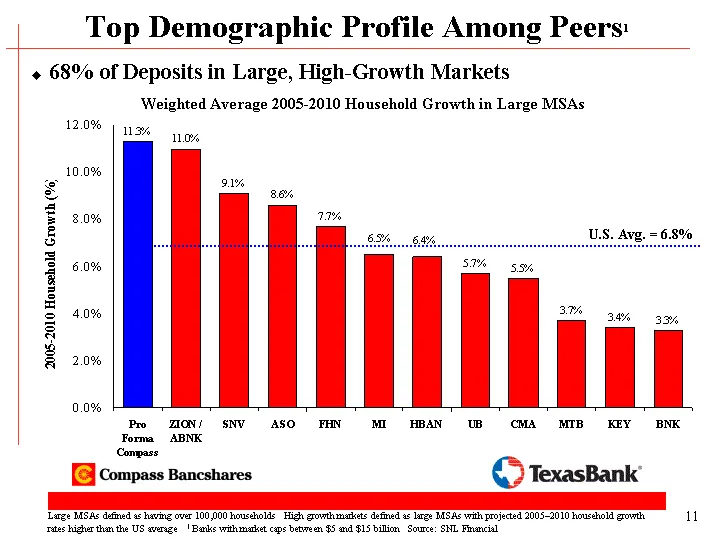
Slide 12: Top Demographic Profile Among Peers
Top Demographic Profile Among Peers1 Large MSAs defined as having over 100,000 households High growth markets defined as large MSAs with projected 2005-2010 household growth rates higher than the US average 1 Banks with market caps between $5 and $15 billion Source: SNL Financial Pro Forma Compass Z
Slide 13: Common Strengths
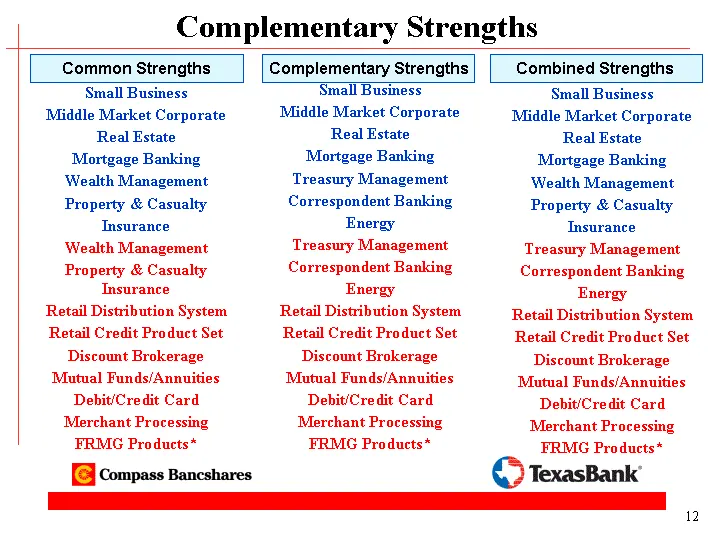
Common Strengths Small Business Middle Market Corporate Real Estate Mortgage Banking Wealth Management Property & Casualty Insurance Treasury Management Correspondent Banking Energy Retail Distribution System Retail Credit Product Set Discount Brokerage Mutual Funds/Annuities Debit/Credit Card Merch
Slide 14: Focused on Customer Service
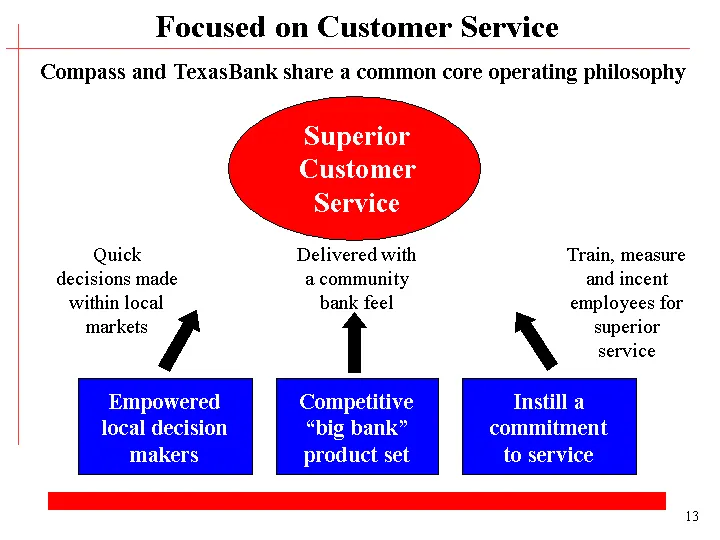
Focused on Customer Service Compass and TexasBank share a common core operating philosophy Superior Customer Service Competitive "big bank" product set Delivered with a community bank feel Empowered local decision makers Quick decisions made within local markets Instill a commitment to service Train
Slide 15: Low-Risk Transaction
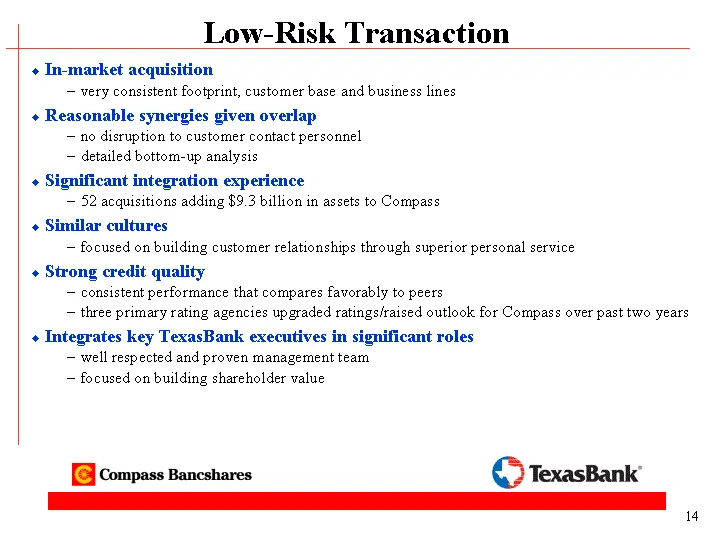
In-market acquisition very consistent footprint, customer base and business lines Reasonable synergies given overlap no disruption to customer contact personnel detailed bottom-up analysis Significant integration experience 52 acquisitions adding $9.3 billion in assets to Compass Similar cultures fo
Slide 16: Financial Assumptions
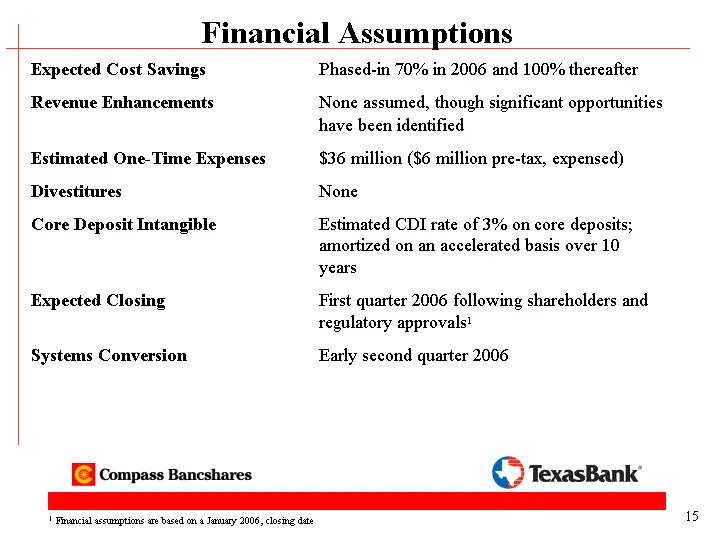
Expected Cost Savings Phased-in 70% in 2006 and 100% thereafter Revenue Enhancements None assumed, though significant opportunities have been identified Estimated One-Time Expenses $36 million ($6 million pre-tax, expensed) Divestitures None Core Deposit Intangible Estimated CDI rate of 3% on core d
Slide 17: Expected Financial Impact
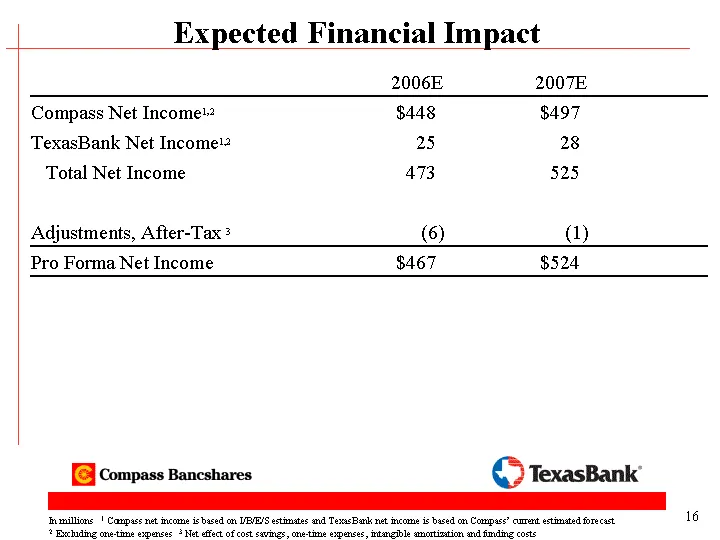
Expected Financial Impact 2006E 2007E Compass Net Income1,2 $448 $497 TexasBank Net Income1,2 25 28 Total Net Income 473 525 Adjustments, After-Tax 3 (6) (1) Pro Forma Net Income $467 $524 In millions 1 Compass net income is based on I/B/E/S estimates and TexasBank net income is based on Compass' cu
Slide 18: Expected Financial Impact
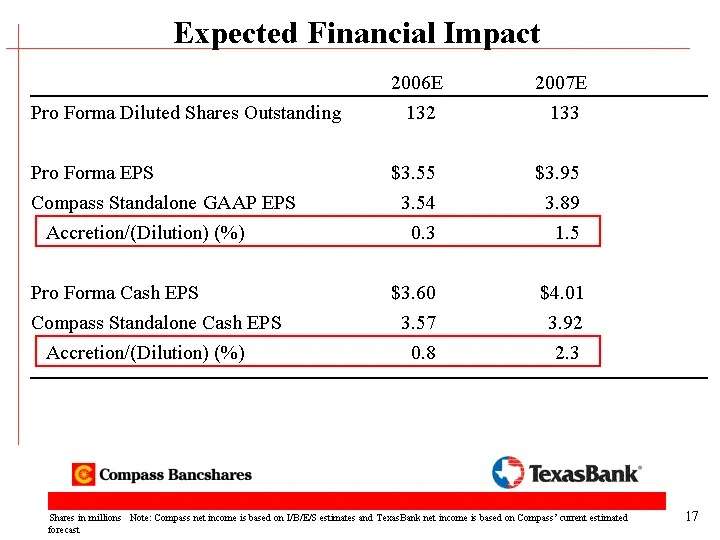
Expected Financial Impact 2006E 2007E Pro Forma Diluted Shares Outstanding 132 133 Pro Forma EPS $3.55 $3.95 Compass Standalone GAAP EPS 3.54 3.89 Accretion/(Dilution) (%) 0.3 1.5 Pro Forma Cash EPS $3.60 $4.01 Compass Standalone Cash EPS 3.57 3.92 Accretion/(Dilution) (%) 0.8 2.3 Shares in millions
Slide 19: Opportunity for Multiple Expansion
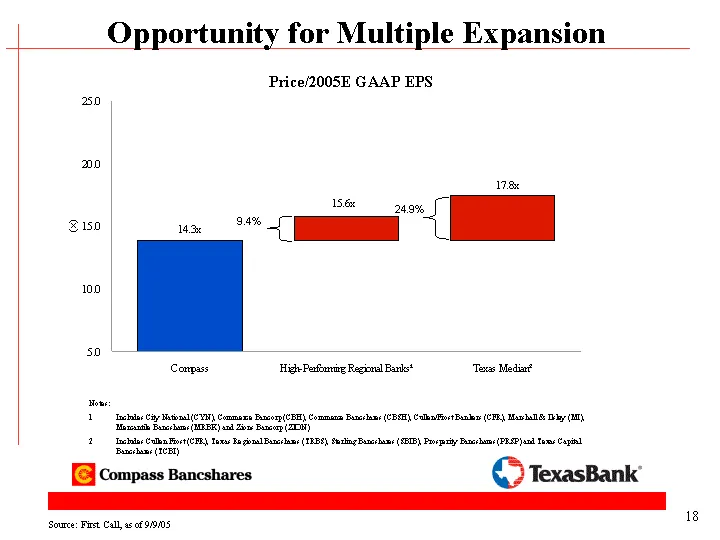
Opportunity for Multiple Expansion Price/2005E GAAP EPS Notes: 1 Includes City National (CYN), Commerce Bancorp (CBH), Commerce Bancshares (CBSH), Cullen/Frost Bankers (CFR), Marshall & Ilsley (MI), Mercantile Bancshares (MRBK) and Zions Bancorp (ZION) 2 Includes Cullen Frost (CFR), Texas Regional B
Slide 20: Proven Track Record
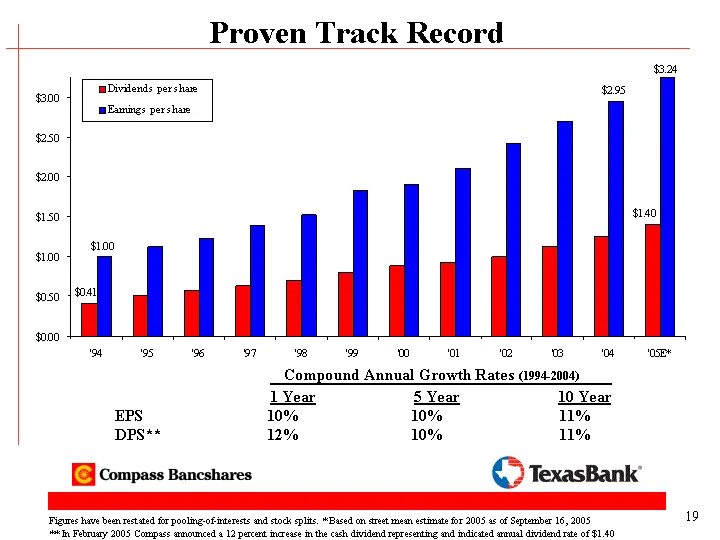
Compound Annual Growth Rates (1994-2004) 1 Year 5 Year 10 Year EPS 10% 10% 11% DPS** 12% 10% 11% '94 '95 '96 '97 '98 '99 '00 '01 '02 '03 '04 '05E* Dividends per share 0.41 0.5 0.57 0.63 0.7 0.8 0.88 0.92 1 1.12 1.25 1.4 Earnings per share 1 1.12 1.23 1.38 1.52 1.82 1.9 2.11 2.42 2.69 2.95 3.24 Prove
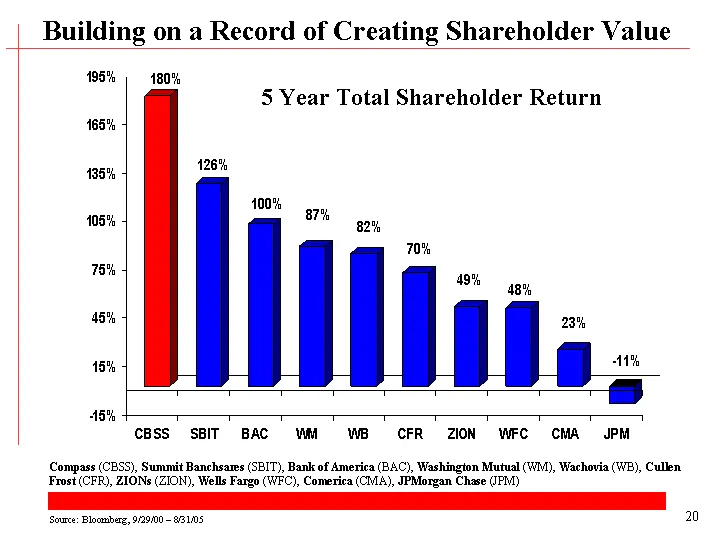
Slide 21: Building on a Record of Creating Shareholder Value
CBSS SBIT BAC WM WB CFR ZION WFC CMA JPM CBSS 1.7975 1.2594 1.003 0.8659 0.8247 0.7032 0.4939 0.4844 0.2298 -0.1079 Compass (CBSS), Summit Banchsares (SBIT), Bank of America (BAC), Washington Mutual (WM), Wachovia (WB), Cullen Frost (CFR), ZIONs (ZION), Wells Fargo (WFC), Comerica (CMA), JPMorgan Ch
Slide 22: A Southwestern Powerhouse Conclusion
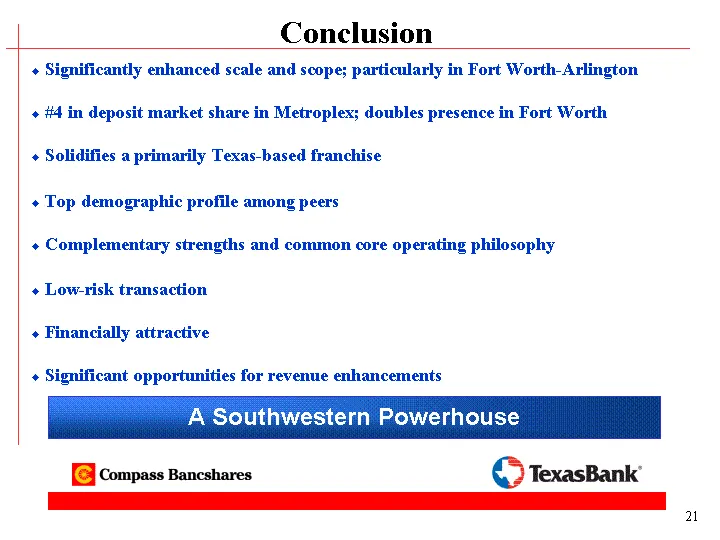
A Southwestern Powerhouse Conclusion Significantly enhanced scale and scope; particularly in Fort Worth-Arlington #4 in deposit market share in Metroplex; doubles presence in Fort Worth Solidifies a primarily Texas-based franchise Top demographic profile among peers Complementary strengths and commo
Slide 23: Appendix
Appendix
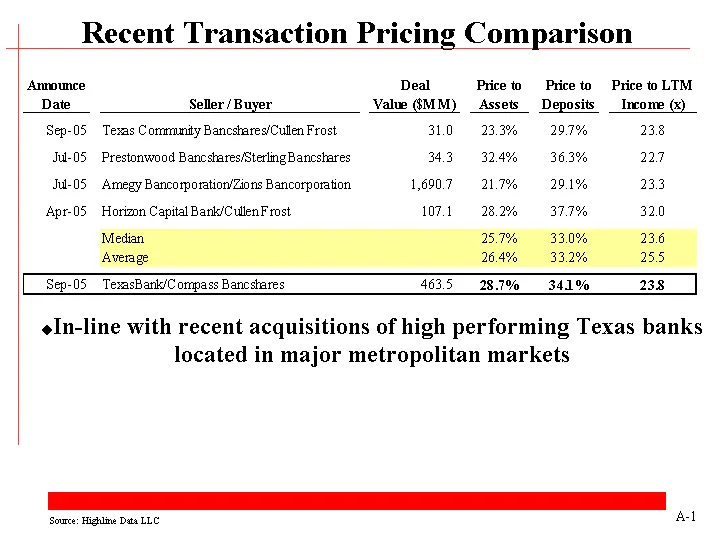
Slide 24: Recent Transaction Pricing Comparison
Recent Transaction Pricing Comparison Source: Highline Data LLC In-line with recent acquisitions of high performing Texas banks located in major metropolitan markets A-1
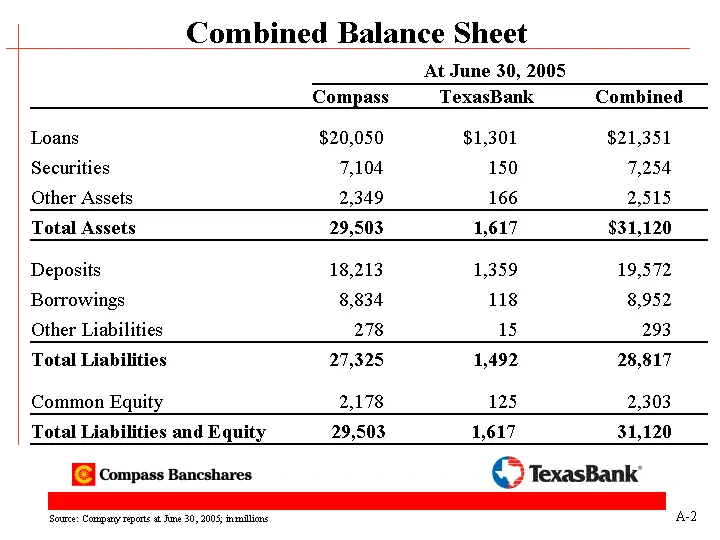
Slide 25: Combined Balance Sheet
Combined Balance Sheet At June 30, 2005 Compass TexasBank Combined Loans $20,050 $1,301 $21,351 Securities 7,104 150 7,254 Other Assets 2,349 166 2,515 Total Assets 29,503 1,617 $31,120 Deposits 18,213 1,359 19,572 Borrowings 8,834 118 8,952 Other Liabilities 278 15 293 Total Liabilities 27,325 1,49
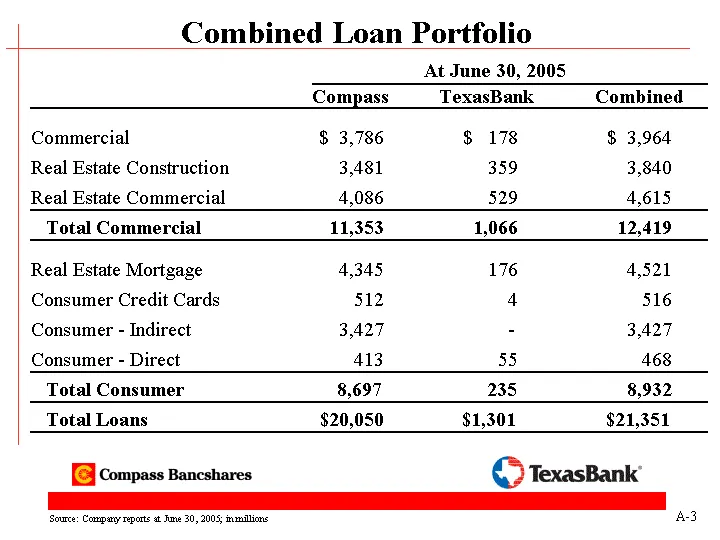
Slide 26: Combined Loan Portfolio
Combined Loan Portfolio Source: Company reports at June 30, 2005; in millions A-3 At June 30, 2005 Compass TexasBank Combined Commercial $ 3,786 $ 178 $ 3,964 Real Estate Construction 3,481 359 3,840 Real Estate Commercial 4,086 529 4,615 Total Commercial 11,353 1,066 12,419 Real Estate Mortgage 4,3
Source: SEC EDGAR · 425 filed Sep 19, 2005
More decks from Compass Bancshares Inc
 Compass Bancshares — Merger or Acquisition (June 2007)36 slides · Jun 21, 2007
 Compass Bancshares — Merger or Acquisition (May 2007)39 slides · May 1, 2007
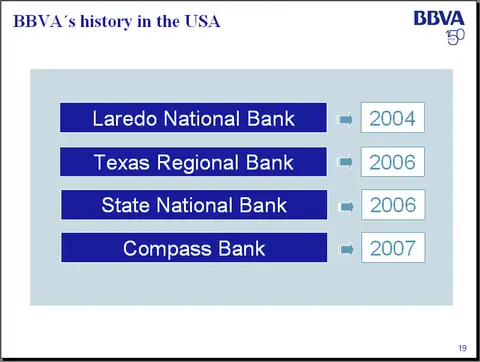 Compass Bancshares — Merger or Acquisition (March 2007)7 slides · Mar 29, 2007
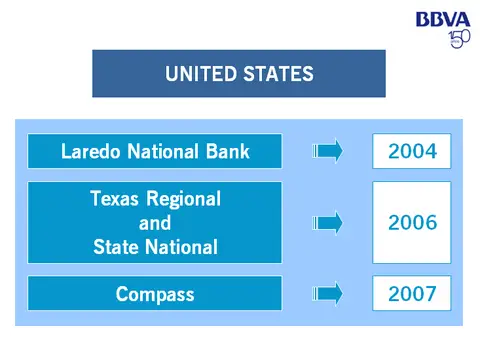 Compass Bancshares — Merger or Acquisition (March 2007)4 slides · Mar 19, 2007
 Q4 2005 Earnings Presentation25 slides · Jan 17, 2006
 Corporate Update (January 2006)7 slides · Jan 3, 2006