Compass Bancshares — Q4 2005 Earnings Presentation
25 slides from Compass Bancshares's earnings presentation, Jan 17, 2006
Slide 1: Fourth Quarter and Full-Year 2005 Review
Fourth Quarter and Full-Year 2005 Review January 17, 2006 Filed by Compass Bancshares, Inc. Pursuant to Rule 425 under the Securities Act of 1933, as amended Subject Company: TexasBanc Holding Co. Commission File No. 001-31272 Dated: January 17, 2006
Slide 2: Forward-Looking Statement Disclosure
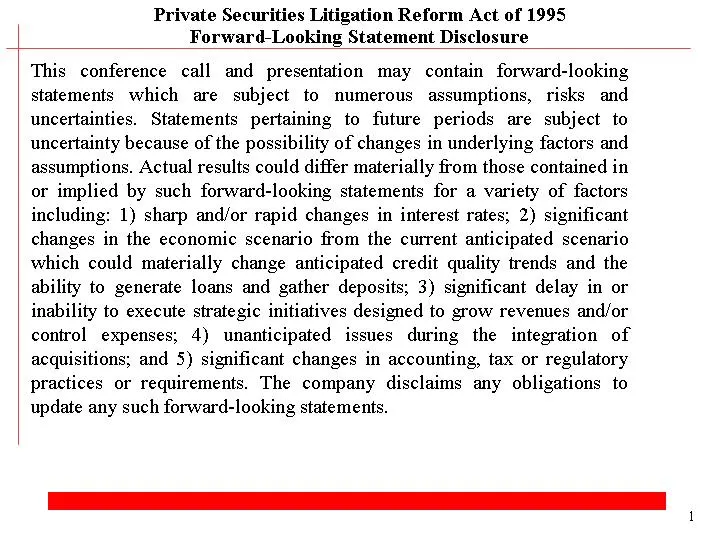
Private Securities Litigation Reform Act of 1995 Forward-Looking Statement Disclosure This conference call and presentation may contain forward-looking statements which are subject to numerous assumptions, risks and uncertainties. Statements pertaining to future periods are subject to uncertainty be
Slide 3: Fourth Quarter Discussion Outline
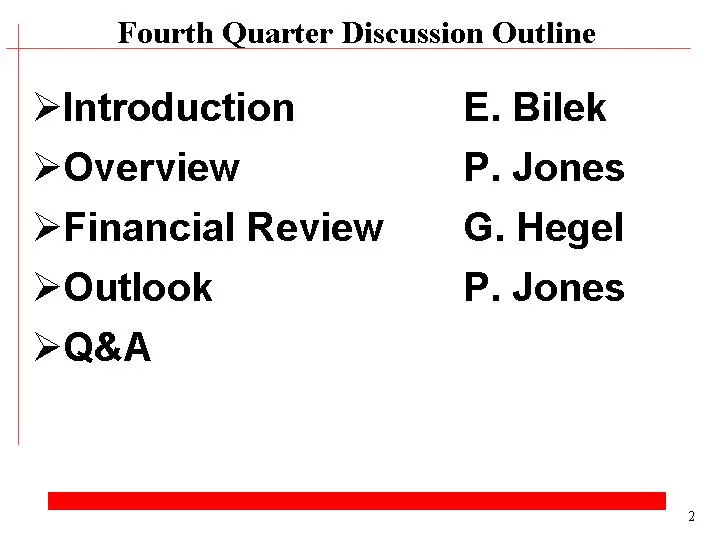
Introduction E. Bilek Overview P. Jones Financial Review G. Hegel Outlook P. Jones Q&A Fourth Quarter Discussion Outline 2
Slide 4: Overview
Overview Compass Bancshares, Inc. 3
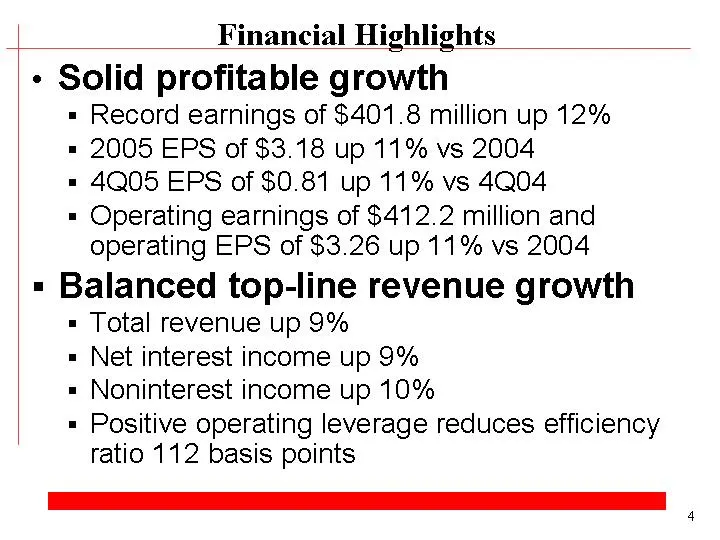
Slide 5: Financial Highlights: Solid profitable growth
Solid profitable growth Record earnings of $401.8 million up 12% 2005 EPS of $3.18 up 11% vs 2004 4Q05 EPS of $0.81 up 11% vs 4Q04 Operating earnings of $412.2 million and operating EPS of $3.26 up 11% vs 2004 Balanced top-line revenue growth Total revenue up 9% Net interest income up 9% Noninterest
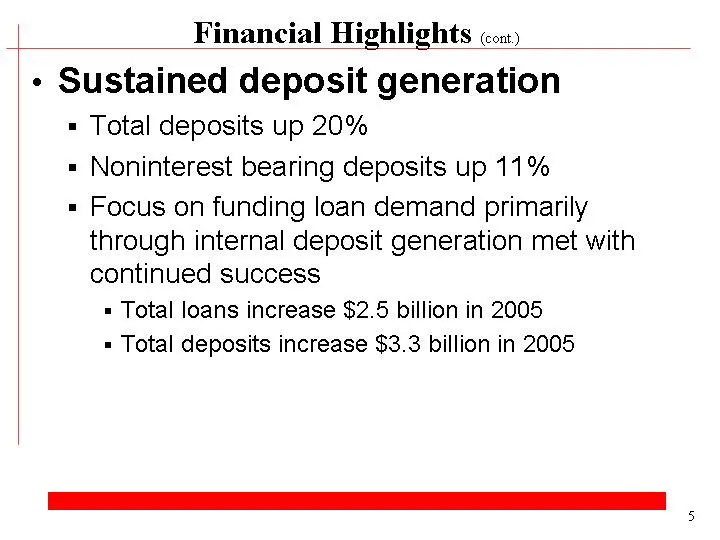
Slide 6: Financial Highlights (cont.): Sustained deposit generation
Sustained deposit generation Total deposits up 20% Noninterest bearing deposits up 11% Focus on funding loan demand primarily through internal deposit generation met with continued success Total loans increase $2.5 billion in 2005 Total deposits increase $3.3 billion in 2005 Financial Highlights (co
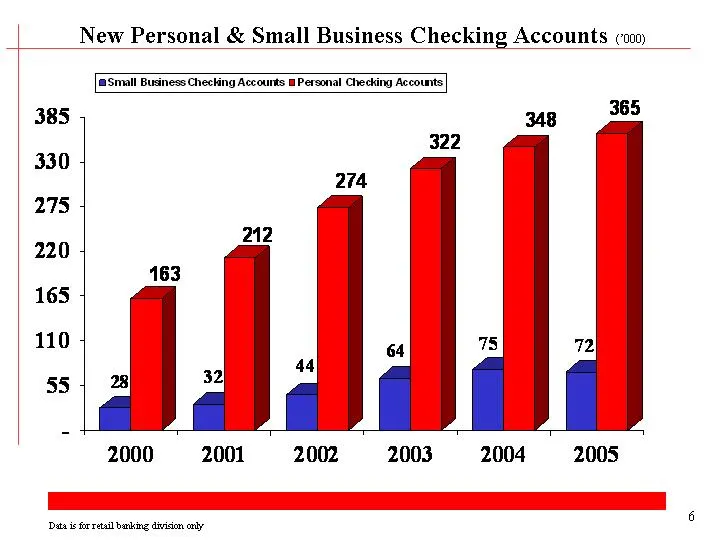
Slide 7: New Personal & Small Business Checking Accounts
Data is for retail banking division only New Personal & Small Business Checking Accounts ('000) 6 1997 1998 1999 2000 2001 2002 2003 2003* 2004 9 mo. '04 9 mo. '05 2005 Small Business Checking Accounts 2.934 27.857 32.458 43.607 64.435 75.315 58.413 56.021 71.753 Personal Checking Accounts -12532 28
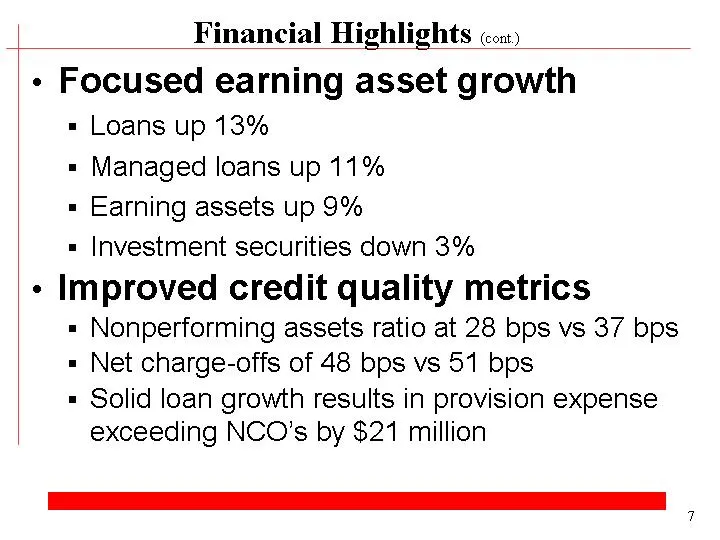
Slide 8: Financial Highlights (cont.): Focused earning asset growth
Focused earning asset growth Loans up 13% Managed loans up 11% Earning assets up 9% Investment securities down 3% Improved credit quality metrics Nonperforming assets ratio at 28 bps vs 37 bps Net charge-offs of 48 bps vs 51 bps Solid loan growth results in provision expense exceeding NCO's by $21 m
Slide 9: 2005 Accomplishments
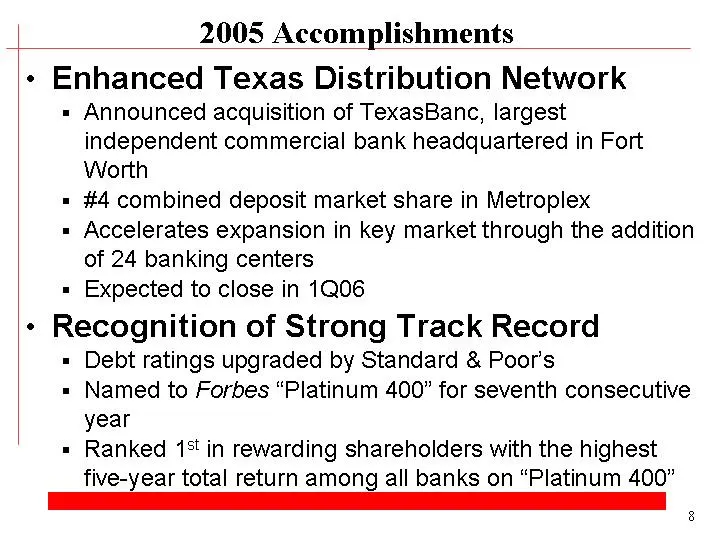
2005 Accomplishments 8 Enhanced Texas Distribution Network Announced acquisition of TexasBanc, largest independent commercial bank headquartered in Fort Worth #4 combined deposit market share in Metroplex Accelerates expansion in key market through the addition of 24 banking centers Expected to clos
Slide 10: Financial Review
Financial Review Compass Bancshares, Inc. 9
Slide 11: Summary Income Statement
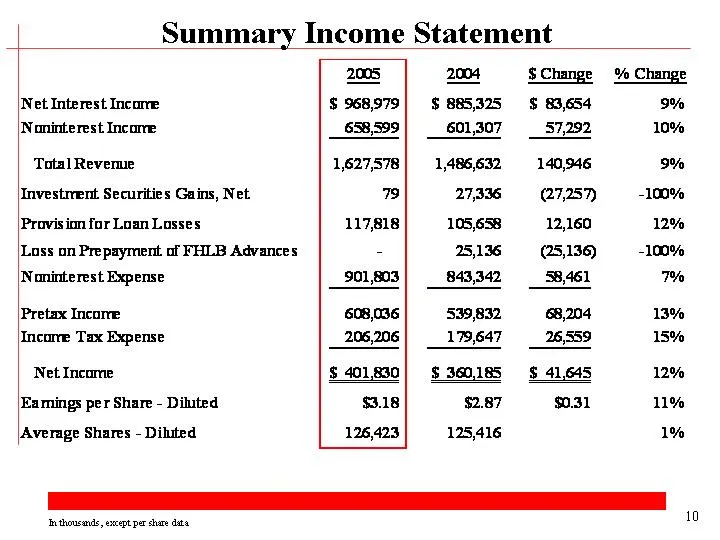
Summary Income Statement In thousands, except per share data 10
Slide 12: Interest Rate Sensitivity
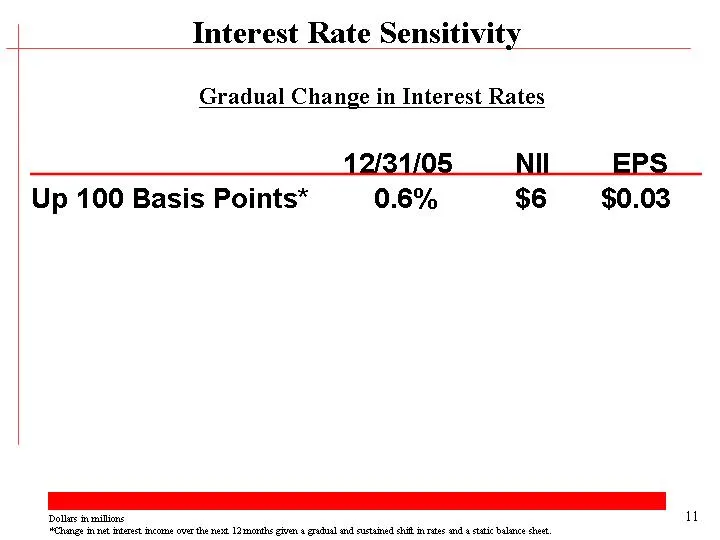
12/31/05 NII EPS Up 100 Basis Points* 0.6% $6 $0.03 Interest Rate Sensitivity Dollars in millions *Change in net interest income over the next 12 months given a gradual and sustained shift in rates and a static balance sheet. Gradual Change in Interest Rates 11
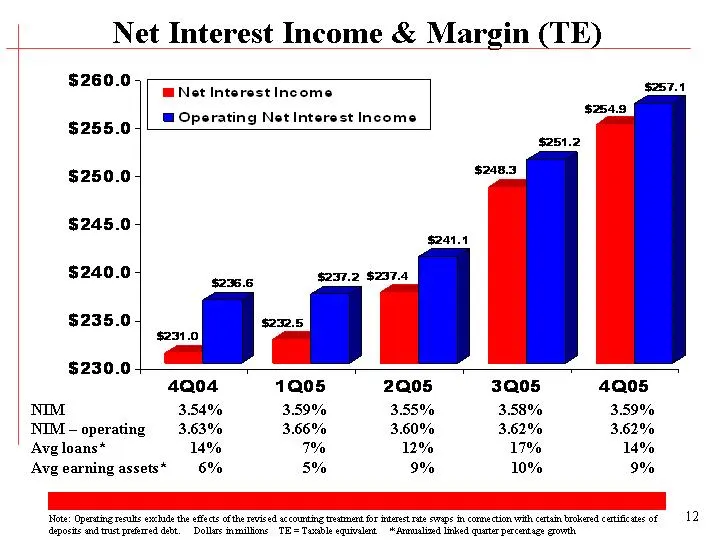
Slide 13: Net Interest Income & Margin (TE)
Net Interest Income & Margin (TE) 3Q99 4Q99 1Q00 2Q00 3Q00 4Q00 1Q01 2Q01 3Q01 4Q01 1Q02 2Q02 3Q02 4Q02 1Q03 2Q03 3Q03 4Q03 1Q04 2Q04 3Q04 4Q04 1Q05 2Q05 3Q05 4Q05 Net Interest Income 167539 169513 173782 182888 182386 184427 189246 202400 210378 228883 234.937 229.779 231.799 232.743 228.22 224.269
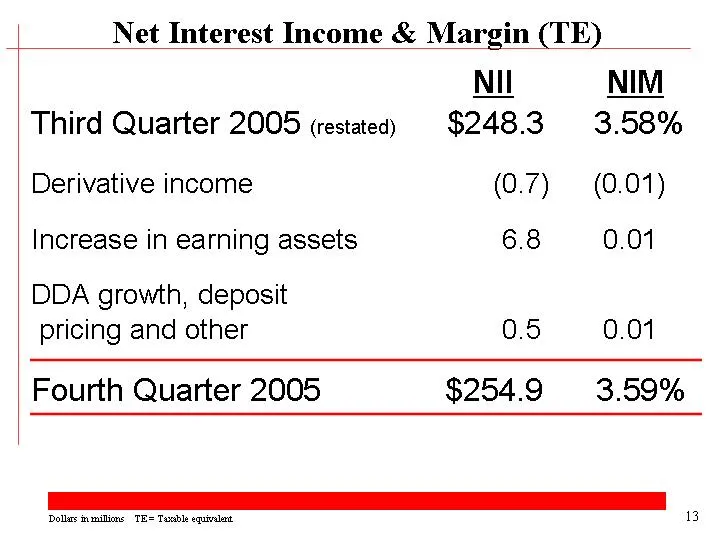
Slide 14: Net Interest Income & Margin (TE) Change
NII NIM Third Quarter 2005 (restated) $248.3 3.58% Derivative income (0.7) (0.01) Increase in earning assets 6.8 0.01 DDA growth, deposit pricing and other 0.5 0.01 Fourth Quarter 2005 $254.9 3.59% Net Interest Income & Margin (TE) Dollars in millions TE = Taxable equivalent 13
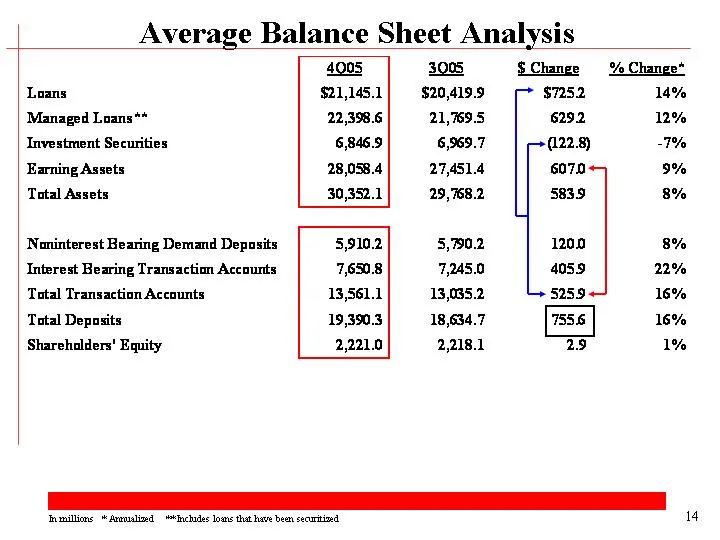
Slide 15: Average Balance Sheet Analysis
Average Balance Sheet Analysis In millions * Annualized ** Includes loans that have been securitized 14
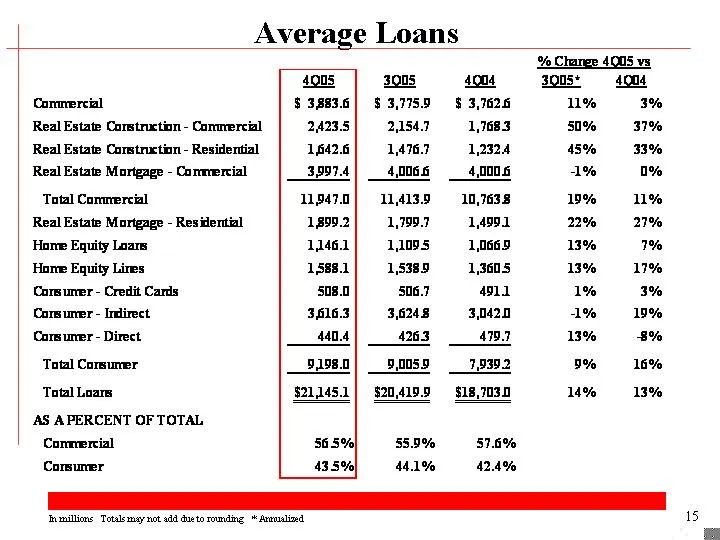
Slide 16: Average Loans
Average Loans In millions Totals may not add due to rounding * Annualized 15
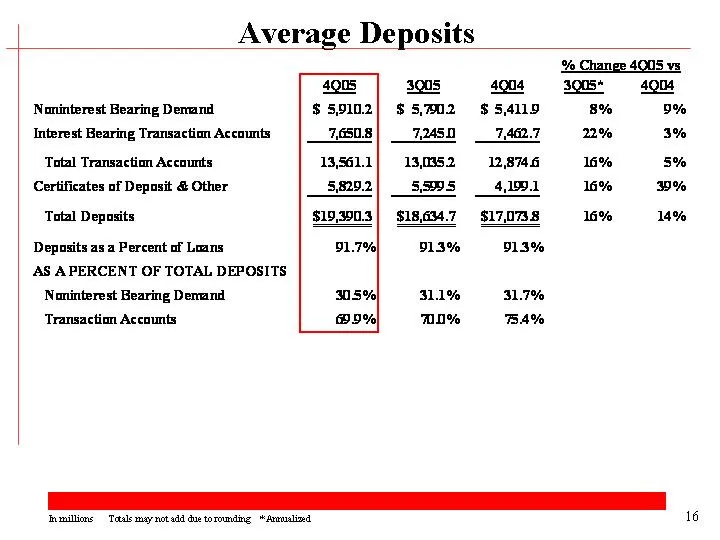
Slide 17: Average Deposits
Average Deposits In millions Totals may not add due to rounding * Annualized 16
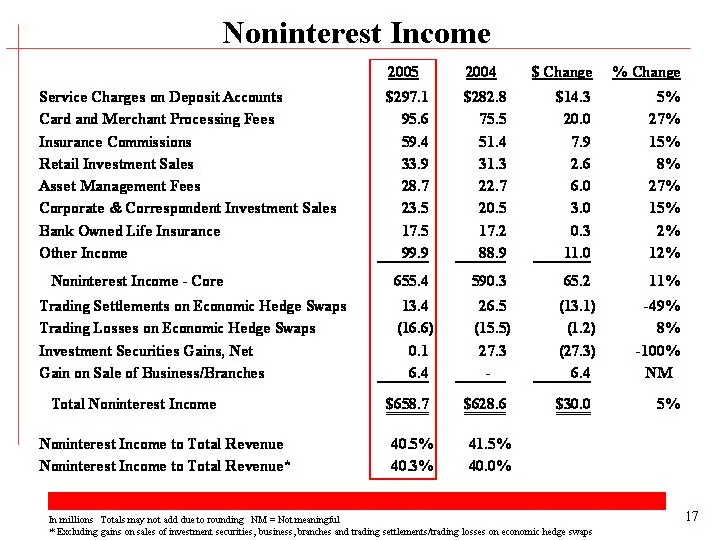
Slide 18: Noninterest Income
Noninterest Income In millions Totals may not add due to rounding NM = Not meaningful * Excluding gains on sales of investment securities, business, branches and trading settlements/trading losses on economic hedge swaps 17
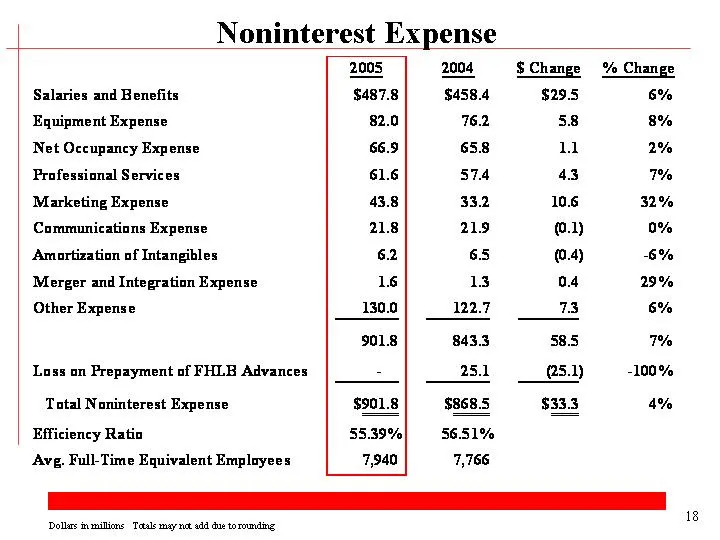
Slide 19: Noninterest Expense
Noninterest Expense Dollars in millions Totals may not add due to rounding 18
Slide 20: Asset Quality Review
Asset Quality Review Compass Bancshares, Inc. 19
Slide 21: Asset Quality - NPAs
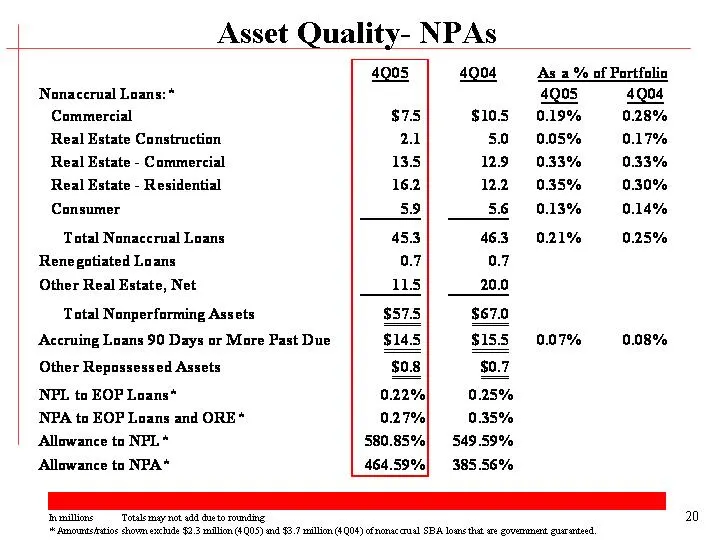
Asset Quality- NPAs In millions Totals may not add due to rounding * Amounts/ratios shown exclude $2.3 million (4Q05) and $3.7 million (4Q04) of nonaccrual SBA loans that are government guaranteed. 20
Slide 22: Asset Quality - Net Charge-Offs
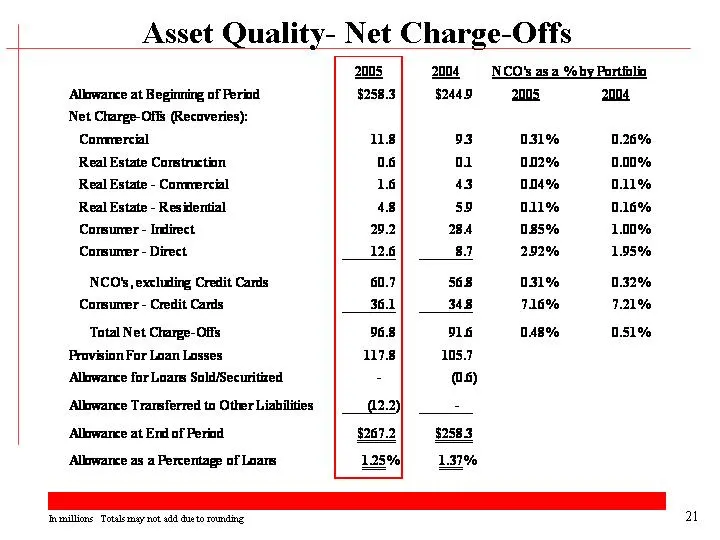
Asset Quality- Net Charge-Offs In millions Totals may not add due to rounding 21
Slide 23: Outlook
Outlook Compass Bancshares, Inc. 22
Slide 24: 2006 Expectations
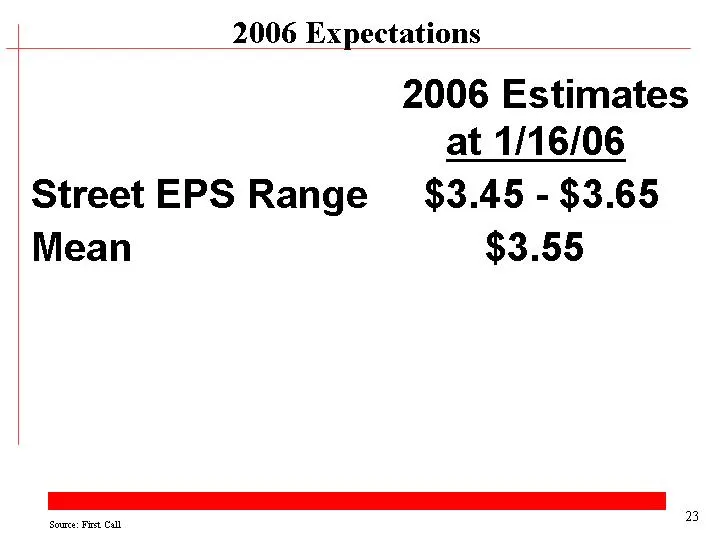
2006 Expectations 2006 Estimates at 1/16/06 Street EPS Range $3.45 - $3.65 Mean $3.55 Source: First Call 23
Slide 25: Question and Answer Session
Question and Answer Session Compass Bancshares, Inc. 24
Source: SEC EDGAR · 425 filed Jan 17, 2006
More decks from Compass Bancshares Inc
 Compass Bancshares — Merger or Acquisition (June 2007)36 slides · Jun 21, 2007
 Compass Bancshares — Merger or Acquisition (May 2007)39 slides · May 1, 2007
 Compass Bancshares — Merger or Acquisition (March 2007)7 slides · Mar 29, 2007
 Compass Bancshares — Merger or Acquisition (March 2007)4 slides · Mar 19, 2007
 Corporate Update (January 2006)7 slides · Jan 3, 2006
 Merger or Acquisition (November 2005)36 slides · Nov 15, 2005