Compass Bancshares — Corporate Update (January 2006)
7 slides from Compass Bancshares's corporate update, Jan 3, 2006
Slide 1: Restatement of Financial Statements Resulting From SFAS 133 Technical Clarification
Restatement of Financial Statements Resulting From a Technical Clarification of Statement of Financial Accounting Standards 133, Accounting for Derivative Instruments and Hedging Activities January 3, 2006
Slide 2: Forward-Looking Statement Disclosure
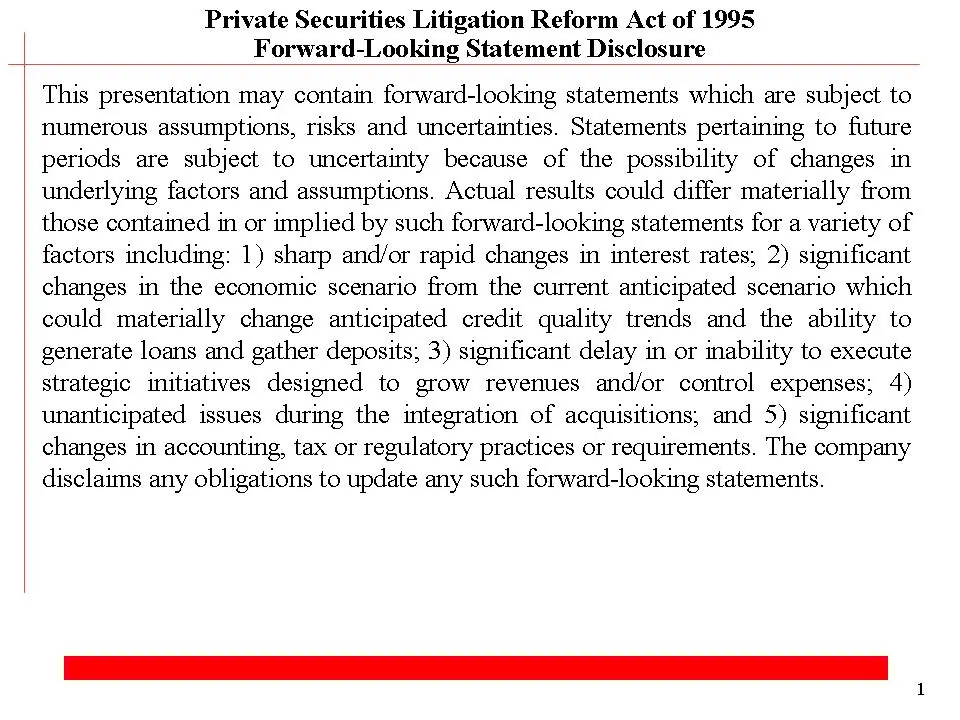
Private Securities Litigation Reform Act of 1995 Forward-Looking Statement Disclosure This presentation may contain forward-looking statements which are subject to numerous assumptions, risks and uncertainties. Statements pertaining to future periods are subject to uncertainty because of the possibi
Slide 3: Effect on Growth Rates
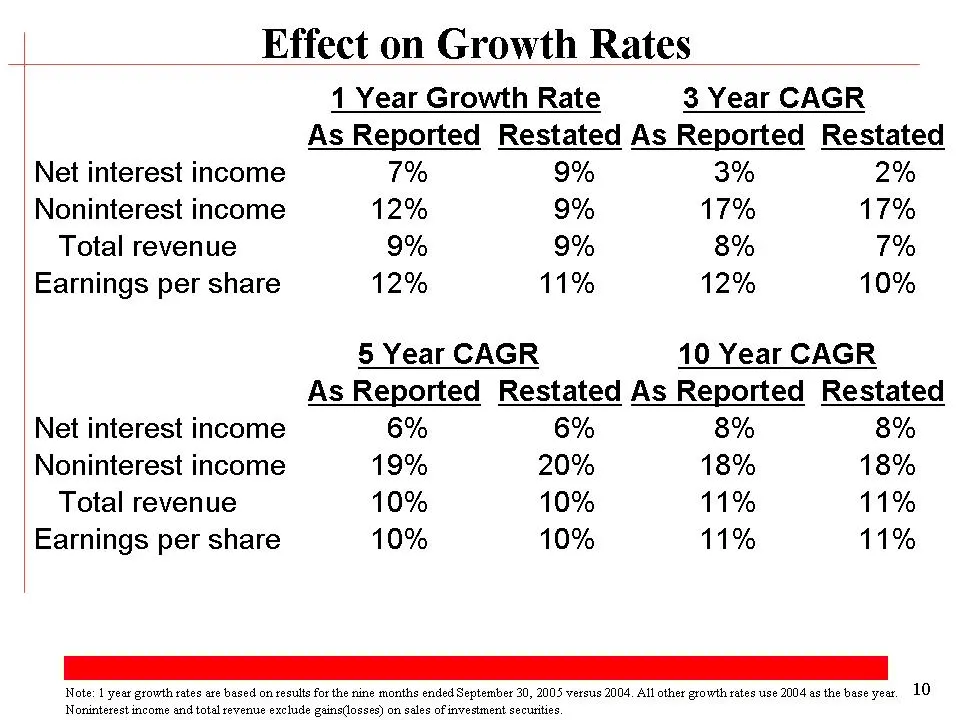
Effect on Growth Rates 1 Year Growth Rate 3 Year CAGR As Reported Restated As Reported Restated Net interest income 7 % 9 % 3 % 2 % Noninterest income 12 % 9 % 17 % 17 % Total revenue 9 % 9 % 8 % 7 % Earnings per share 12 % 11 % 12 % 10 % 5 Year CAGR 10 Year CAGR As Reported Restated As Reported Res
Slide 4: Net Interest Margin - Dollar
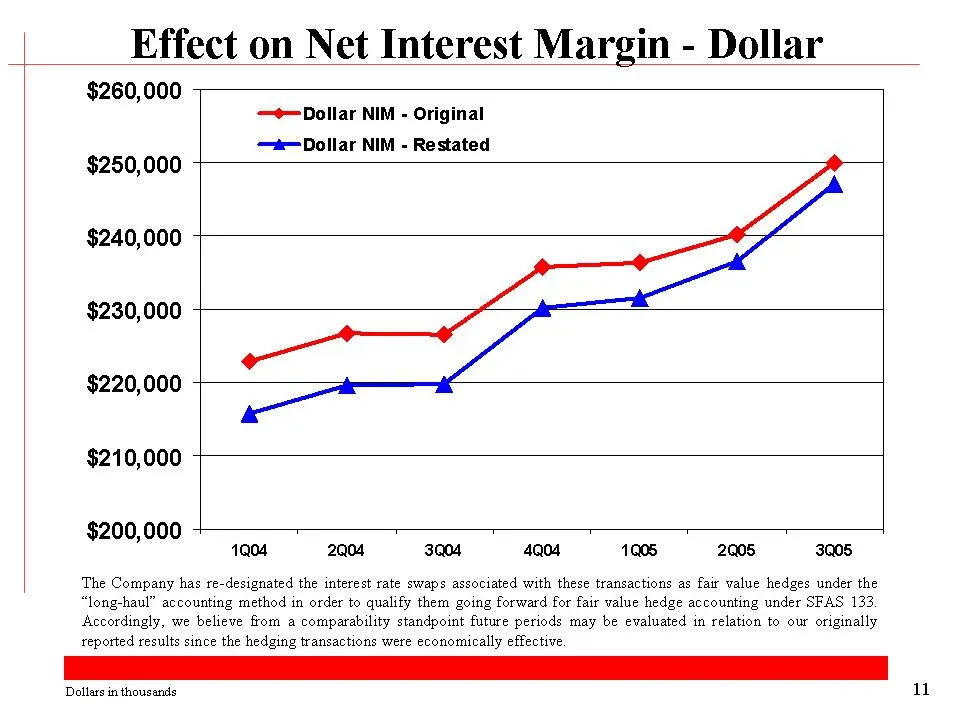
Effect on Net Interest Margin - Dollar 1Q02 2Q02 3Q02 4Q02 1Q03 2Q03 3Q03 4Q03 1Q04 2Q04 3Q04 4Q04 1Q05 2Q05 3Q05 Dollar NIM - Original 233772 228556 230805 231722 227245 223329 230258 228698 222861 226739 226531 235697 236276 240186 249940 Dollar NIM - Restated 231279 222576 223611 224243 219377 21
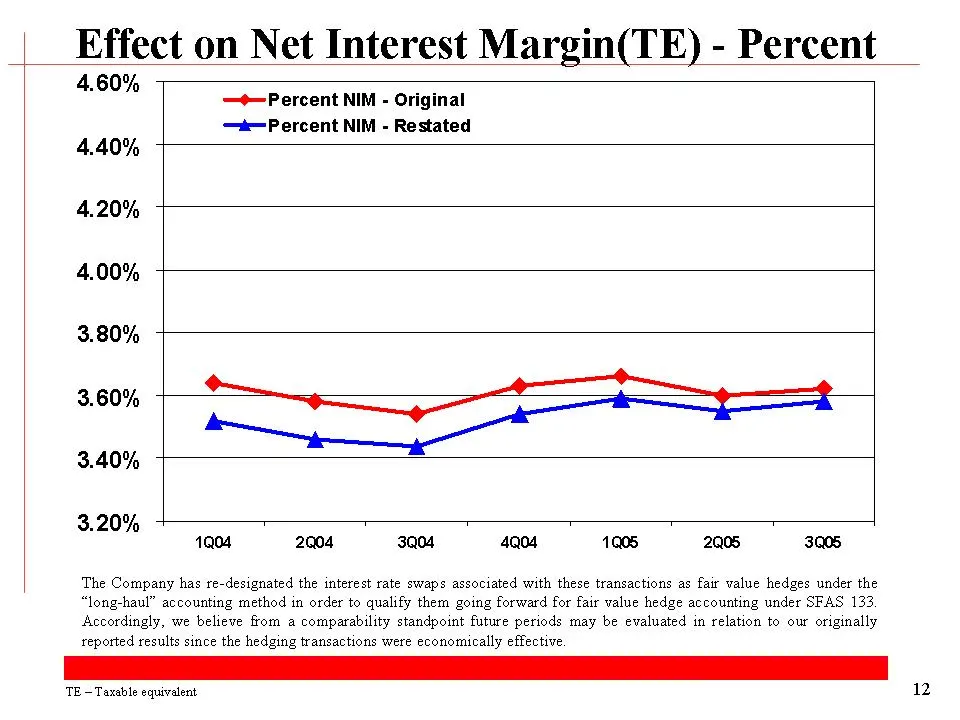
Slide 5: Net Interest Margin (TE) - Percent
Effect on Net Interest Margin(TE) - Percent 1Q02 2Q02 3Q02 4Q02 1Q03 2Q03 3Q03 4Q03 1Q04 2Q04 3Q04 4Q04 1Q05 2Q05 3Q05 Percent NIM - Original 4.50 % 4.37 % 4.30 % 4.31 % 4.29 % 4.02 % 3.92 % 3.74 % 3.64 % 3.58 % 3.54 % 3.63 % 3.66 % 3.60 % 3.62 % Percent NIM - Restated 4.46 % 4.25 % 4.17 % 4.17 % 4.
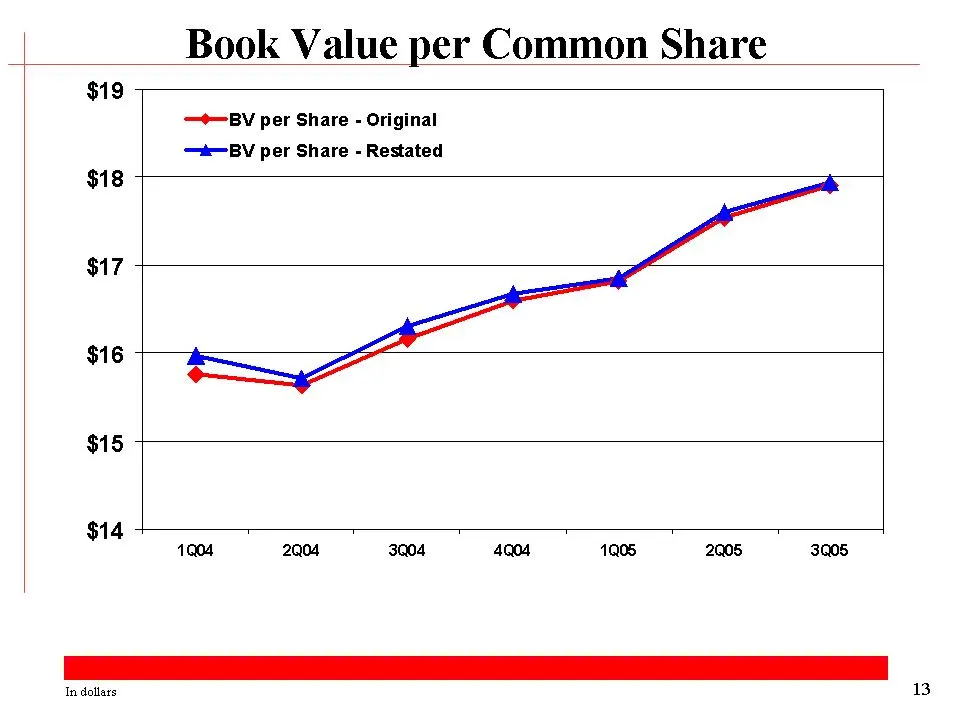
Slide 6: Book Value per Common Share
Book Value per Common Share 1Q02 2Q02 3Q02 4Q02 1Q03 2Q03 3Q03 4Q03 1Q04 2Q04 3Q04 4Q04 1Q05 2Q05 3Q05 BV per Share - Original 13.96 14.87 15.39 15.32 15.58 15.69 15.41 15.33 15.77 15.63 16.17 16.59 16.82 17.54 17.91 BV per Share - Restated 14 14.99 15.64 15.58 15.81 15.93 15.61 15.5 15.97 15.72 16.
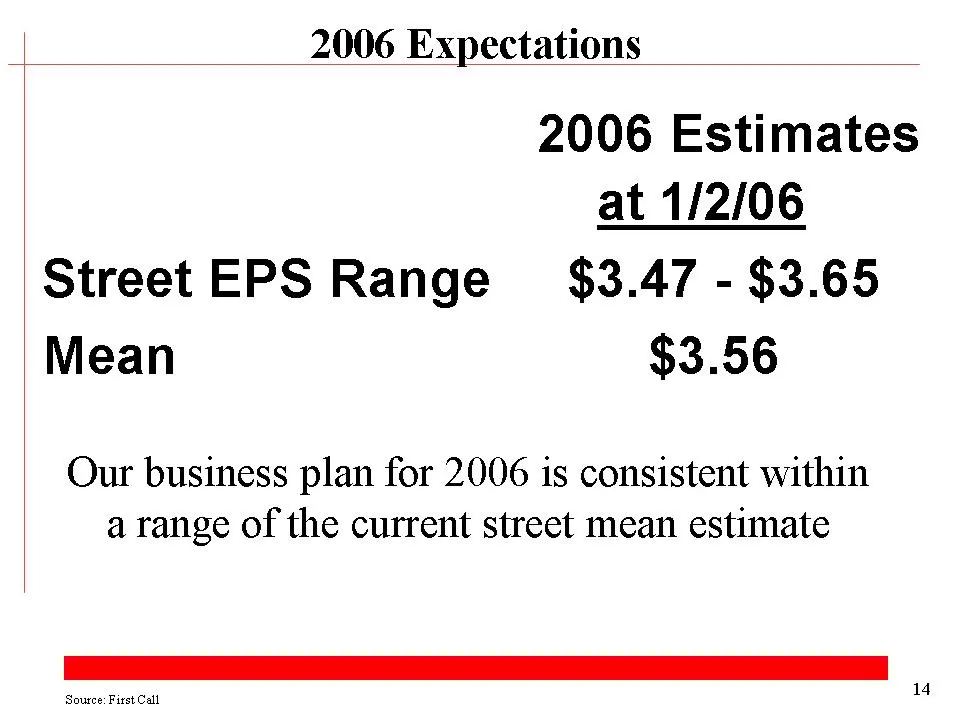
Slide 7: 2006 Expectations
2006 Expectations 2006 Estimates at 1/2/06 Street EPS Range $3.47 - $3.65 Mean $3.56 Our business plan for 2006 is consistent within a range of the current street mean estimate Source: First Call
Source: SEC EDGAR · 8-K filed Jan 3, 2006
More decks from Compass Bancshares Inc
 Compass Bancshares — Merger or Acquisition (June 2007)36 slides · Jun 21, 2007
 Compass Bancshares — Merger or Acquisition (May 2007)39 slides · May 1, 2007
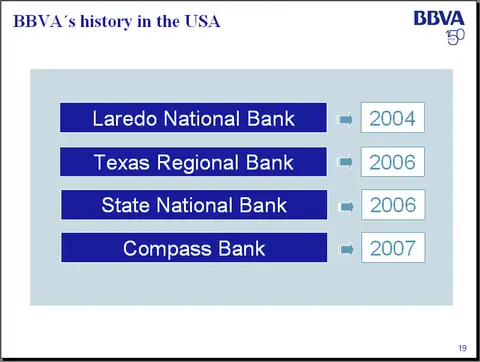 Compass Bancshares — Merger or Acquisition (March 2007)7 slides · Mar 29, 2007
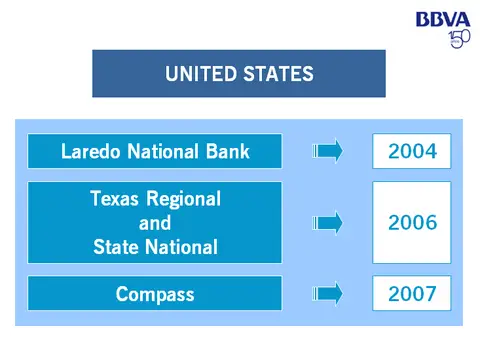 Compass Bancshares — Merger or Acquisition (March 2007)4 slides · Mar 19, 2007
 Q4 2005 Earnings Presentation25 slides · Jan 17, 2006
 Merger or Acquisition (November 2005)36 slides · Nov 15, 2005