1st Century Bancshares — Shareholder Meeting (May 2008)
26 slides from 1st Century Bancshares's shareholder meeting presentation, May 30, 2008
Slide 1: 2008 Annual Shareholders' Meeting
IT IS WHO YOU KNOW™ 2008 Annual Shareholders’ Meeting Alan I. Rothenberg Chairman and Chief Executive Officer 1st Century Bancshares, Inc. Jason P. DiNapoli President and Chief Operating Officer 1st Century Bancshares, Inc.
Slide 2: Safe Harbor Statement
2 Safe Harbor Statement Certain matters discussed in this presentation constitute forward-looking statements within the meaning of the Private Securities Litigation Reform Act of 1995. These forward looking statements, include, but are not limited to, 1st Century Bancshares’ ability to provide great
Slide 3: Who is 1st Century Bank?
3 Who is 1st Century Bank? Founded by successful CEOs, business leaders and professionals in the Los Angeles community Relationship bank designed to serve high net worth individuals, professionals, entrepreneurs and closely held and family owned businesses Headquartered in Century City $259 million
Slide 4: Why 1st Century Bank?
4 Why 1st Century Bank? Highly focused market position Strong balance sheet Sound credit quality Exceptional deposit base Commitment to long-term shareholder value
Slide 5: Focused Market Position
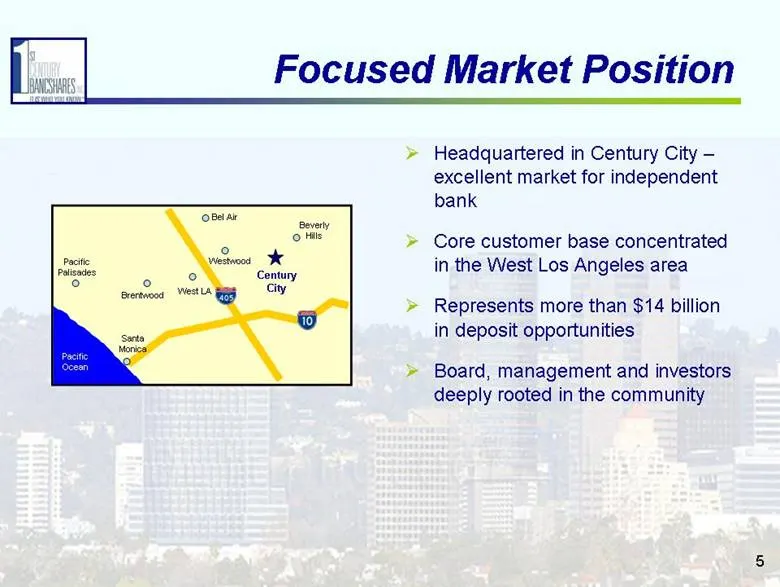
5 Focused Market Position Headquartered in Century City – excellent market for independent bank Core customer base concentrated in the West Los Angeles area Represents more than $14 billion in deposit opportunities Board, management and investors deeply rooted in the community Pacific Ocean Santa Mo
Slide 6: Product Enhancement Opportunities
6 Product Enhancement Opportunities Approach: High tech – High touch · Upgraded core systems · Remote Deposit – successful implementation in 2007, continued installations · Package products to high net worth individuals and small businesses Outcome: Customer experience enhanced to attract high DDA c
Slide 7: Financial Overview
IT IS WHO YOU KNOW™ Financial Overview
Slide 8: Well Capitalized
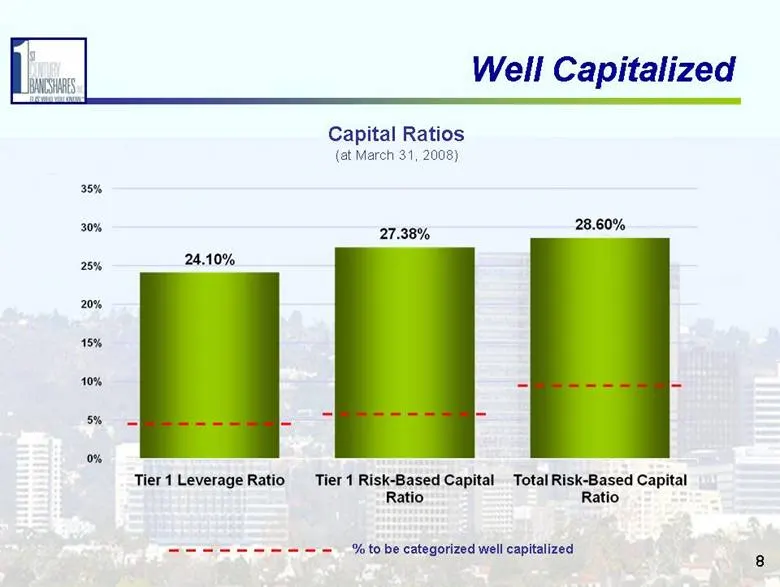
8 Well Capitalized % to be categorized well capitalized Capital Ratios (at March 31, 2008) 35% 30% 25% 20% 15% 10% 5% 0% 24.10% 27.38% 28.60% Tier 1 Leverage Ratio Tier 1 Risk-Based Capital Ratio Total Risk-Based Capital Ratio
Slide 9: Growing Asset Base
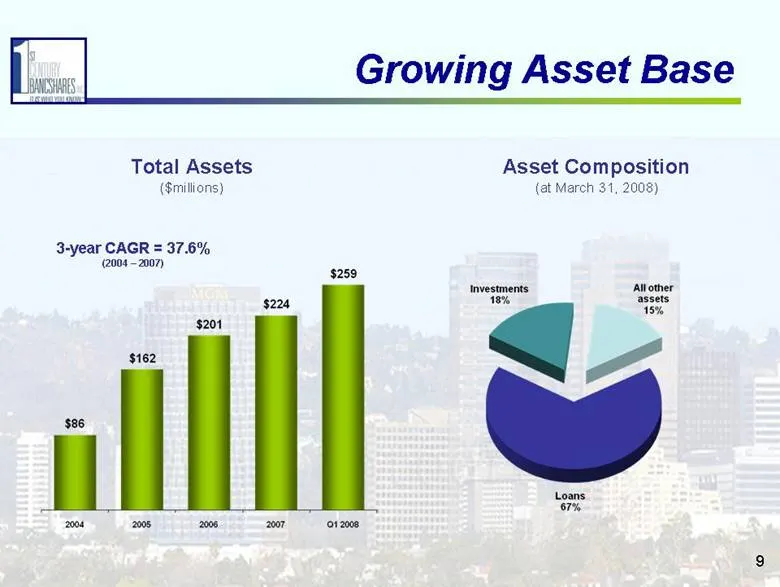
9 Growing Asset Base Total Assets ($millions) Asset Composition (at March 31, 2008) 3-year CAGR = 37.6% (2004 – 2007) $86 $162 $201 $224 $259 2004 2005 2006 2007 Q1 2008 Investments 18% All other assets 15% Loans 67%
Slide 10: Loan Portfolio
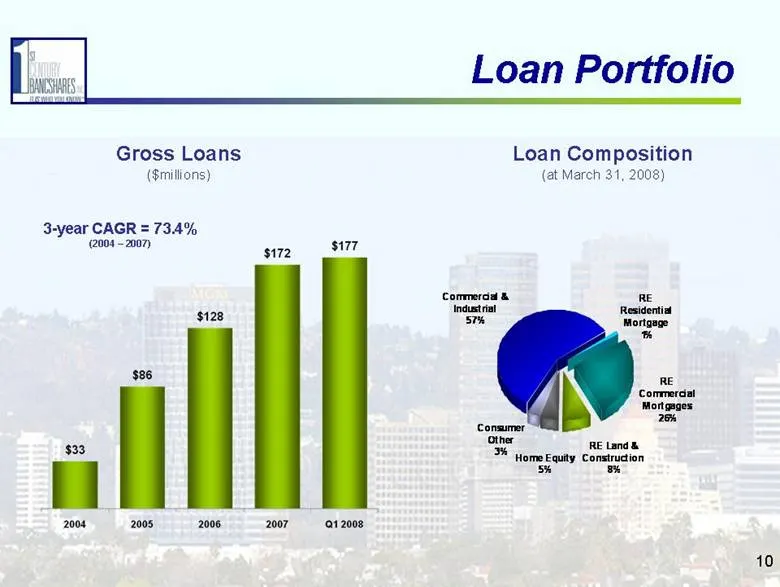
10 Loan Portfolio Gross Loans ($millions) 3-year CAGR = 73.4% (2004 – 2007) Loan Composition (at March 31, 2008) Commercial & Industrial 57% RE Residential Mortgage 1% RE Commercial Mortgages 26% RE Land & Construct ion 8% Home Equity 5% Consumer Other 3% $33 $86 $128 $172 $177 2004 2005 2006 2007 Q
Slide 11: Vigilance to Credit Quality
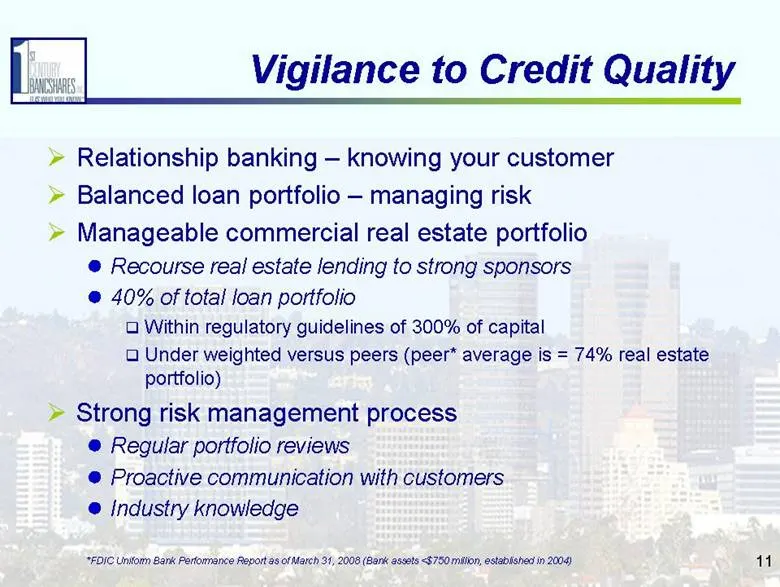
11 Vigilance to Credit Quality Relationship banking – knowing your customer Balanced loan portfolio – managing risk Manageable commercial real estate portfolio · Recourse real estate lending to strong sponsors · 40% of total loan portfolio Within regulatory guidelines of 300% of capital Under weight
Slide 12: Conservative Risk Management
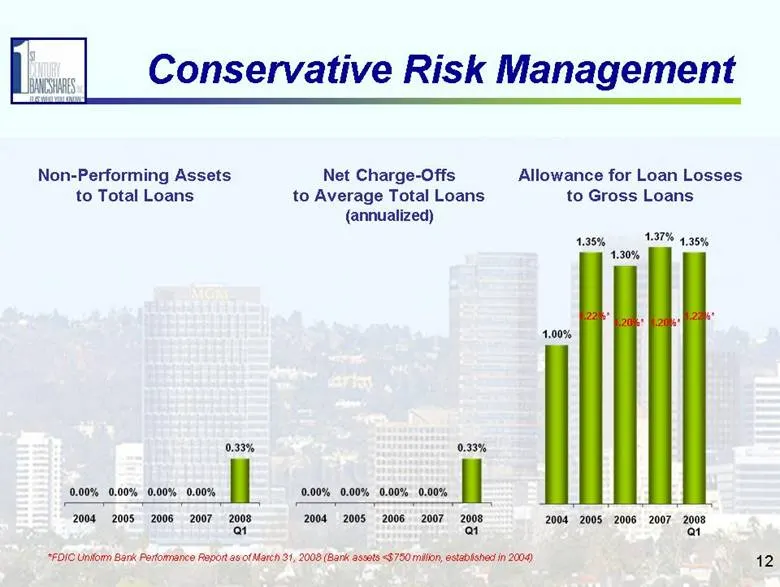
12 Conservative Risk Management Non-Performing Assets to Total Loans Net Charge-Offs to Average Total Loans (annualized) Allowance for Loan Losses to Gross Loans *FDIC Uniform Bank Performance Report as of March 31, 2008 (Bank assets <$750 million, established in 2004) 1.22%* 1.20%* 1.20%* 1.22%* 0.
Slide 13: Deposit Trends
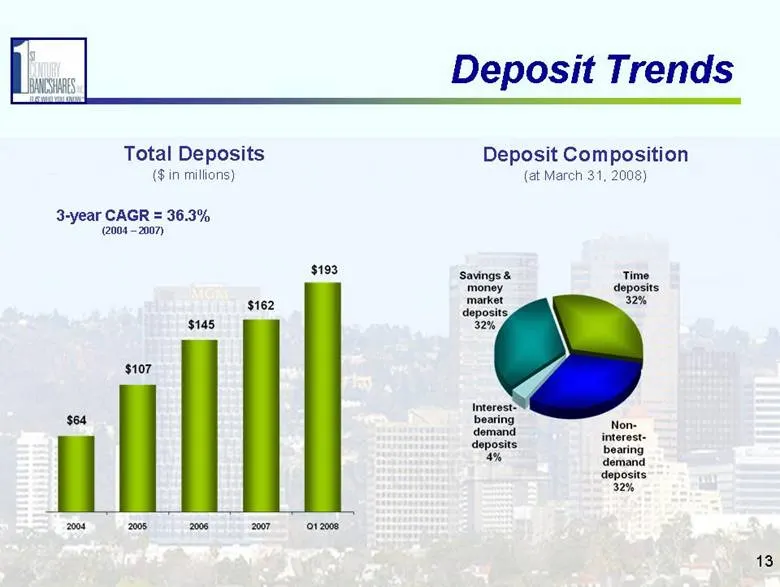
13 Deposit Trends Total Deposits ($ in millions) Deposit Composition (at March 31, 2008) 3-year CAGR = 36.3% (2004 – 2007)
Slide 14: Net Interest Margin
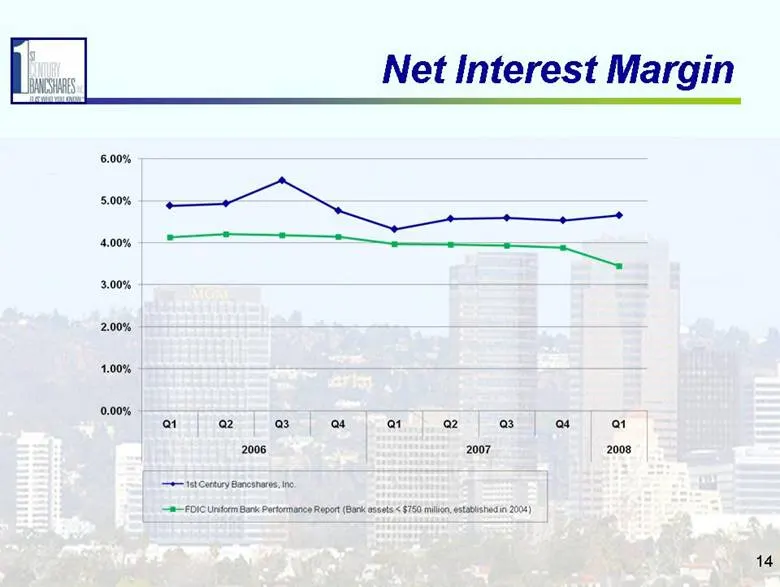
Net Interest Margin 6.00% 5.00% — SES 4.00% — Se 3.00% 2.00% 1.00% 0.00% a 2 33 as at a2 Cry a4 a 2006 2007 2008 = tet century Bocsnare. ne 2 FDIC Unto Bar Pertenece Rept (Bark eee < 50 mia. xtabehedin 2008)
Slide 15: Revenue and Earnings Growth
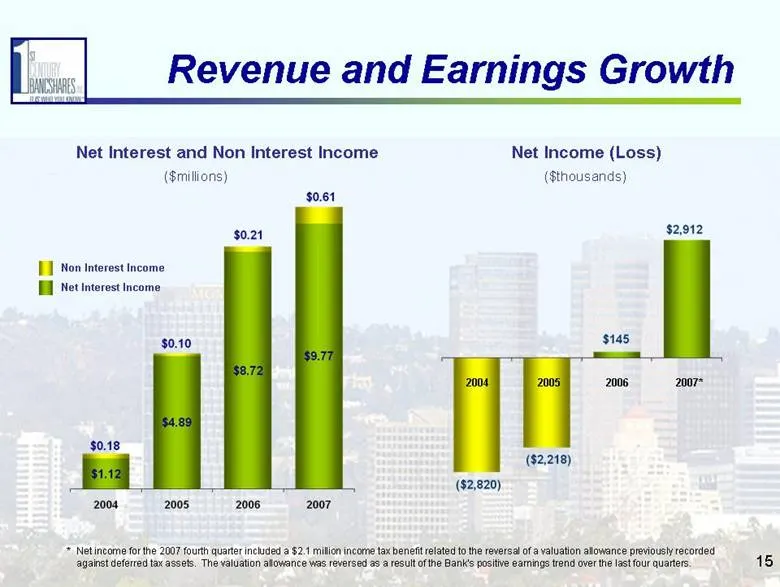
15 Revenue and Earnings Growth Net Interest and Non Interest Income Non Interest Income Net Interest Income ($millions) Net Income (Loss) ($thousands) 2007* 2006 2005 2004 * Net income for the 2007 fourth quarter included a $2.1 million income tax benefit related to the reversal of a valuation allow
Slide 16: Quarterly Revenue and Earnings
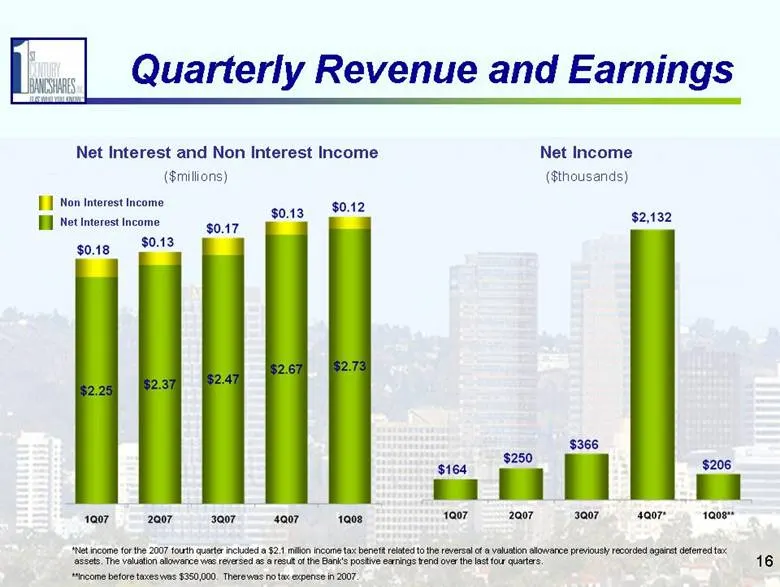
16 Quarterly Revenue and Earnings Net Interest and Non Interest Income Non Interest Income Net Interest Income ($millions) Net Income ($thousands) *Net income for the 2007 fourth quarter included a $2.1 million income tax benefit related to the reversal of a valuation allowance previously recorded a
Slide 17: Shareholder Value
IT IS WHO YOU KNOW™ Shareholder Value
Slide 18: Industry Challenges
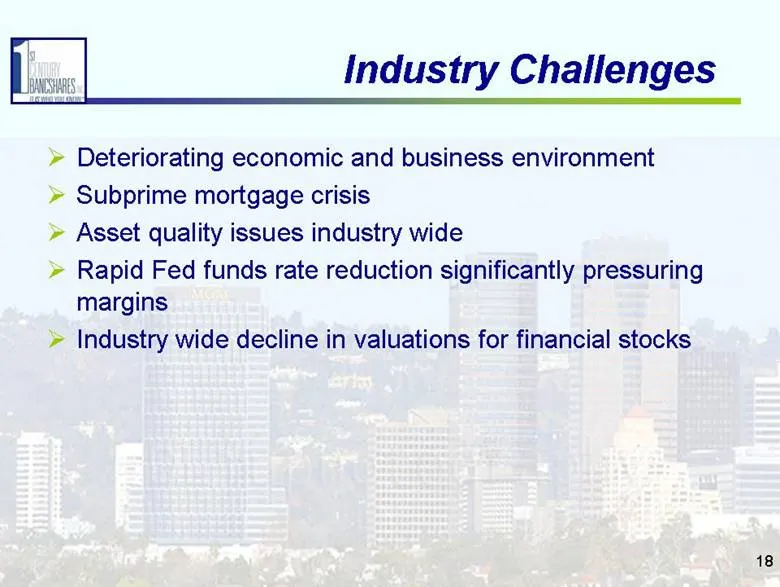
18 Industry Challenges Deteriorating economic and business environment Subprime mortgage crisis Asset quality issues industry wide Rapid Fed funds rate reduction significantly pressuring margins Industry wide decline in valuations for financial stocks
Slide 19: Building Shareholder Value: Comparative Stock Price
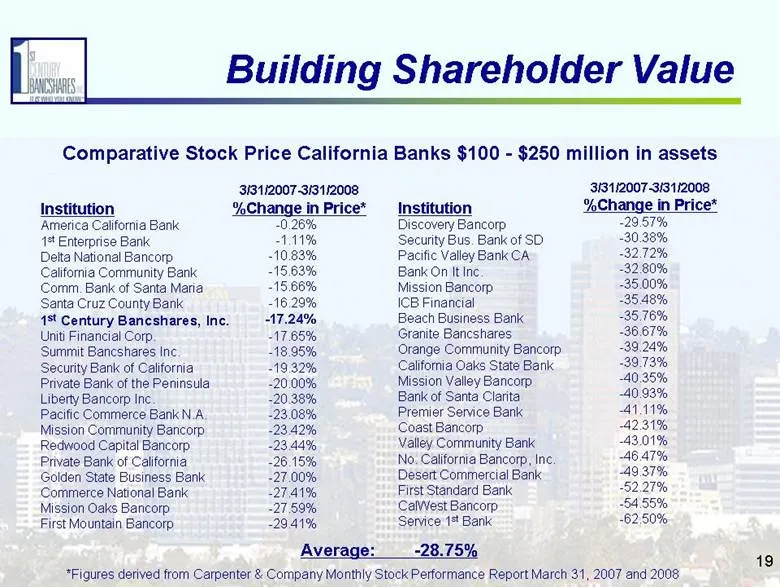
19 Building Shareholder Value Comparative Stock Price California Banks $100 - $250 million in assets Institution America California Bank 1st Enterprise Bank Delta National Bancorp California Community Bank Comm. Bank of Santa Maria Santa Cruz County Bank 1st Century Bancshares, Inc. Uniti Financial
Slide 20: Building Shareholder Value
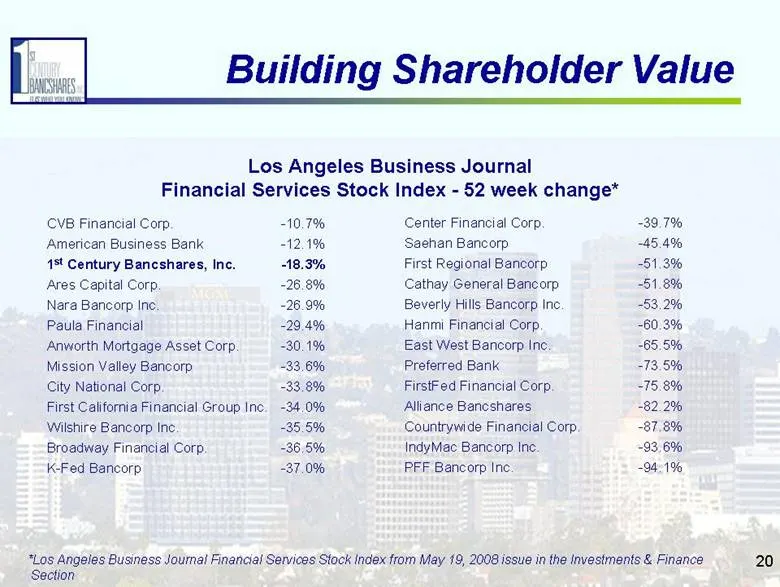
20 Building Shareholder Value CVB Financial Corp. -10.7% American Business Bank -12.1% 1st Century Bancshares, Inc. -18.3% Ares Capital Corp. -26.8% Nara Bancorp Inc. -26.9% Paula Financial -29.4% Anworth Mortgage Asset Corp. -30.1% Mission Valley Bancorp -33.6% City National Corp. -33.8% First Cali
Slide 21: Selected Financial Performance, Class of 2004 De Novo Banks
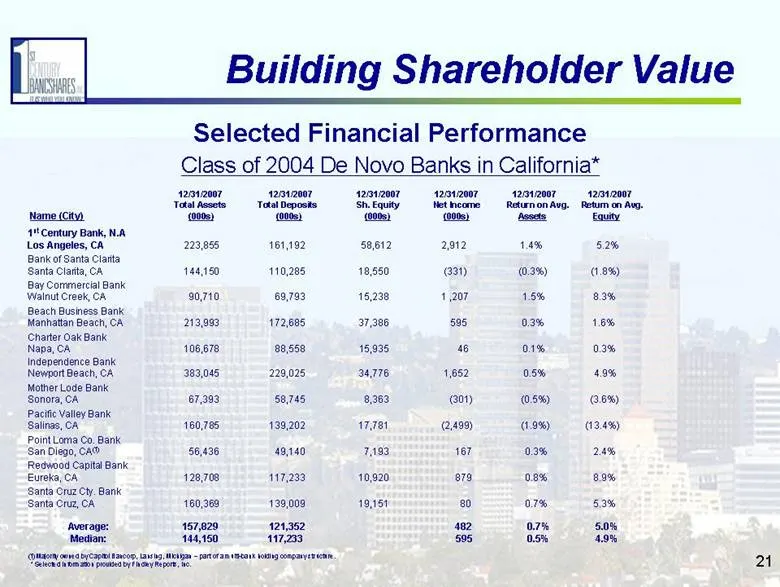
21 Building Shareholder Value Selected Financial Performance Class of 2004 De Novo Banks in California* 12/31/2007 12/31/2007 12/31/2007 12/31/2007 12/31/2007 12/31/2007 Total Assets Total Deposits Sh. Equity Net Income Return on Avg. Return on Avg. Name (City) (000s) (000s) (000s) (000s) Assets Equ
Slide 22: Key Objective: Increase Shareholder Value by Growing Core Deposits
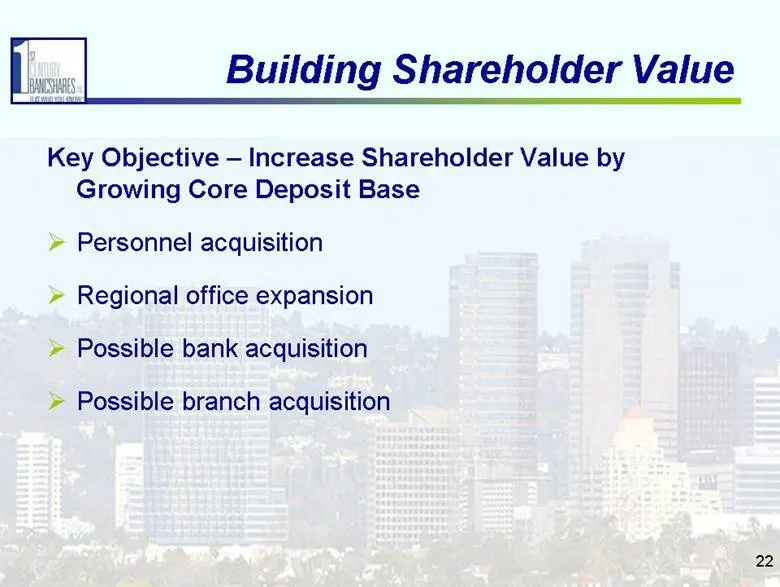
22 Building Shareholder Value Key Objective – Increase Shareholder Value by Growing Core Deposit Base Personnel acquisition Regional office expansion Possible bank acquisition Possible branch acquisition
Slide 23: Why 1st Century Bank? Because...
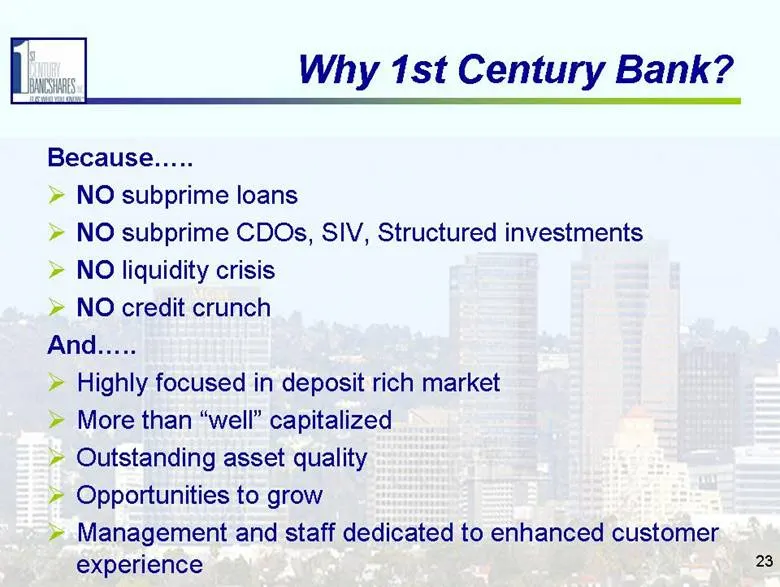
23 Why 1st Century Bank? Because..... NO subprime loans NO subprime CDOs, SIV, Structured investments NO liquidity crisis NO credit crunch And..... Highly focused in deposit rich market More than “well” capitalized Outstanding asset quality Opportunities to grow Management and staff dedicated to enh
Slide 24: 1st Century Bank Selected Financial Data
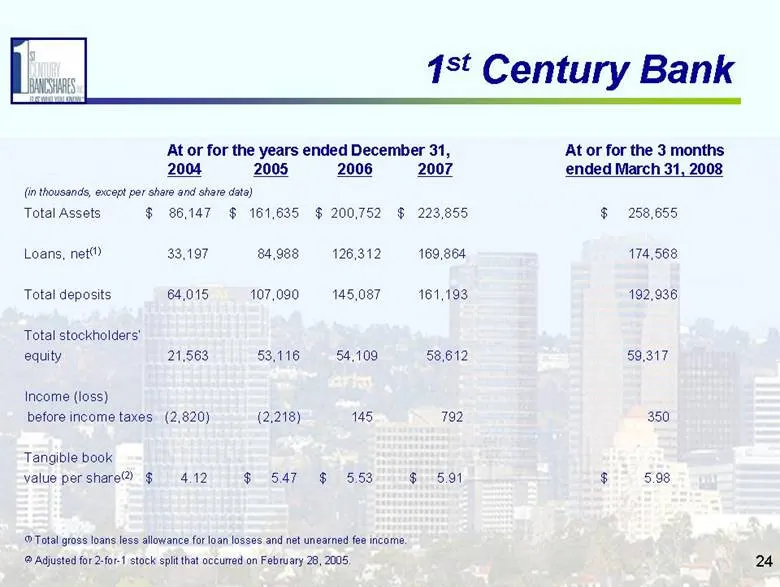
24 1st Century Bank At or for the years ended December 31, At or for the 3 months 2004 2005 2006 2007 ended March 31, 2008 (in thousands, except per share and share data) Total Assets $ 86,147 $ 161,635 $ 200,752 $ 223,855 $ 258,655 Loans, net(1) 33,197 84,988 126,312 169,864 174,568 Total deposits
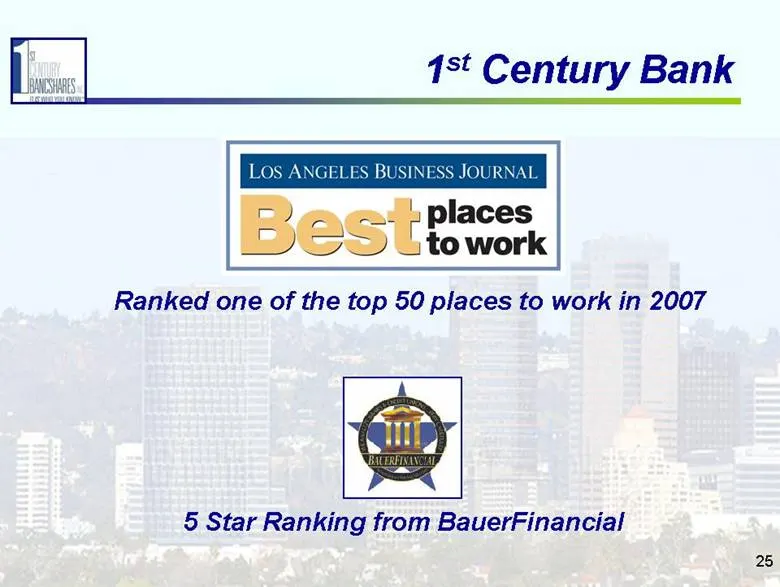
Slide 25: Ranked one of the top places to work in 2007
25 1st Century Bank Ranked one of the top 50 places to work in 2007 5 Star Ranking from BauerFinancial
Slide 26: Contact: refer business to us
26 1st Century Bank The best way to contribute to building shareholder value is to refer business to us. Please call or email us: Alan Rothenberg Jason DiNapoli Steve Goodrich Bonnie Rubin Leah Duke Anita Lawler CEO/Chairman President Head of Banking Team Leader Team Leader Branch Manager 310.270.95
Source: SEC EDGAR · 8-K filed May 30, 2008
More decks from 1st Century Bancshares Inc
 Shareholder Meeting (May 2015)23 slides · May 7, 2015
 Investor Presentation (May 2014)26 slides · May 8, 2014
 Investor Presentation (May 2013)26 slides · May 8, 2013
 Investor Presentation (May 2012)24 slides · May 21, 2012
 Shareholder Meeting (May 2011)25 slides · May 26, 2011
 Investor Presentation (December 2010)27 slides · Dec 1, 2010