1st Century Bancshares — Shareholder Meeting (May 2011)
25 slides from 1st Century Bancshares's shareholder meeting presentation, May 26, 2011
Slide 1: 2011 Annual Shareholders' Meeting
EXHIBIT 99.1 2011 Annual Shareholders’ Meeting May 26, 2011 Alan. Rothenberg Chairman and Chief Executive Officer 4 Century Baneshares, Inc Jason P. DiNapoli President and Chief Operating Officer 4 Century Baneshares, Ine
Slide 2: Safe Harbor Statement
Safe Harbor Statement Certainmatters discussed in this presentationmay constitute fonvard-looking statements within hemeaning of the “safe harbor” provisions ofthe Private Secunties/tigationRefom Act of 1995. You can find many (but not all of these statements by looking forwords such as “approximate
Slide 3: 1st Century Bank
1st Century Bank Foundedby business and professional people for business and professional people in 2004, 1st Century Bank meets the specific needs of entrepreneurs, professionals and small businesses. 1st Century Bank was built on a culture and core set of values that we still live by today. As a r
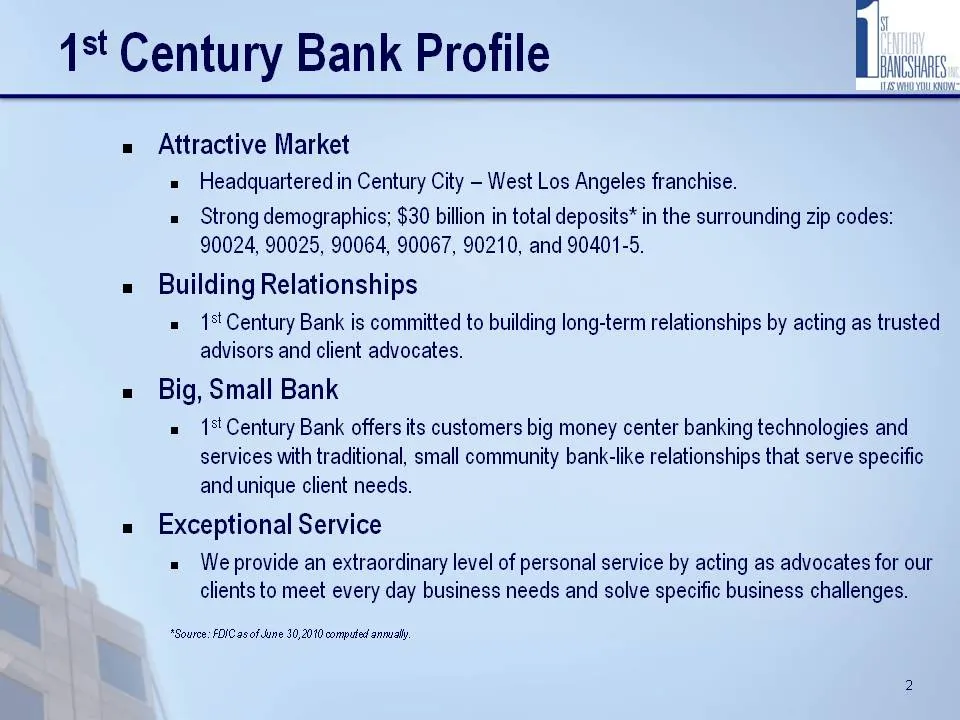
Slide 4: 1st Century Bank Profile
1st Century Bank Profile = Attractive Market = Headquartered in Century City - West Los Angeles franchise. = Strong demographics; $30 billion in total deposits* in the surrounding zip codes: 90024, 90025, 90064, 90067, 90210, and 90401-5. = Building Relationships = 1% Century Bank is committed to bu
Slide 5: 2010 Highlights
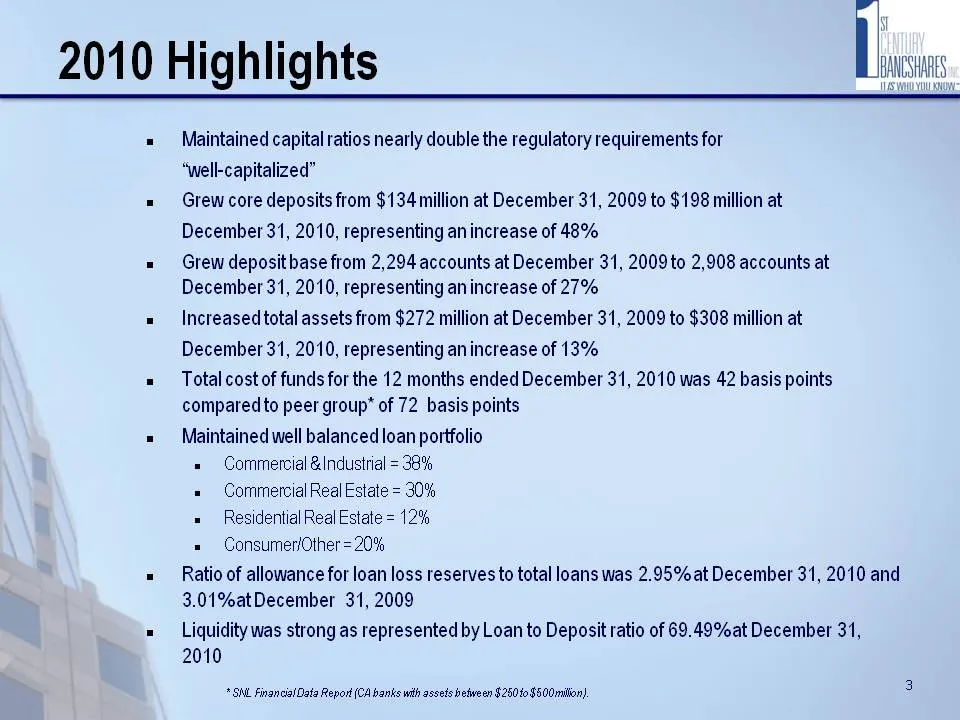
2010 Highlights = Maintained capital ratios nearly double the regulatory requirements for “well-capitalized” = Grew core deposits from $134 million at December 31, 2009 to $198 million at December 31, 2010, representing an increase of 48% = Grew deposit base from 2,294 accounts at December 31, 2009
Slide 6: 2010 Highlights (cont.)
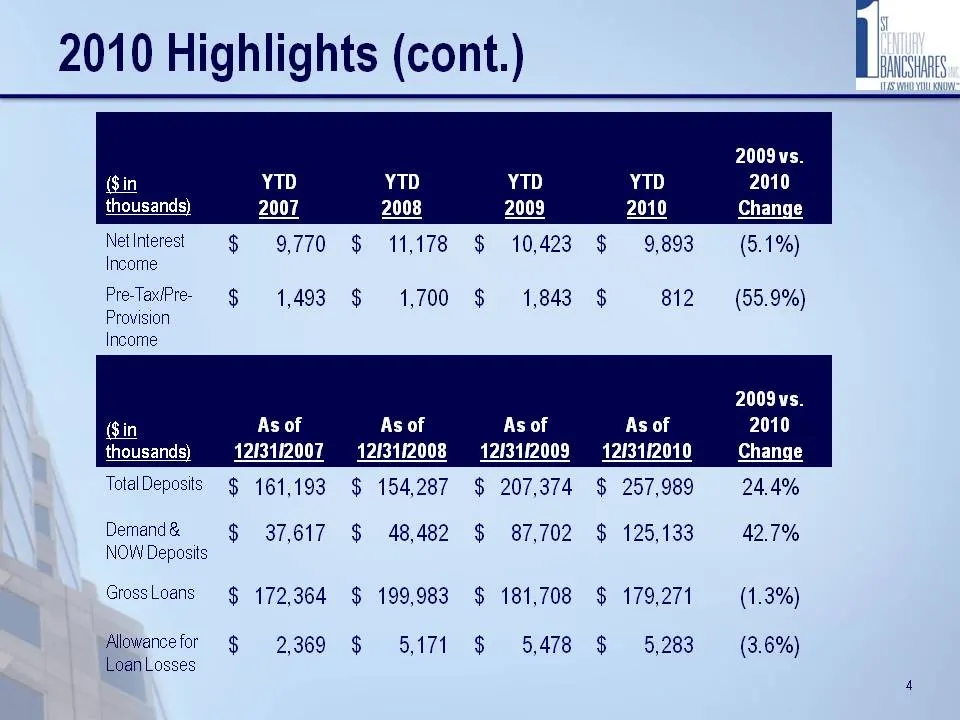
2010 Highlights (cont.) (in YTD YTD YTD thousands) 2007 2008 2009 NetInterest $ 9770 $ 11,178 $ 10,423 $ 9,893 (5.1%) Income PreTaxPre- = $ 1,493 $ 1,700 $ 1,843 $ 812 (55.9%) Provision Income (Sin As of As of As of As of thousands) 1213112007 = 1231/2008 }==— 1213112009 += 1231/2010 TotalDeposts $
Slide 7: 1st Century Bank Outlook
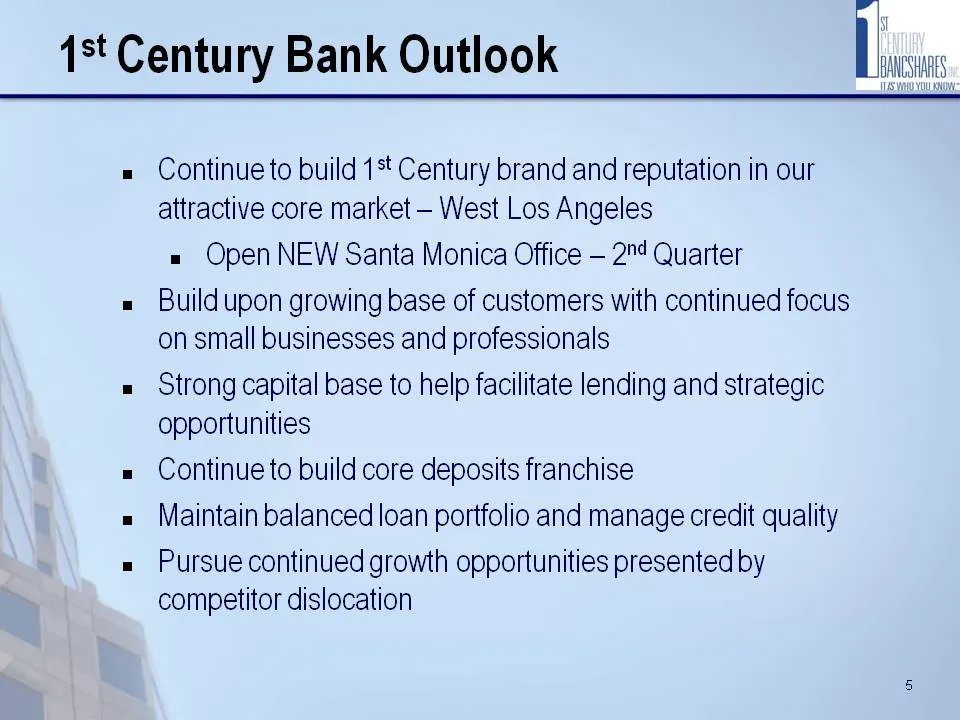
1st Century Bank Outlook » Continue to build 1% Century brand and reputation in our attractive core market - West Los Angeles » Open NEW Santa Monica Office — 2" Quarter « Buildupon growing base of customers with continued focus on small businesses and professionals = Strong capital base to help fac
Slide 8: Westside communities deposit rich with major growth potential
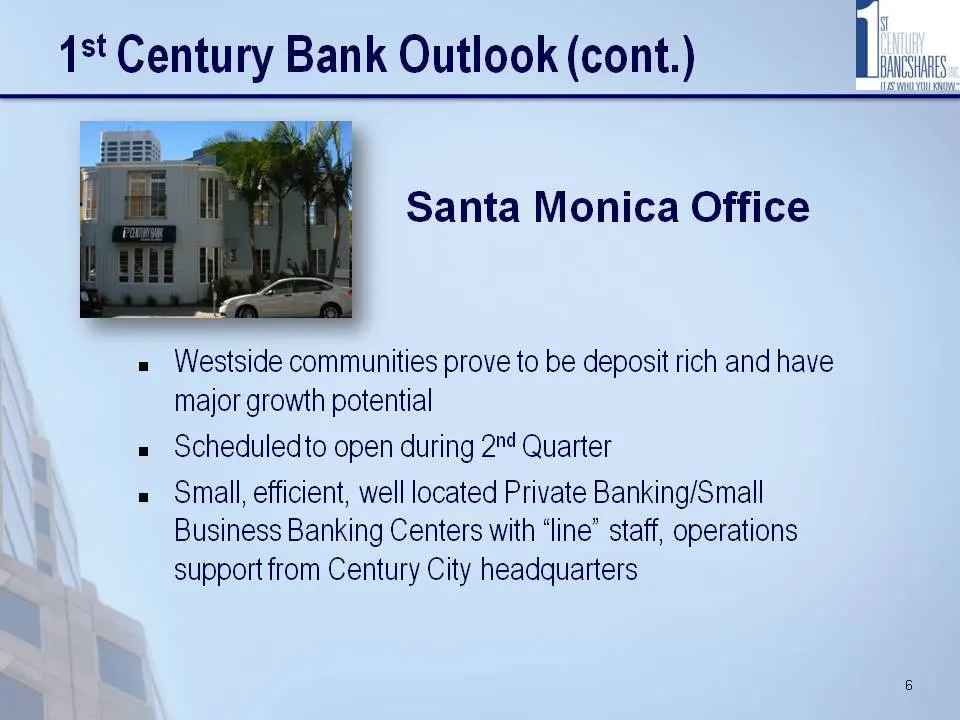
« Westside communities prove to be deposit rich and have major growth potential » Scheduledto open during 2"4 Quarter = Small, efficient, well located Private Banking/Small Business Banking Centers with ‘line’ staff, operations support from Century City headquarters
Slide 9: Financial Overview
l. SINSHRES Tus yng UO: Financial Overview
Slide 10: Well Capitalized
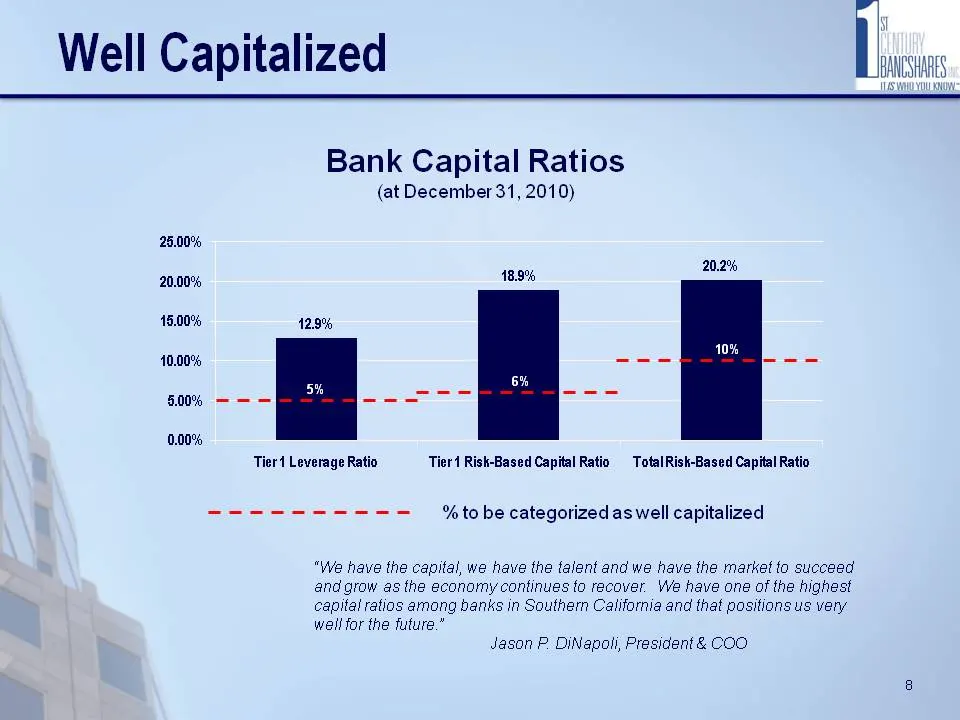
Well Capitalized Bank Capital Ratios (at December 31, 2010) 25.00% 20.2% 20.00% es 48.00% 129% 10.00% --- - - — 5.00% ——— --- 0.00% Tier Leverage Ratio Tier Risk-Based Capital Ratio TotalRisk-Based Capital Ratio weer ------ ‘to be categorized as well capitalized “We have the capital, we have the tal
Slide 11: Well Capitalized (cont.)
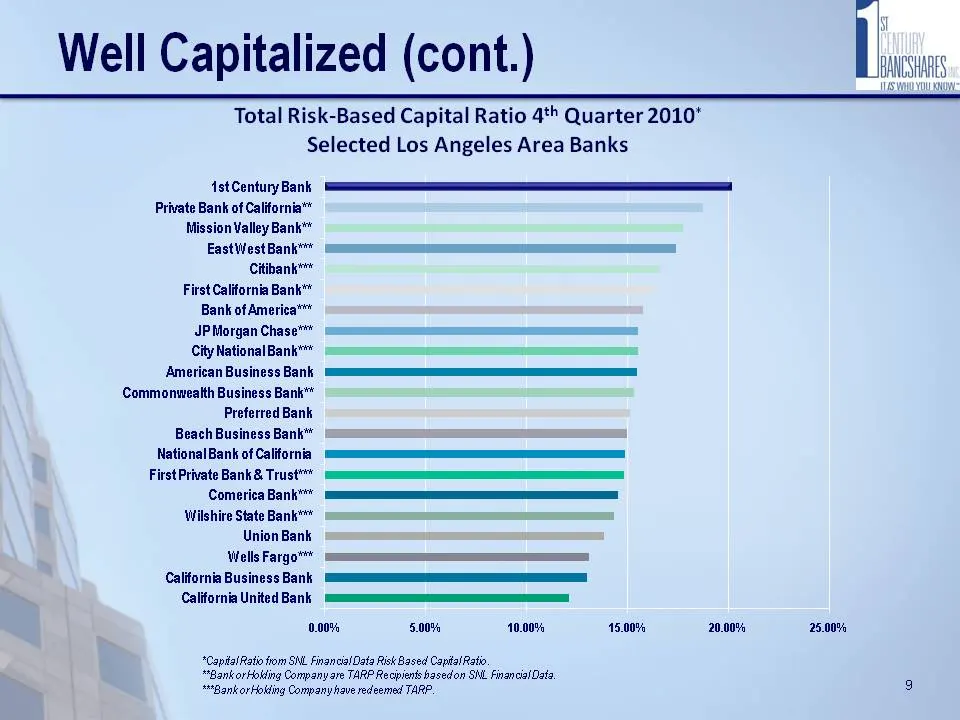
Nf Well Capitalized (cont.) EMCSHRES IUSymOyDULY Total Risk-Based Capital Ratio 4t Quarter 2010" Selected Los Angeles Area Banks 1st Century Bank Private Bank of California" Mission Valley Bank™ EastWestBankt** Citibank™™ First California Bank** Bank of America*** JPMorgan Chase*** City National Ban
Slide 12: Deposits — Expanding Core Deposit Base
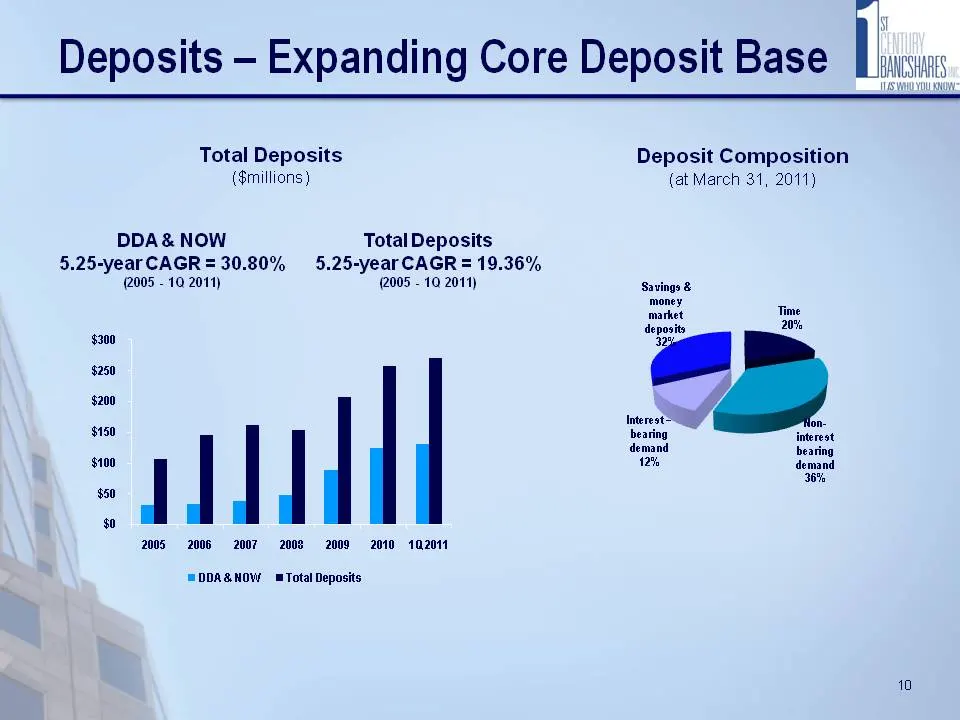
Deposits — Expanding Core Deposit Base If Total Deposits Deposit Composition ($millions) {at March 31, 2011) DDA& NOW Total Deposits 5.25-year CAGR = 30.80% 5.25-year CAGR = 19.36% (2005 - 10 2011) (2005 - 10 2011) Savings & money market Time deposits 20% $300 Ey: $250 $200 ¥ Interest= & $150 bearin
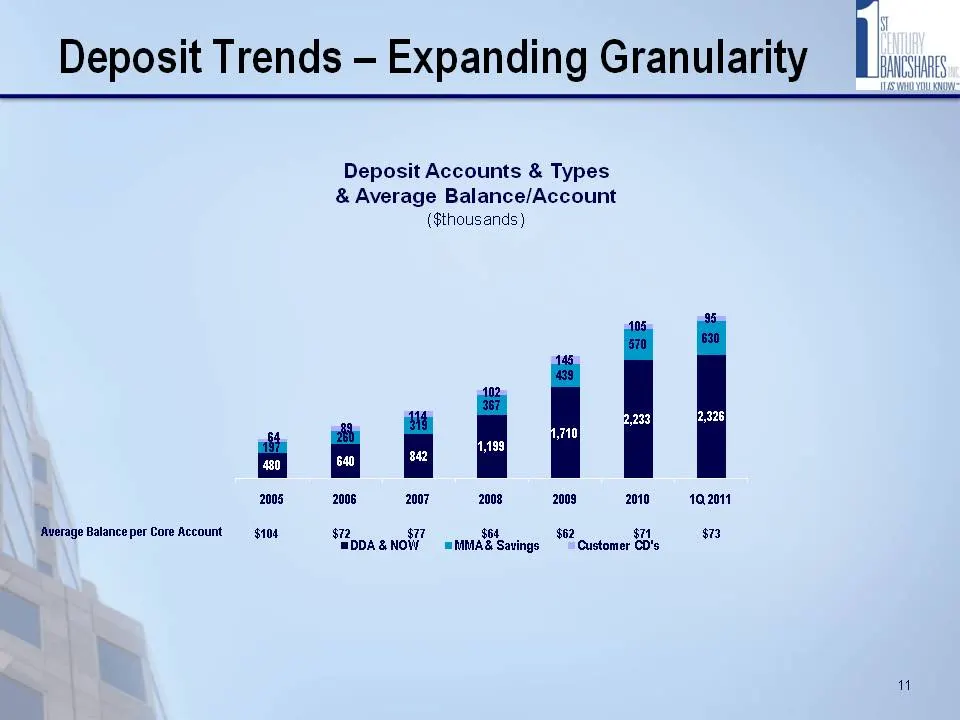
Slide 13: Deposit Trends — Expanding Granularity
Deposit Trends — Expanding Granularity I Average Balance per Core Account Deposit Accounts & Types & Average Balance/Account ($thousands) 2005 $108 2008 2007 2008 2008 2010 102011 § $62 $2, $73 72 $17 $04 MDDA&NOW =MMA& Savings "Customer CD's 1"
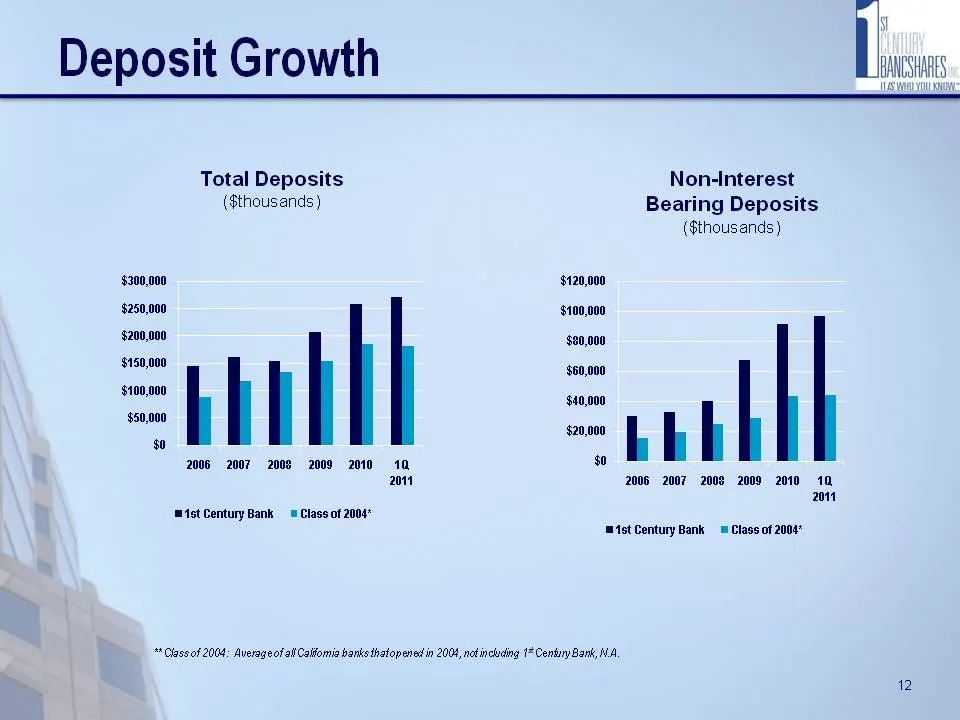
Slide 14: Deposit Growth
Deposit Growth Total Deposits Non-Interest ($thousands ) Bearing Deposits ($thousands) $300,000 $120,000 $250,000 $100,000 $200,000 $80,000 $150,000 $60,000 $100,000 $40,000 $50,000 $20,000 as kh 2006 2007 2008 2009 2010 10, so am 2006 2007 2008 2009 2010 10 2011 mist Century Bank = Class of 2004 ms
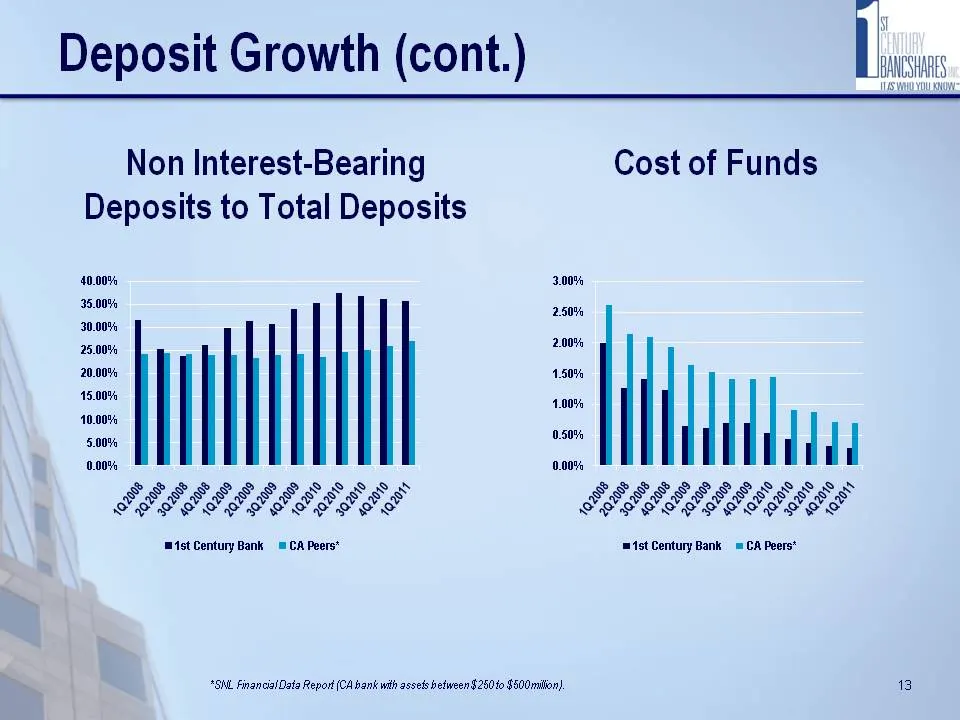
Slide 15: Deposit Growth (cont.)
Deposit Growth (cont.) Non Interest-Bearing Cost of Funds Deposits to Total Deposits eee g SESLS See SS Es FESSSSS SSS LES ESSSSESSSSISS SCHLOSS SOL HLS LHL SSH HL KL HS eK sts cent Bank = A Paes tet centuy Bank =CAPer* *3NL Financia Data Report (CA hank wih assets between $25040 $800milon). 13
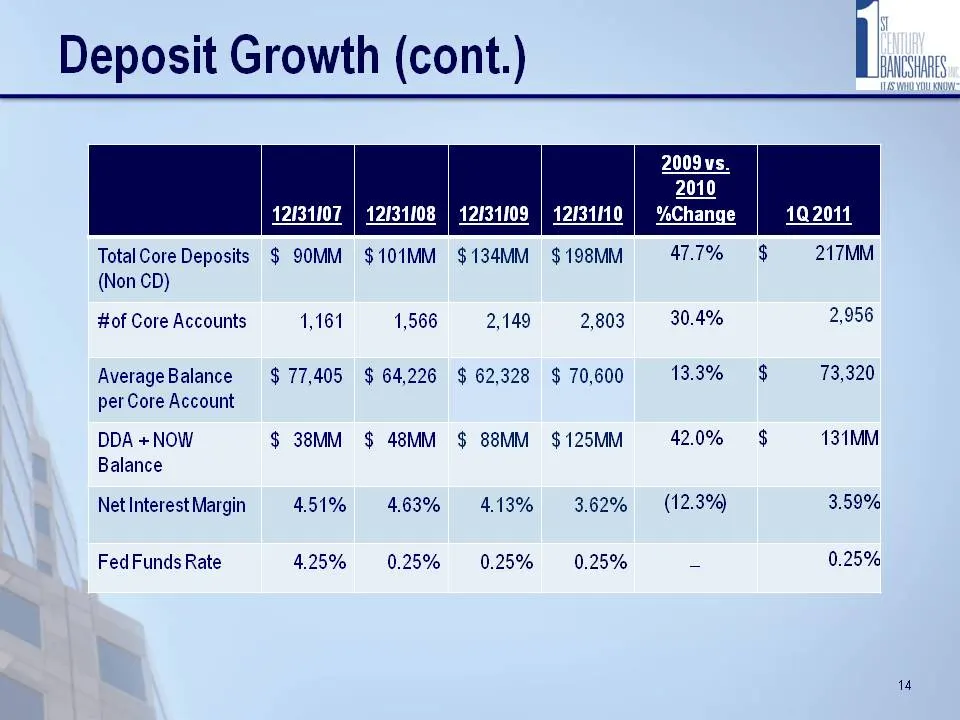
Slide 16: Deposit Growth (cont.)
Deposit Growth (cont.) Total Core Deposits $ 90MM $101MM $134MM $198MM 411% §$ 217MM (Non CD) #of Core Accounts 1,161 1,566 2,149 2,803 30.4% 2,956 AverageBalance $77,405 $64,226 $ 62,328 $ 70,600 13.3% $ 73,320 per Core Account DDA +NOW $ 38MM $ 48MM $ 88MM $125IMM 42.0% $ 131MM Balance Net Interes
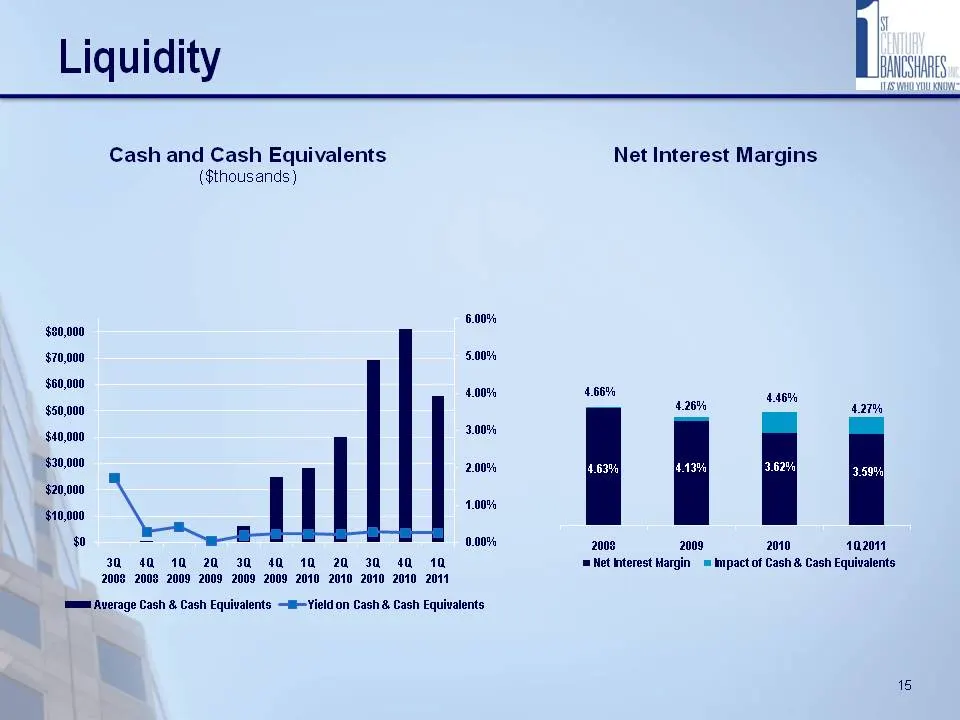
Slide 17: Liquidity
Liquidity Cash and Cash Equivalents ($thousands) $30,000 $70,000 $60,000 $50,000 $40,000 $30,000 $20,000 $10,000 $0 _ 30 40 10 20 30 40 10 20 30 2008 2008 2009 2009 2009 2009 2010 2010 2010 2010 2011 40 10 6.00% 5.00% 4.00% 3.00% 2.00% 1.00% 0.00% mms Average Cash & Cash Equivalents —s—Yield on Cash
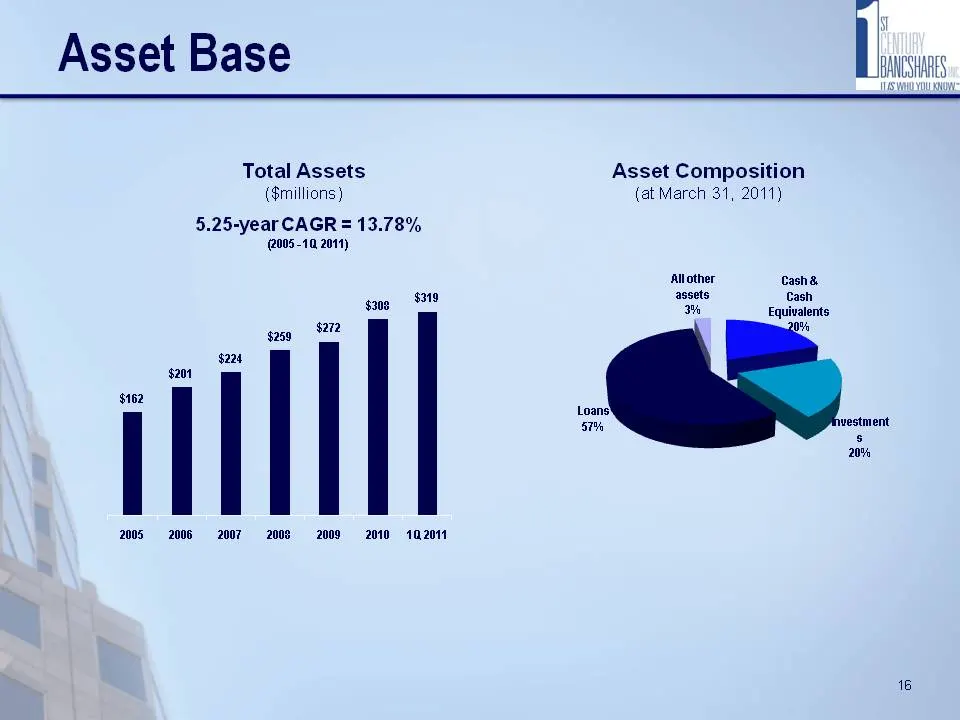
Slide 18: Asset Base
Asset Base Total Assets ($millions) 5.25-year CAGR = 13.78% (2005-10, 2011) $308 es $224 $201 $162 | 2005 © 2006 ©2007 ©2002 °~ 2009-2010 Asset Composition (at March 31, 2011) Allother Cash & assets Cash 3% Equivalents 0% Loans! oe westment 16
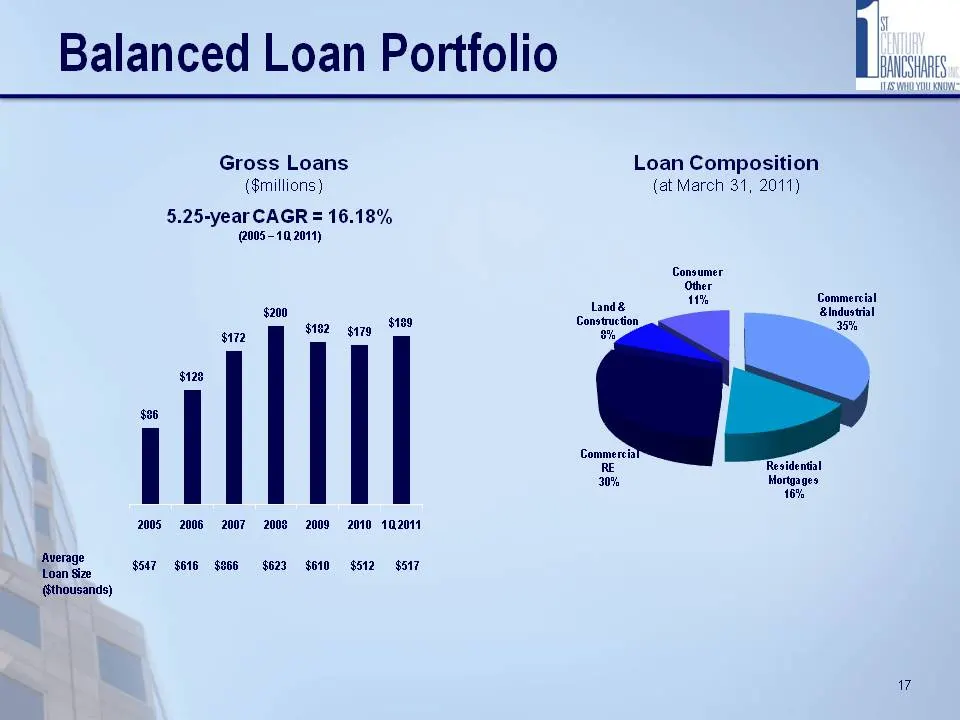
Slide 19: Balanced Loan Portfolio
Balanced Loan Portfolio Gross Loans ($millions) 5.25-year CAGR = 16.18% (2005 - 10.2011) $200 $172 $182 gia $28 as | 2005 2006 2007 2008 2009 2010 10.2011 $189 Average Loan Size ___ @ thousands) $517 $615 $805 $623 $010 $512 S517 Loan Composition (at March 31, 2011) Consumer Other : r 11% “ommereial
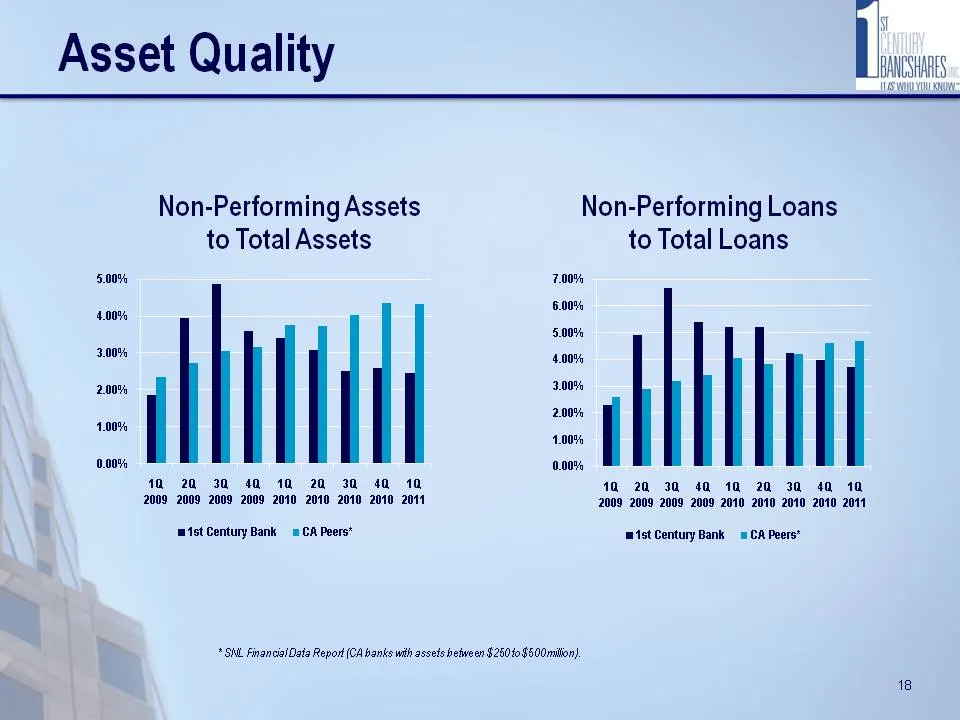
Slide 20: Asset Quality
Asset Quality 5.00% 4.00% 3.00% 2.00% 1.00% 0.00% Non-Performing Assets to Total Assets 10 20 30 42 19 20 30 40 10 2009 2009 2009 2009 2010 2010 2010 2010 2011 mst Century Bank = CA Peers* Non-Performing Loans 700% 6.00% 500% 4.00% 2.00% 200% 4.00% 0.00% * SNL Financiel Date Report {CA banks wilh as
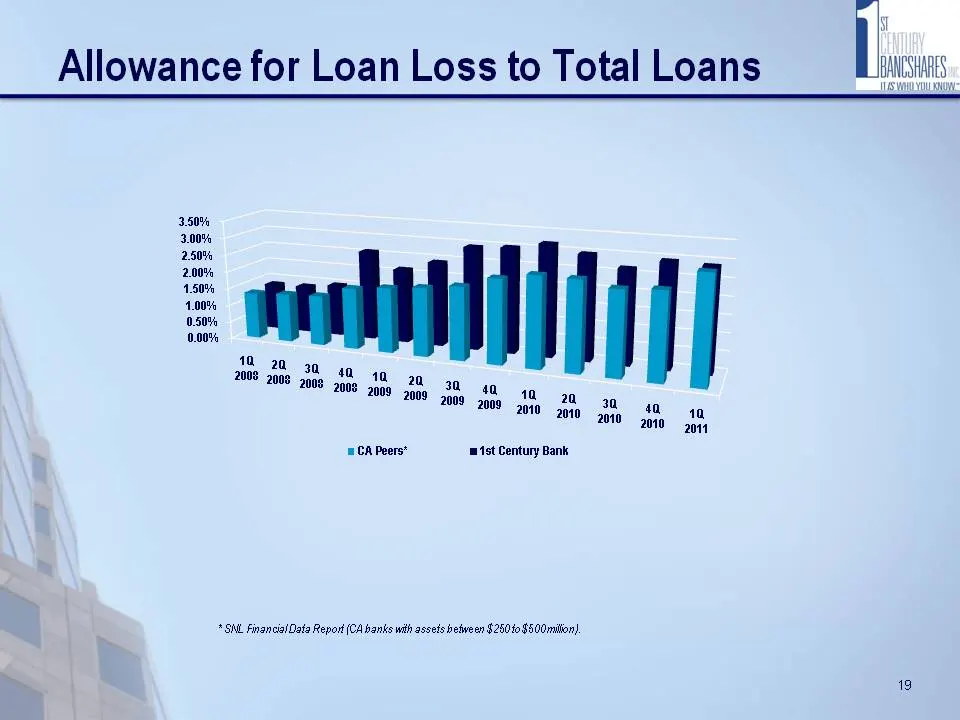
Slide 21: 3.50% 3.00% 2.50% 2.00% 1.50% 1.00% 0.50% 0.00% ag OQ 20 tt 2009 my
3.50% 3.00% 2.50% 2.00% 1.50% 1.00% 0.50% 0.00% 10 20 ag OQ 20 tt 2009 my 20 ao ote, CA Peerst tet Century Bank * SNL Financial Date Report {CA banks wil assets between $2500 8500milion) 19
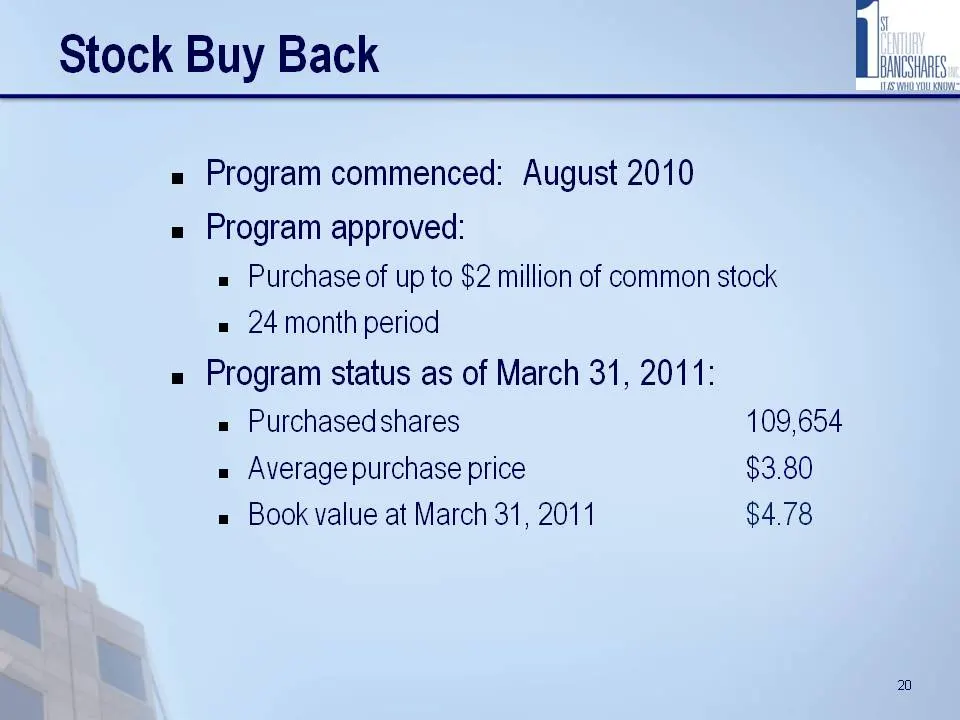
Slide 22: Stock Buy Back
Stock Buy Back = Program commenced: August 2010 = Program approved: » Purchase of up to $2 million of common stock = 24 month period = Program status as of March 31, 2011: = Purchasedshares 109,654 « Average purchase price $3.80 = Book value at March 31, 2011 $4.78 20
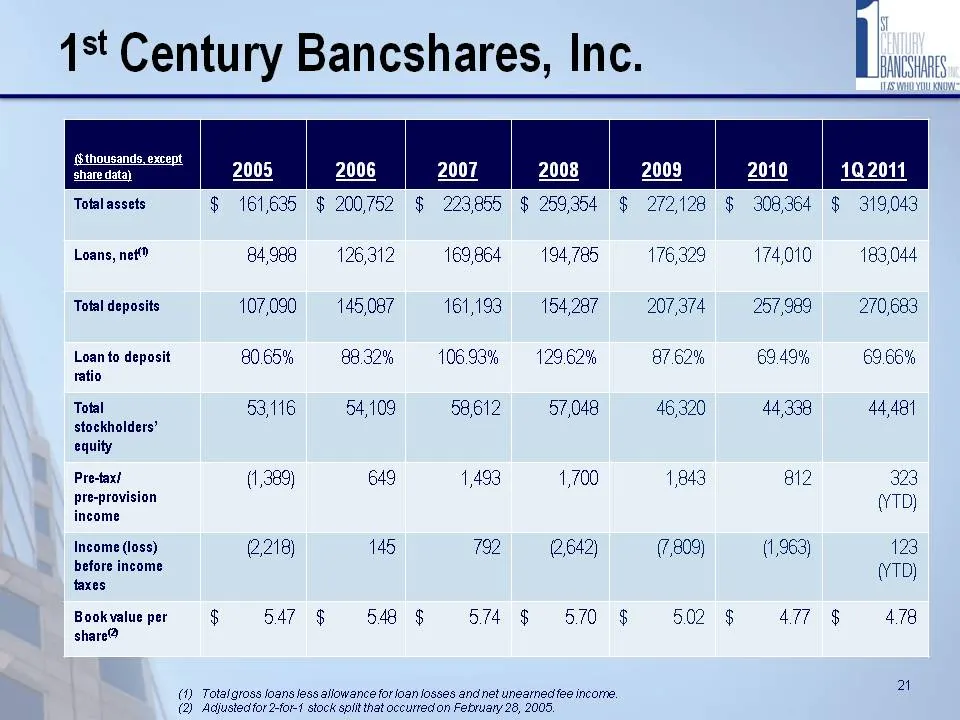
Slide 23: Selected Financial Data
Total assets Loans, net? Total deposits Loan to deposit ratio Total stockholders’ equity Precaxt pre-pravision income Income (loss) before income faxes Book value per share® $ 161,635 $ 200752 § 223855 $ 259.354 $ 272128 $ 308,364 84,988 107,090 80.65% 53,116 (1,389) 2218) $ 547 § 126312 169,864 = 1
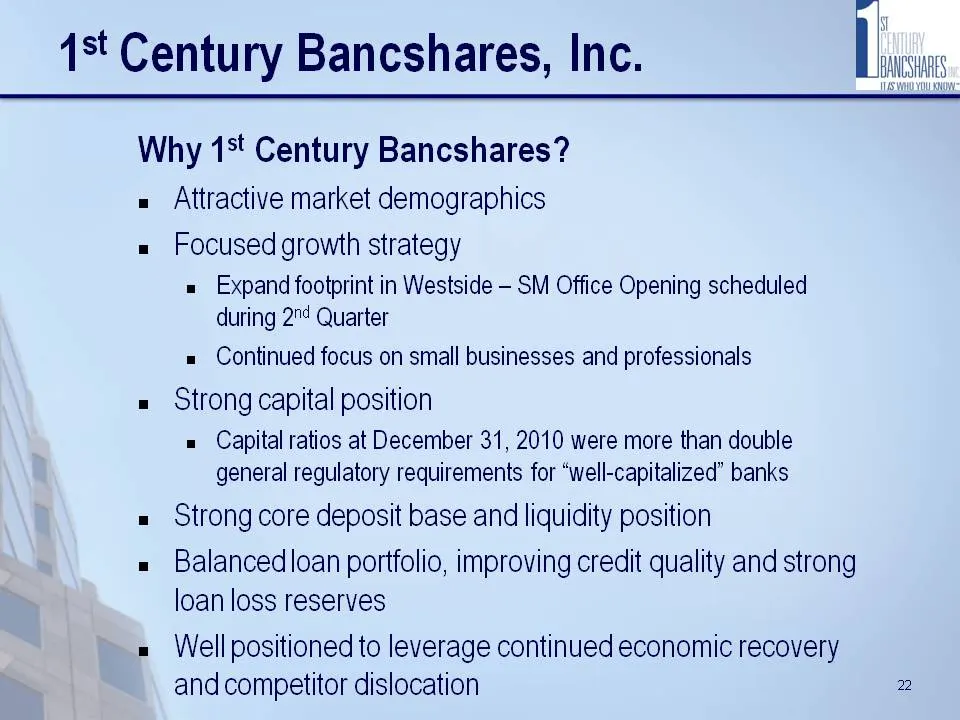
Slide 24: Why 1st Century Bancshares?
1st Century Bancshares, Inc. Why 1st Century Bancshares? Attractive market demographics Focused growth strategy = Expand footprint in Westside - SM Office Opening scheduled during 2"4 Quarter = Continued focus on small businesses and professionals Strong capital position = Capital ratios at December
Slide 25: 1st Century Bancshares, Inc.
1st Century Bancshares, Inc. Feel free to reach any of us with any questions. Or better yet, contact us to refer family, friends and colleagues to your family here at 1st Century Bank. Alan|.Rothenberg = Chairman & CEO 310.270.9501 Jason DiNapoli President & COO 310.270.9505 Bonnie Rubin SVP, Region
Source: SEC EDGAR · 8-K filed May 26, 2011
More decks from 1st Century Bancshares Inc
 Shareholder Meeting (May 2015)23 slides · May 7, 2015
 Investor Presentation (May 2014)26 slides · May 8, 2014
 Investor Presentation (May 2013)26 slides · May 8, 2013
 Investor Presentation (May 2012)24 slides · May 21, 2012
 Investor Presentation (December 2010)27 slides · Dec 1, 2010
 Investor Presentation (September 2010)27 slides · Sep 14, 2010