Korn Ferry · NYSE:KFY
Korn Ferry — Investor Presentation (November 2017)
32 slides from Korn Ferry's investor presentation, Nov 15, 2017
Slide 1: Landscape and Reward Trends in FMCG
Landscape and Reward Trends in FMCG Presented by: Rachel Marling, Principal November 15, 2017
Slide 2: Agenda
Agenda 1 ECONOMIC, CULTURAL AND BUSINESS LANDSCAPE FOR BWS 2 GLOBAL BUSINESS AND TALENT CHALLENGES 3 COMPENSATION TRENDS 4 IMPLICATIONS 5 Q&A © 2016 Korn Ferry. All rights reserved 2
Slide 3: Economic, Cultural and Business Landscape for BWS
1 Economic, Cultural and Business Landscape for BWS
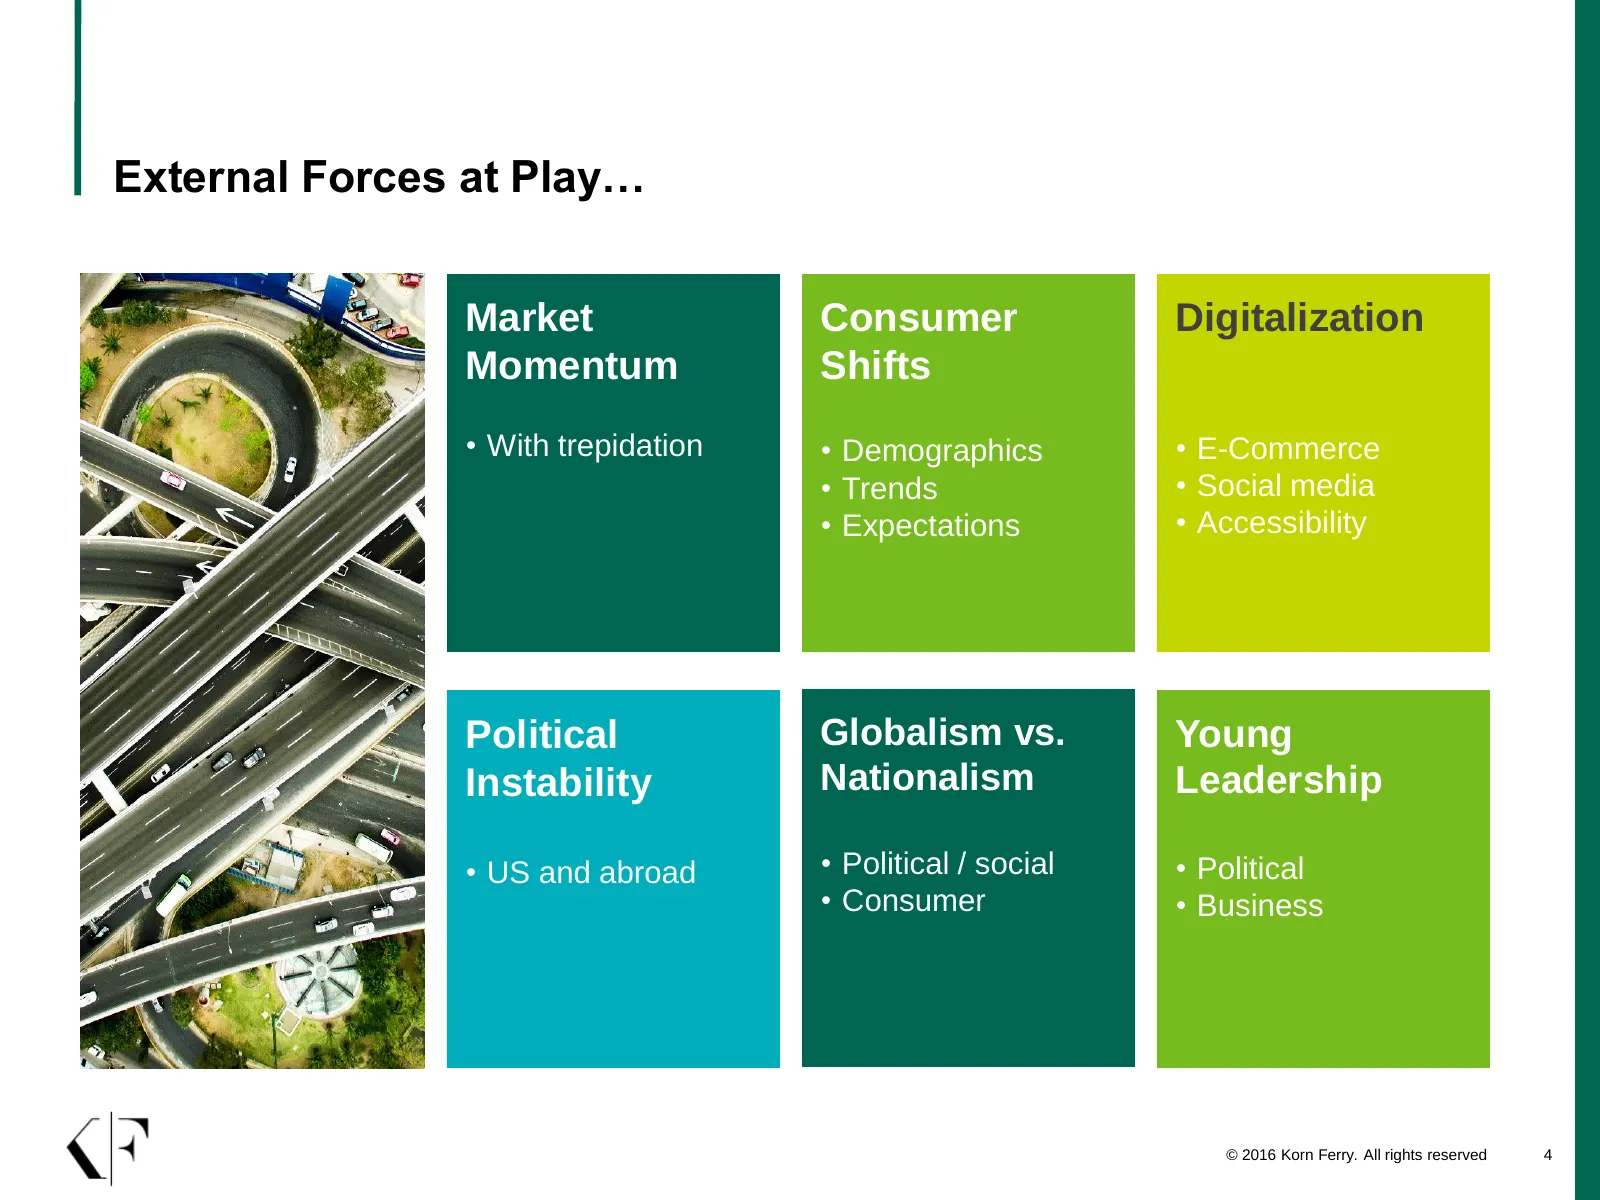
Slide 4: External Forces at Play…
External Forces at Play… Market Consumer Digitalization Momentum Shifts • With trepidation • Demographics • E-Commerce • Trends • Social media • Expectations • Accessibility Political Globalism vs. Young Instability Nationalism Leadership • US and abroad • Political / social • Political • Consumer •
Slide 5: US Alcoholic Beverage Market Product Mix
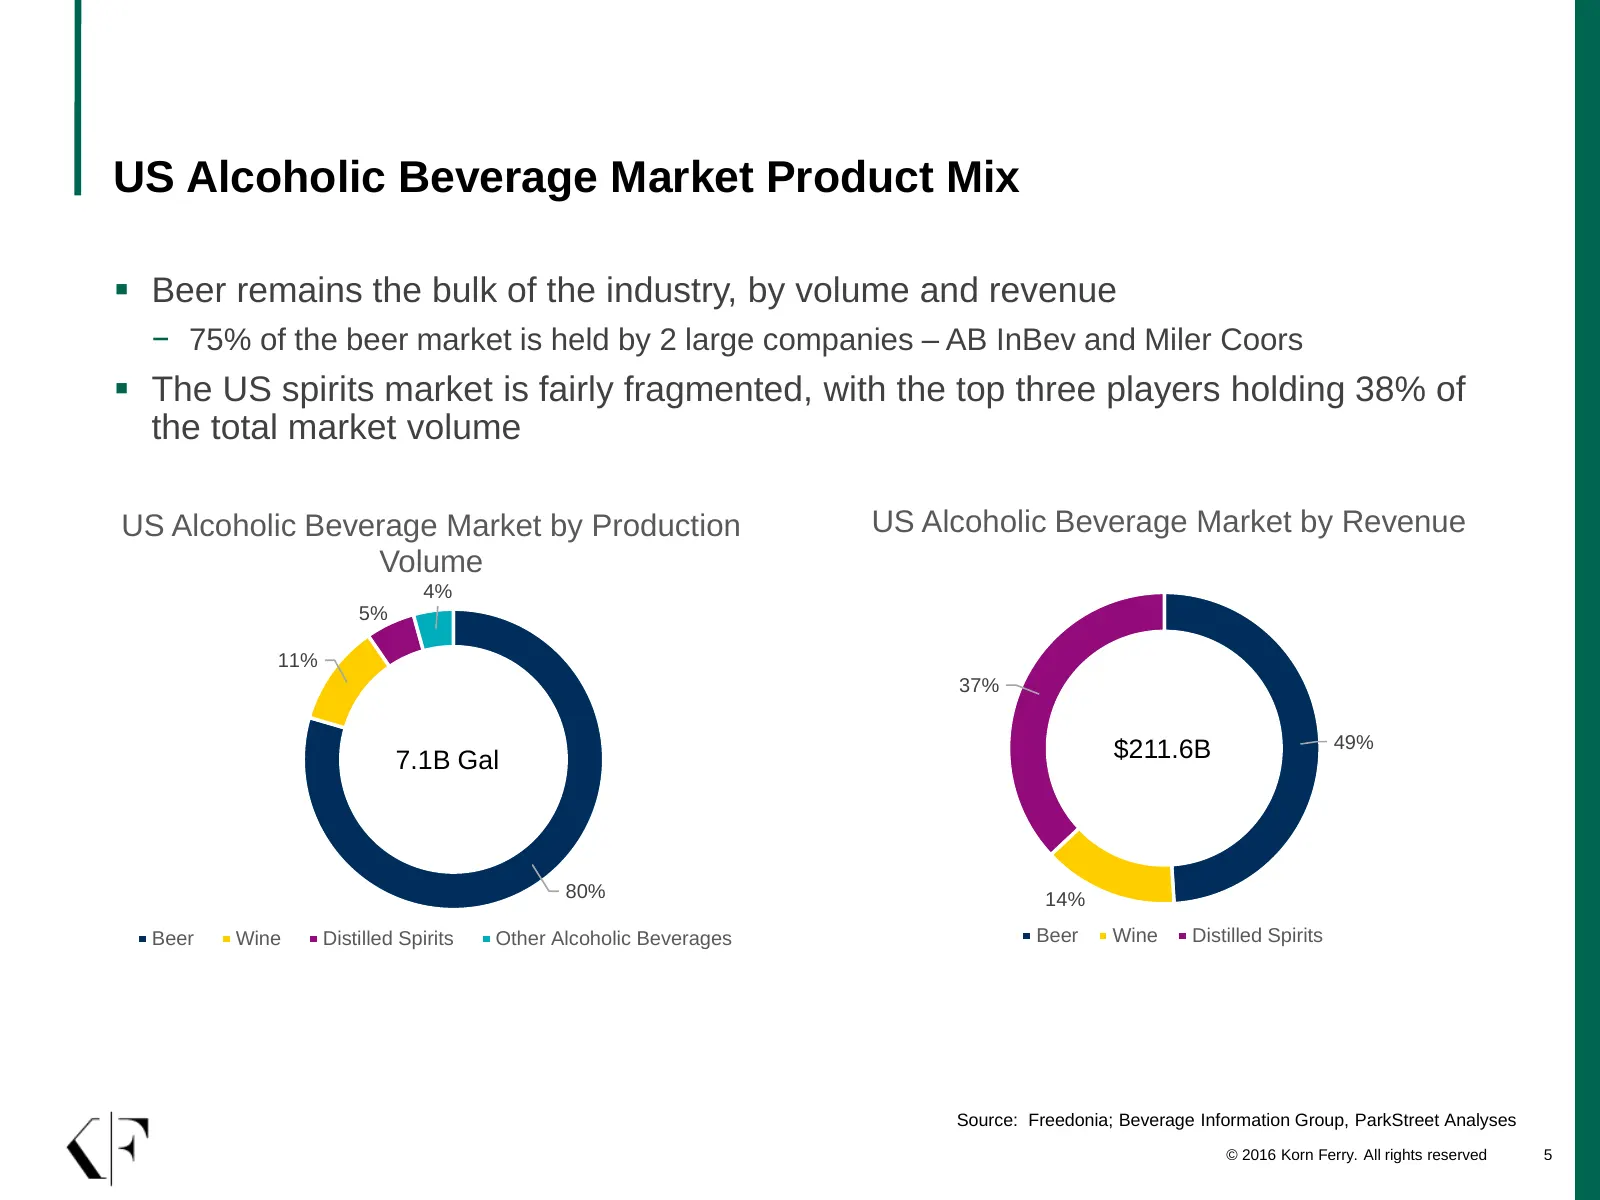
US Alcoholic Beverage Market Product Mix ▪ Beer remains the bulk of the industry, by volume and revenue − 75% of the beer market is held by 2 large companies – AB InBev and Miler Coors ▪ The US spirits market is fairly fragmented, with the top three players holding 38% of the total market volume US
Slide 6: The Industry is Shifting…
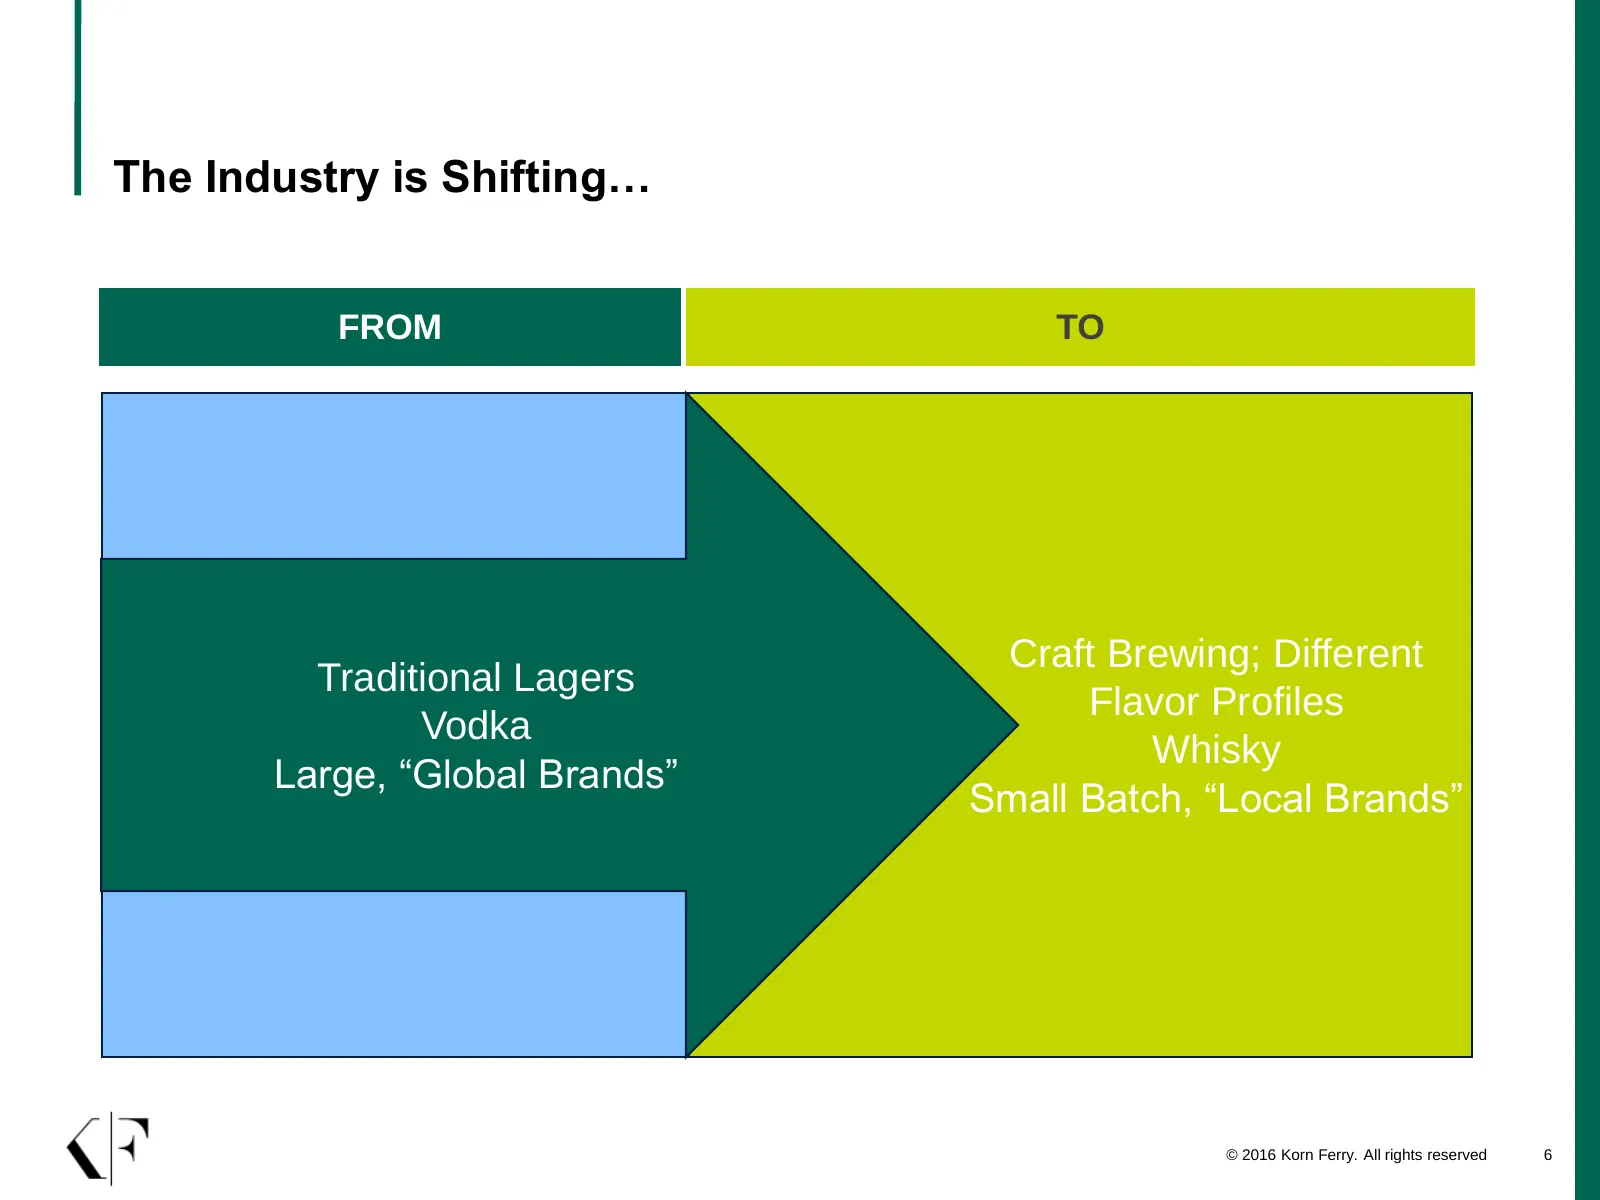
The Industry is Shifting… FROM TO Craft Brewing; Different Traditional Lagers Flavor Profiles Vodka Whisky Large, “Global Brands” Small Batch, “Local Brands” © 2016 Korn Ferry. All rights reserved 6
Slide 7: Changing Product Mix
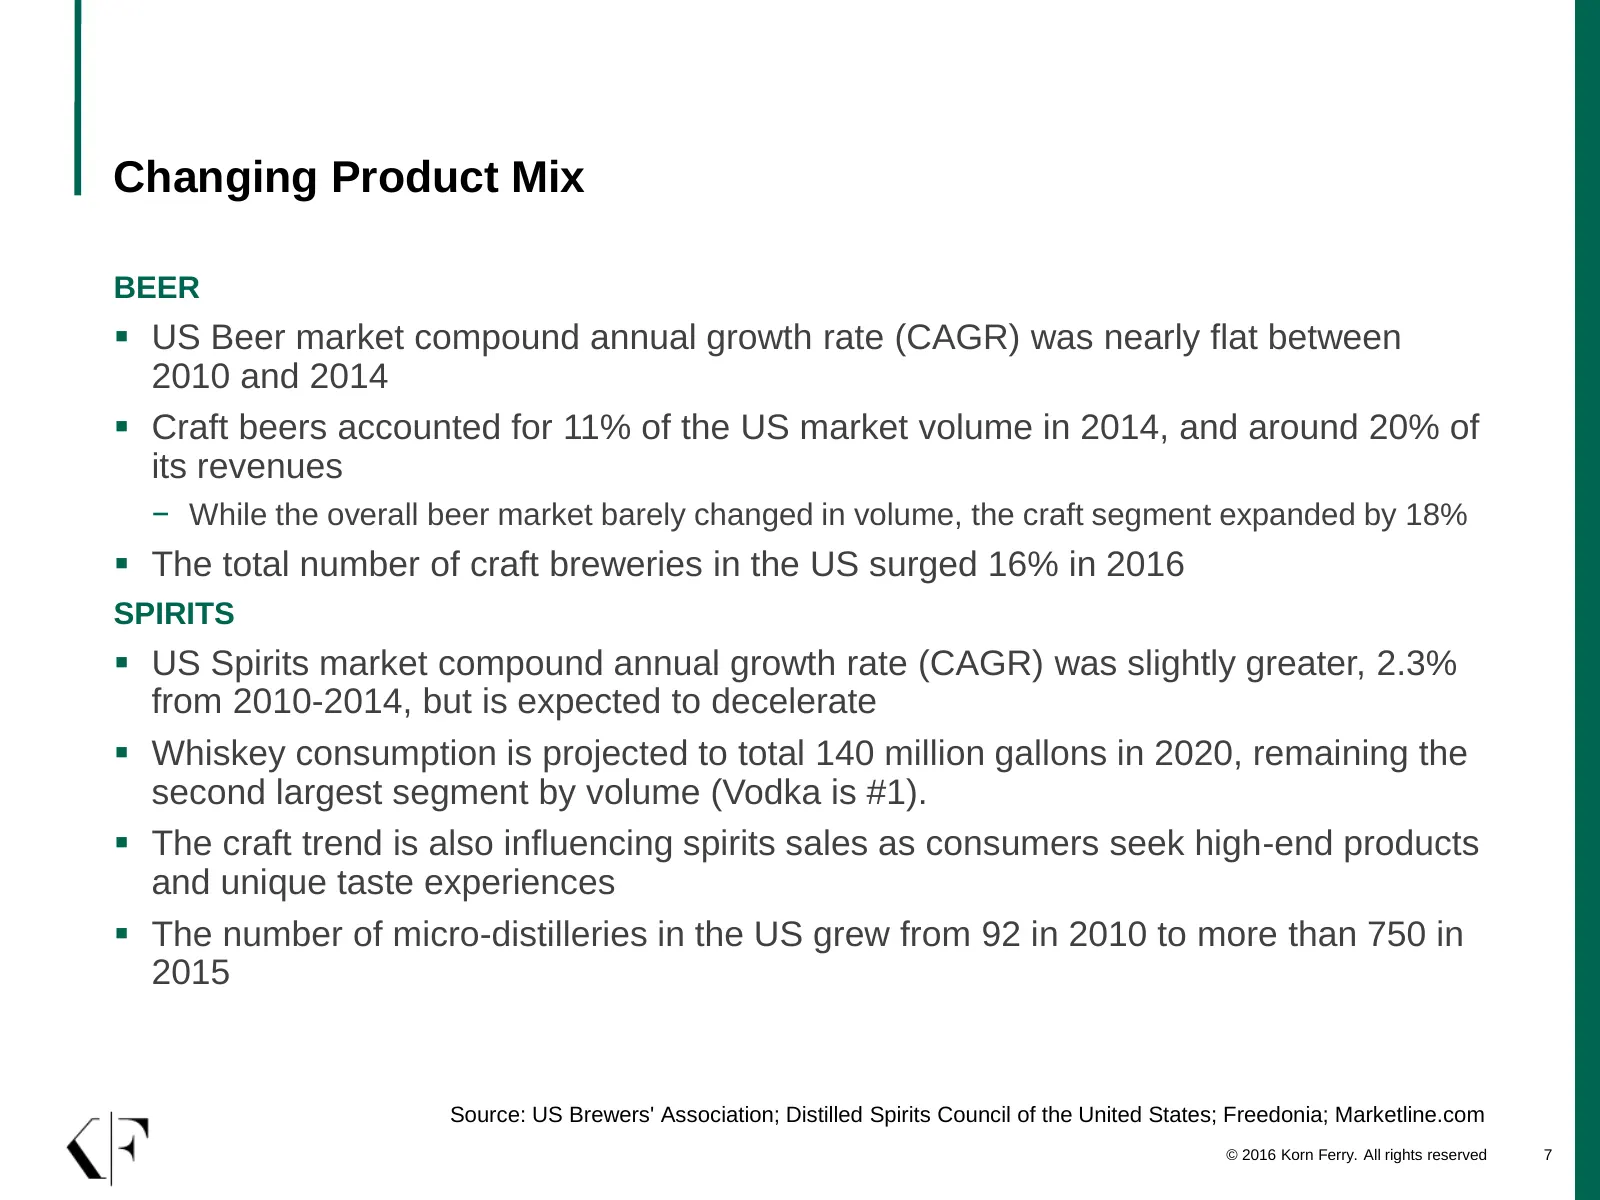
Changing Product Mix BEER ▪ US Beer market compound annual growth rate (CAGR) was nearly flat between 2010 and 2014 ▪ Craft beers accounted for 11% of the US market volume in 2014, and around 20% of its revenues − While the overall beer market barely changed in volume, the craft segment expanded by
Slide 8: Business and Talent Challenges
2 Business and Talent Challenges
Slide 9: Poll Question
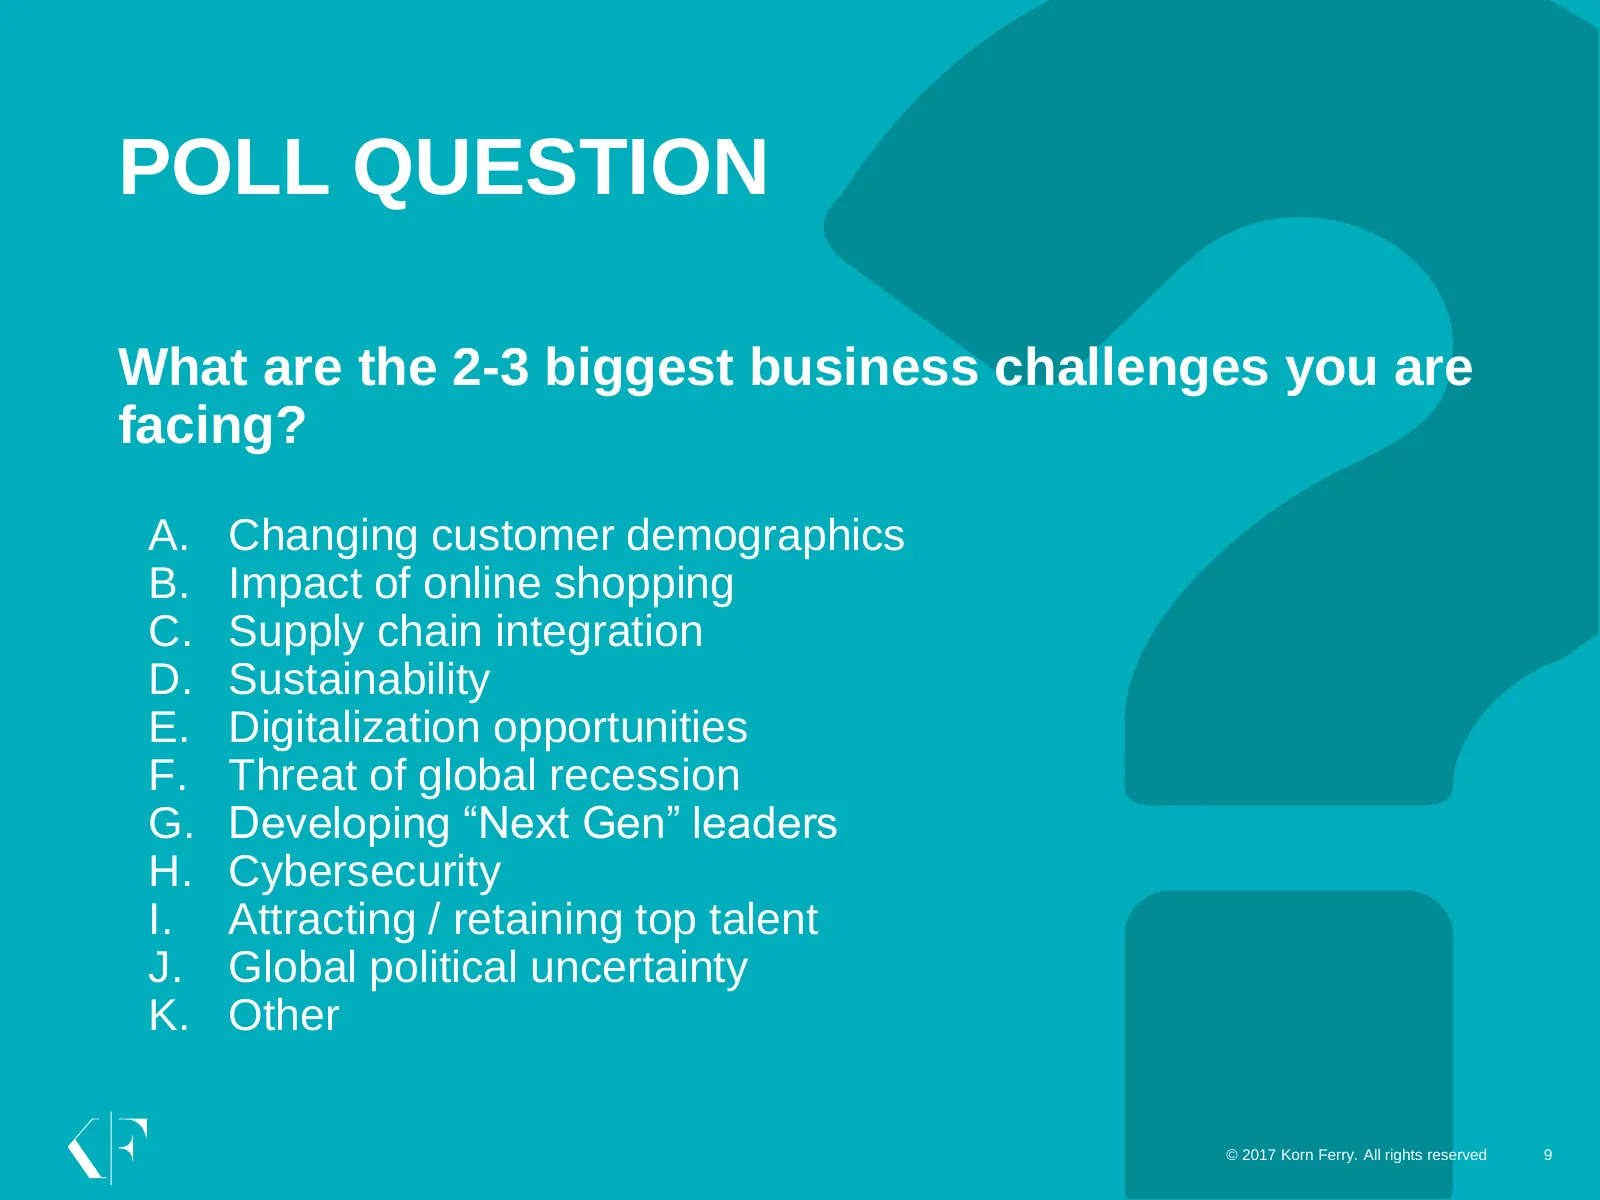
POLL QUESTION What are the 2-3 biggest business challenges you are facing? A. Changing customer demographics B. Impact of online shopping C. Supply chain integration D. Sustainability E. Digitalization opportunities F. Threat of global recession G. Developing “Next Gen” leaders H. Cybersecurity I. A
Slide 10: What CEOs are Concerned About: “Hot Button” Issues
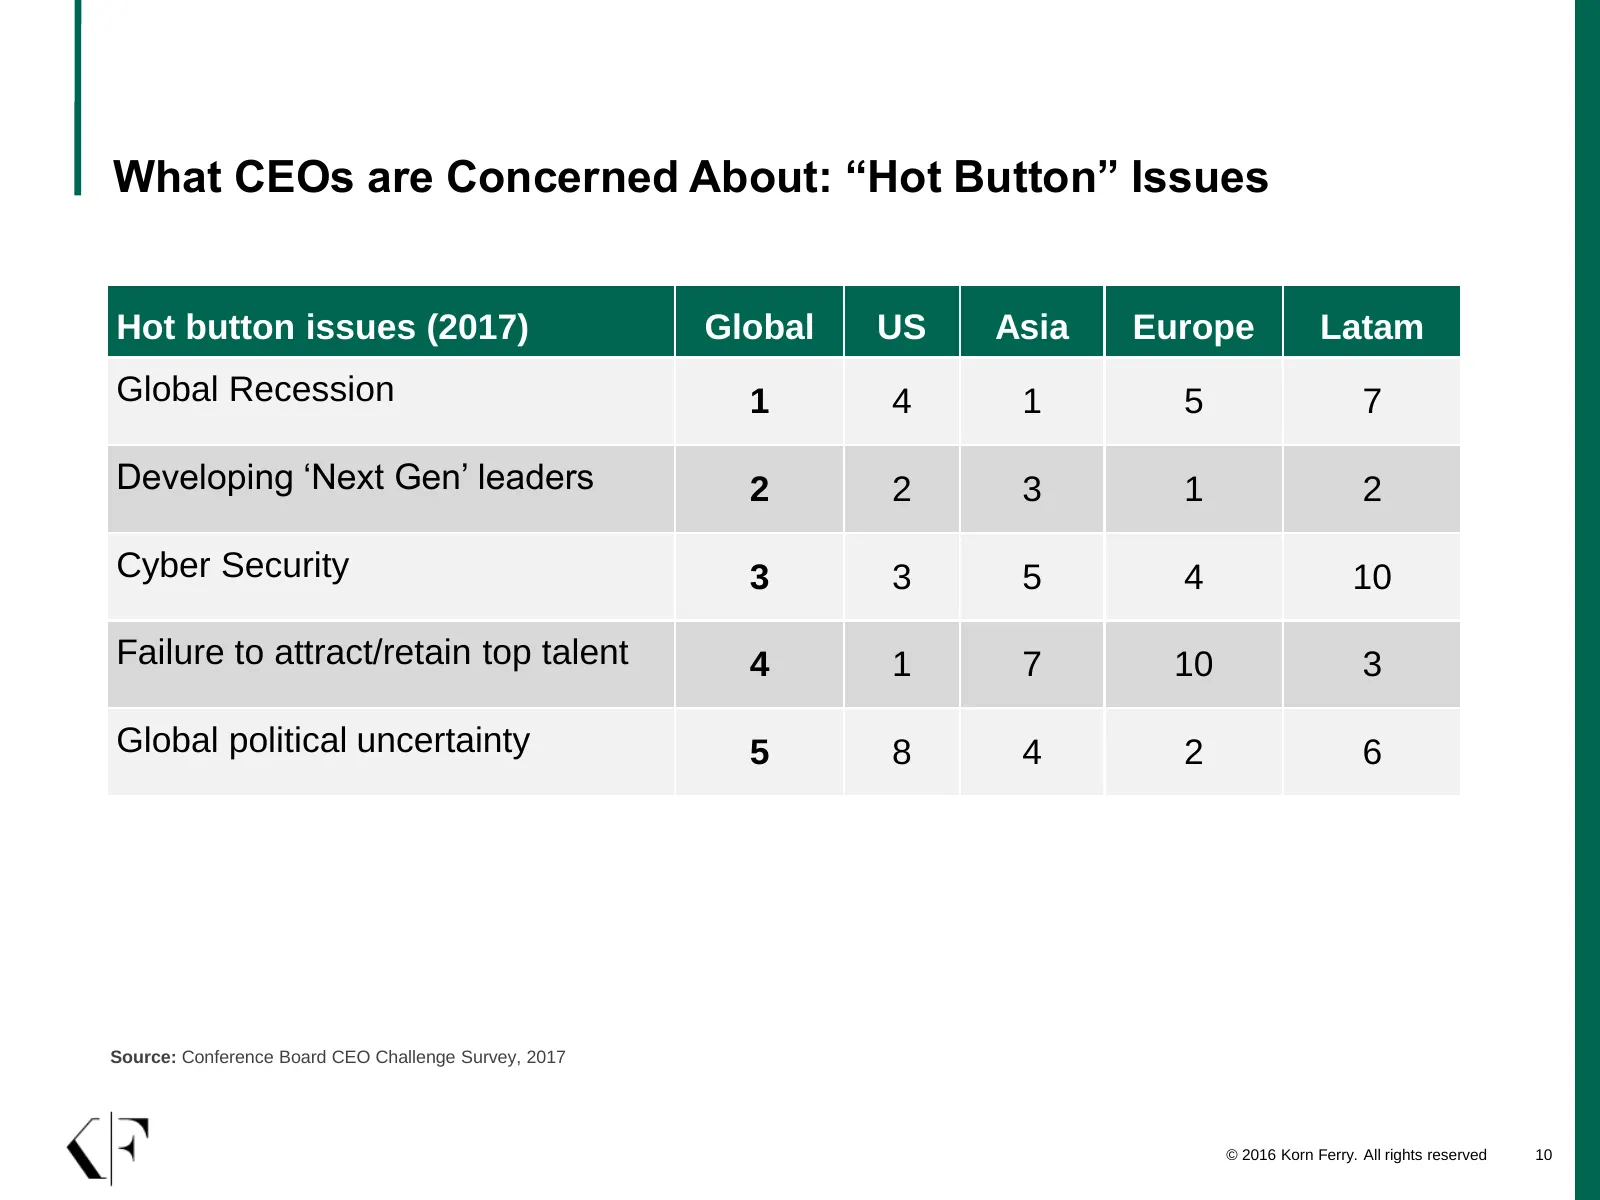
What CEOs are Concerned About: “Hot Button” Issues Hot button issues (2017) Global US Asia Europe Latam Global Recession 1 4 1 5 7 Developing ‘Next Gen’ leaders 2 2 3 1 2 Cyber Security 3 3 5 4 10 Failure to attract/retain top talent 4 1 7 10 3 Global political uncertainty 5 8 4 2 6 Source: Conferen
Slide 11: Issues Facing the Broader FMCG Sector
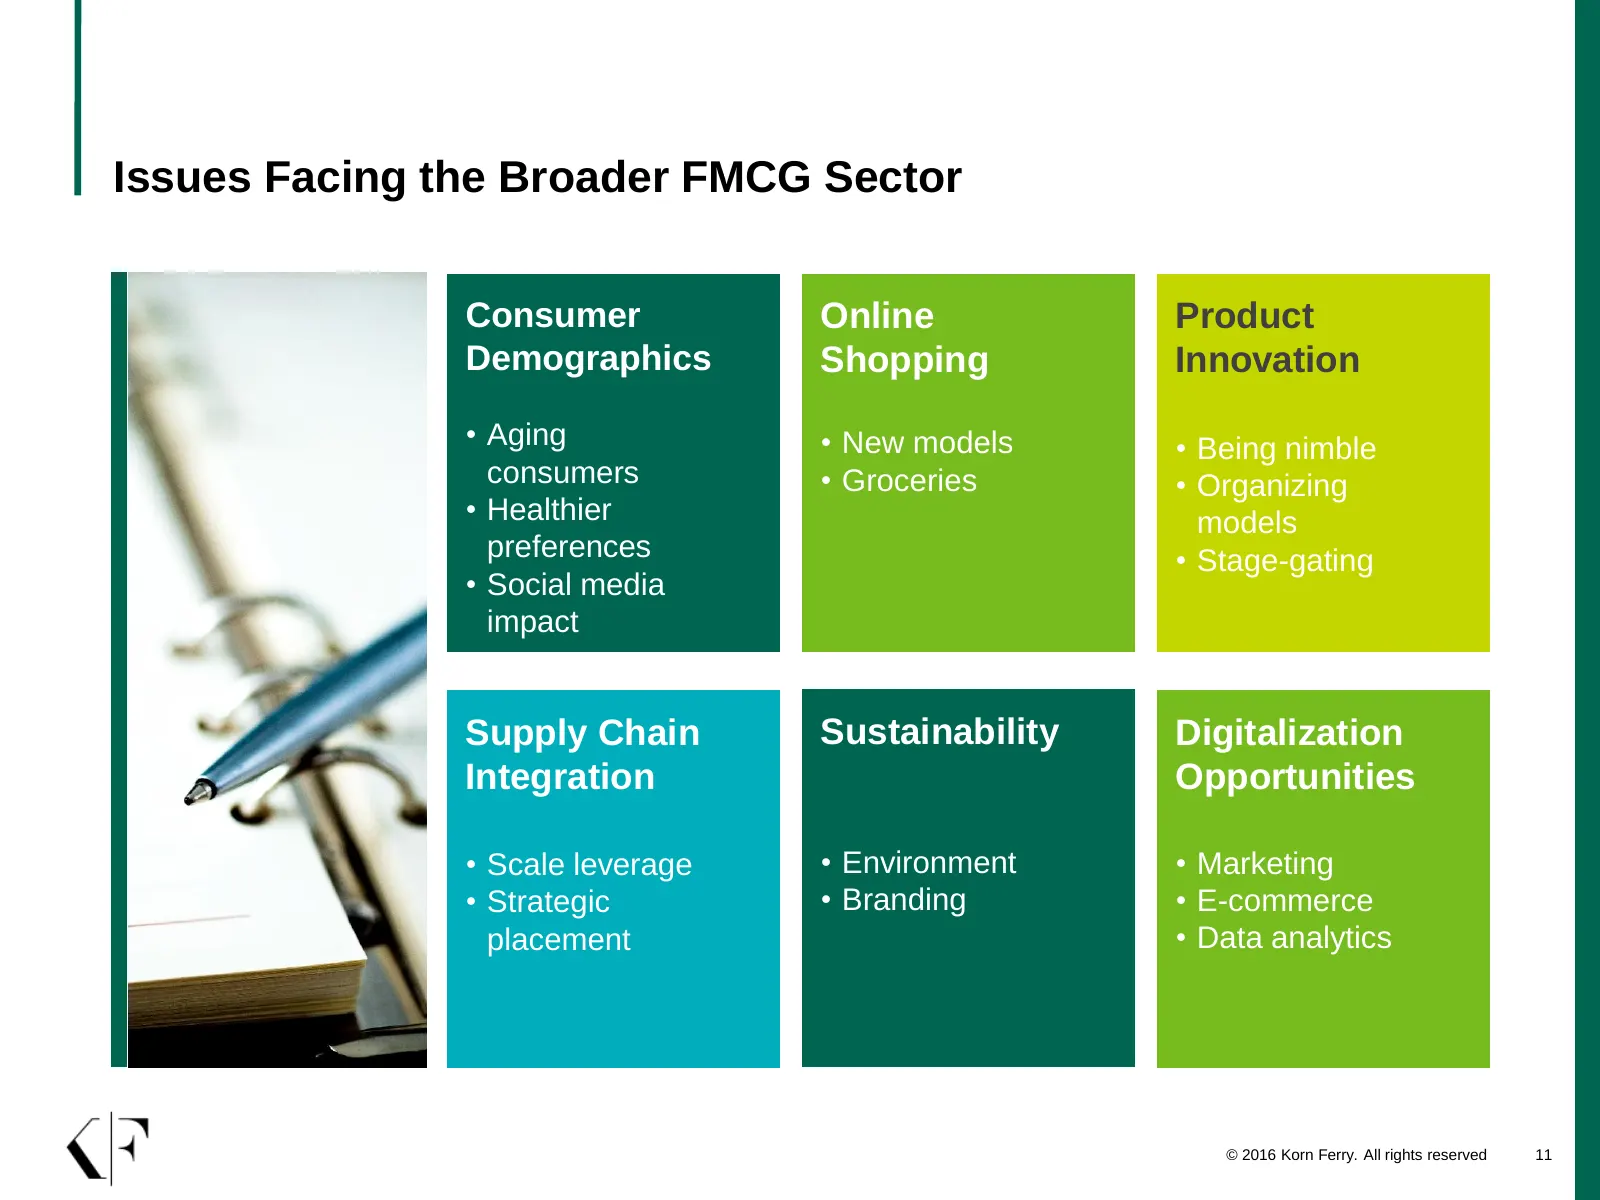
Issues Facing the Broader FMCG Sector Consumer Online Product Demographics Shopping Innovation • Aging • New models • Being nimble consumers • Groceries • Organizing • Healthier models preferences • Stage-gating • Social media impact Supply Chain Sustainability Digitalization Integration Opportuniti
Slide 12: What CEOs are Concerned About: Human Capital Strategies
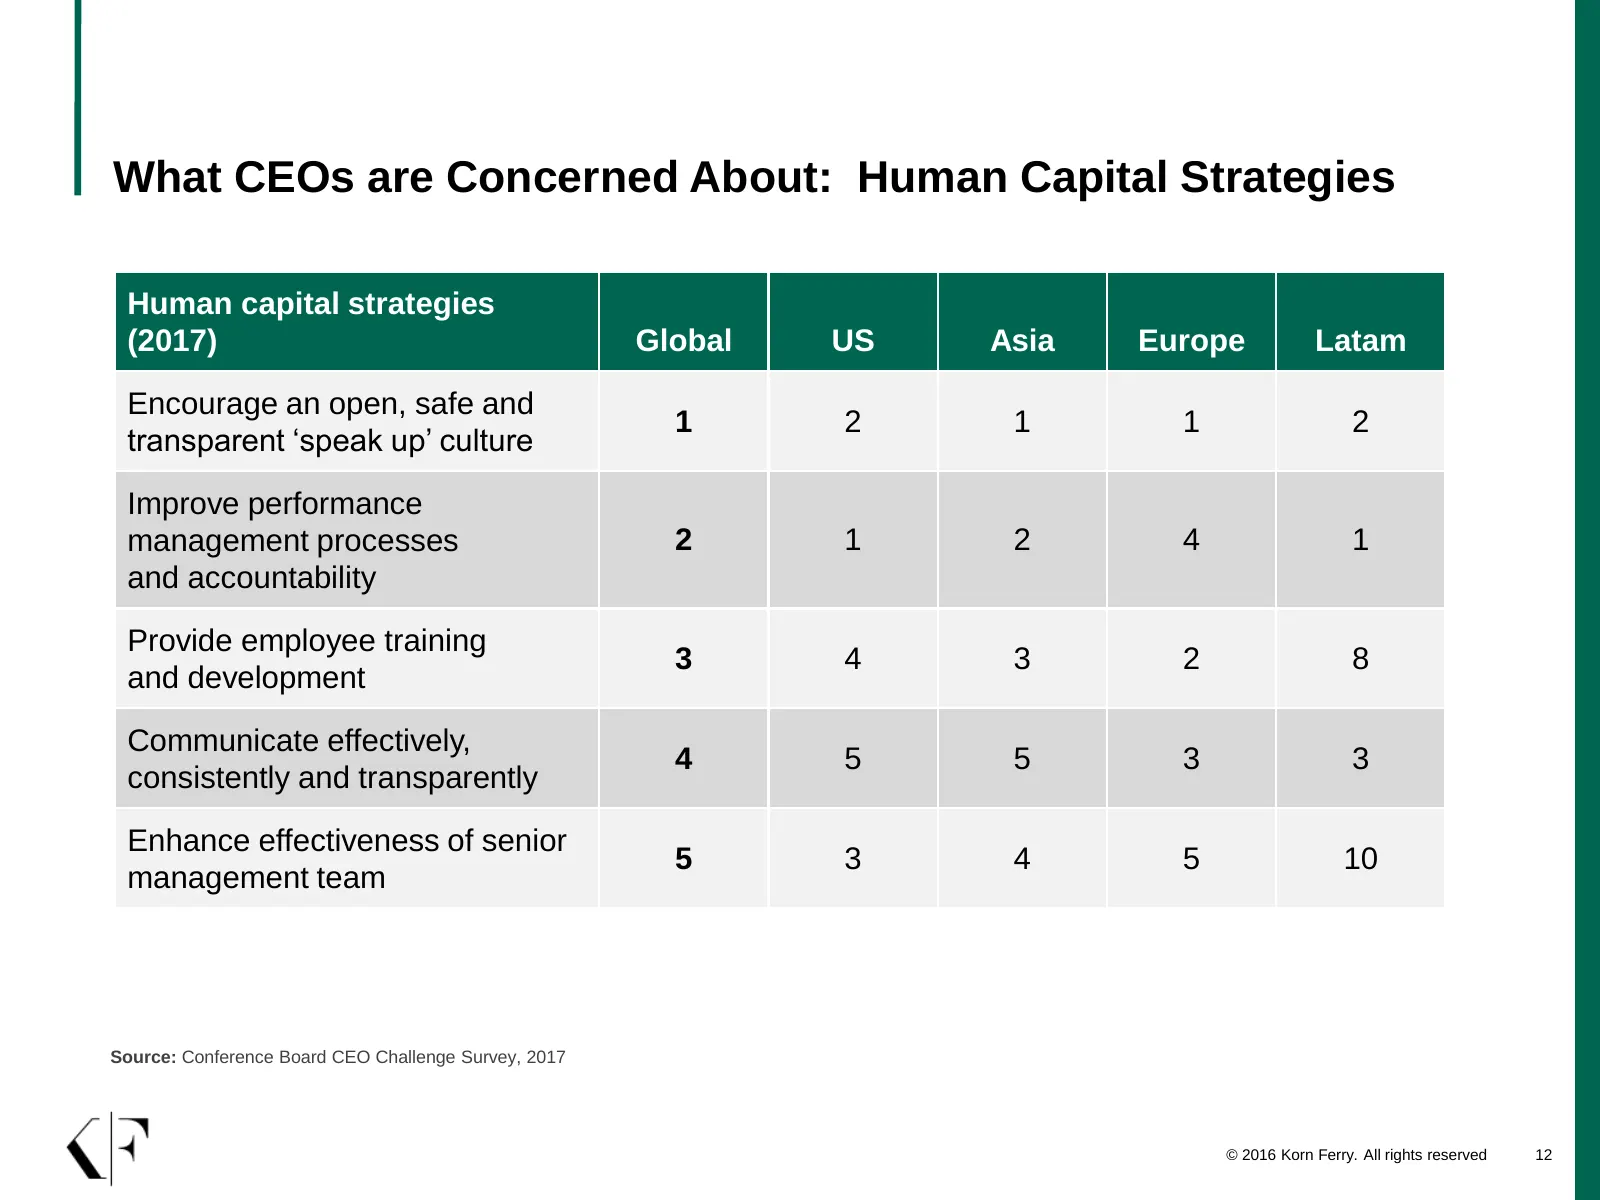
What CEOs are Concerned About: Human Capital Strategies Human capital strategies (2017) Global US Asia Europe Latam Encourage an open, safe and 1 2 1 1 2 transparent ‘speak up’ culture Improve performance management processes 2 1 2 4 1 and accountability Provide employee training 3 4 3 2 8 and devel
Slide 13: FMCG People Management Trends
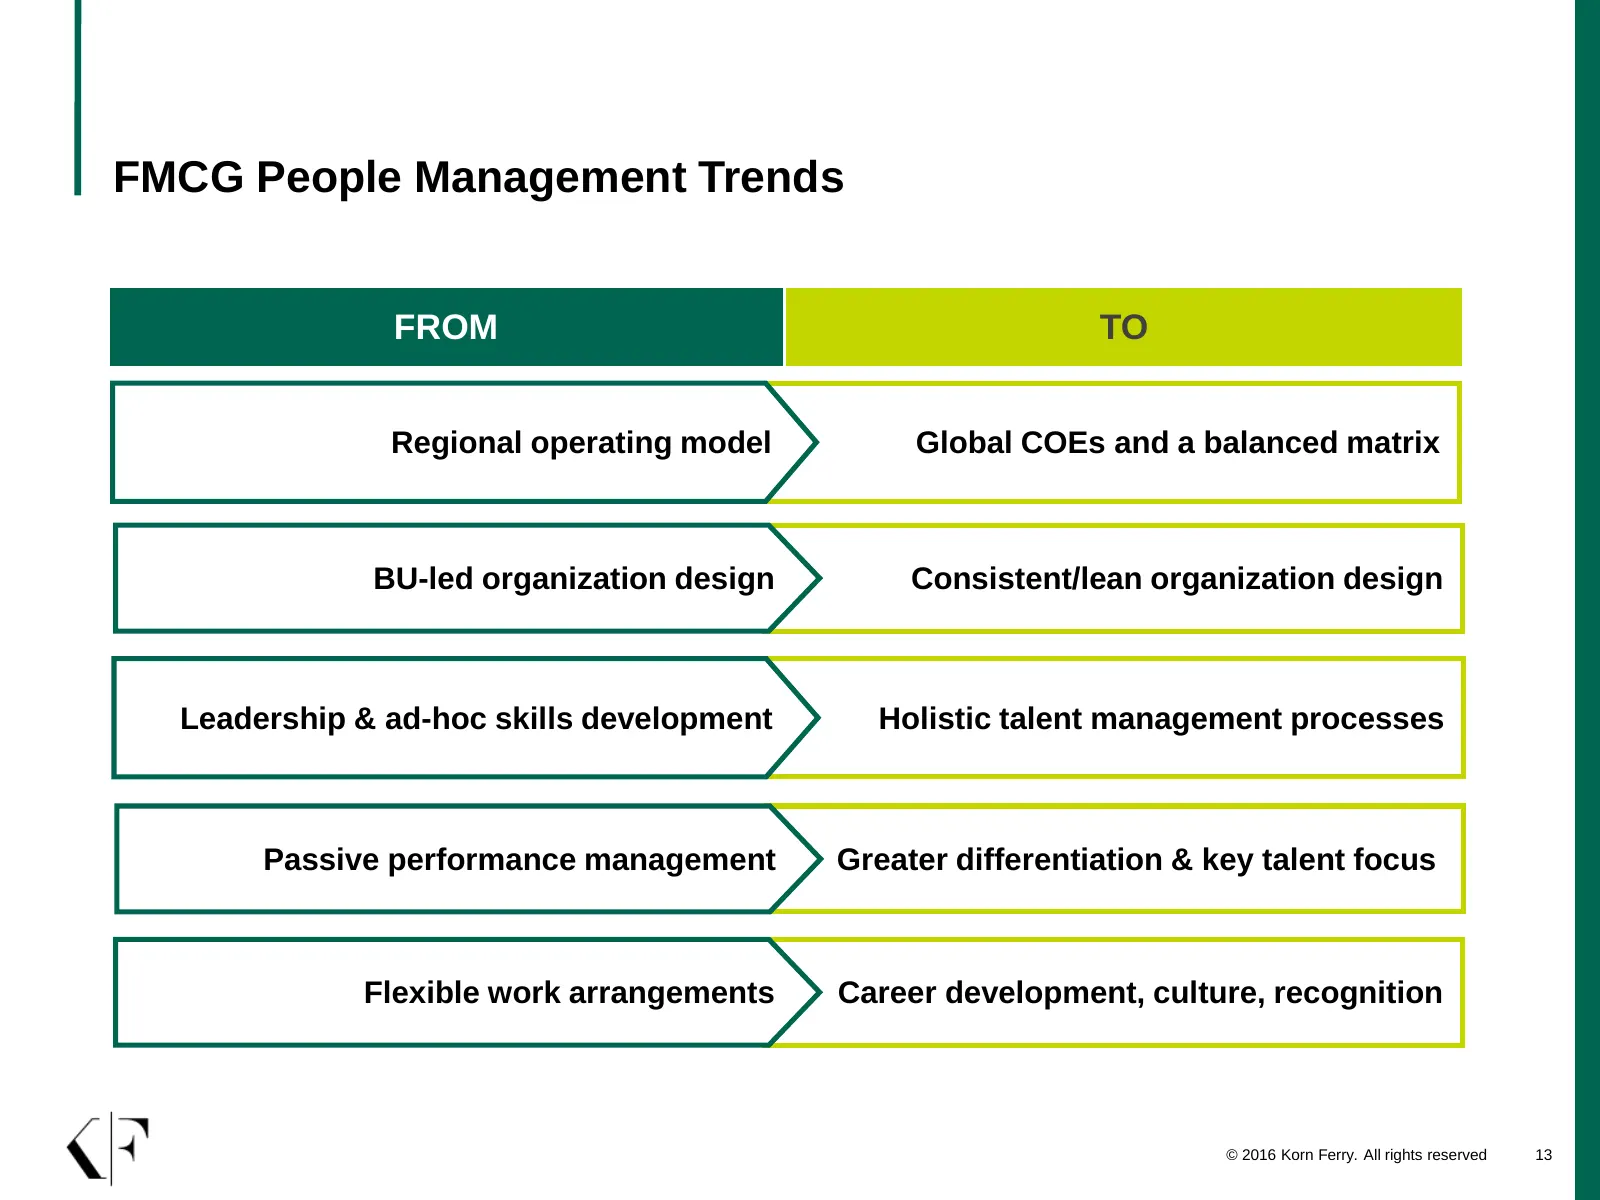
FMCG People Management Trends FROM TO Regional operating model Global COEs and a balanced matrix BU-led organization design Consistent/lean organization design Leadership & ad-hoc skills development Holistic talent management processes Passive performance management Greater differentiation & key tal
Slide 14: Recruitment Challenges (US)
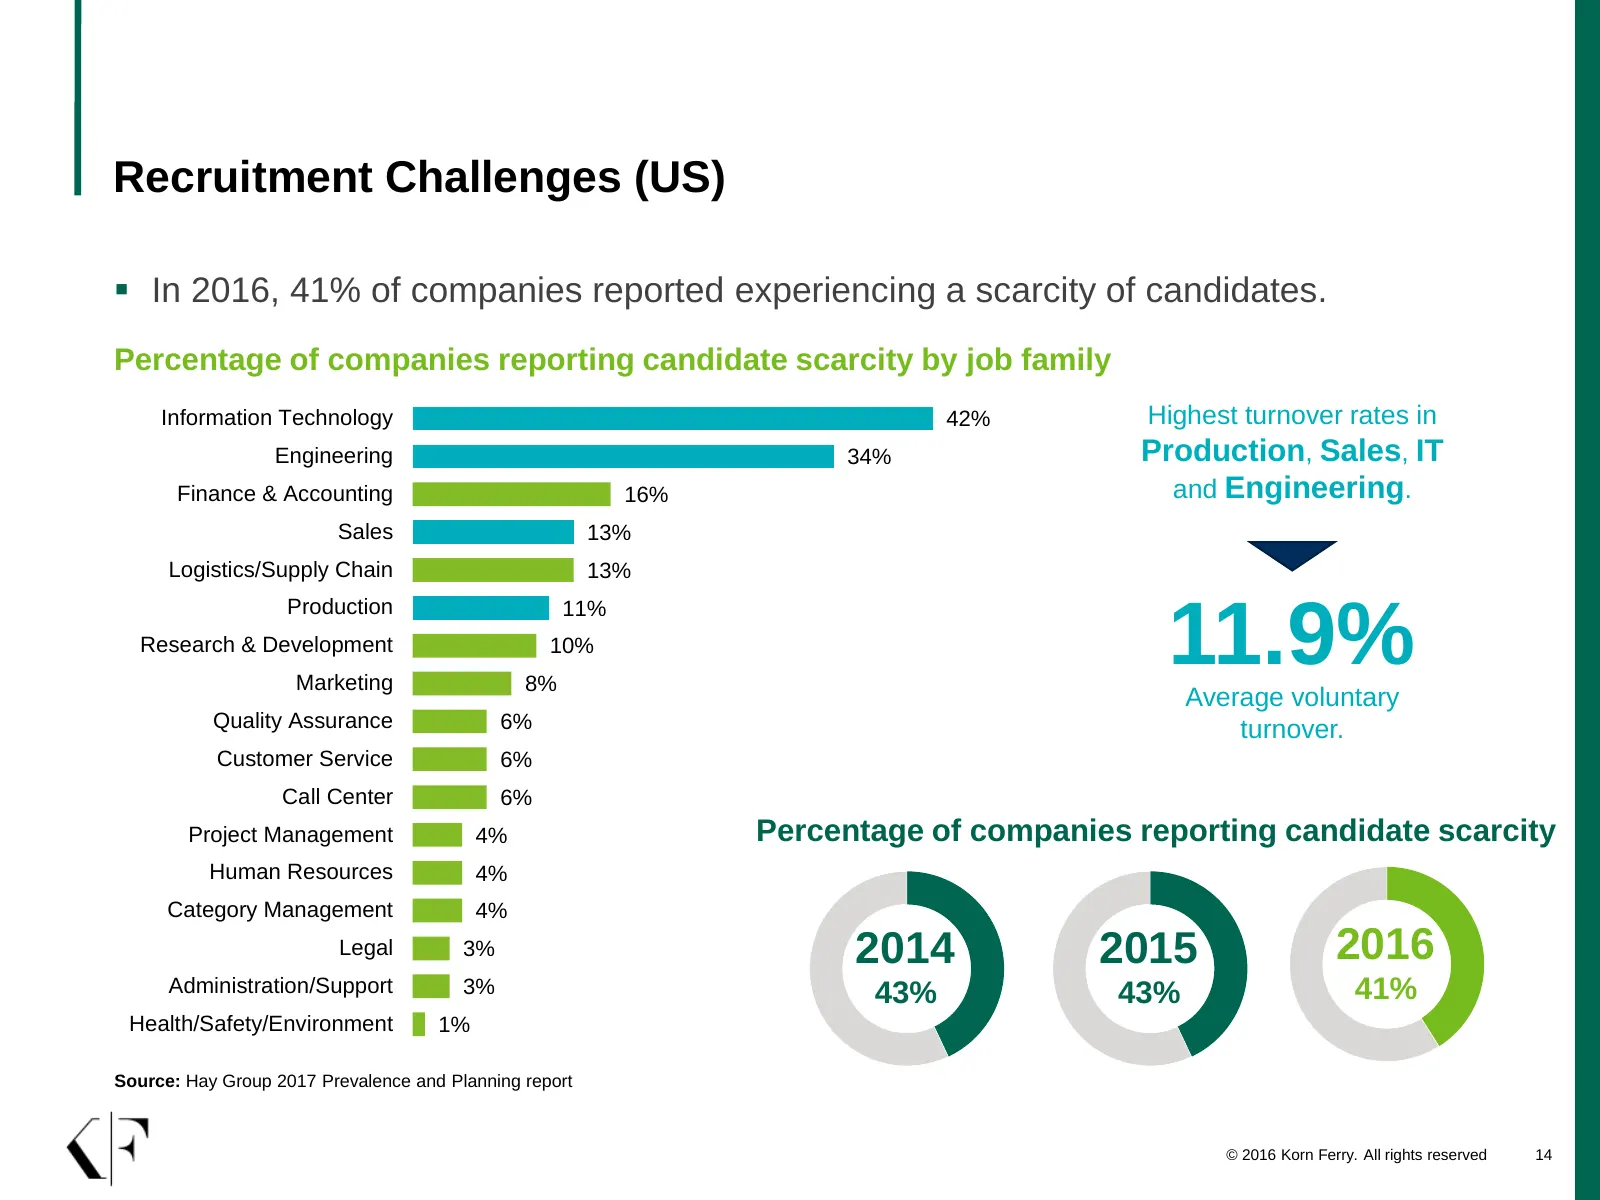
Recruitment Challenges (US) ▪ In 2016, 41% of companies reported experiencing a scarcity of candidates. Percentage of companies reporting candidate scarcity by job family Information Technology 42% Highest turnover rates in Engineering 34% Production, Sales, IT Finance & Accounting 16% and Engineeri
Slide 15: Recruitment Policy - FYI
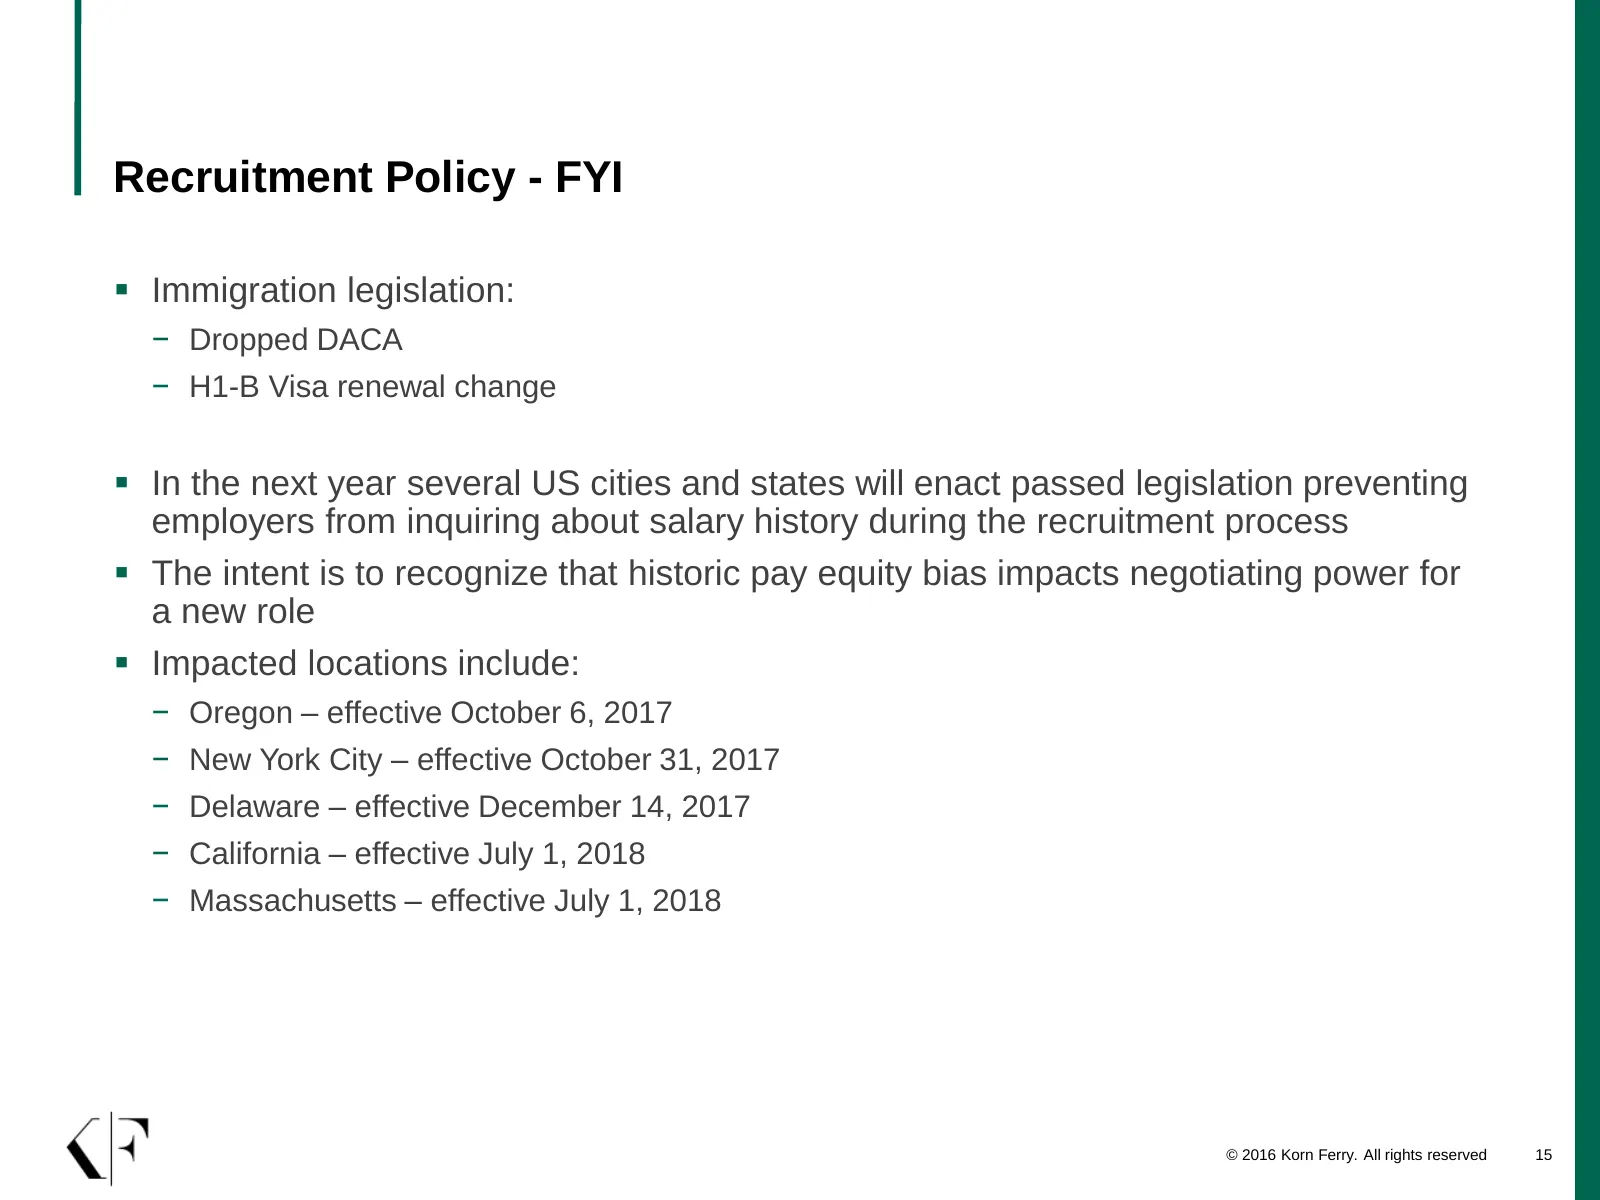
Recruitment Policy - FYI ▪ Immigration legislation: − Dropped DACA − H1-B Visa renewal change ▪ In the next year several US cities and states will enact passed legislation preventing employers from inquiring about salary history during the recruitment process ▪ The intent is to recognize that histor
Slide 16: Compensation Trends
3 Compensation Trends
Slide 17: Poll Question
POLL QUESTION What are the 2-3 biggest rewards challenges you are facing? A. Aligning reward strategies and policies with business needs B. Designing robust reward programs C. Effectively managing reward costs D. Rewarding and retaining top performers E. Communication of reward programs F. Engaging
Slide 18: How Sectors are Paying Globally
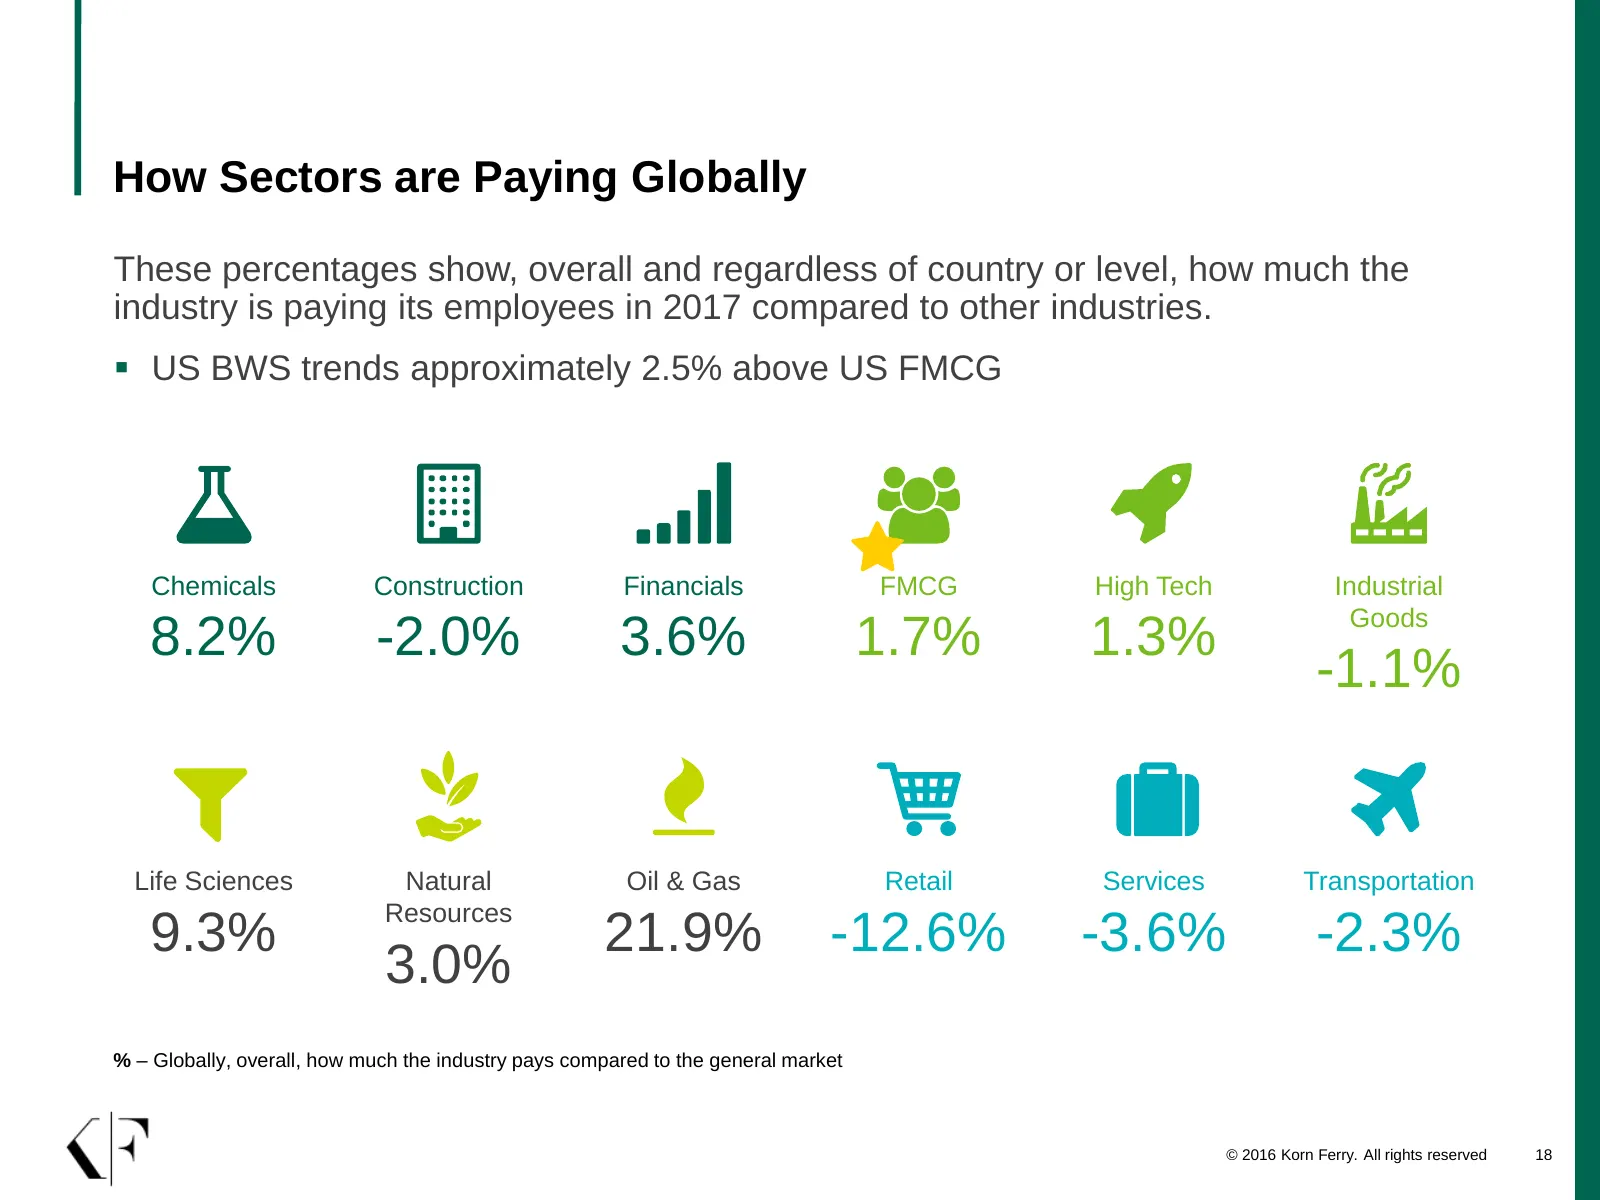
How Sectors are Paying Globally These percentages show, overall and regardless of country or level, how much the industry is paying its employees in 2017 compared to other industries. ▪ US BWS trends approximately 2.5% above US FMCG Chemicals Construction Financials FMCG High Tech Industrial Goods 8
Slide 19: FMCG Reward Trends
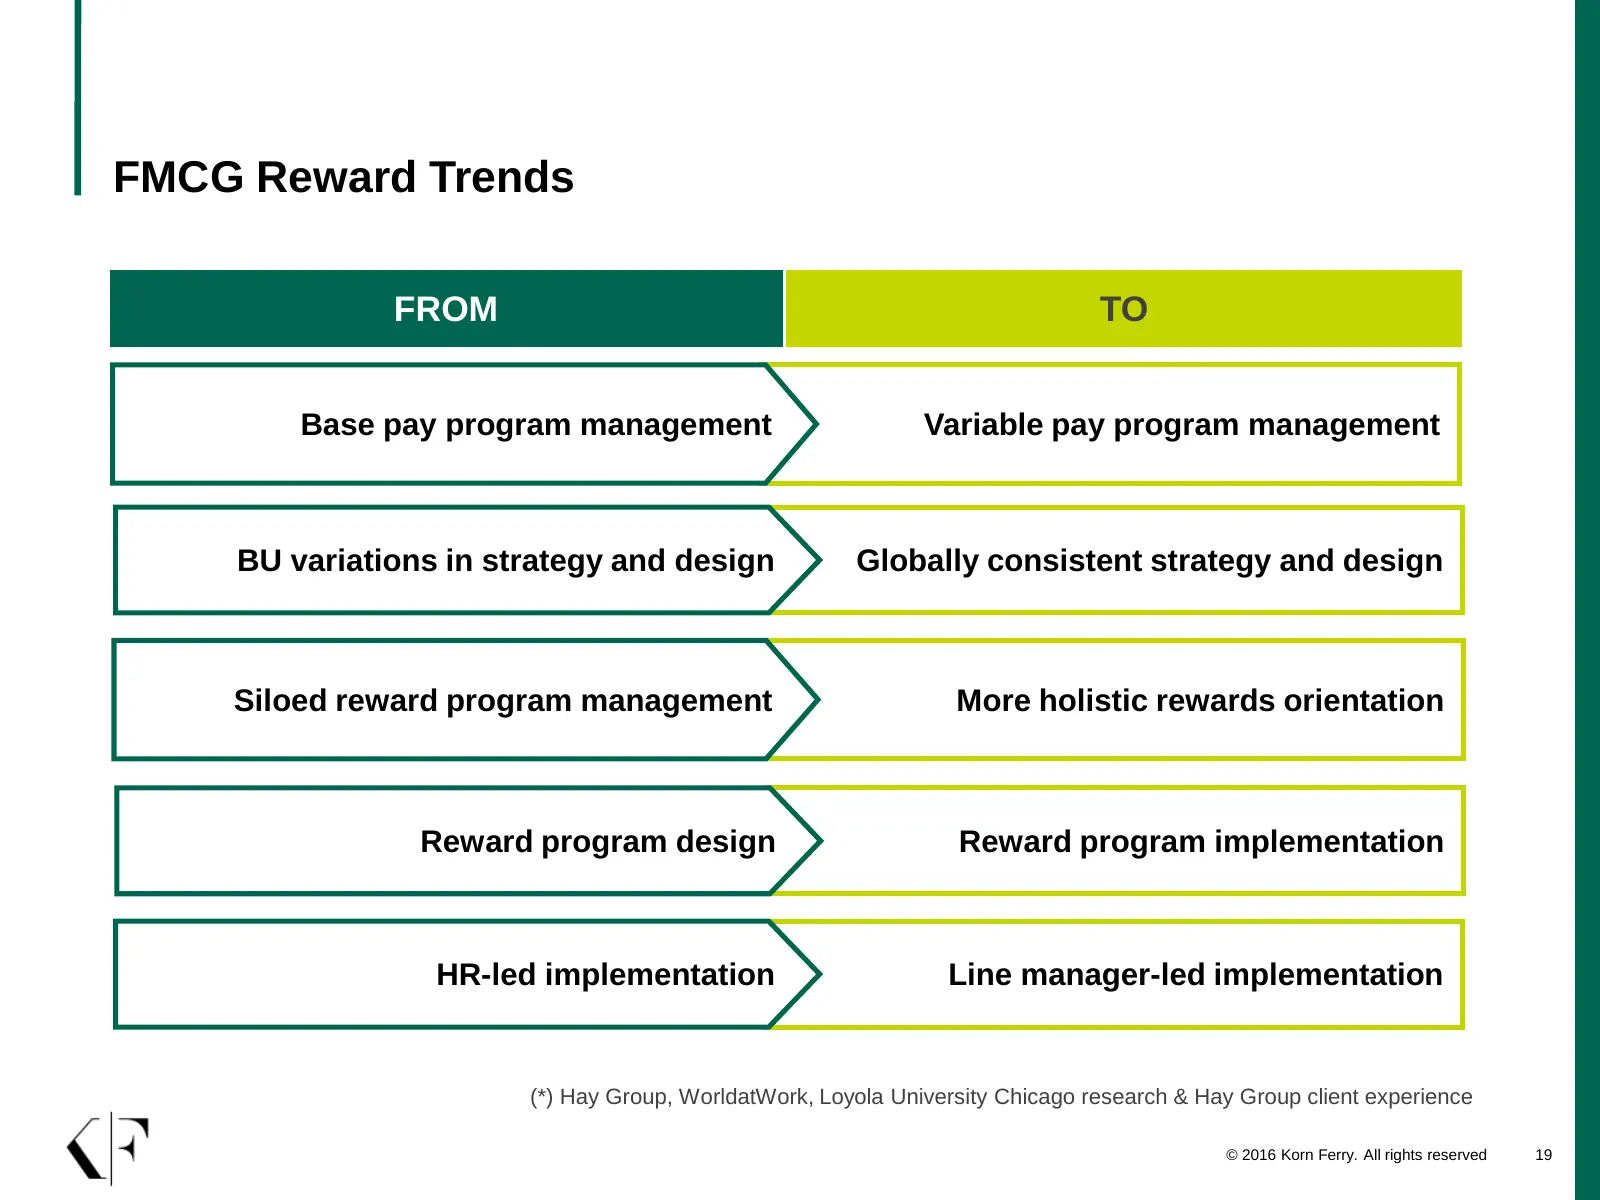
FMCG Reward Trends FROM TO Base pay program management Variable pay program management BU variations in strategy and design Globally consistent strategy and design Siloed reward program management More holistic rewards orientation Reward program design Reward program implementation HR-led implementa
Slide 20: Transparency and Data Access
Transparency and Data Access ▪ Everybody is an expert on pay! How? − Technology – sites like Glassdoor, Payscale, Salary.com – allow employees to easily get comparative data − Much more about pay in the news − Pay for CEOs vs the average employee and top 2% vs. others − Pay for men vs women − Someti
Slide 21: Pay Differentials – Managers vs. Individual Contributors
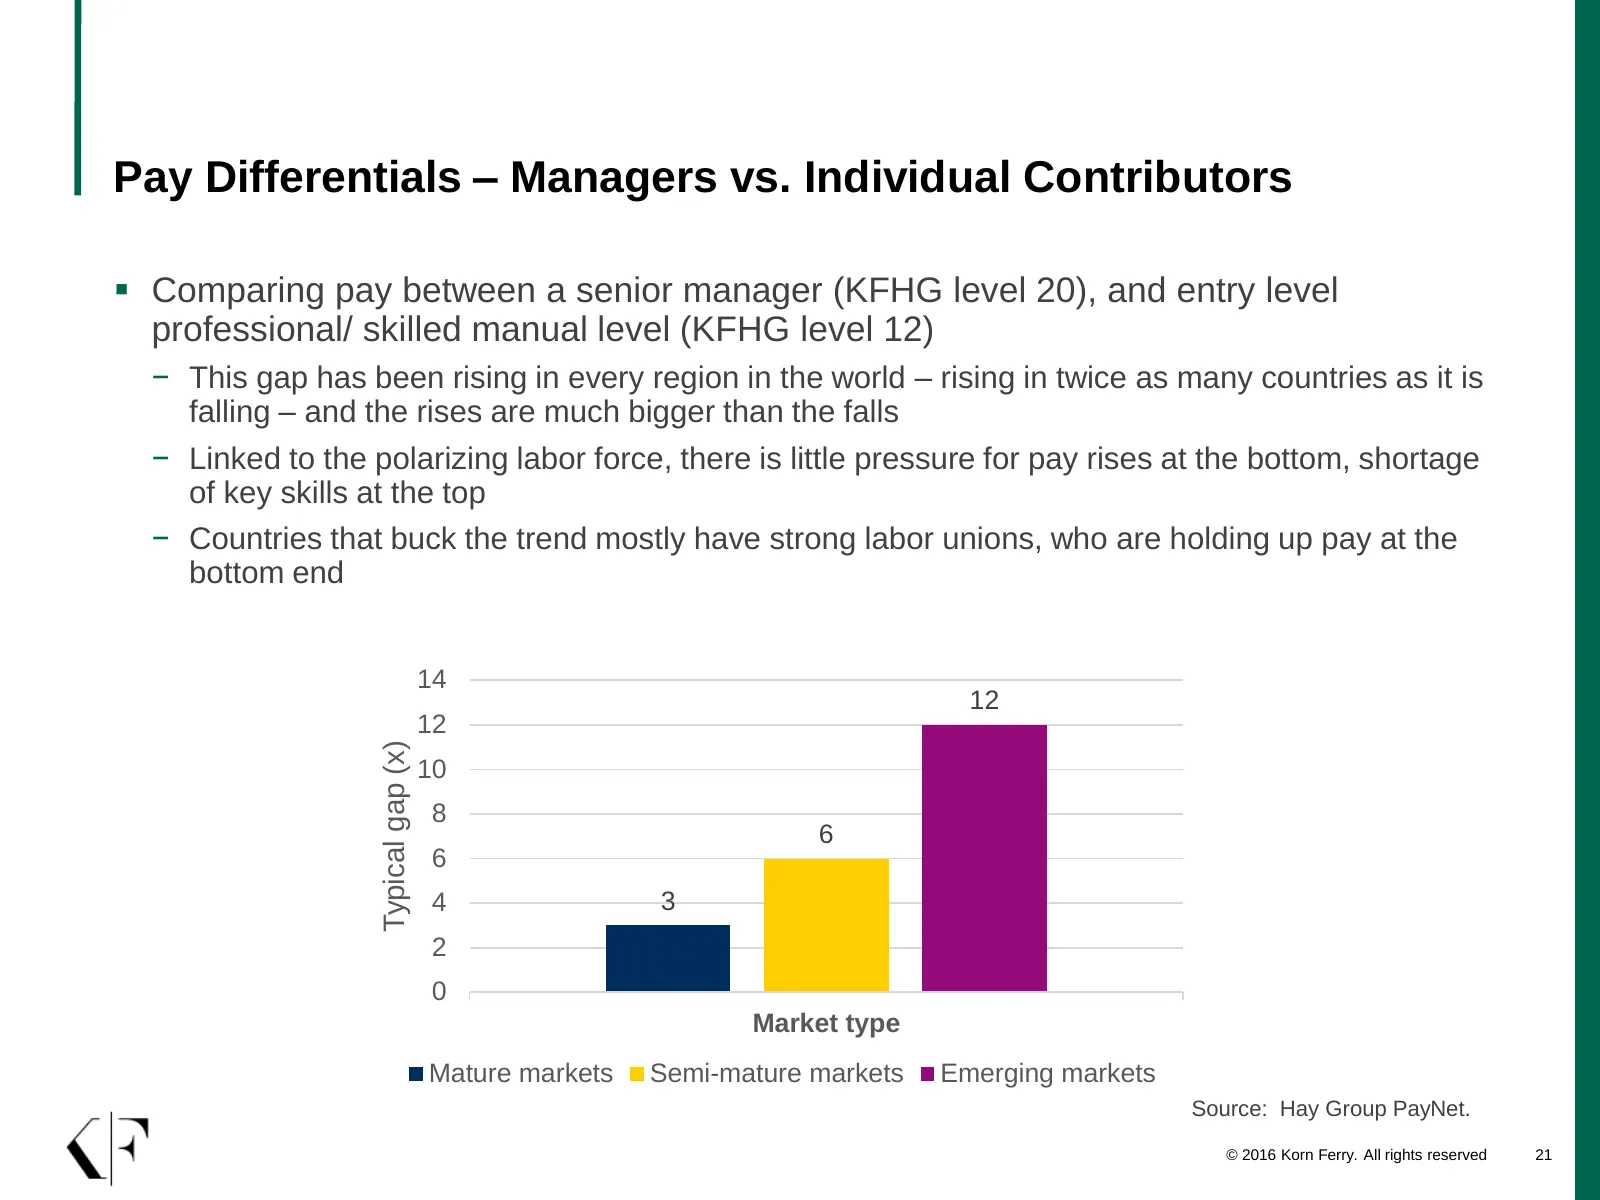
Pay Differentials – Managers vs. Individual Contributors ▪ Comparing pay between a senior manager (KFHG level 20), and entry level professional/ skilled manual level (KFHG level 12) − This gap has been rising in every region in the world – rising in twice as many countries as it is falling – and the
Slide 22: Reward Policy - FYI
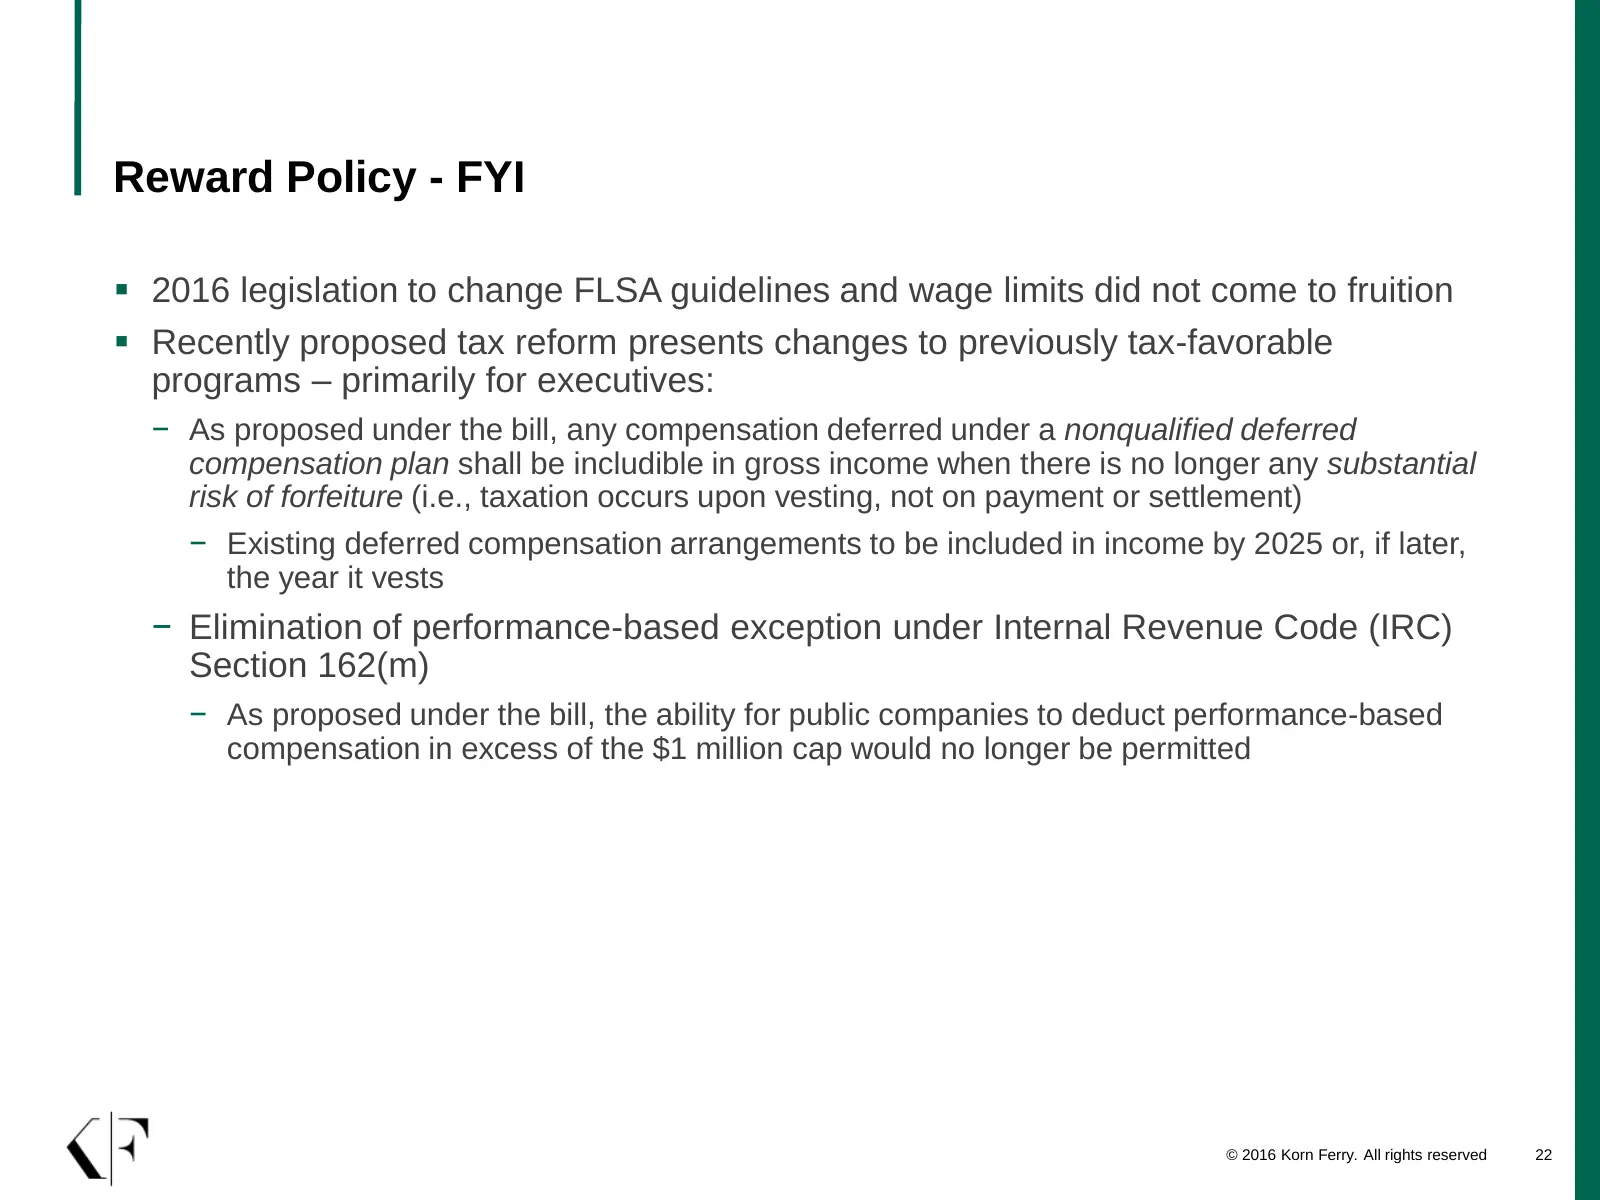
Reward Policy - FYI ▪ 2016 legislation to change FLSA guidelines and wage limits did not come to fruition ▪ Recently proposed tax reform presents changes to previously tax-favorable programs – primarily for executives: − As proposed under the bill, any compensation deferred under a nonqualified defe
Slide 23: Implications
4 Implications
Slide 24: Better Communications About Reward
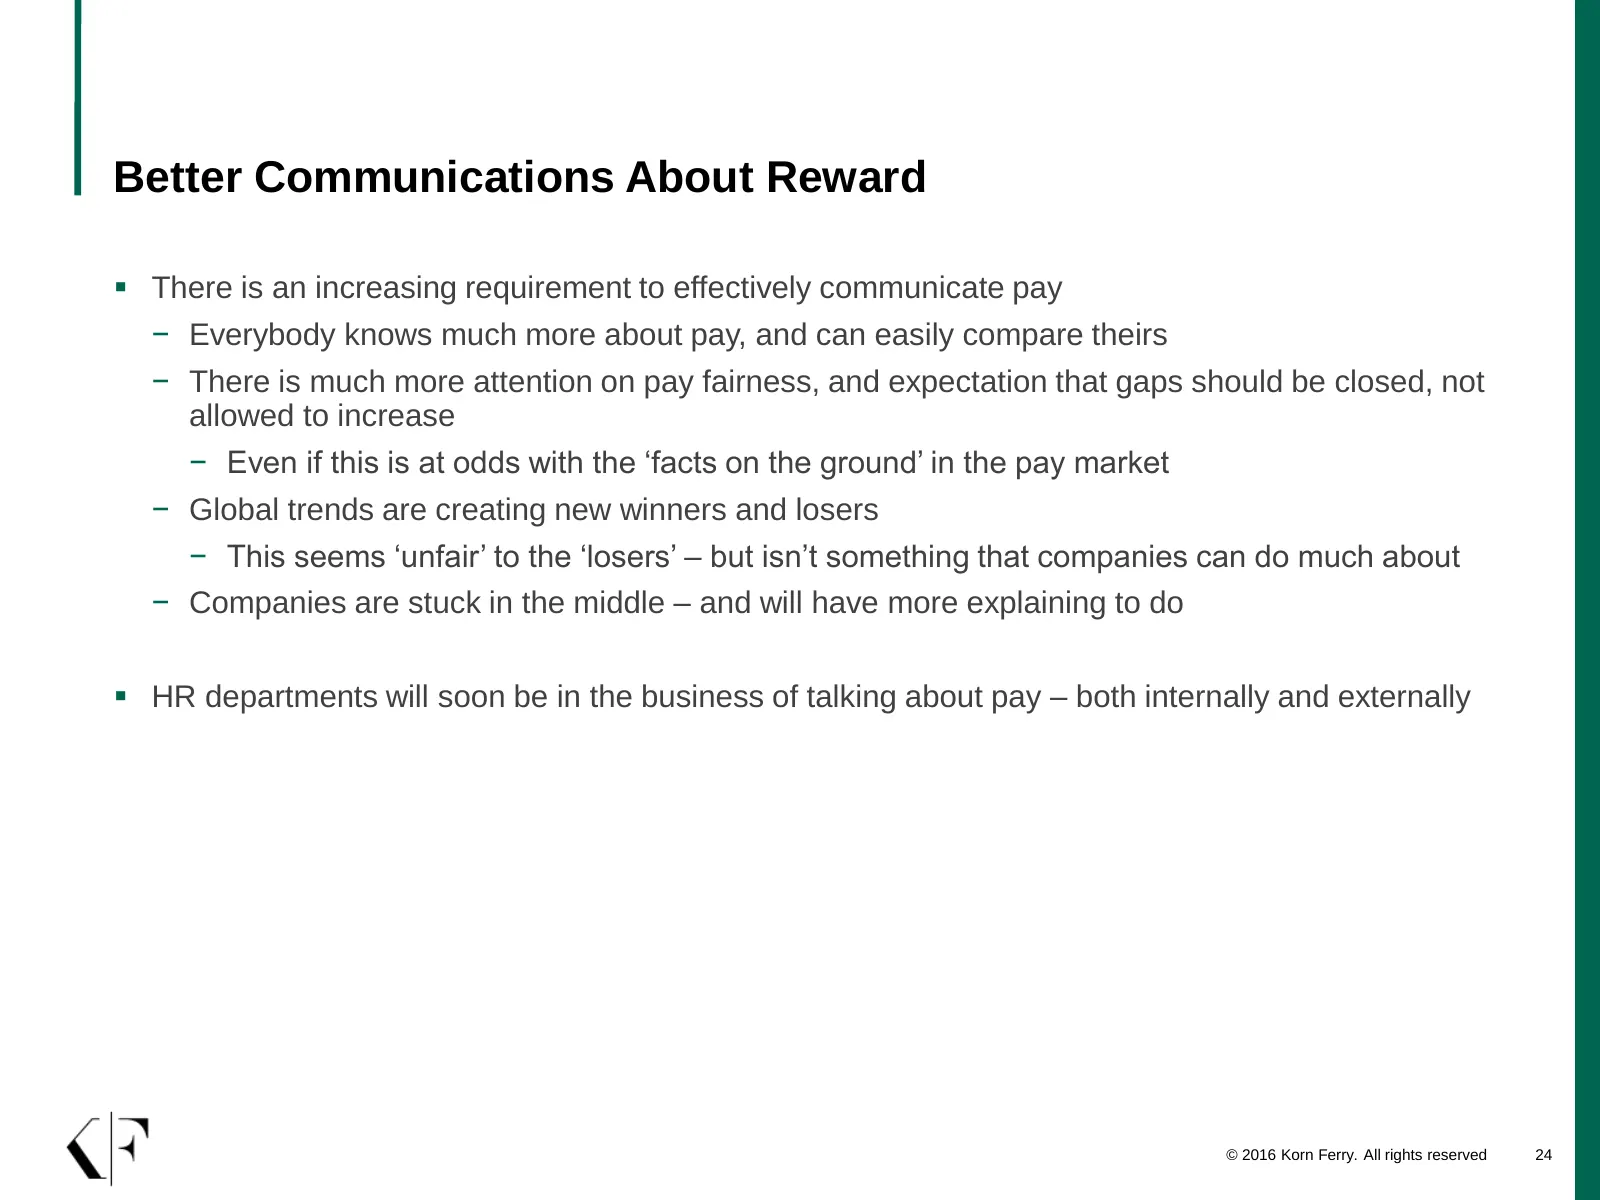
Better Communications About Reward ▪ There is an increasing requirement to effectively communicate pay − Everybody knows much more about pay, and can easily compare theirs − There is much more attention on pay fairness, and expectation that gaps should be closed, not allowed to increase − Even if th
Slide 25: Better Communications About Reward (cont.)
Better Communications About Reward (cont.) ▪ Communication and clarity – specifically: − Clearly communicating to employees how pay is determined in the organization - and the things that make pay different for people and roles that look similar − Articulating the career ladder for each function in
Slide 26: Aligned Reward Strategy and Policy
Aligned Reward Strategy and Policy ▪ Having a credible reward policy that is in line with what is practically affordable ▪ A decade of relatively low pay inflation has resulted in organizations struggling to use their pay bands in the way they were designed for − Limited salary increase budgets have
Slide 27: Keeping Talent – Predictors of Employee Retention
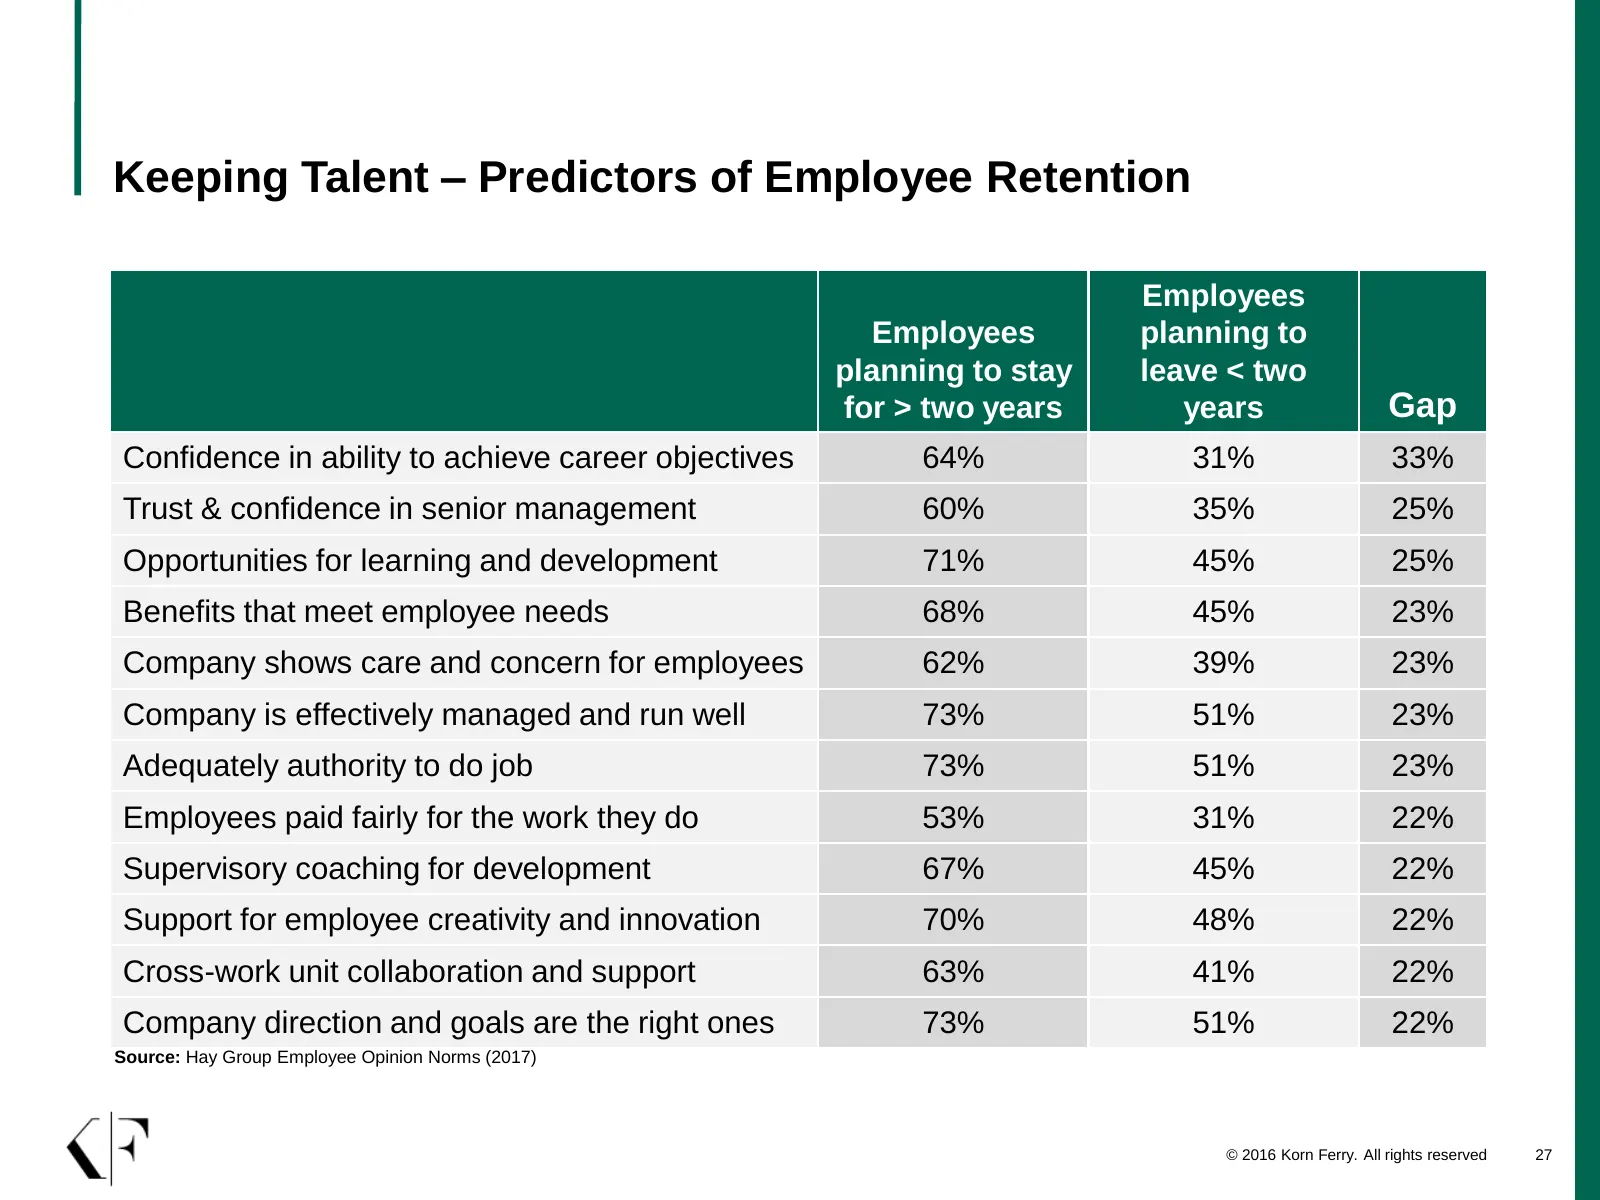
Keeping Talent – Predictors of Employee Retention Employees Employees planning to planning to stay leave < two for > two years years Gap Confidence in ability to achieve career objectives 64% 31% 33% Trust & confidence in senior management 60% 35% 25% Opportunities for learning and development 71% 4
Slide 28: Evolution of Work Has an Impact on Rewards
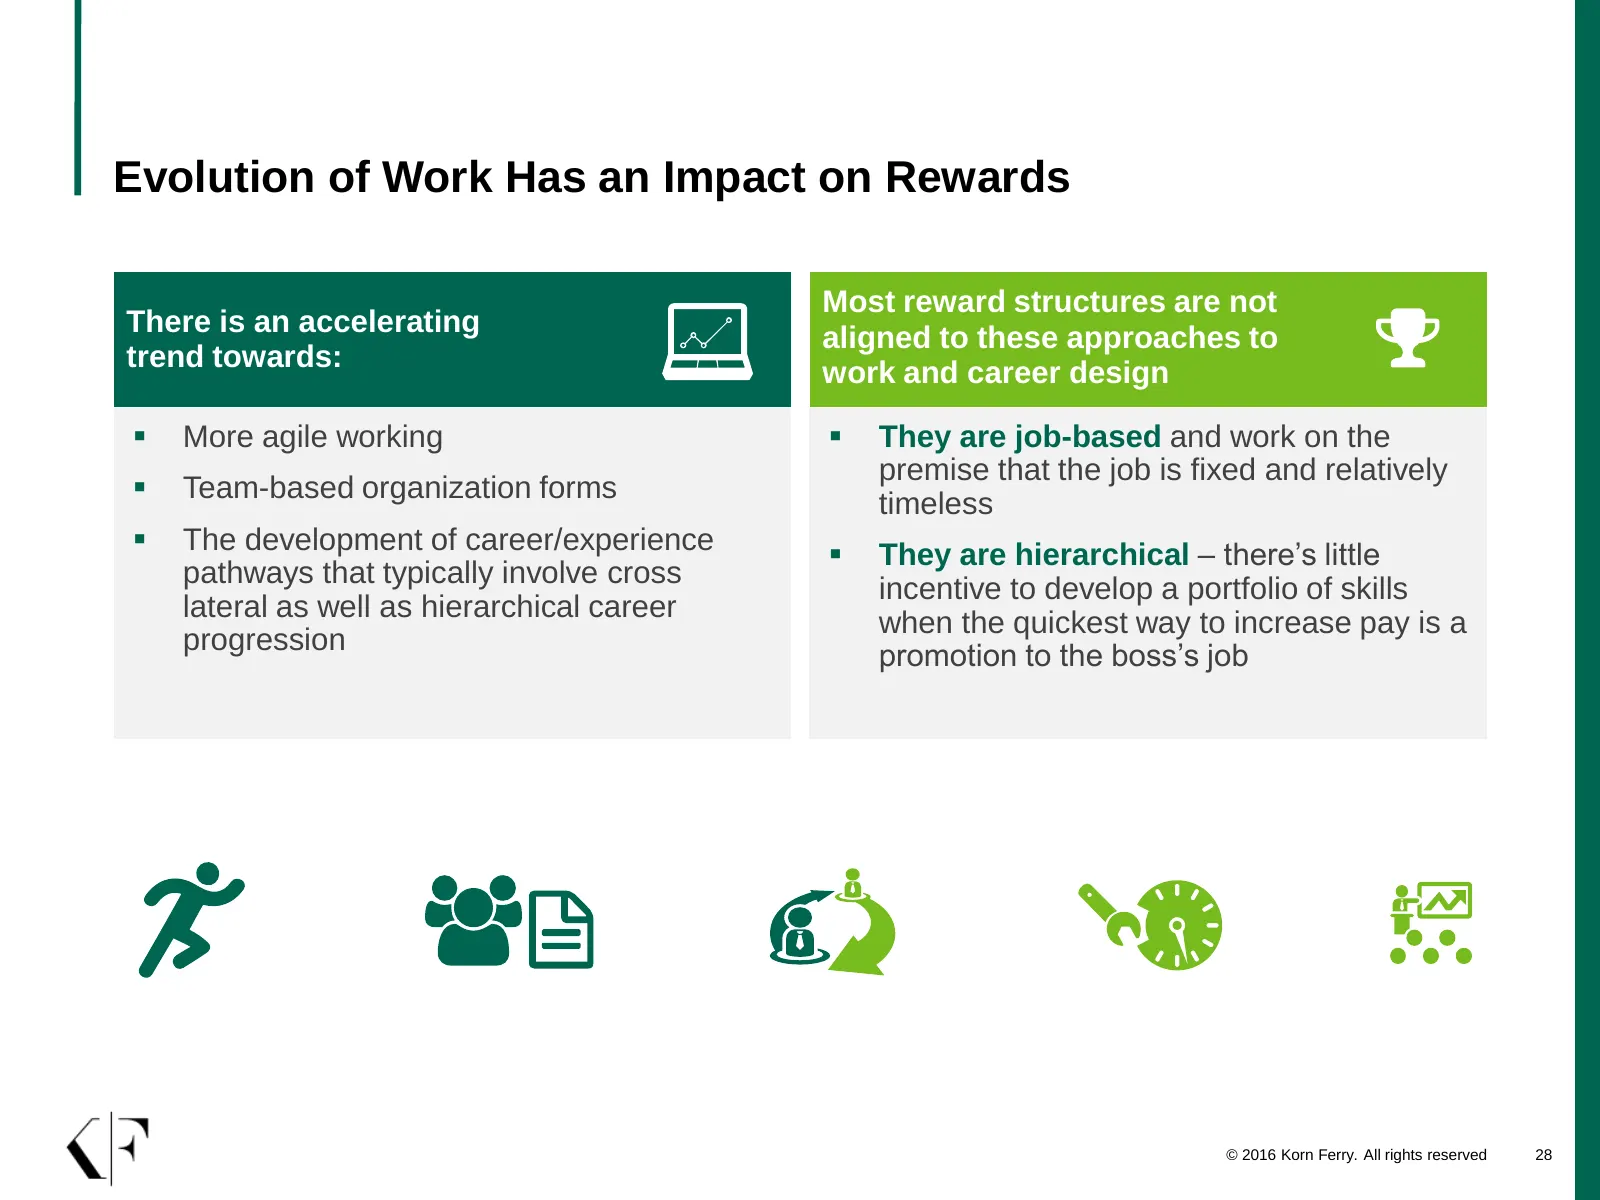
Evolution of Work Has an Impact on Rewards Most reward structures are not There is an accelerating aligned to these approaches to trend towards: work and career design ▪ More agile working ▪ They are job-based and work on the premise that the job is fixed and relatively ▪ Team-based organization for
Slide 29: A Reward Manager’s To-do List
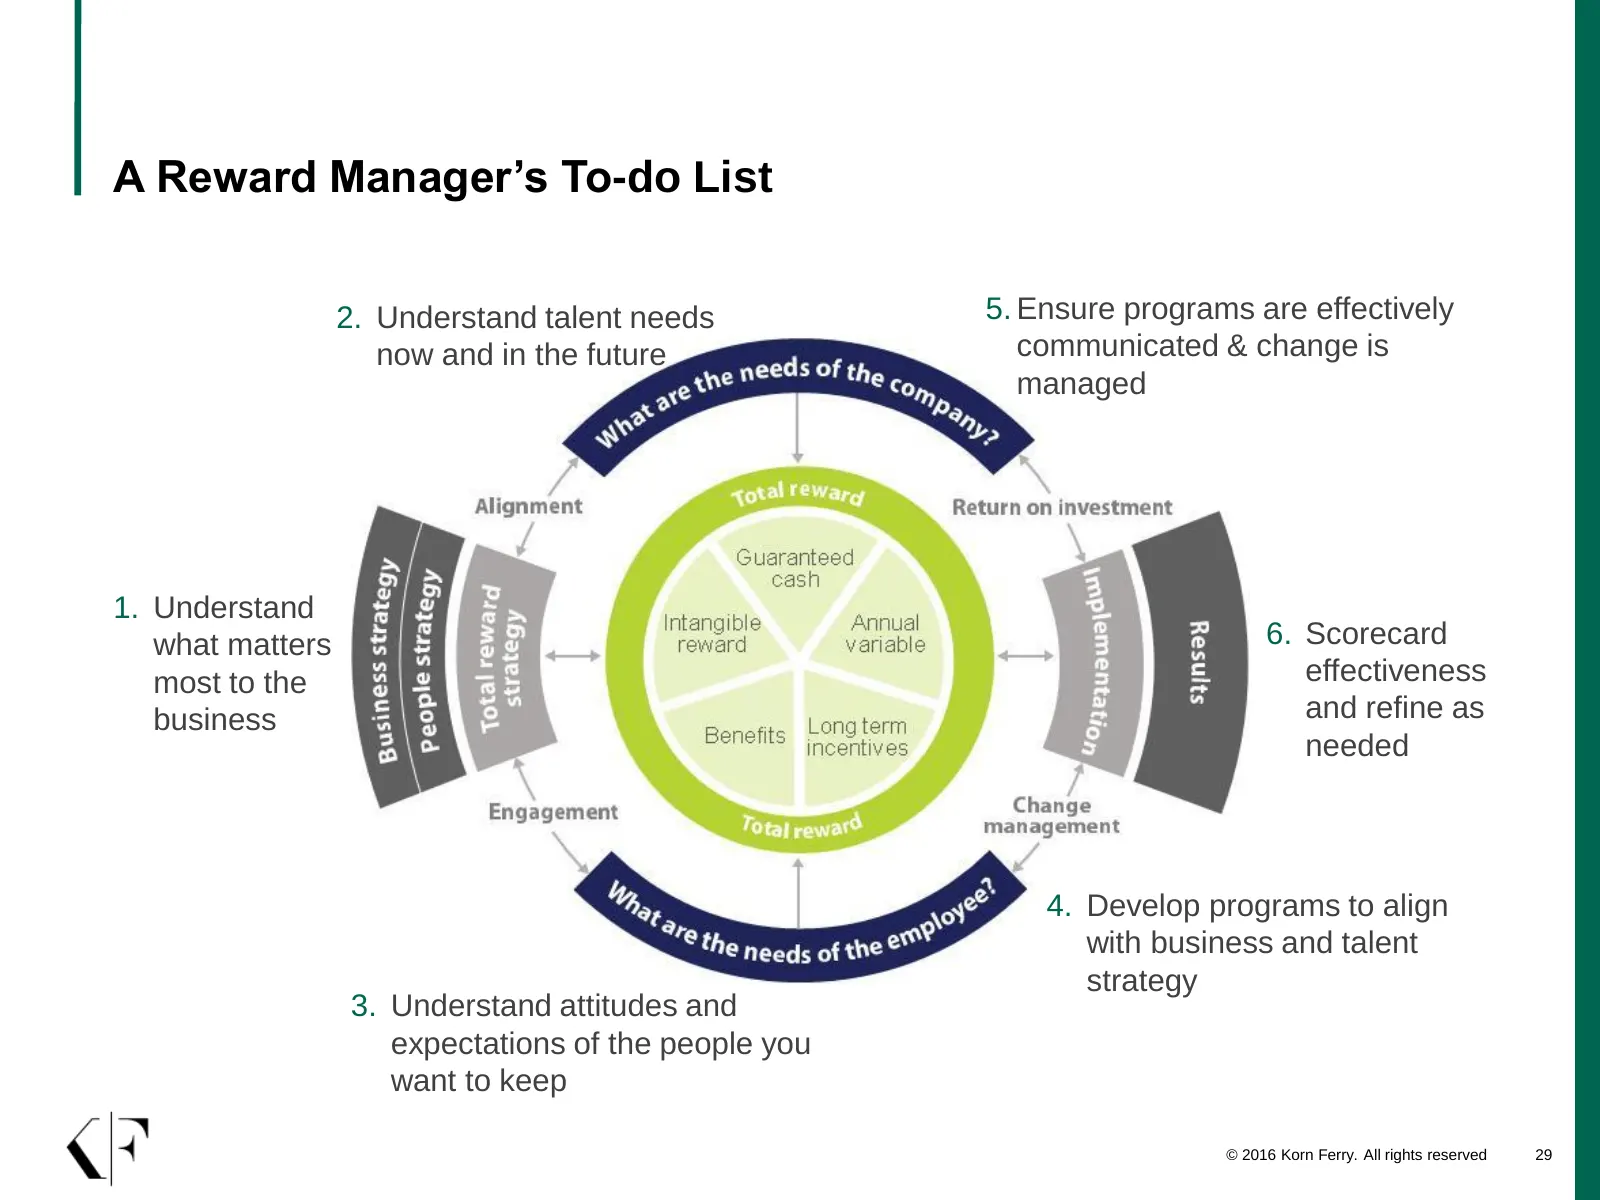
A Reward Manager’s To-do List 2. Understand talent needs 5. Ensure programs are effectively now and in the future communicated & change is managed 1. Understand what matters 6. Scorecard most to the effectiveness business and refine as needed 4. Develop programs to align with business and talent str
Slide 30: Assessing Reward Effectiveness and ROI – a Template
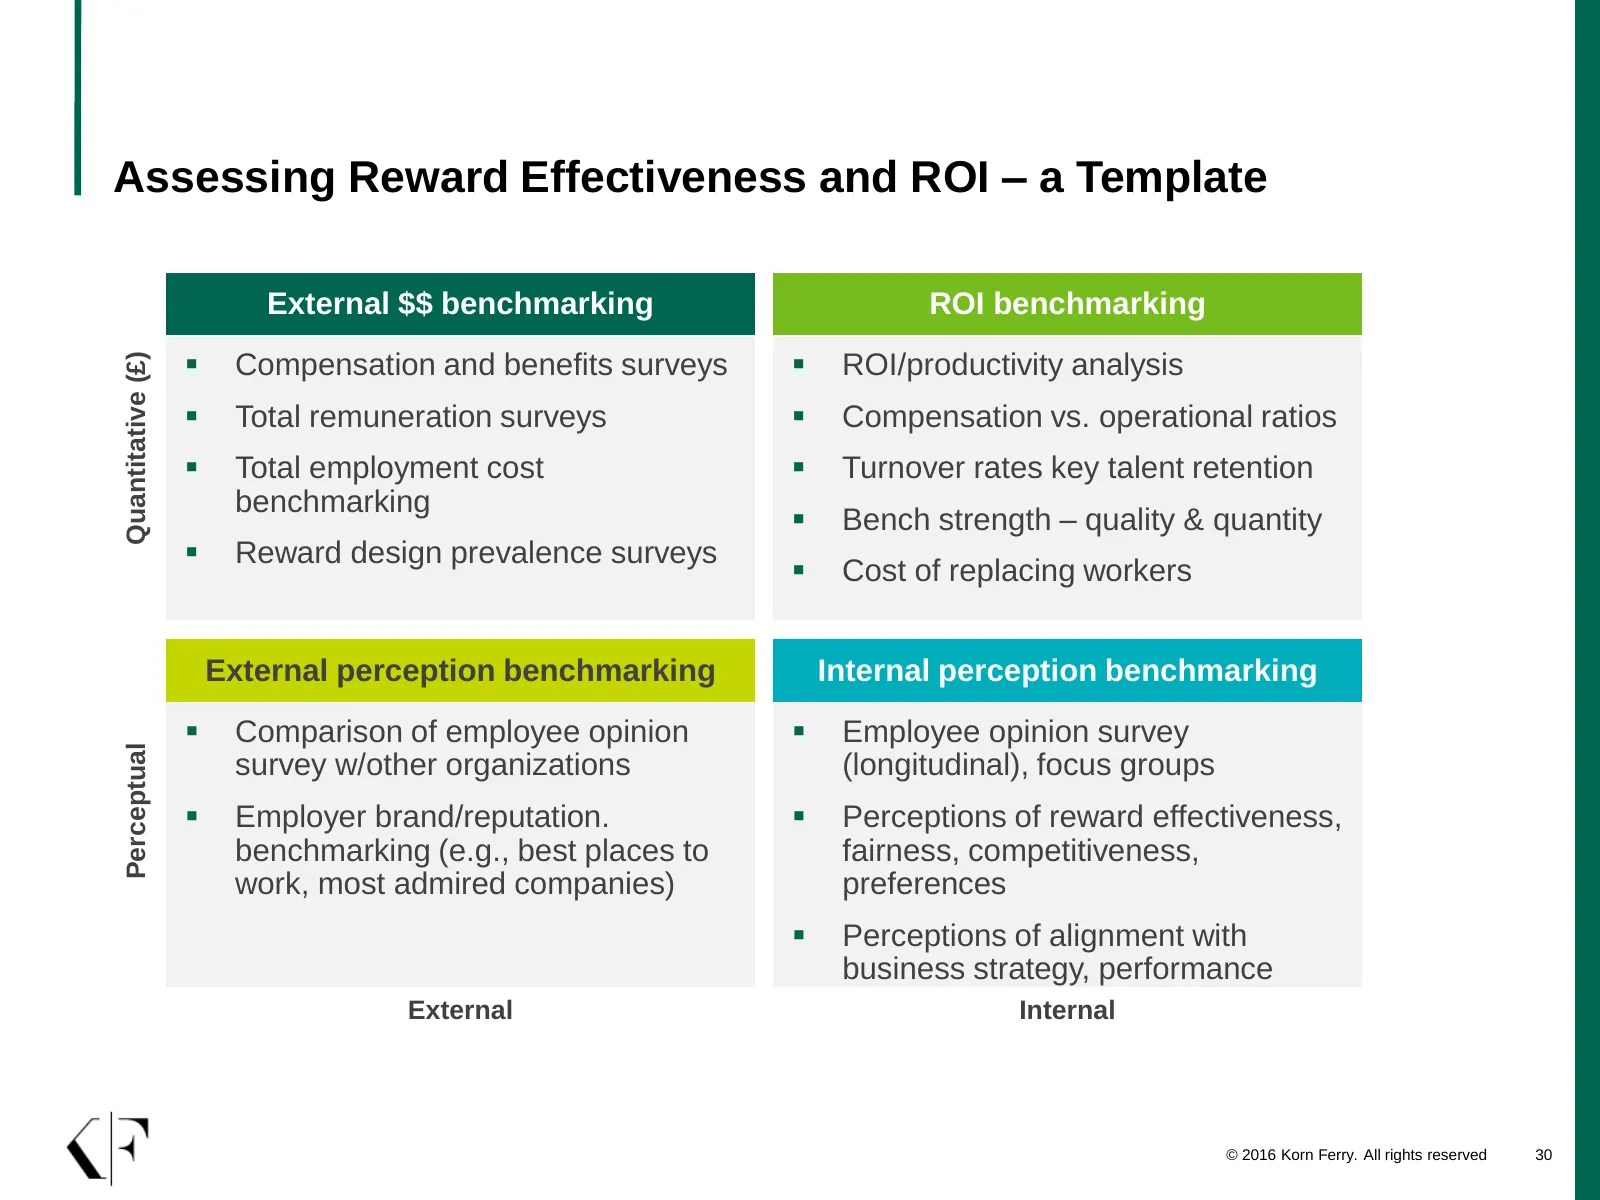
Assessing Reward Effectiveness and ROI – a Template External $$ benchmarking ROI benchmarking ▪ ▪ Quantitative (£) Compensation and benefits surveys ROI/productivity analysis ▪ Total remuneration surveys ▪ Compensation vs. operational ratios ▪ Total employment cost ▪ Turnover rates key talent retent

Slide 31: Q&A
5 Q&A
Slide 32: Rachel Marling, Principal, Korn Ferry Hay Group
Rachel Marling Principal Korn Ferry Hay Group Based in: New York, USA Phone: +1-212-896-9926 Email: Rachel.Marling@kornferry.com
Source: Internet Archive copy of engage.kornferry.com
More decks from Korn Ferry
 Q1 2027 Earnings Presentation25 slides · Sep 9, 2026
 Q4 2026 Earnings Presentation26 slides · Jun 23, 2026
 Q3 2026 Earnings Presentation26 slides · Mar 9, 2026
 Q2 2026 Earnings Presentation26 slides · Dec 9, 2025
 Q1 2026 Earnings Presentation26 slides · Sep 9, 2025
 Q4 FY2025 Earnings Presentation26 slides · Jun 18, 2025