STORE Capital — Shareholder Meeting (June 2015)
29 slides from STORE Capital's shareholder meeting presentation, Jun 4, 2015
Slide 1: Annual Meeting of Stockholders
Annual Meeting of Stockholders June 4, 2015 The LEADER in Middle Market Real Estate Capital Solutions SINGLE TENANT OPERATIONAL REAL ESTATE
Slide 2: Disclaimer
Disclaimer This presentation includes forward-looking statements within the meaning of Section 27A of the Securities Act of 1933, as amended, that are subject to the “safe harbor” created by that section. These forward-looking statements include comments with respect to our objectives and strategies
Slide 3: STORE's Key Achievements
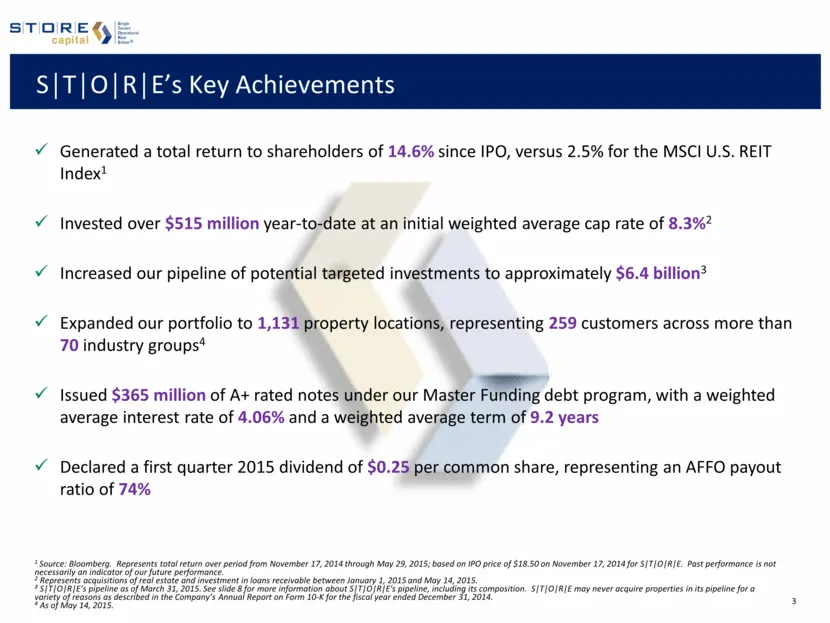
S|T|O|R|E’s Key Achievements Generated a total return to shareholders of 14.6% since IPO, versus 2.5% for the MSCI U.S. REIT Index1 Invested over $515 million year-to-date at an initial weighted average cap rate of 8.3%2 Increased our pipeline of potential targeted investments to approximately $6.4
Slide 4: Experienced Leadership Team with a Proven Track Record
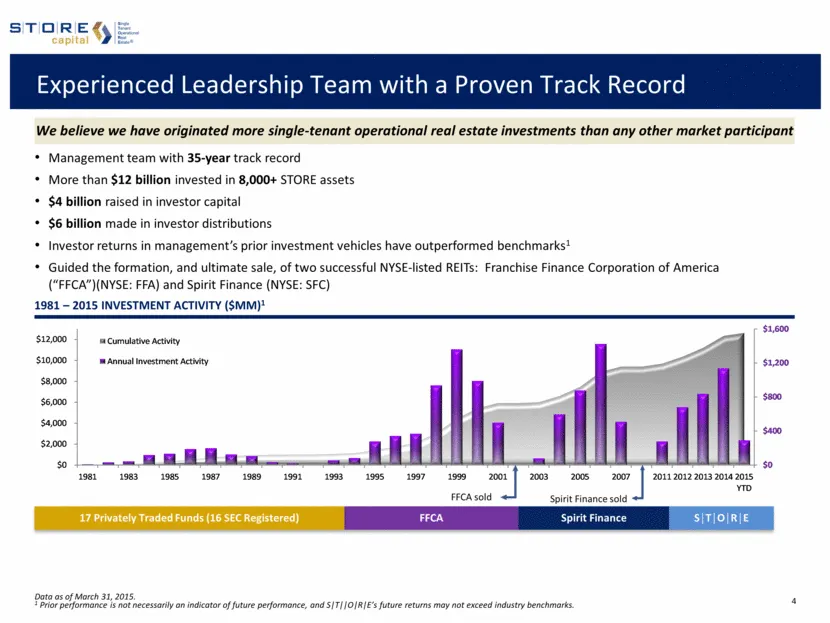
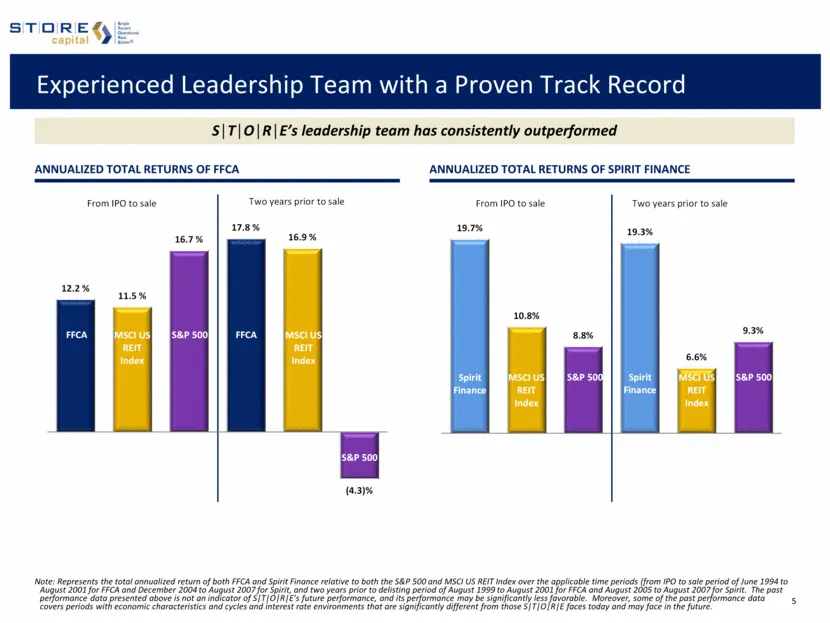
Experienced Leadership Team with a Proven Track Record Management team with 35-year track record More than $12 billion invested in 8,000+ STORE assets $4 billion raised in investor capital $6 billion made in investor distributions Investor returns in management’s prior investment vehicles have outpe
Slide 5: Experienced Leadership Team with a Proven Track Record
Experienced Leadership Team with a Proven Track Record ANNUALIZED TOTAL RETURNS OF FFCA Note: Represents the total annualized return of both FFCA and Spirit Finance relative to both the S&P 500 and MSCI US REIT Index over the applicable time periods (from IPO to sale period of June 1994 to August 20
Slide 6: Target Market Exceeding $2.3 Trillion in Size
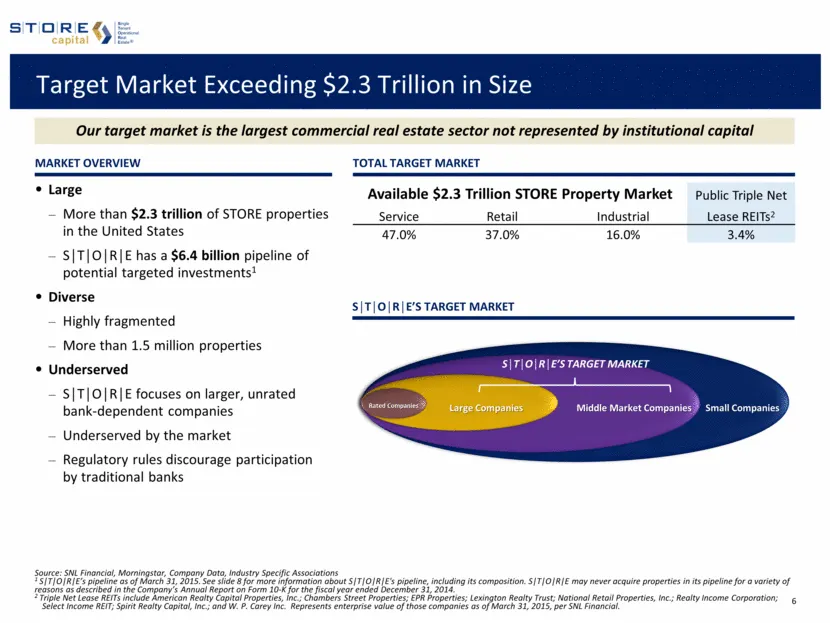
Target Market Exceeding $2.3 Trillion in Size Large More than $2.3 trillion of STORE properties in the United States S|T|O|R|E has a $6.4 billion pipeline of potential targeted investments1 Diverse Highly fragmented More than 1.5 million properties Underserved S|T|O|R|E focuses on larger, unrated ba
Slide 7: Superior Direct Origination Platform
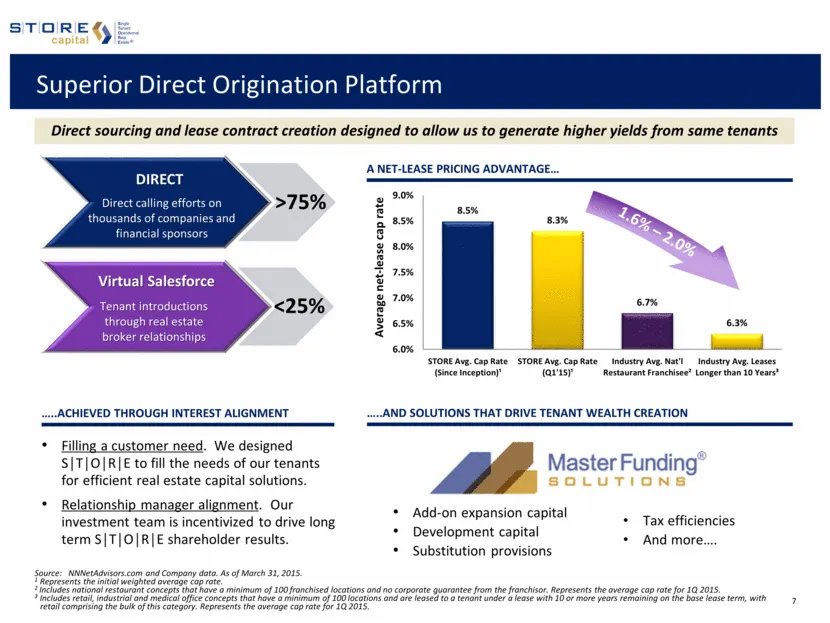
..AND SOLUTIONS THAT DRIVE tenant wealth creation Add-on expansion capital Development capital Substitution provisions Tax efficiencies And more . Superior Direct Origination Platform Filling a customer need. We designed S | T | O | R | E to fill the needs of our tenants for efficient real estate ca
Slide 8: We have a $6.4 billion Pipeline of Potential Investments
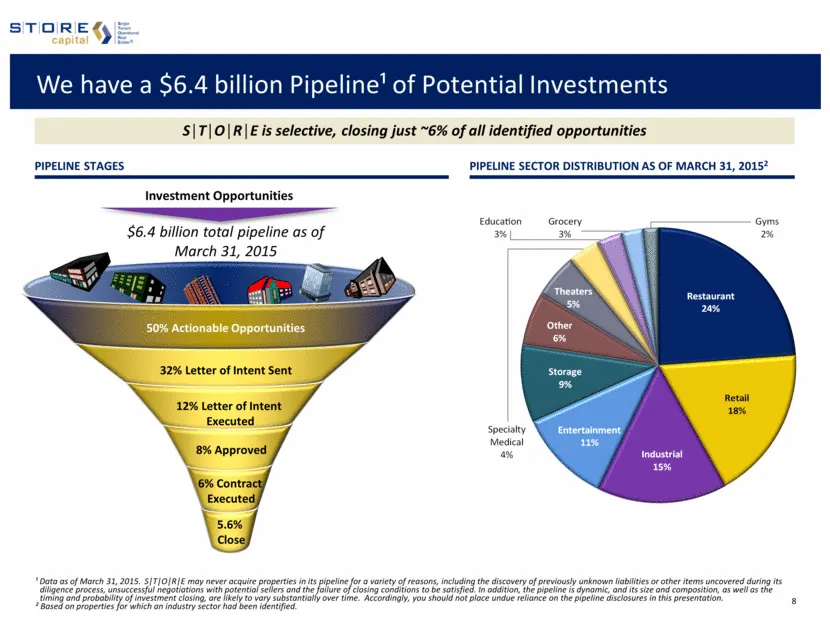
We have a $6.4 billion Pipeline¹ of Potential Investments ¹ Data as of March 31, 2015. S T O R E may never acquire properties in its pipeline for a variety of reasons, including the discovery of previously unknown liabilities or other items uncovered during its diligence process, unsuccessful negoti
Slide 9: Time-Tested Underwriting Approach
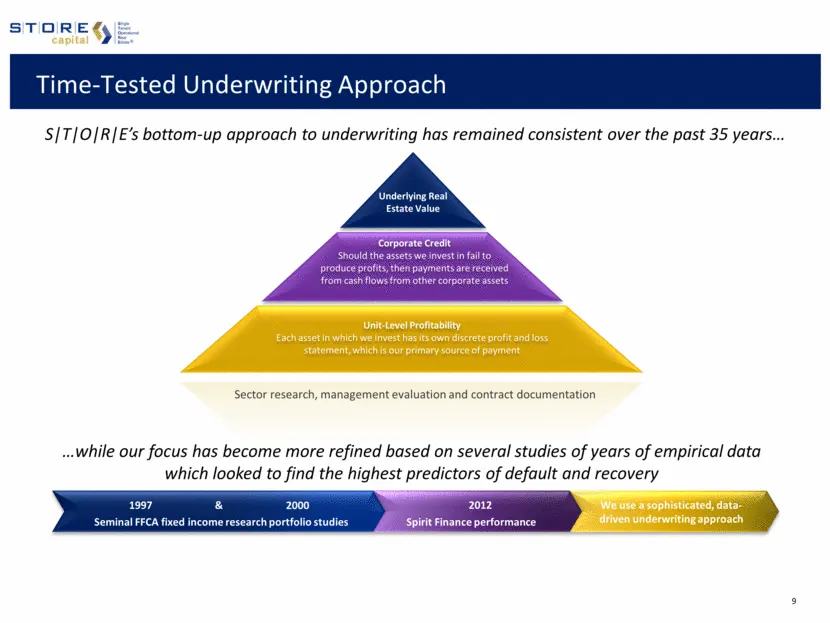
Time-Tested Underwriting Approach S T O R E’s bottom-up approach to underwriting has remained consistent over the past 35 years Unit-Level Profitability Each asset in which we invest has its own discrete profit and loss statement, which is our primary source of payment Corporate Credit Should the as
Slide 10: Proprietary and Intensive Contract Monitoring System
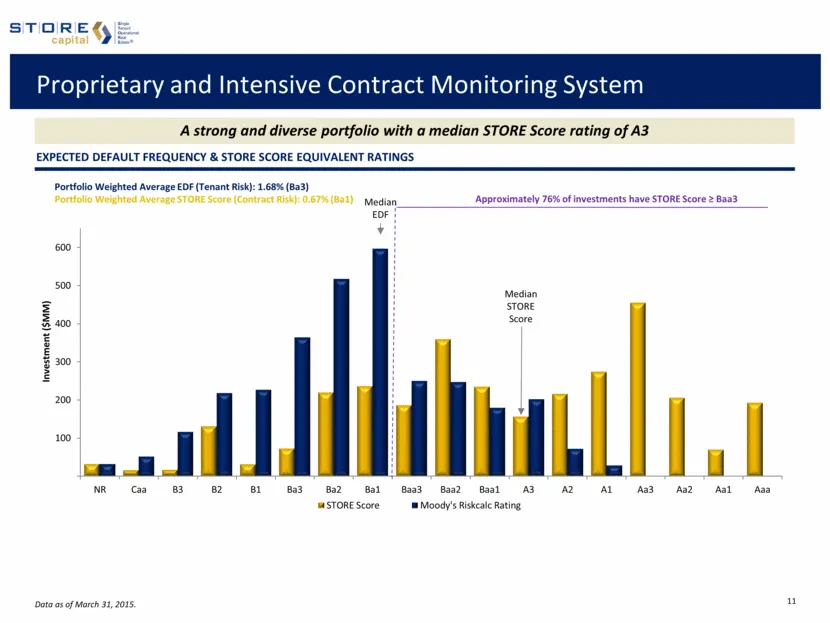
Proprietary and Intensive Contract Monitoring System Data as of March 31, 2015. Expected default frequency & STORE score equivalent Ratings A strong and diverse portfolio with a median STORE Score rating of A3 100 200 300 400 500 600 NR Caa B3 B2 B1 Ba3 Ba2 Ba1 Baa3 Baa2 Baa1 A3 A2 A1 Aa3 Aa2 Aa1 Aa
Slide 11: Portfolio – At a Glance
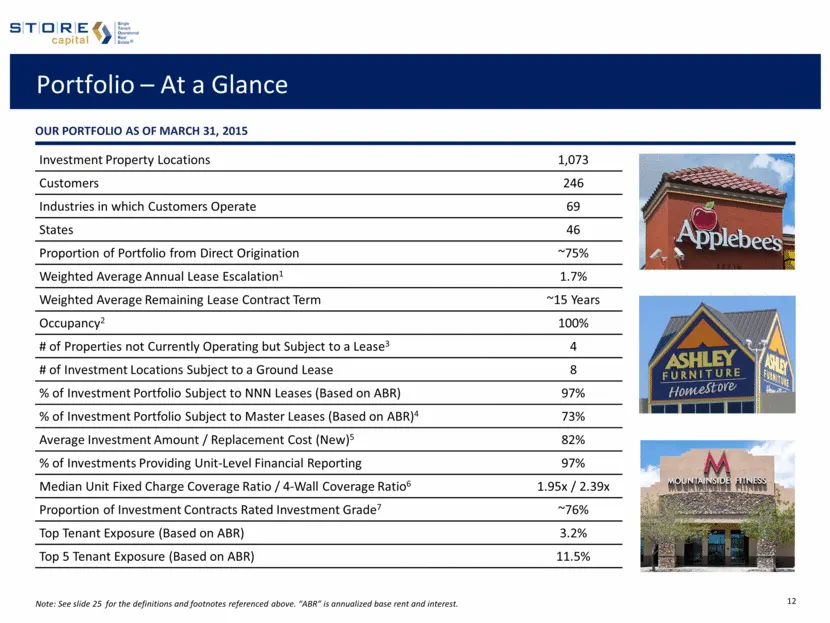
Note: See slide 25 for the definitions and footnotes referenced above. “ABR” is annualized base rent and interest. Portfolio – At a Glance OUR PORTFOLIO as of March 31, 2015 Investment Property Locations 1,073 Customers 246 Industries in which Customers Operate 69 States 46 Proportion of Portfolio f
Slide 12: Diversified Across Geographies
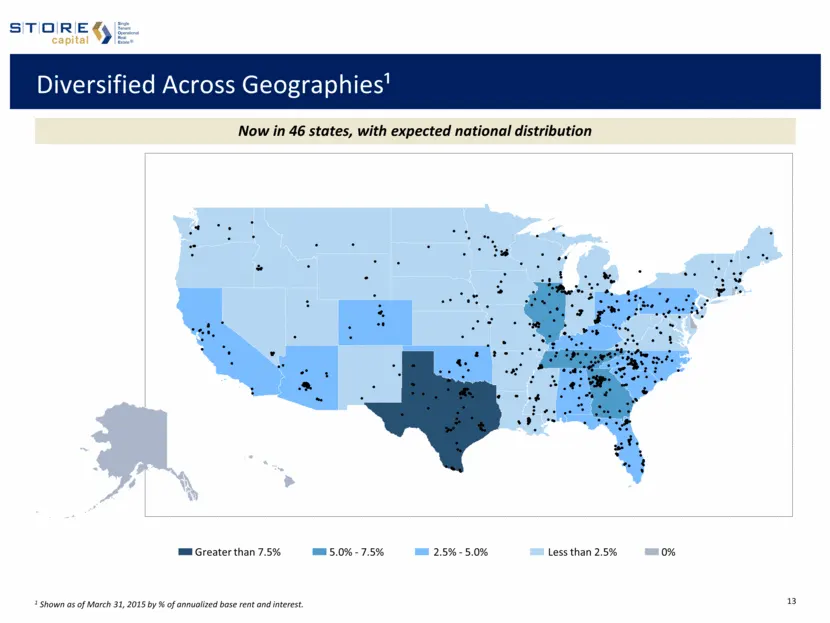
Diversified Across Geographies¹ Now in 46 states, with expected national distribution 1 Shown as of March 31, 2015 by % of annualized base rent and interest. Greater than 7.5% 5.0% - 7.5% 2.5% - 5.0% Less than 2.5% 0% ˜ ˜ ˜ ˜ ˜ ˜ ˜ ˜ ˜ ˜ ˜ ˜ ˜ ˜ ˜ ˜ ˜ ˜ ˜ ˜ ˜ ˜ ˜ ˜ ˜ ˜ ˜ ˜ ˜ ˜ ˜ ˜ ˜ ˜ ˜ ˜ ˜ ˜ ˜ ˜ ˜
Slide 13: Diversified Across Tenants and Industries
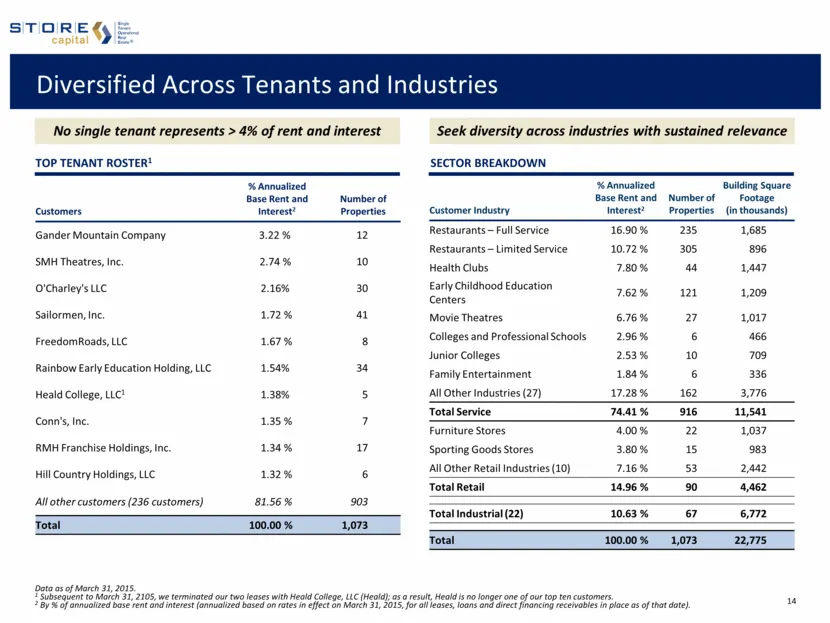
Diversified Across Tenants and Industries No single tenant represents > 4% of rent and interest TOP TENANT ROSTER1 Sector breakdown Seek diversity across industries with sustained relevance Customers % Annualized Base Rent and Interest2 Number of Properties Gander Mountain Company 3.22 % 12 SMH Thea
Slide 14: High Quality Portfolio, Most Diversified Tenant Base
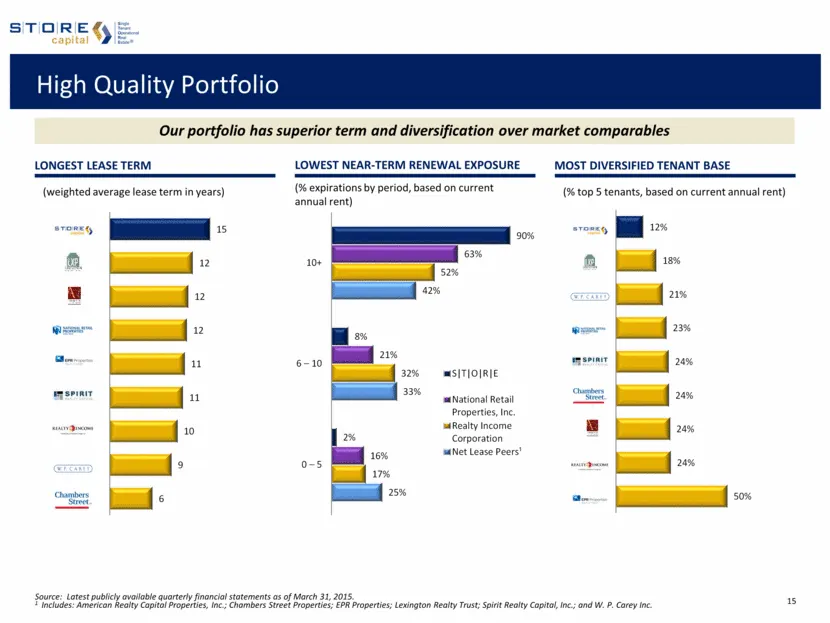
High Quality Portfolio Most Diversified Tenant Base Source: Latest publicly available quarterly financial statements as of March 31, 2015. 1 Includes: American Realty Capital Properties, Inc.; Chambers Street Properties; EPR Properties; Lexington Realty Trust; Spirit Realty Capital, Inc.; and W. P.
Slide 15: Flexible, Conservative Capital Structure
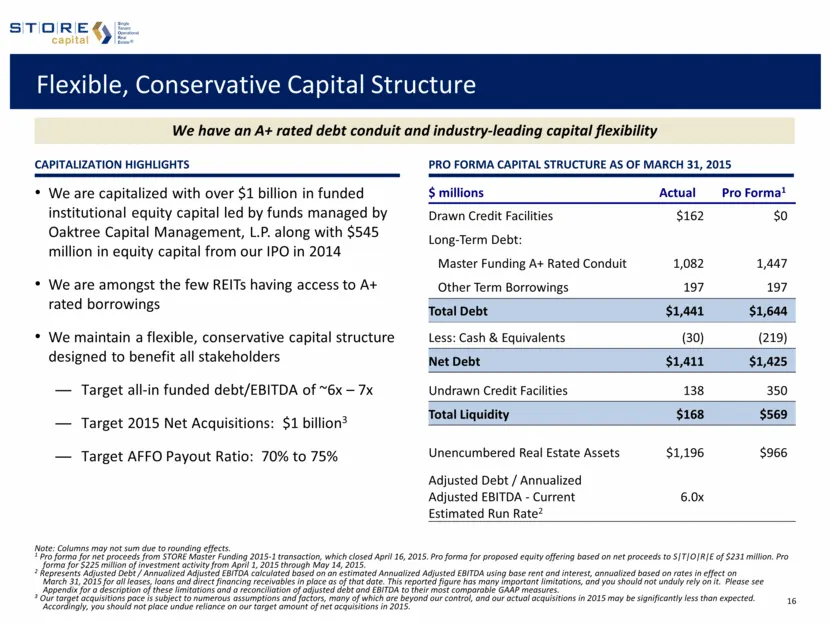
Flexible, Conservative Capital Structure PRO FORMA CAPITAL STRUCTURE as of March 31, 2015 We are capitalized with over $1 billion in funded institutional equity capital led by funds managed by Oaktree Capital Management, L.P. along with $545 million in equity capital from our IPO in 2014 We are amon
Slide 16: Prudent Leverage Philosophy and Access to A+ Rated Borrowings
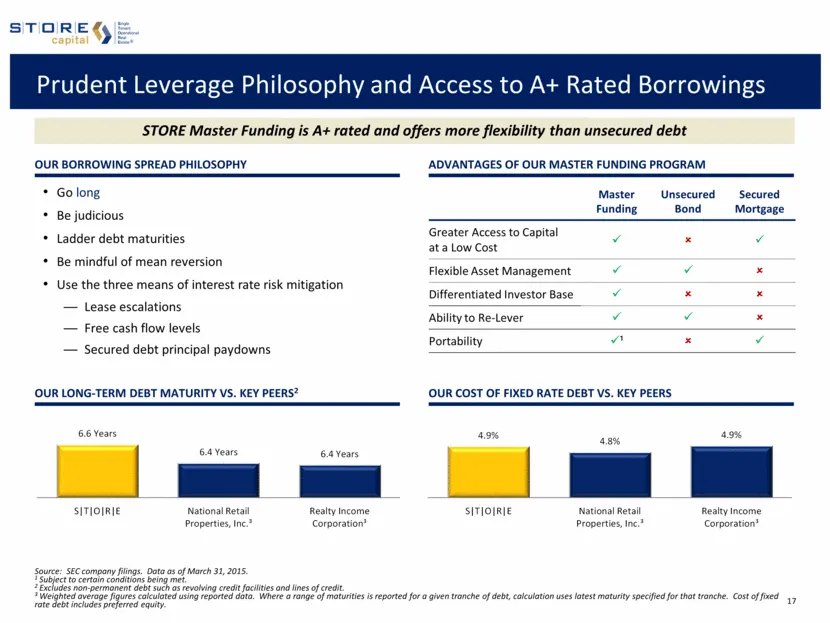
Prudent Leverage Philosophy and Access to A+ Rated Borrowings Master Funding Unsecured Bond Secured Mortgage Greater Access to Capital at a Low Cost ü û ü Flexible Asset Management ü ü û Differentiated Investor Base ü û û Ability to Re-Lever ü ü û Portability ü¹ û ü Source: SEC company filings. Data
Slide 17: STORE's Performance
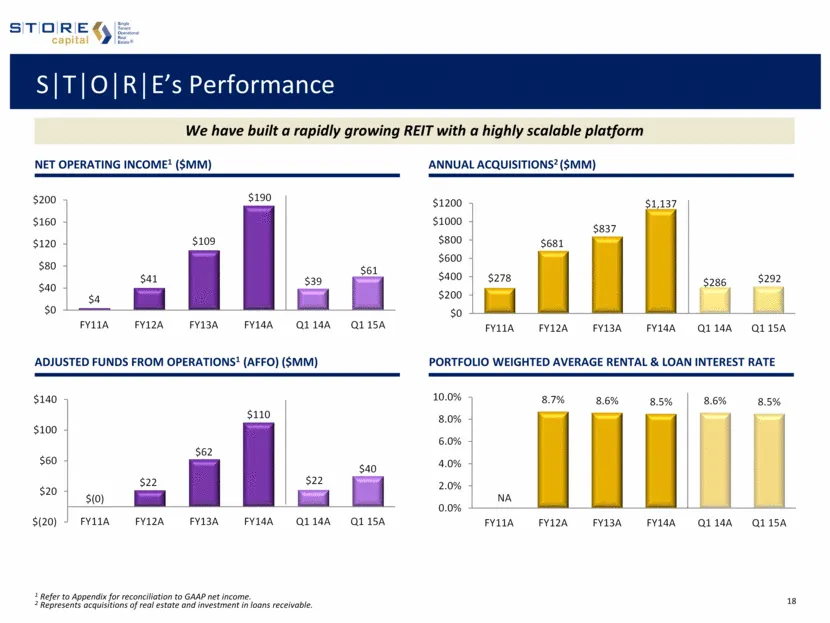
S | T | O | R | E’s Performance ADJUSTED Funds From Operations1 (AFFO) ($MM) Portfolio weighted average Rental & Loan Interest rate 1 Refer to Appendix for reconciliation to GAAP net income. 2 Represents acquisitions of real estate and investment in loans receivable. We have built a rapidly growing
Slide 18: Our Dividend Policy and Growth
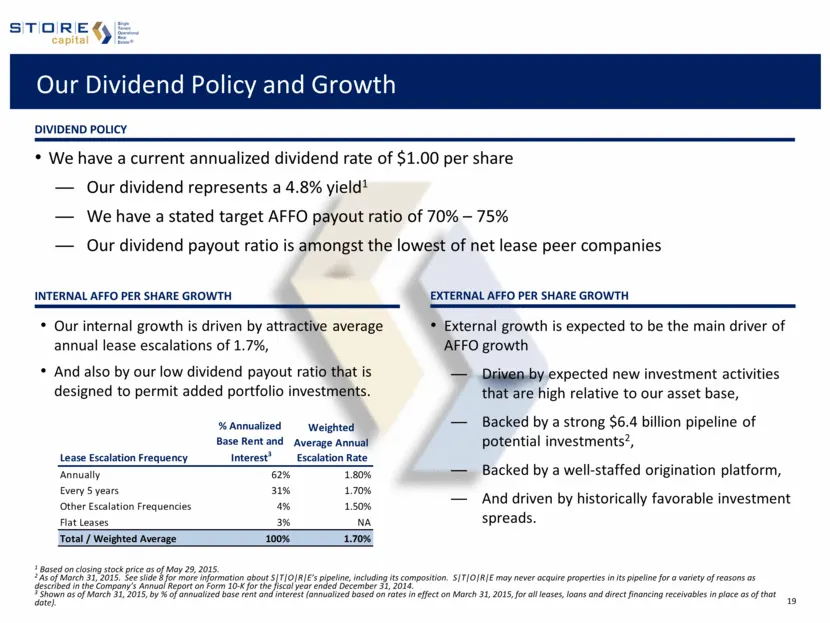
Our Dividend Policy and Growth Dividend policy We have a current annualized dividend rate of $1.00 per share Our dividend represents a 4.8% yield1 We have a stated target AFFO payout ratio of 70% – 75% Our dividend payout ratio is amongst the lowest of net lease peer companies Internal AFFO per shar
Slide 19: STORE is a Highly Compelling Risk-Adjusted Return Story
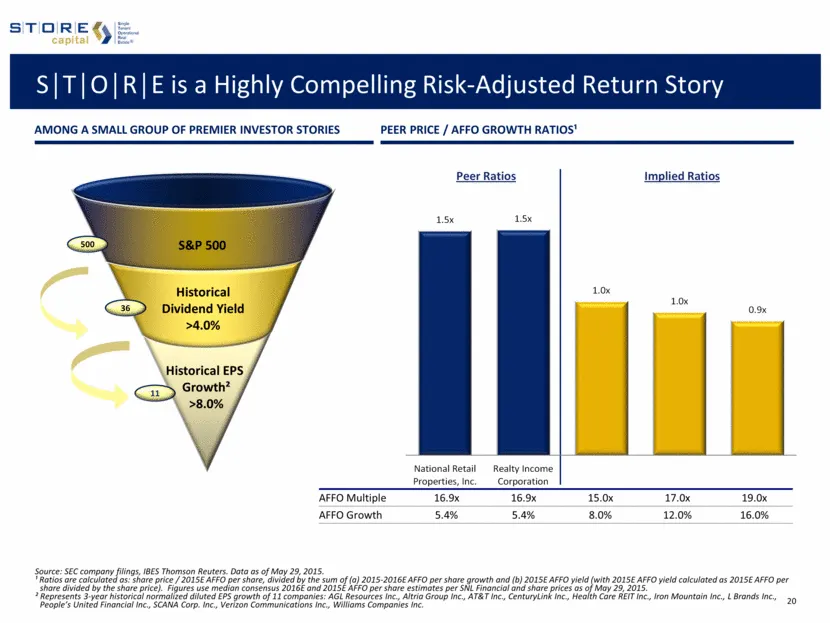
S | T | O | R | E is a Highly Compelling Risk-Adjusted Return Story Historical EPS Growth² >8.0% 11 36 Historical Dividend Yield >4.0% Source: SEC company filings, IBES Thomson Reuters. Data as of May 29, 2015. ¹ Ratios are calculated as: share price / 2015E AFFO per share, divided by the sum of (a)
Slide 20: Incremental Investments Lay the Foundation for Potential AFFO Growth
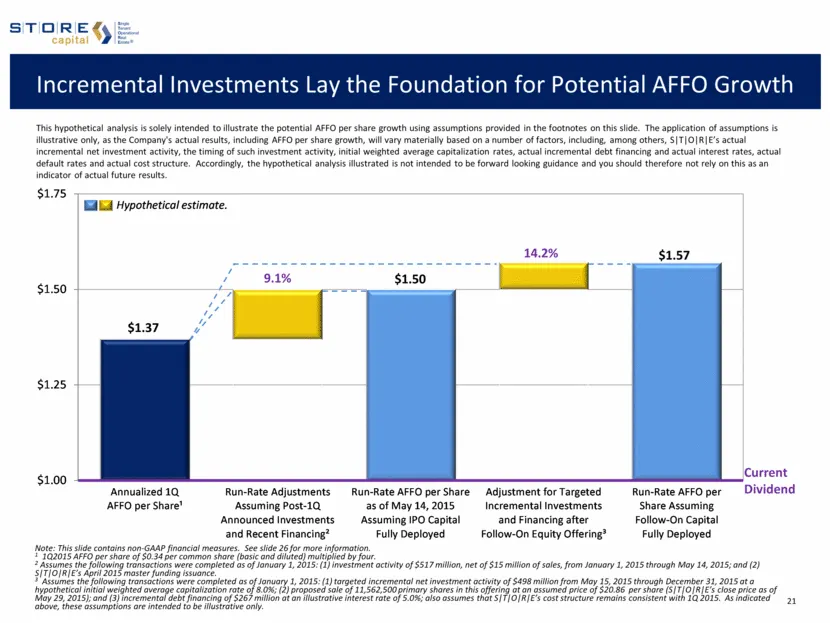
Incremental Investments Lay the Foundation for Potential AFFO Growth Note: This slide contains non-GAAP financial measures. See slide 26 for more information. 1 1Q2015 AFFO per share of $0.34 per common share (basic and diluted) multiplied by four. 2 Assumes the following transactions were completed
Slide 21: Stable and Attractive Lease Rates
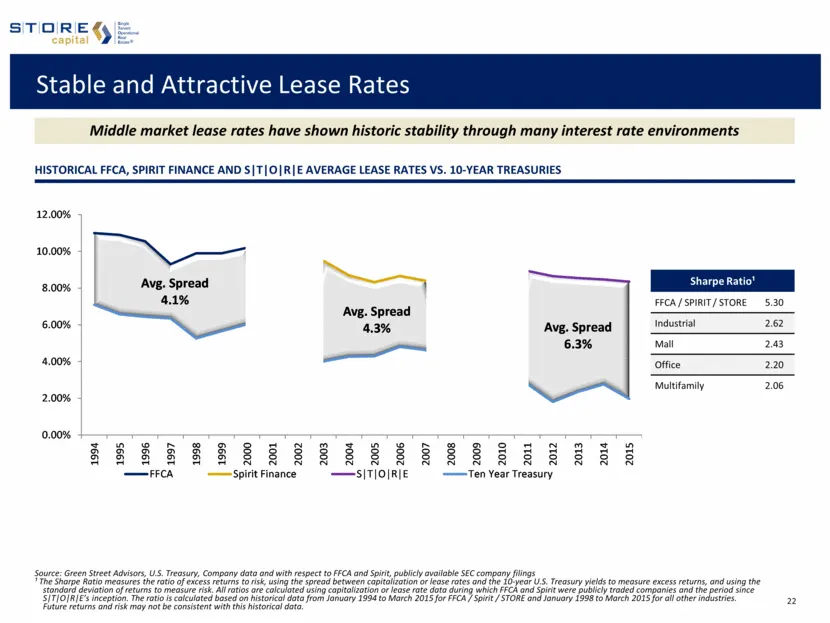
Stable and Attractive Lease Rates Source: Green Street Advisors, U.S. Treasury, Company data and with respect to FFCA and Spirit, publicly available SEC company filings ¹ The Sharpe Ratio measures the ratio of excess returns to risk, using the spread between capitalization or lease rates and the 10-
Slide 22: Investment Highlights
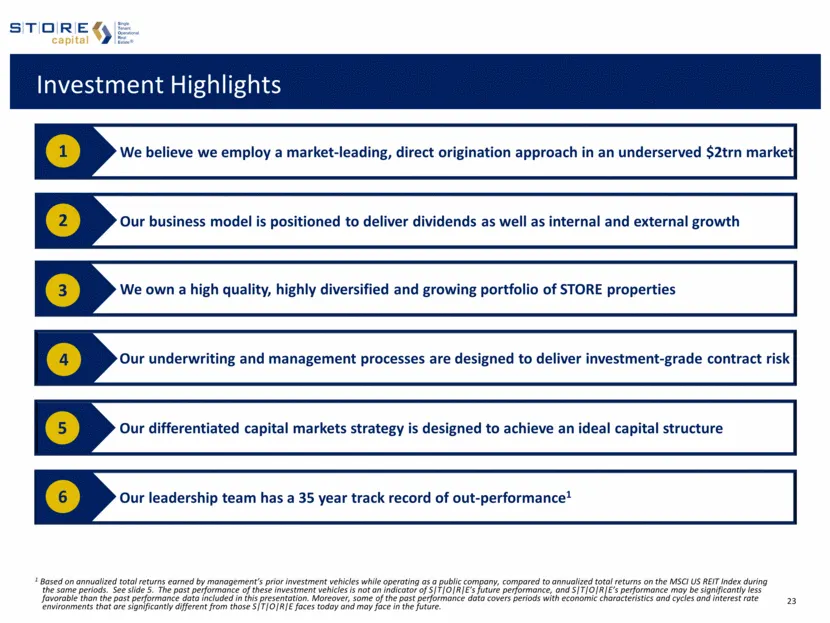
Investment Highlights Our business model is positioned to deliver dividends as well as internal and external growth 2 We believe we employ a market-leading, direct origination approach in an underserved $2trn market 1 Our leadership team has a 35 year track record of out-performance1 6 4 Our underwr
Slide 23: Appendix
STORE ( capital Appendix
Slide 24: Definitions and Footnotes
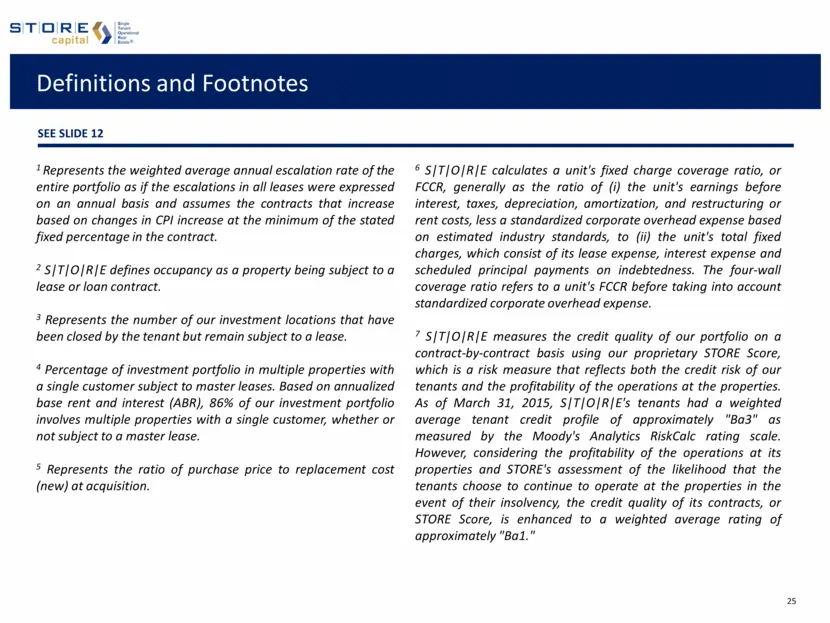
Definitions and Footnotes 1 Represents the weighted average annual escalation rate of the entire portfolio as if the escalations in all leases were expressed on an annual basis and assumes the contracts that increase based on changes in CPI increase at the minimum of the stated fixed percentage in t
Slide 25: Supplemental Reporting Measures
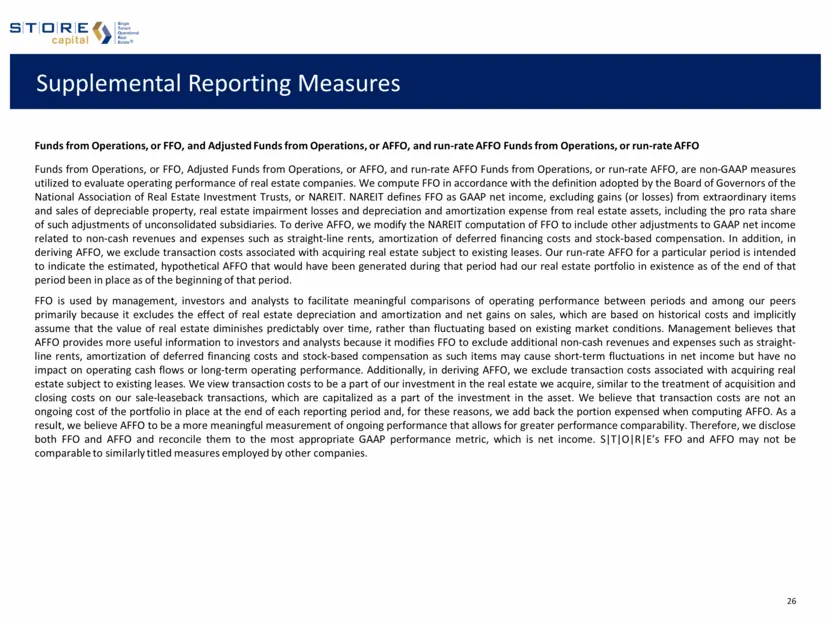
Supplemental Reporting Measures Funds from Operations, or FFO, and Adjusted Funds from Operations, or AFFO, and run-rate AFFO Funds from Operations, or run-rate AFFO Funds from Operations, or FFO, Adjusted Funds from Operations, or AFFO, and run-rate AFFO Funds from Operations, or run-rate AFFO, are
Slide 26: Supplemental Reporting Measures (Continued)
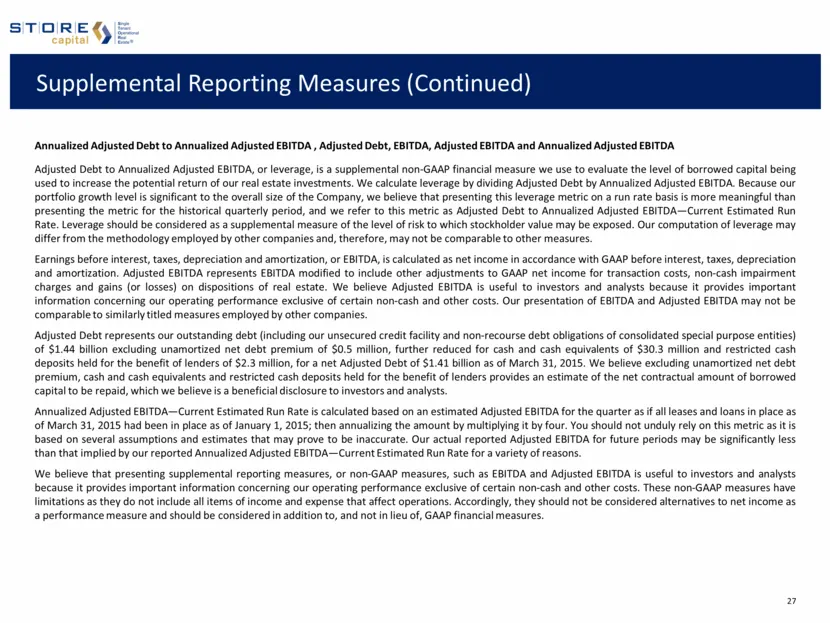
Supplemental Reporting Measures (Continued) Annualized Adjusted Debt to Annualized Adjusted EBITDA , Adjusted Debt, EBITDA, Adjusted EBITDA and Annualized Adjusted EBITDA Adjusted Debt to Annualized Adjusted EBITDA, or leverage, is a supplemental non-GAAP financial measure we use to evaluate the lev
Slide 27: GAAP Reconciliations: Net Income to NOI
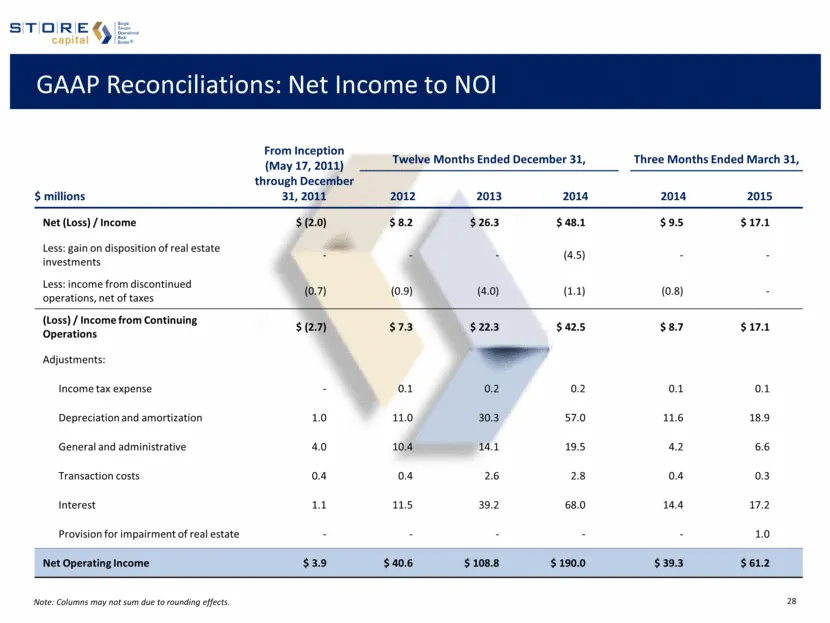
GAAP Reconciliations: Net Income to NOI Note: Columns may not sum due to rounding effects. From Inception (May 17, 2011) through December 31, 2011 Twelve Months Ended December 31, Three Months Ended March 31, $ millions 2012 2013 2014 2014 2015 Net (Loss) / Income $ (2.0) $ 8.2 $ 26.3 $ 48.1 $ 9.5 $
Slide 28: GAAP Reconciliations: Net Income to FFO and AFFO
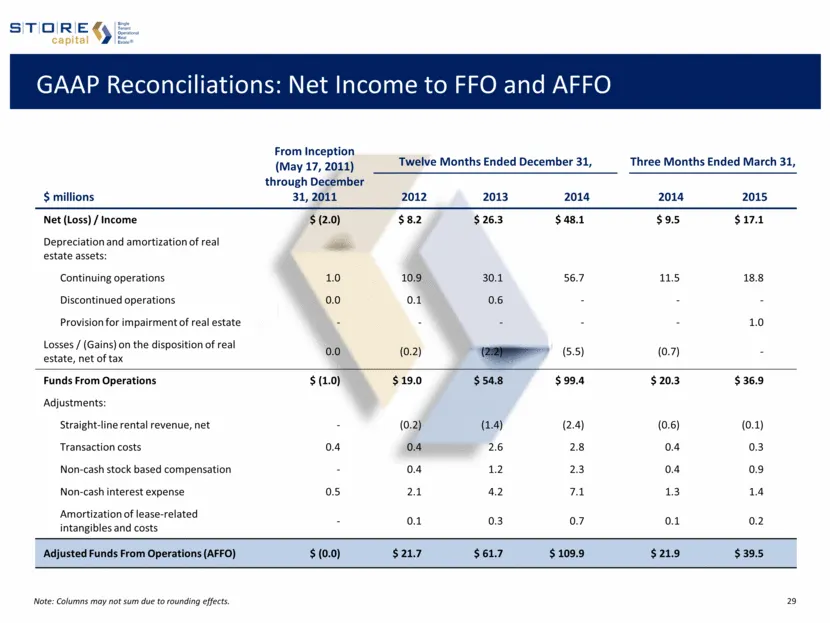
GAAP Reconciliations: Net Income to FFO and AFFO Note: Columns may not sum due to rounding effects. From Inception (May 17, 2011) through December 31, 2011 Twelve Months Ended December 31, Three Months Ended March 31, $ millions 2012 2013 2014 2014 2015 Net (Loss) / Income $ (2.0) $ 8.2 $ 26.3 $ 48.
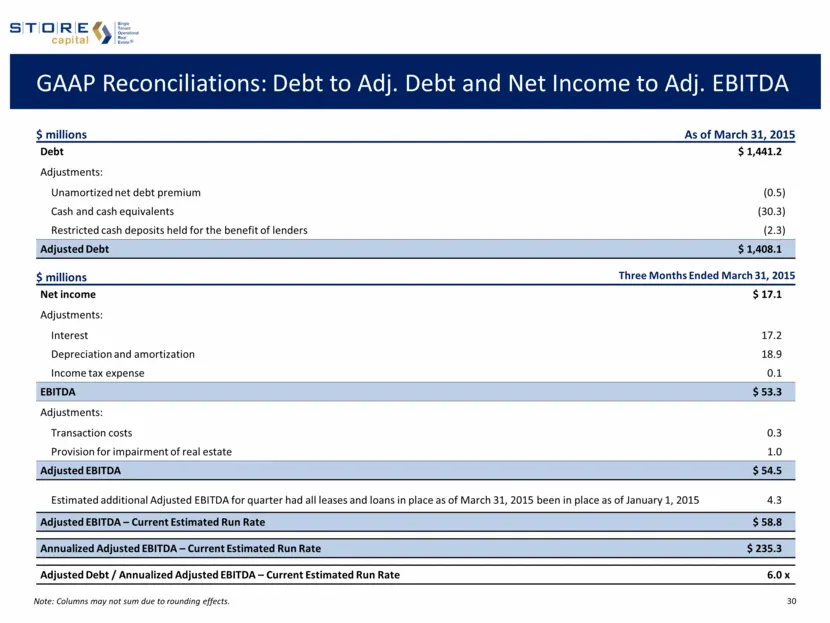
Slide 29: GAAP Reconciliations: Debt to Adj. Debt and Net Income to Adj. EBITDA
GAAP Reconciliations: Debt to Adj. Debt and Net Income to Adj. EBITDA $ millions As of March 31, 2015 Debt $ 1,441.2 Adjustments: Unamortized net debt premium (0.5 ) Cash and cash equivalents (30.3 ) Restricted cash deposits held for the benefit of lenders (2.3 ) Adjusted Debt $ 1,408.1 $ millions T
Source: SEC EDGAR · 8-K filed Jun 4, 2015
More decks from STORE Capital Corp
 Q2 2023 Earnings Presentation10 slides · Aug 4, 2023
 Q2 2022 Earnings Presentation26 slides · Aug 3, 2022
 Q2 2022 Earnings Presentation22 slides · Aug 3, 2022
 Q1 2022 Earnings Presentation26 slides · May 4, 2022
 Q1 2022 Earnings Presentation22 slides · May 4, 2022
 Q4 2021 Earnings Presentation33 slides · Feb 23, 2022