PVR Inox Limited · NSE:PVRINOX
PVR Inox — PVR — Investor Presentation (February 2016)
24 slides from PVR Inox's investor presentation, February 2016

Slide 1: Investor Presentation February 2016
INVESTOR PRESENTATION February 2016
Slide 2: Disclaimer
DISCLAIMER Safe Harbor: - Some information in this report may contain forward-looking statements. We have based these forward looking statements on our current beliefs, expectations and intentions as to facts, actions and events that will or may occur in the future. Such statements generally are ide
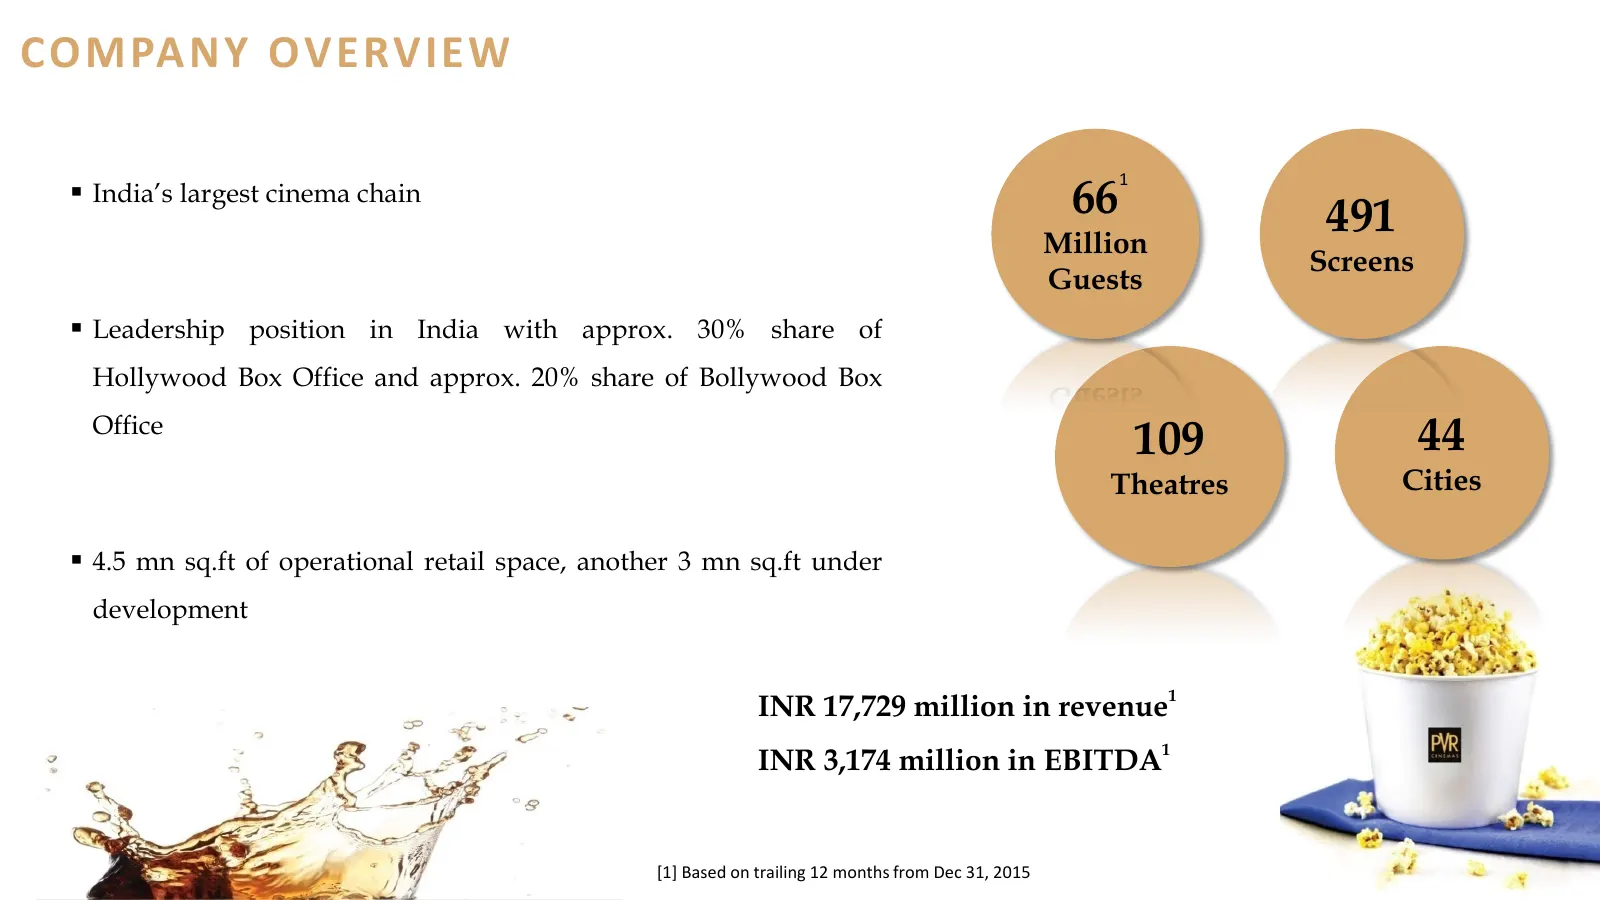
Slide 3: Company Overview
COMPANY OVERVIEW 66 1 India’s largest cinema chain Million 491 Screens Guests Leadership position in India with approx. 30% share of Hollywood Box Office and approx. 20% share of Bollywood Box Office 109 44 Theatres Cities 4.5 mn sq.ft of operational retail space, another 3 mn sq.ft under deve
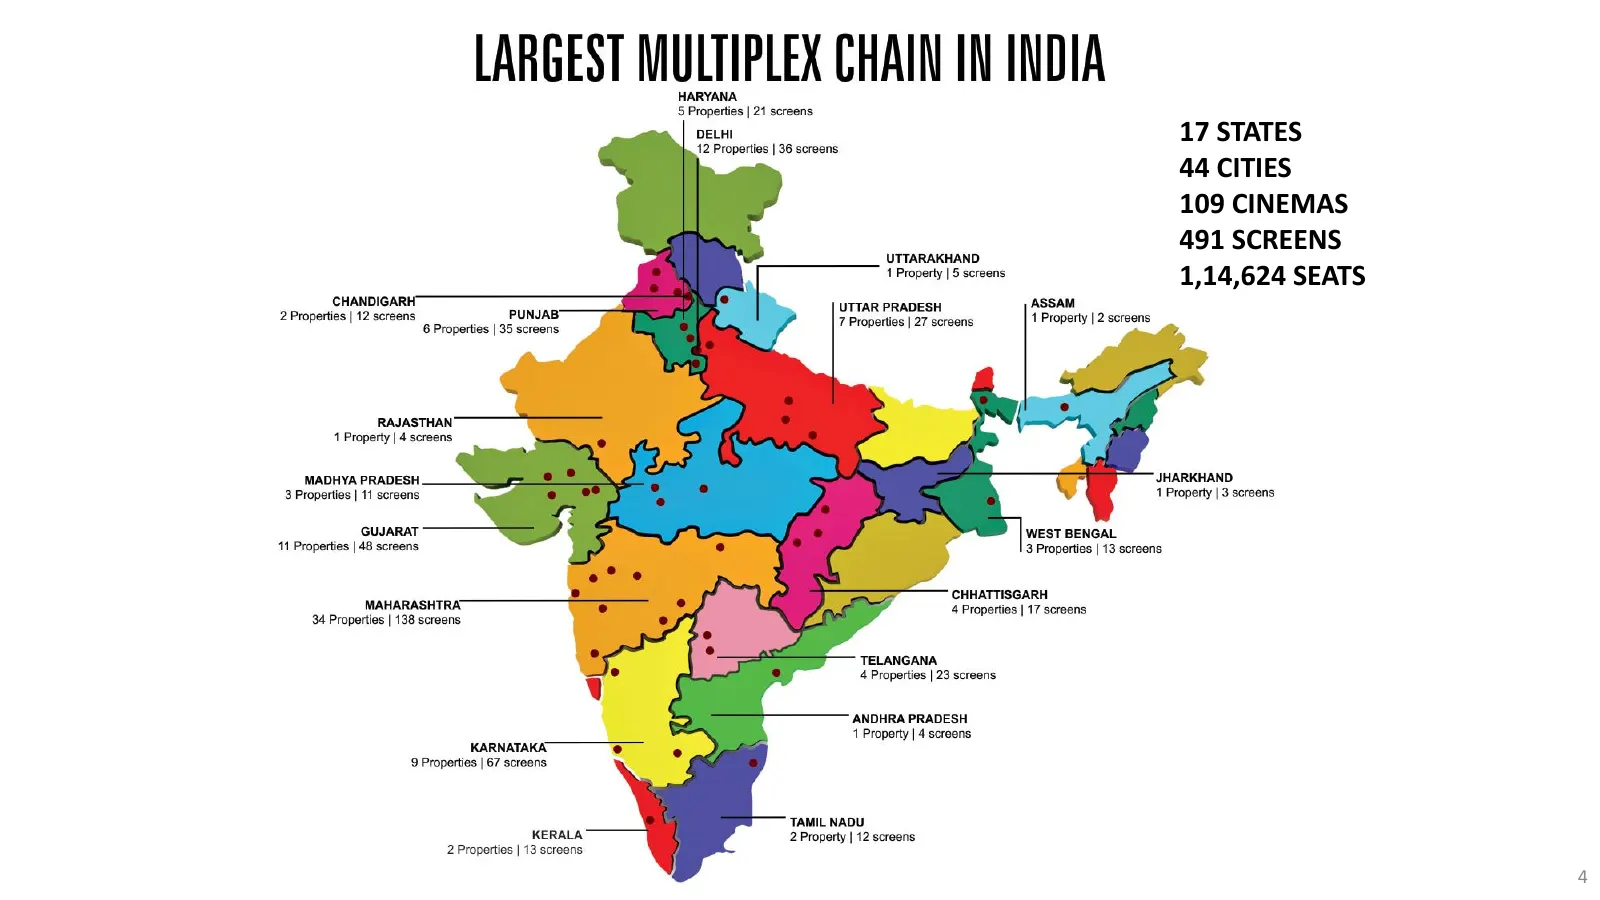
Slide 4: 17 States 44 Cities 109 Cinemas
17 STATES 44 CITIES 109 CINEMAS 491 SCREENS 1,14,624 SEATS 4
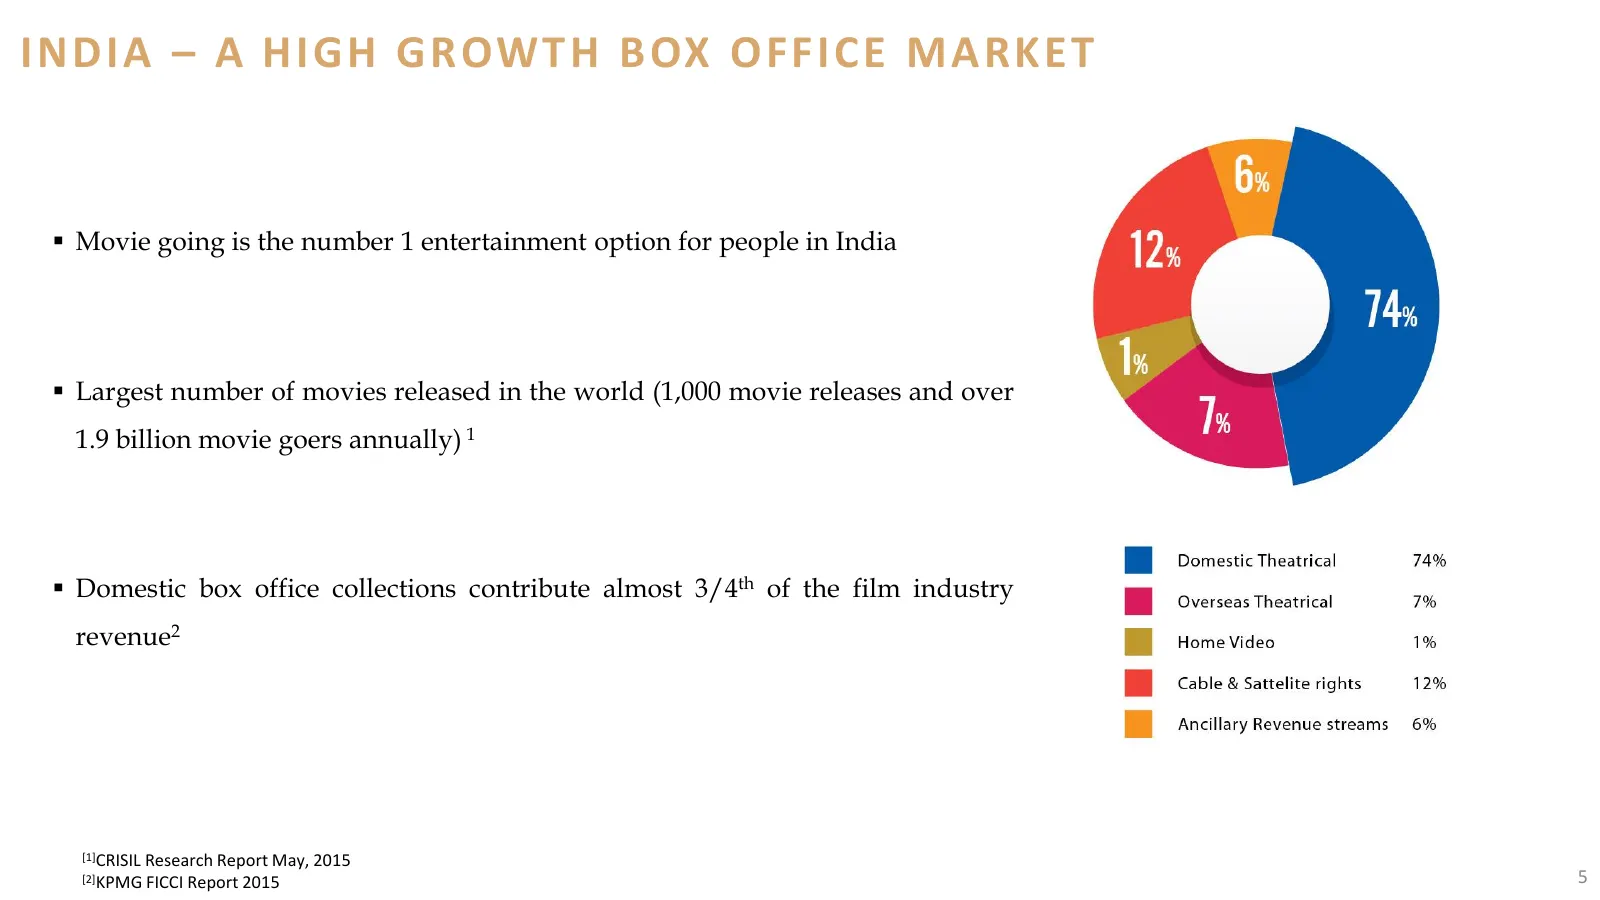
Slide 5: India – A High Growth Box Office Market
INDIA – A HIGH GROWTH BOX OFFICE MARKET Movie going is the number 1 entertainment option for people in India Largest number of movies released in the world (1,000 movie releases and over 1.9 billion movie goers annually) 1 Domestic box office collections contribute almost 3/4th of the film ind
Slide 6: India – A High Growth Box Office Market
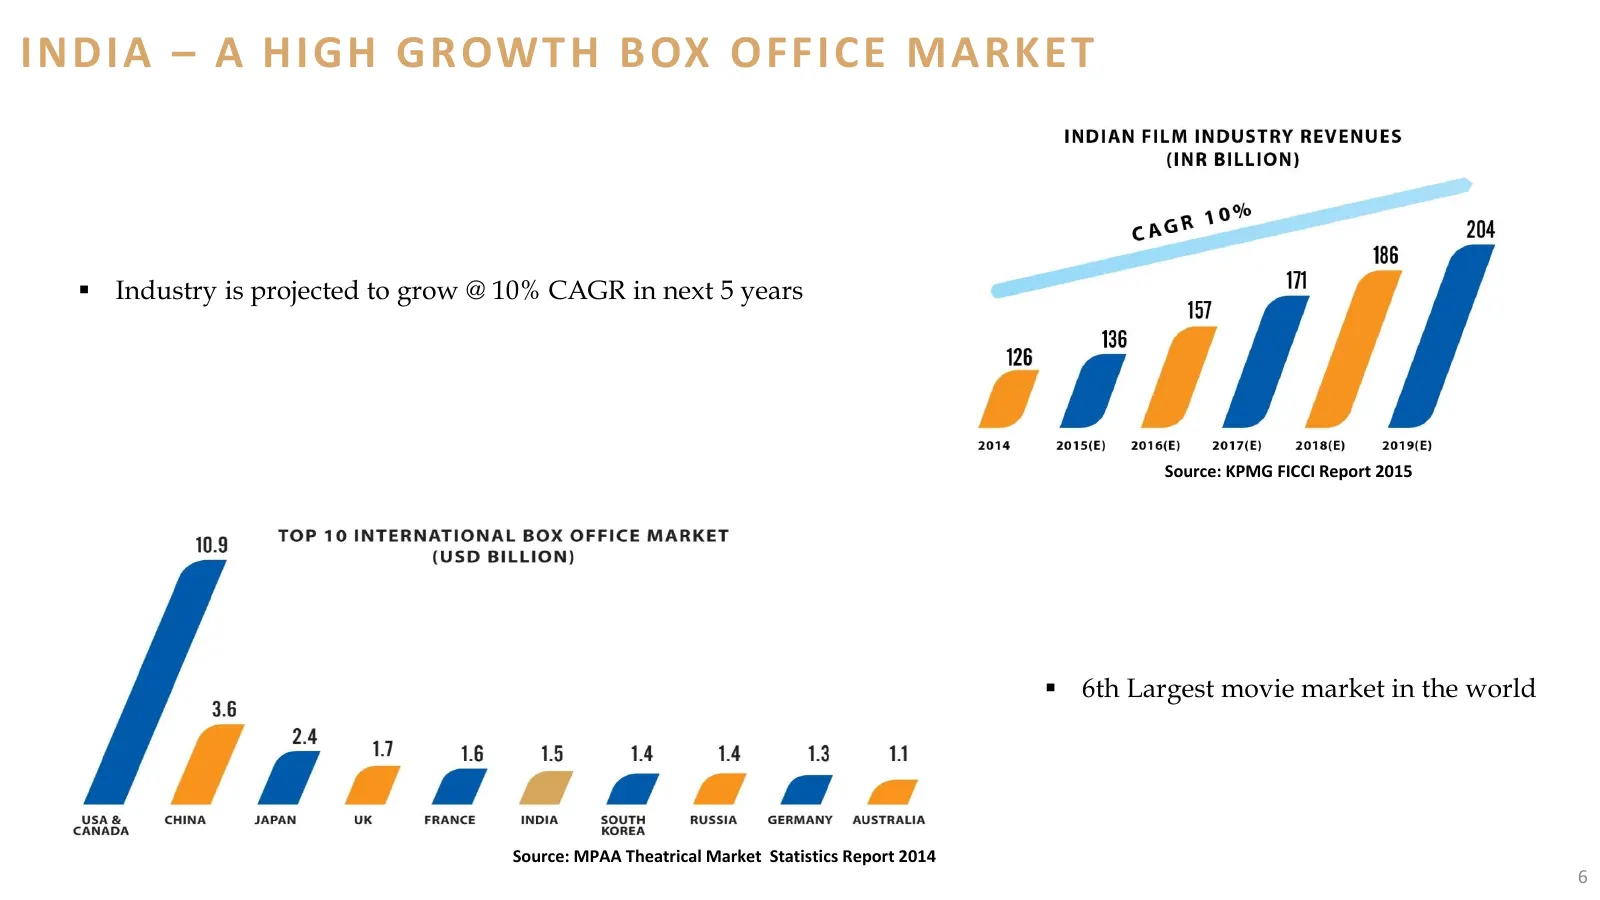
INDIA – A HIGH GROWTH BOX OFFICE MARKET Industry is projected to grow @ 10% CAGR in next 5 years Source: KPMG FICCI Report 2015 6th Largest movie market in the world Source: MPAA Theatrical Market Statistics Report 2014 6
Slide 7: India – A High Growth Box Office Market
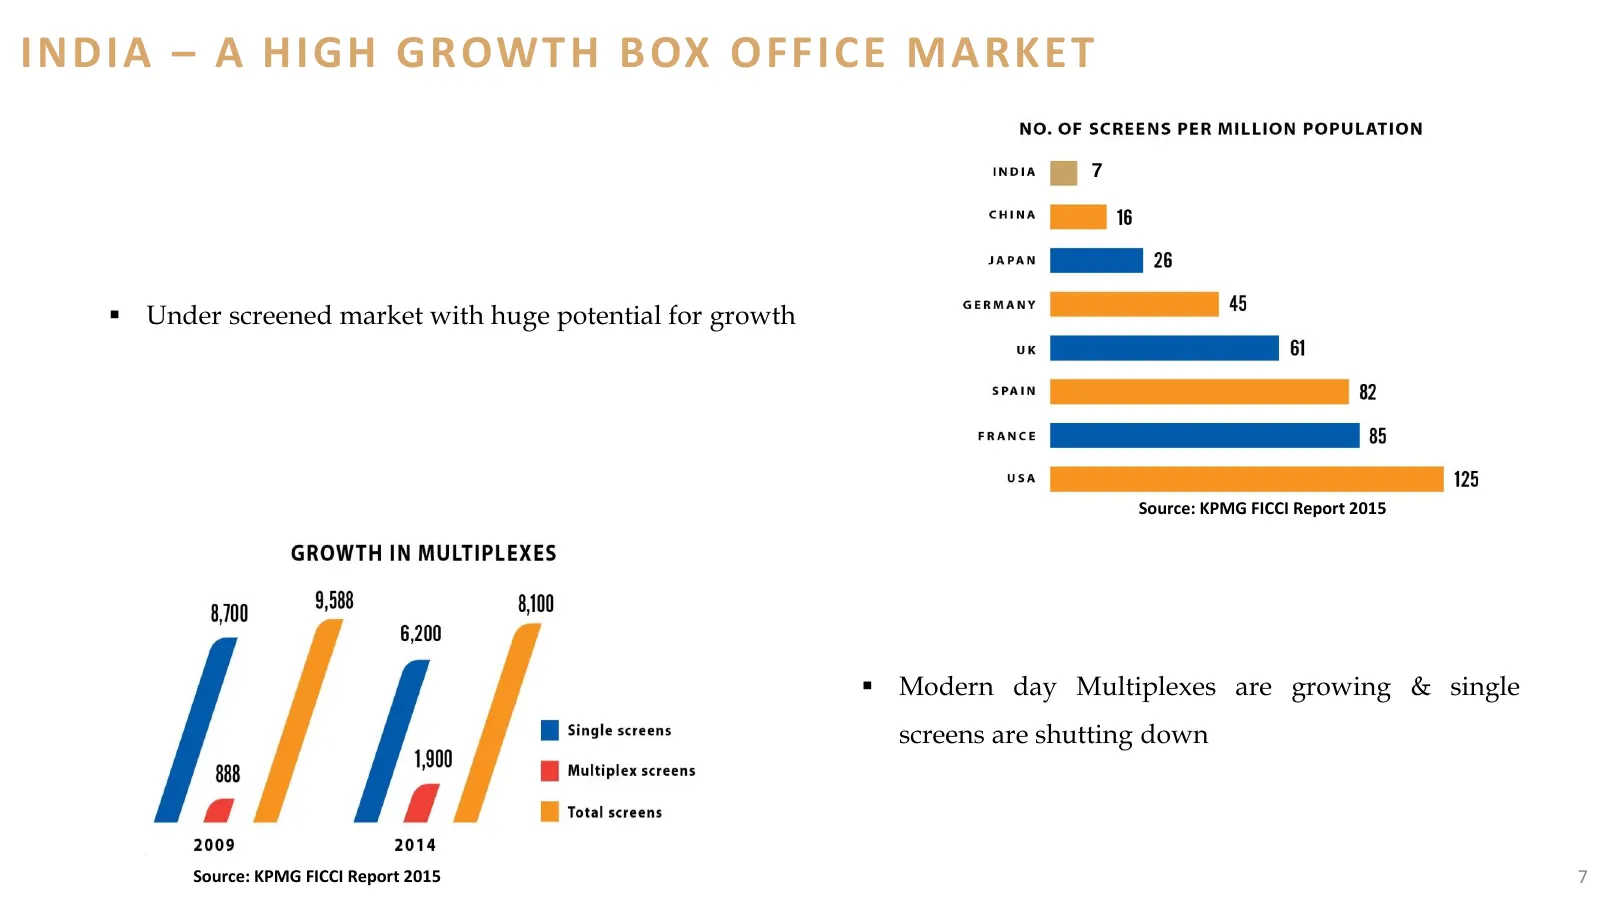
INDIA – A HIGH GROWTH BOX OFFICE MARKET 7 Under screened market with huge potential for growth Source: KPMG FICCI Report 2015 Modern day Multiplexes are growing & single screens are shutting down Source: KPMG FICCI Report 2015 7
Slide 8: Our Key Strengths
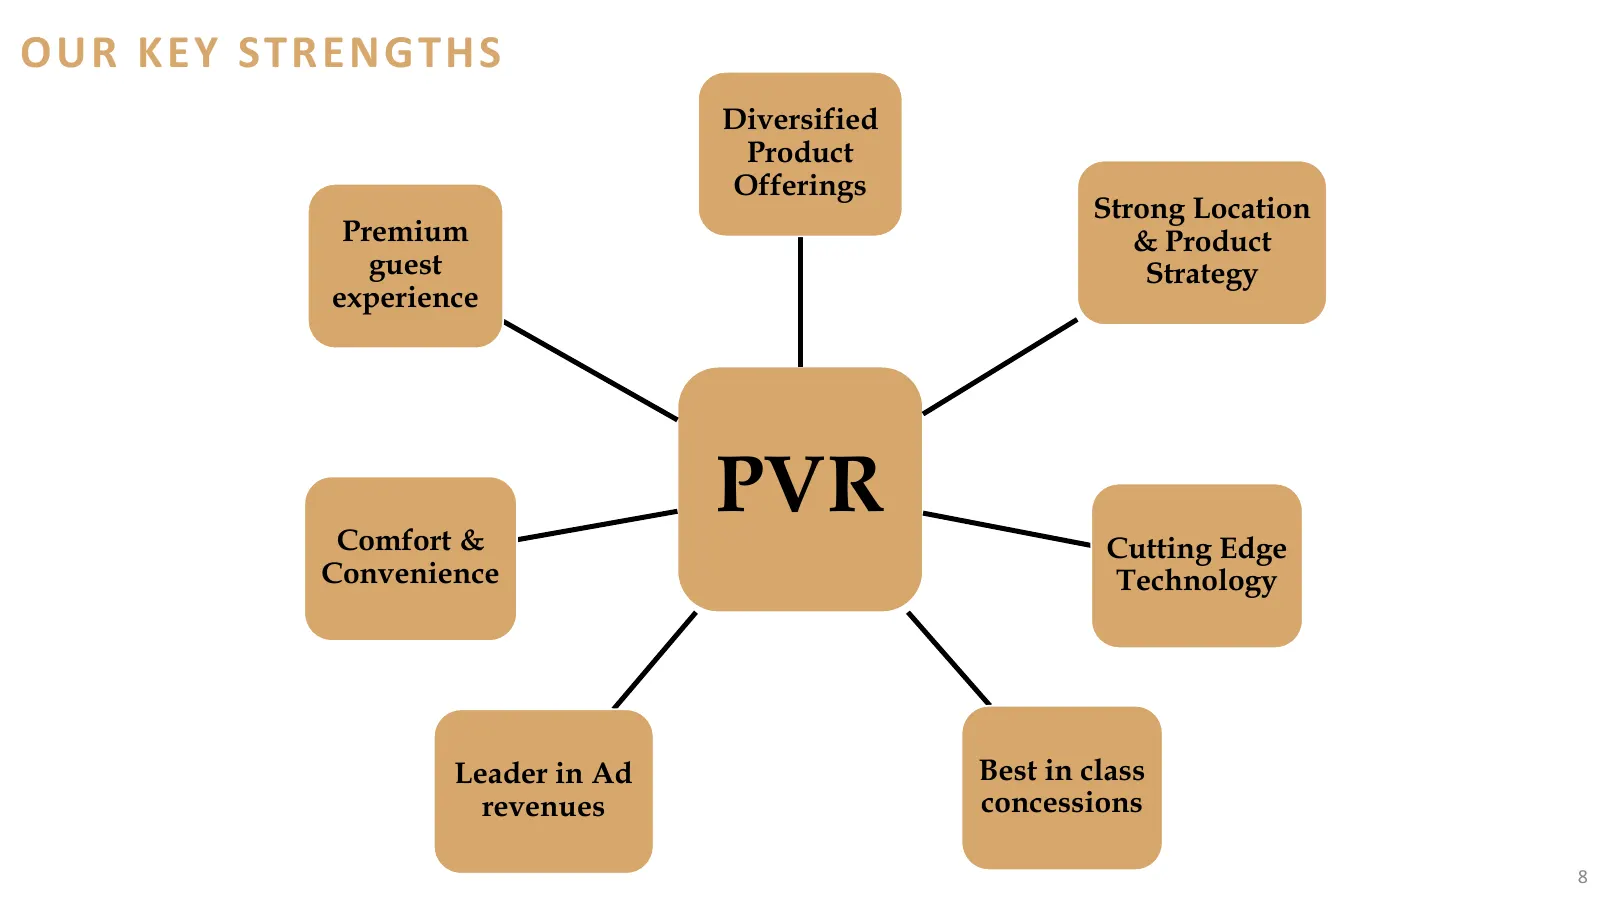
OUR KEY STRENGTHS Diversified Product Offerings Strong Location Premium & Product guest Strategy experience Comfort & PVR Cutting Edge Convenience Technology Leader in Ad Best in class revenues concessions 8
Slide 9: Diversified Product Offerings
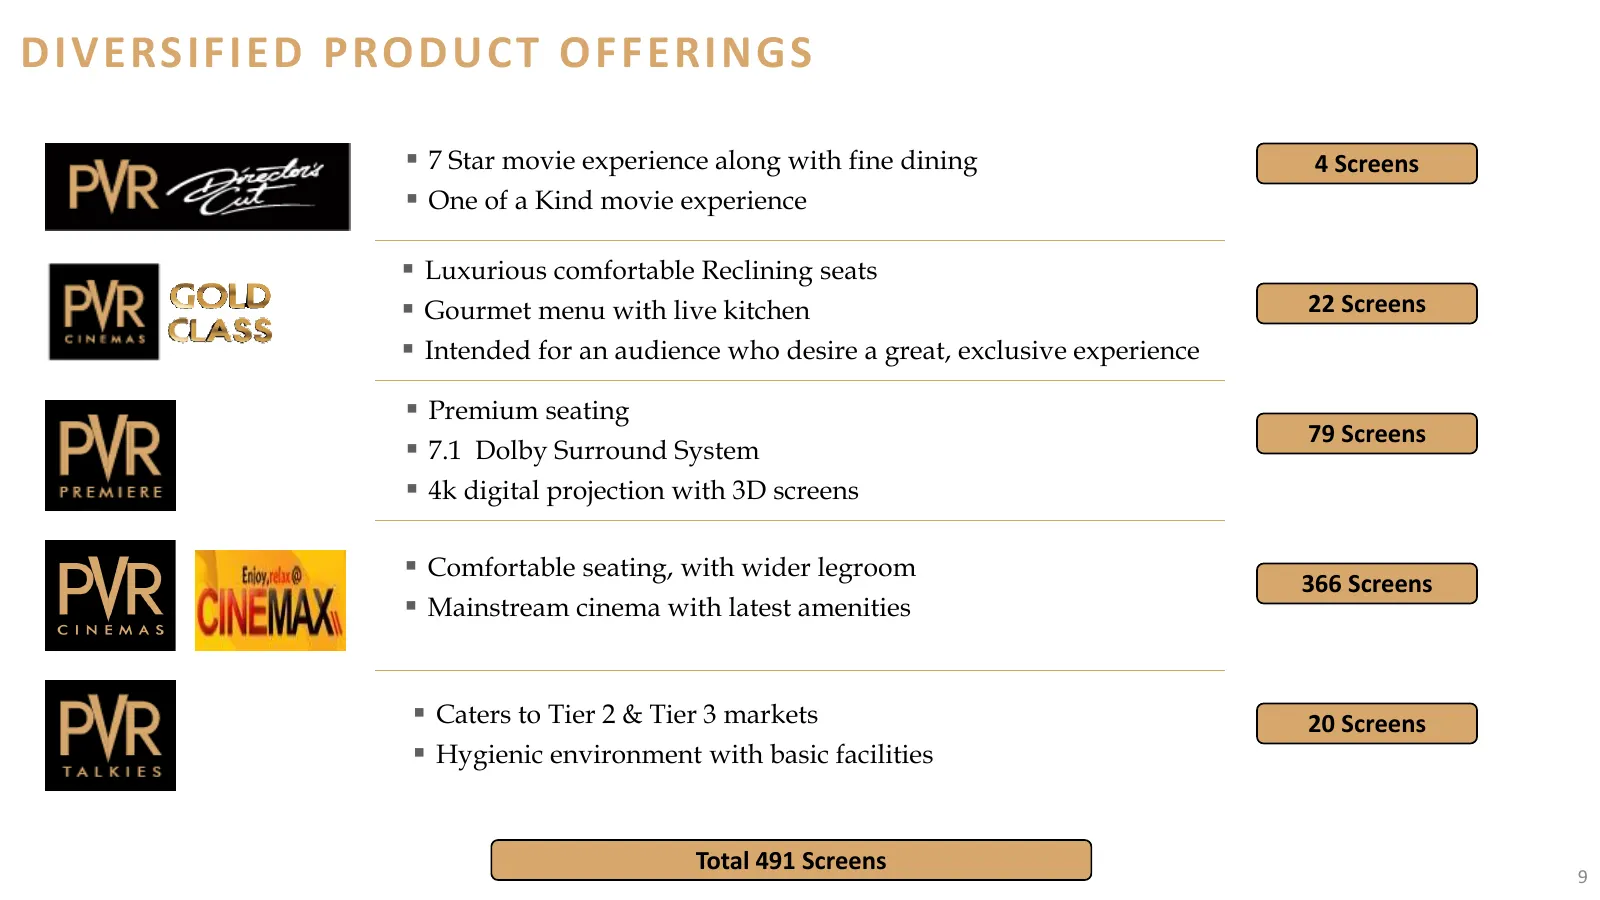
DIVERSIFIED PRODUCT OFFERINGS 7 Star movie experience along with fine dining 4 Screens One of a Kind movie experience Luxurious comfortable Reclining seats Gourmet menu with live kitchen 22 Screens Intended for an audience who desire a great, exclusive experience Premium seating 79 Scree
Slide 10: Strong Location and Product Strategy
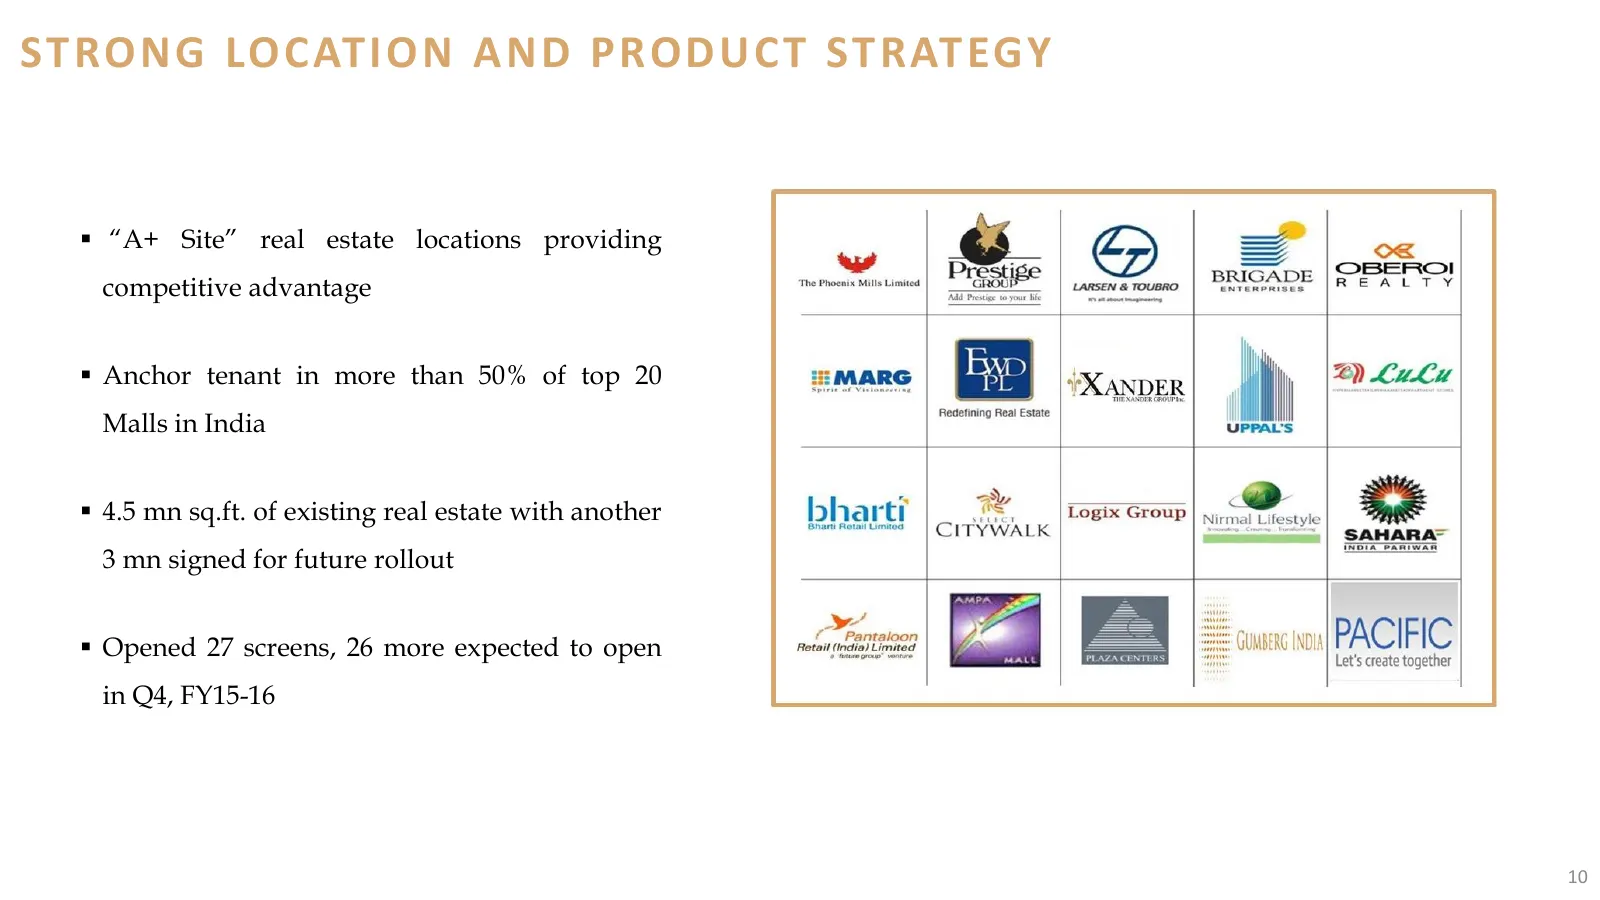
STRONG LOCATION AND PRODUCT STRATEGY “A+ Site” real estate locations providing competitive advantage Anchor tenant in more than 50% of top 20 Malls in India 4.5 mn sq.ft. of existing real estate with another 3 mn signed for future rollout Opened 27 screens, 26 more expected to open in Q4, FY
Slide 11: Cutting Edge Technology
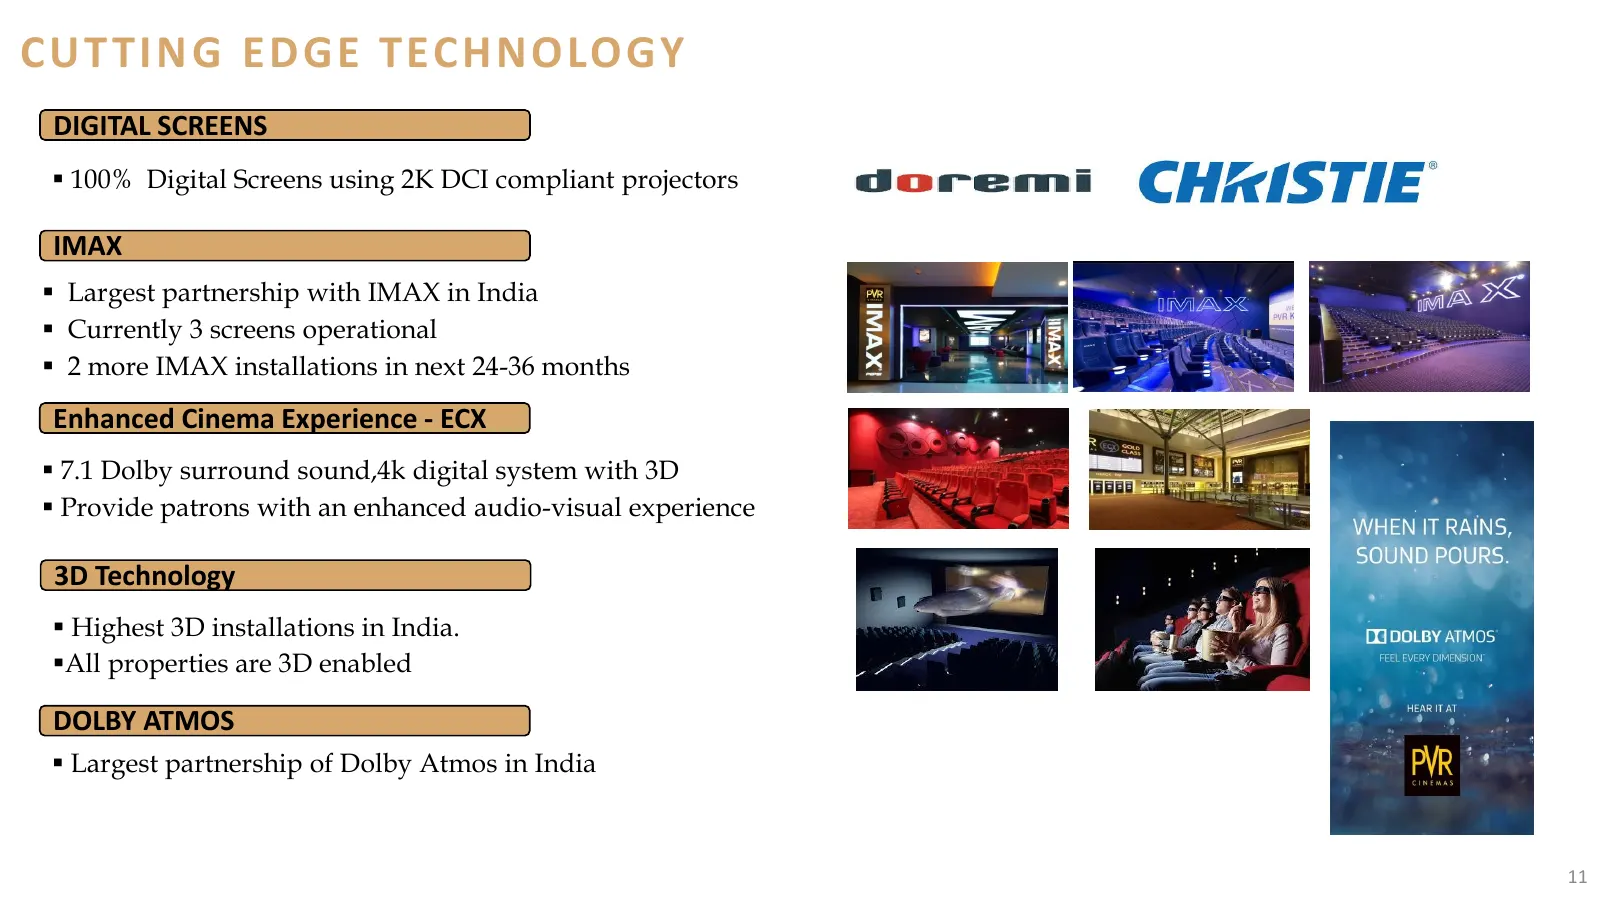
CUT TING EDGE TECHNOLOGY DIGITAL SCREENS 100% Digital Screens using 2K DCI compliant projectors IMAX Largest partnership with IMAX in India Currently 3 screens operational 2 more IMAX installations in next 24-36 months Enhanced Cinema Experience - ECX 7.1 Dolby surround sound,4k digital sy
Slide 12: Best in Class Concessions
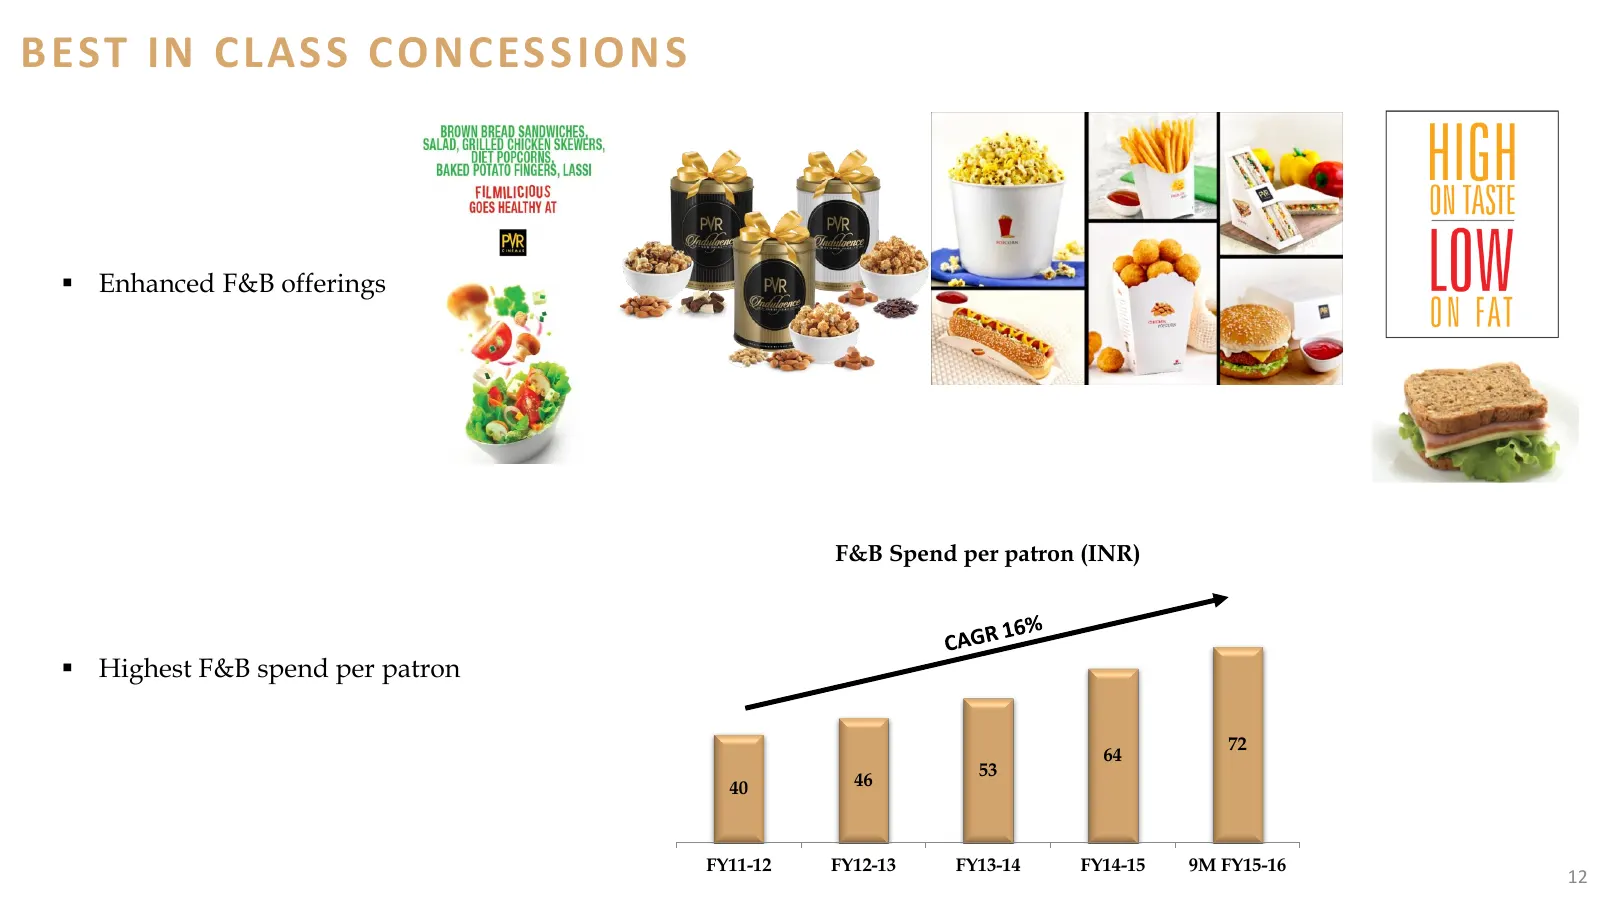
BEST IN CLASS CONCESSIONS Enhanced F&B offerings F&B Spend per patron (INR) Highest F&B spend per patron 72 64 53 40 46 FY11-12 FY12-13 FY13-14 FY14-15 9M FY15-16 12
Slide 13: Best in Class Concessions
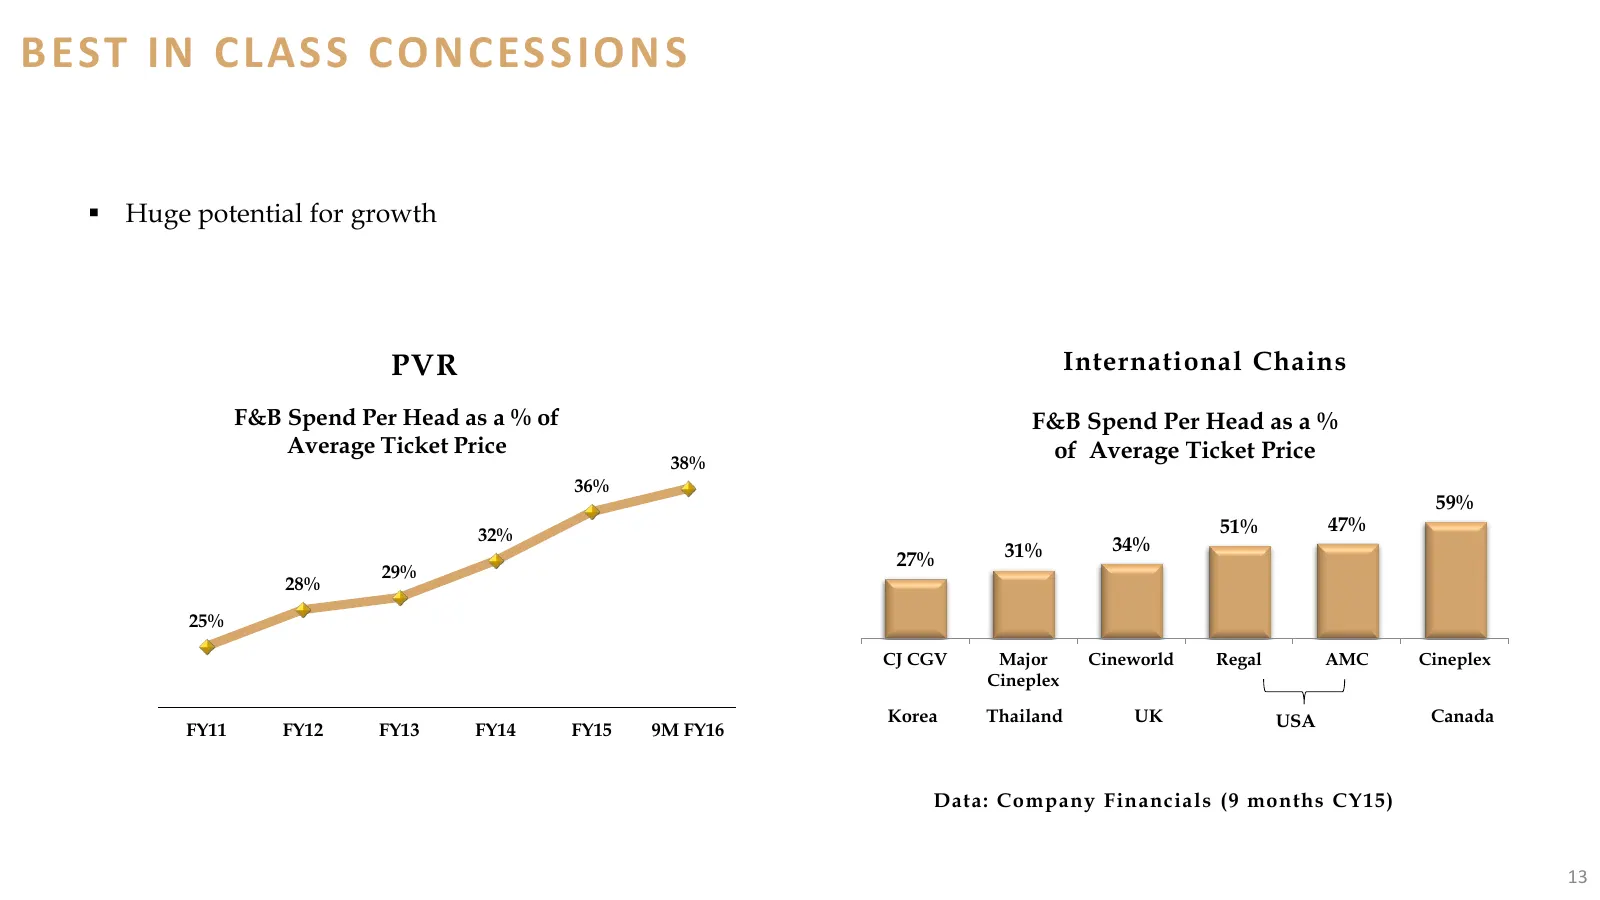
BEST IN CLASS CONCESSIONS Huge potential for growth PVR International Chains F&B Spend Per Head as a % of F&B Spend Per Head as a % Average Ticket Price of Average Ticket Price 38% 36% 59% 51% 47% 32% 31% 34% 27% 29% 28% 25% CJ CGV Major Cineworld Regal AMC Cineplex Cineplex Korea Thailand UK USA
Slide 14: Leader in Advertisement Revenues
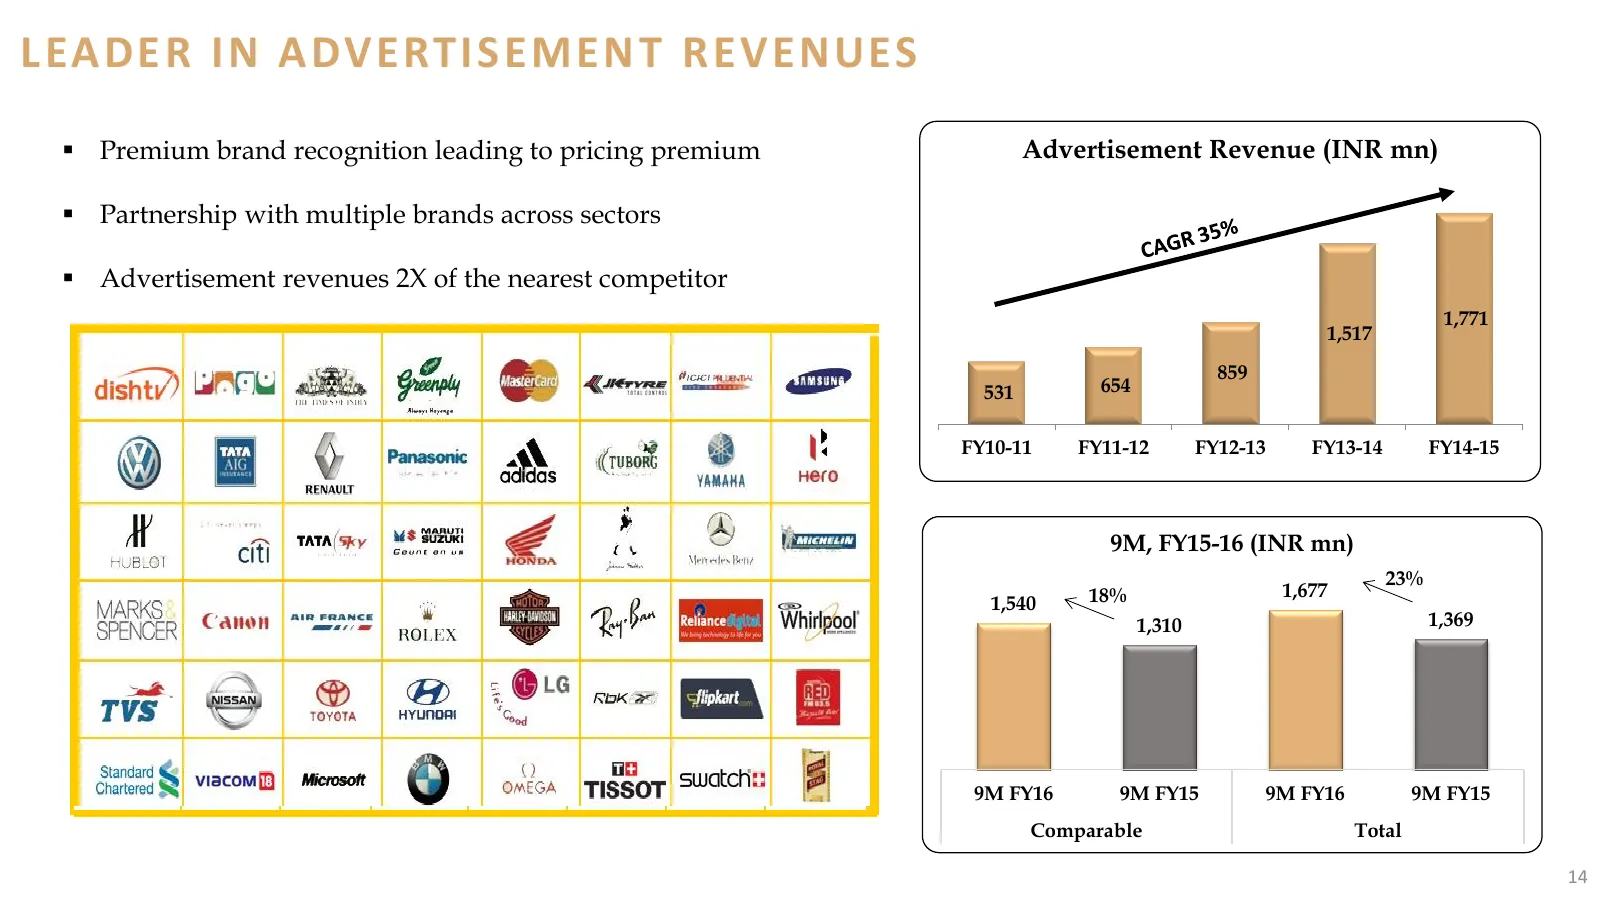
LEADER IN ADVERTISEMENT REVENUES Premium brand recognition leading to pricing premium Advertisement Revenue (INR mn) Partnership with multiple brands across sectors Advertisement revenues 2X of the nearest competitor 1,771 1,517 859 531 654 FY10-11 FY11-12 FY12-13 FY13-14 FY14-15 9M, FY15-16 (
Slide 15: Comfort and Convenience
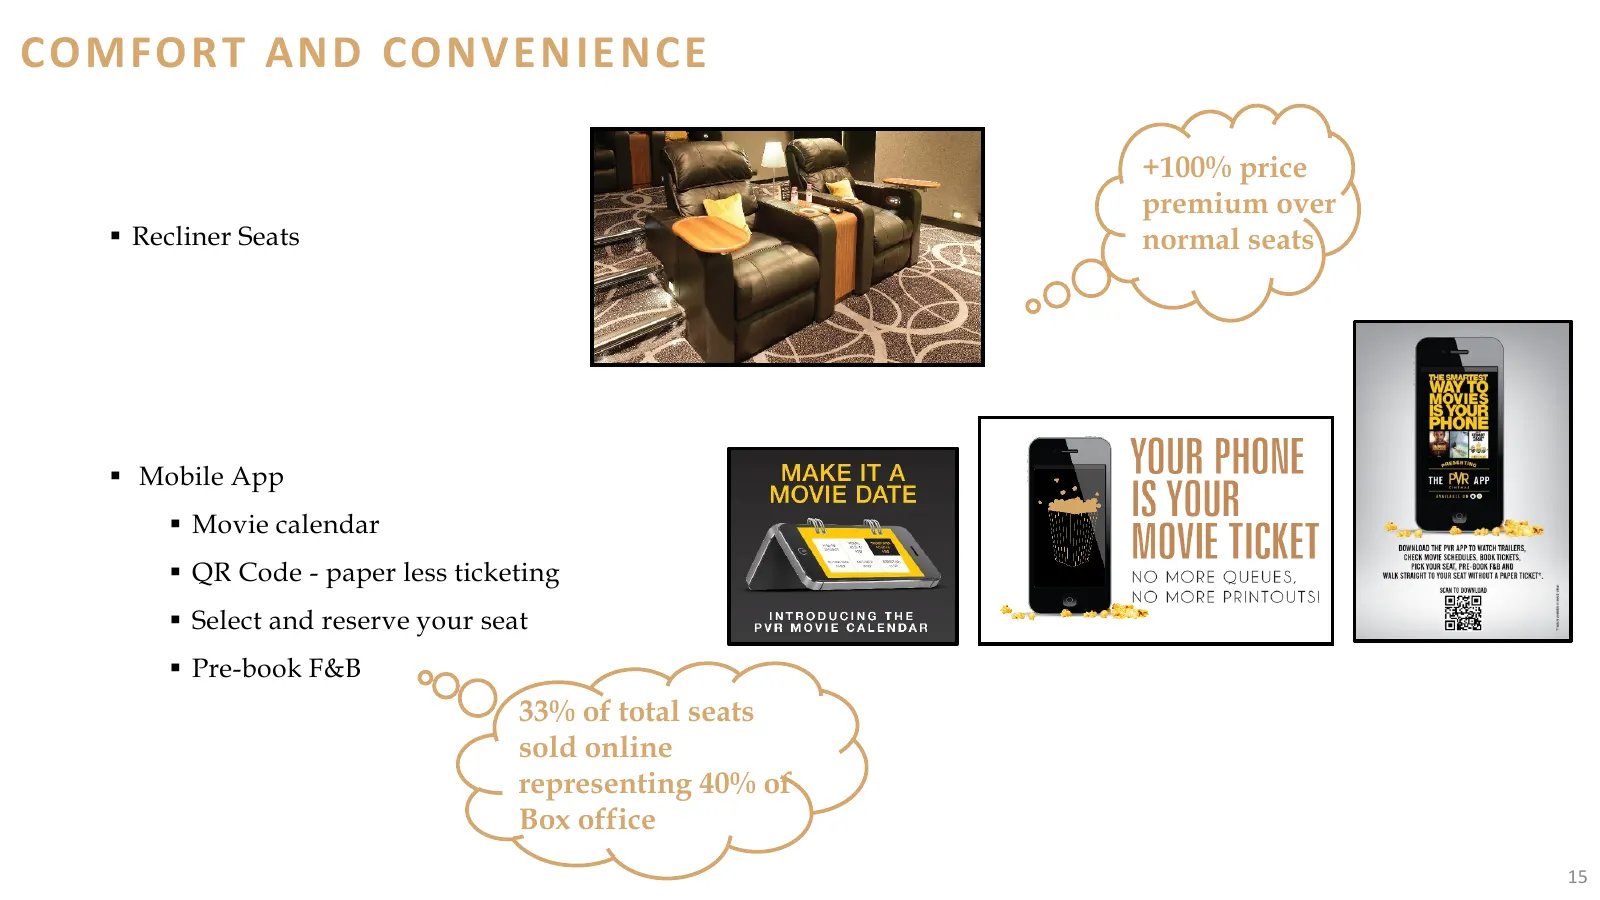
COMFORT AND CONVENIENCE +100% price premium over Recliner Seats normal seats Mobile App Movie calendar QR Code - paper less ticketing Select and reserve your seat Pre-book F&B 33% of total seats sold online representing 40% of Box office 15
Slide 16: Premium Guest Experience
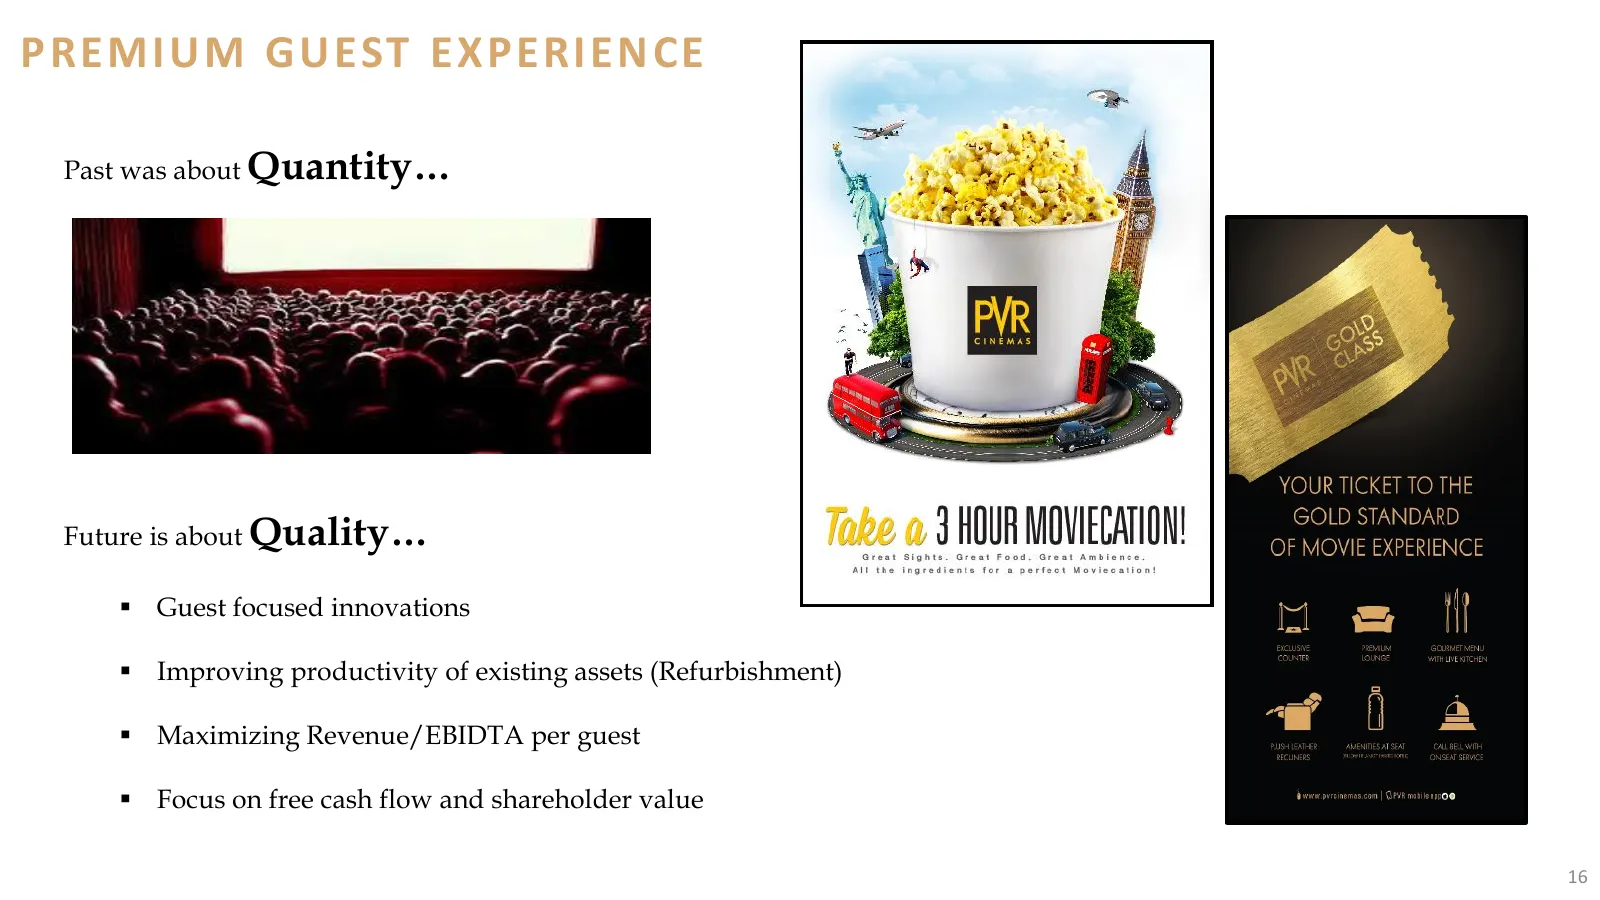
PREMIUM GUEST EXPERIENCE Past was about Quantity… Future is about Quality… Guest focused innovations Improving productivity of existing assets (Refurbishment) Maximizing Revenue/EBIDTA per guest Focus on free cash flow and shareholder value 16
Slide 17: 9M FY15-16 Performance Snapshot - Consolidated
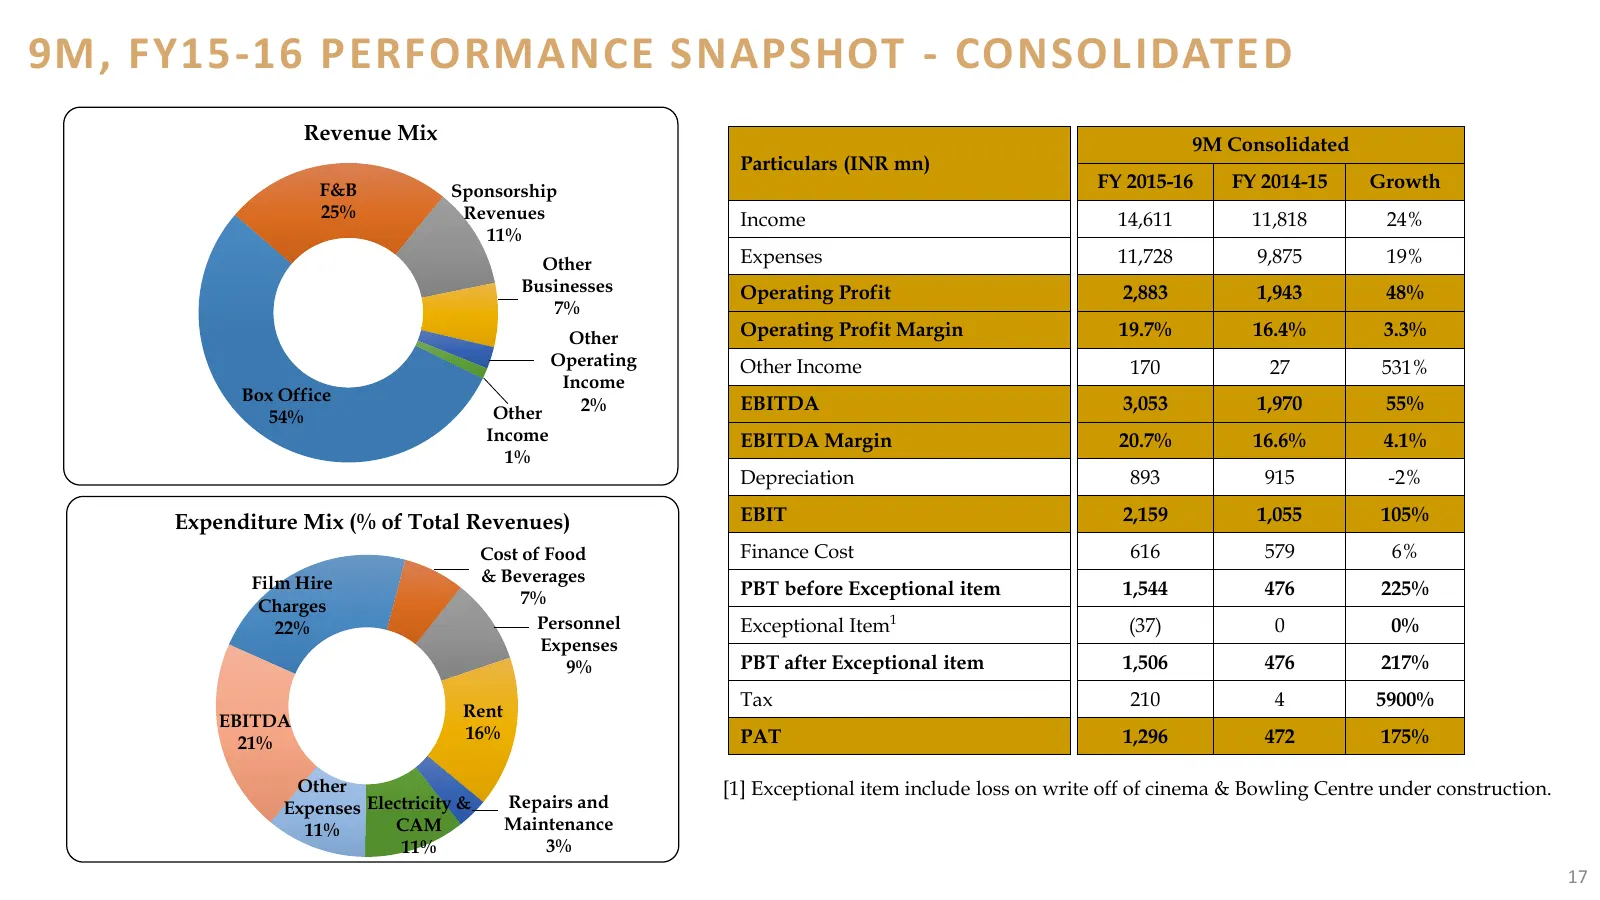
9M, FY15-16 PERFORMANCE SNAPSHOT - CONSOLIDATED Revenue Mix 9M Consolidated Particulars (INR mn) F&B Sponsorship FY 2015-16 FY 2014-15 Growth 25% Revenues Income 14,611 11,818 24% 11% Other Expenses 11,728 9,875 19% Businesses Operating Profit 2,883 1,943 48% 7% Other Operating Profit Margin 19.7% 1
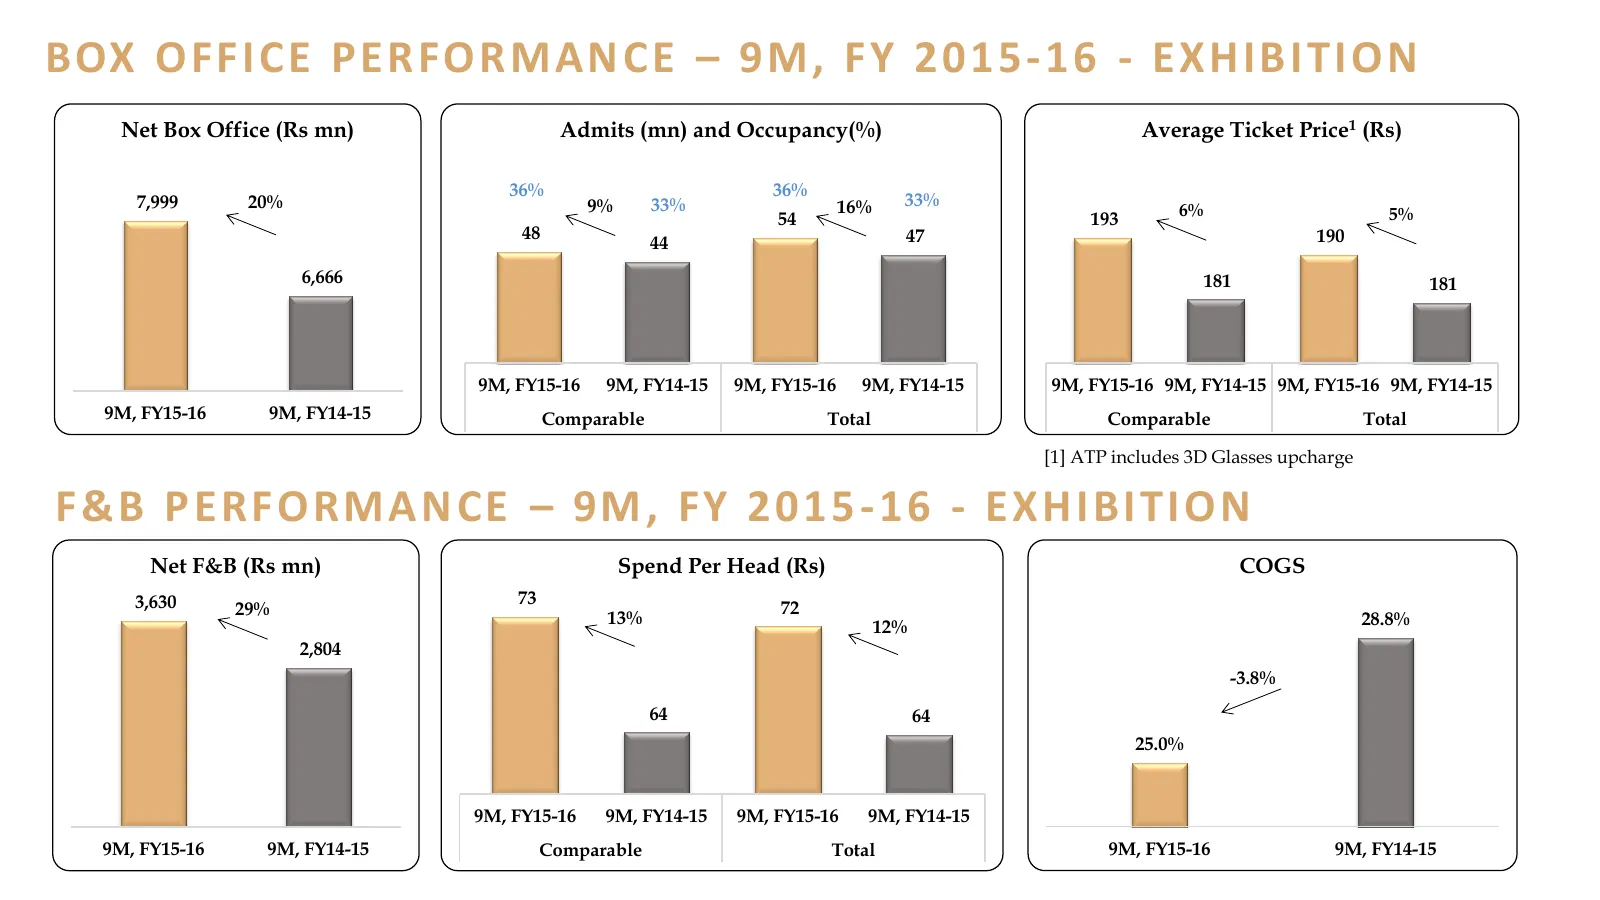
Slide 18: Box Office and F&B Performance – 9M FY2015-16
BOX OFFICE PERFORMANCE – 9M, FY 2015 -16 - EXHIBITION Net Box Office (Rs mn) Admits (mn) and Occupancy(%) Average Ticket Price1 (Rs) 36% 36% 7,999 20% 9% 33% 16% 33% 6% 5% 54 193 48 47 190 44 6,666 181 181 9M, FY15-16 9M, FY14-15 9M, FY15-16 9M, FY14-15 9M, FY15-16 9M, FY14-15 9M, FY15-16 9M, FY14-1
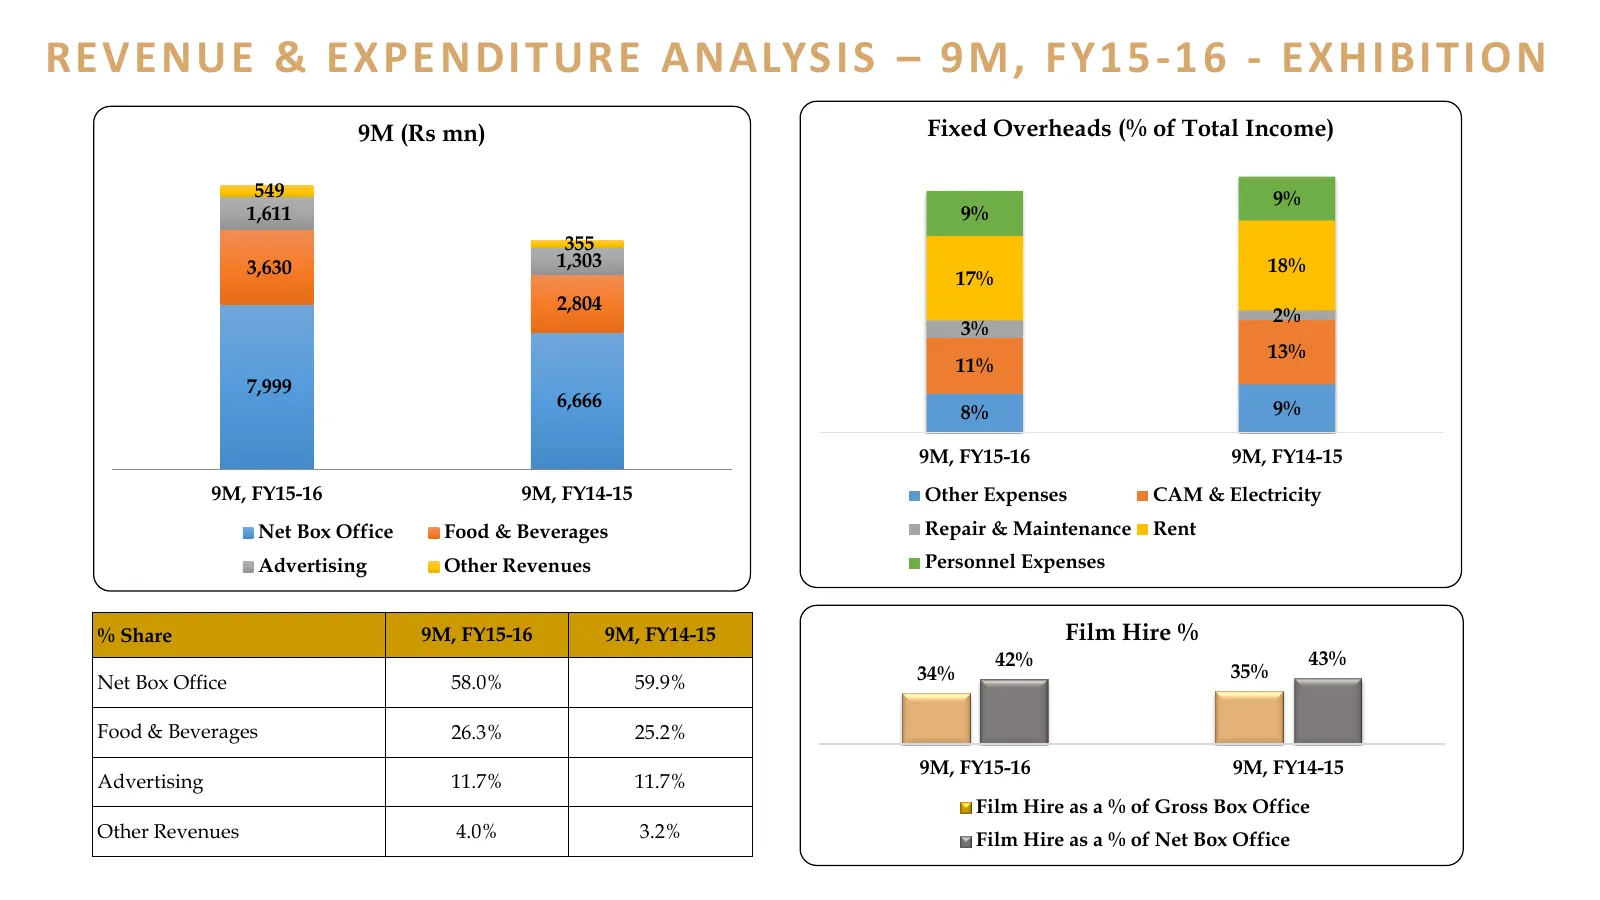
Slide 19: Revenue & Expenditure Analysis – 9M FY15-16 Exhibition
REVENUE & EXPENDITURE ANALYSIS – 9M, FY15 -1 6 - EXHIBITION 9M (Rs mn) Fixed Overheads (% of Total Income) 549 9% 1,611 9% 355 3,630 1,303 18% 17% 2,804 2% 3% 13% 11% 7,999 6,666 9% 8% 9M, FY15-16 9M, FY14-15 9M, FY15-16 9M, FY14-15 Other Expenses CAM & Electricity Net Box Office Food & Beverages Re
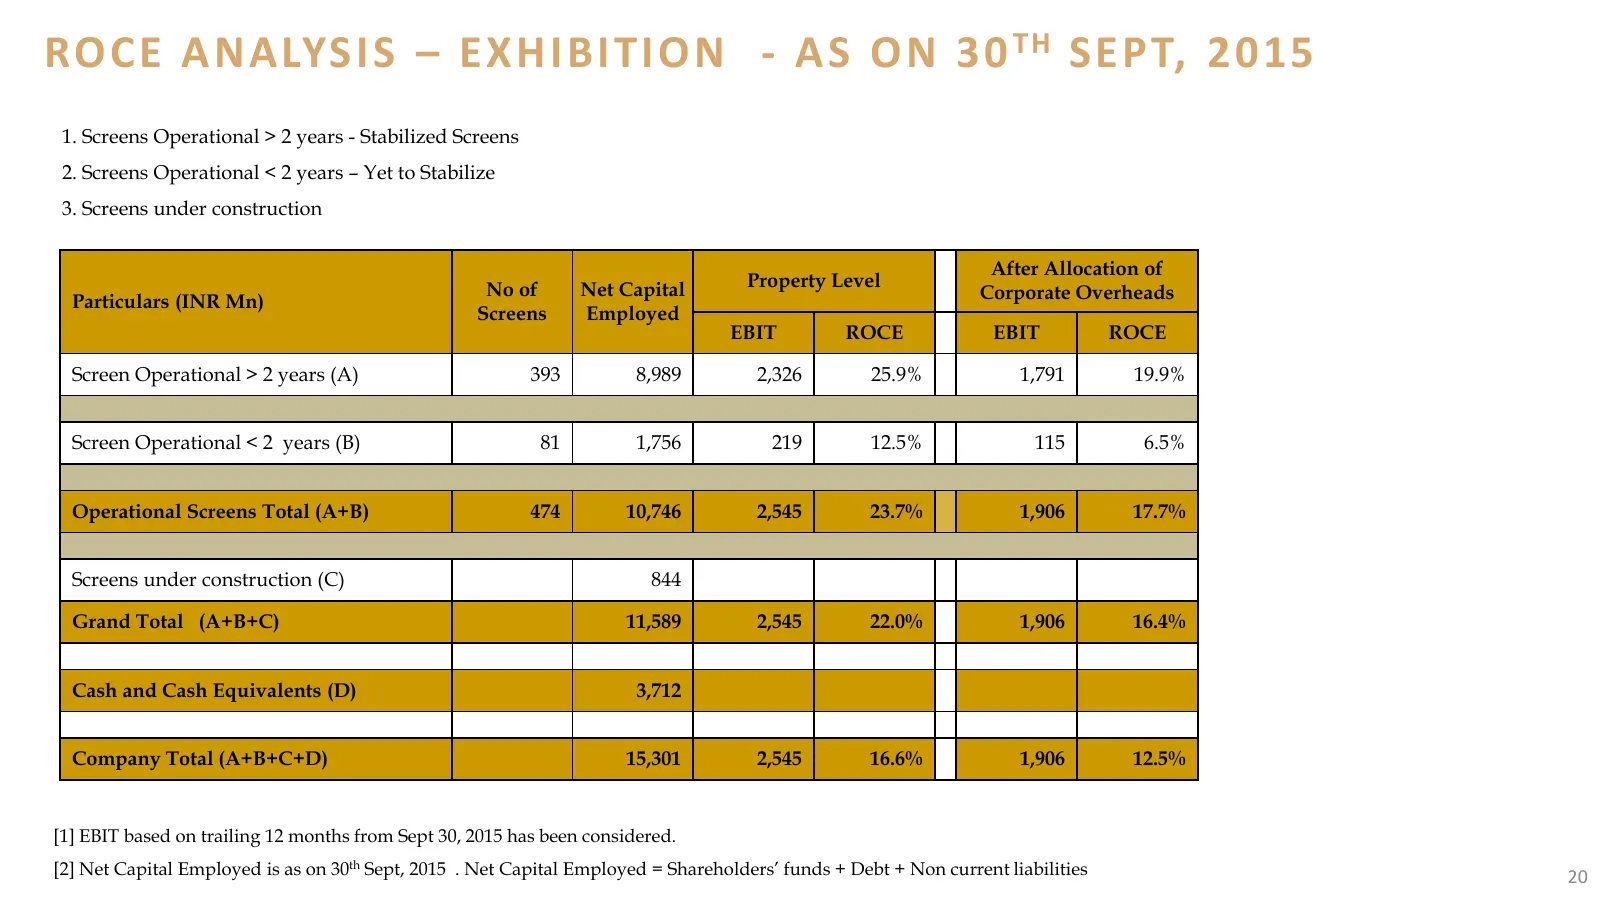
Slide 20: ROCE Analysis – Exhibition
ROCE ANALYSIS – EXHIBITION - AS ON 30 TH SEPT, 2015 1. Screens Operational > 2 years - Stabilized Screens 2. Screens Operational < 2 years – Yet to Stabilize 3. Screens under construction After Allocation of No of Net Capital Property Level Particulars (INR Mn) Corporate Overheads Screens Employed E
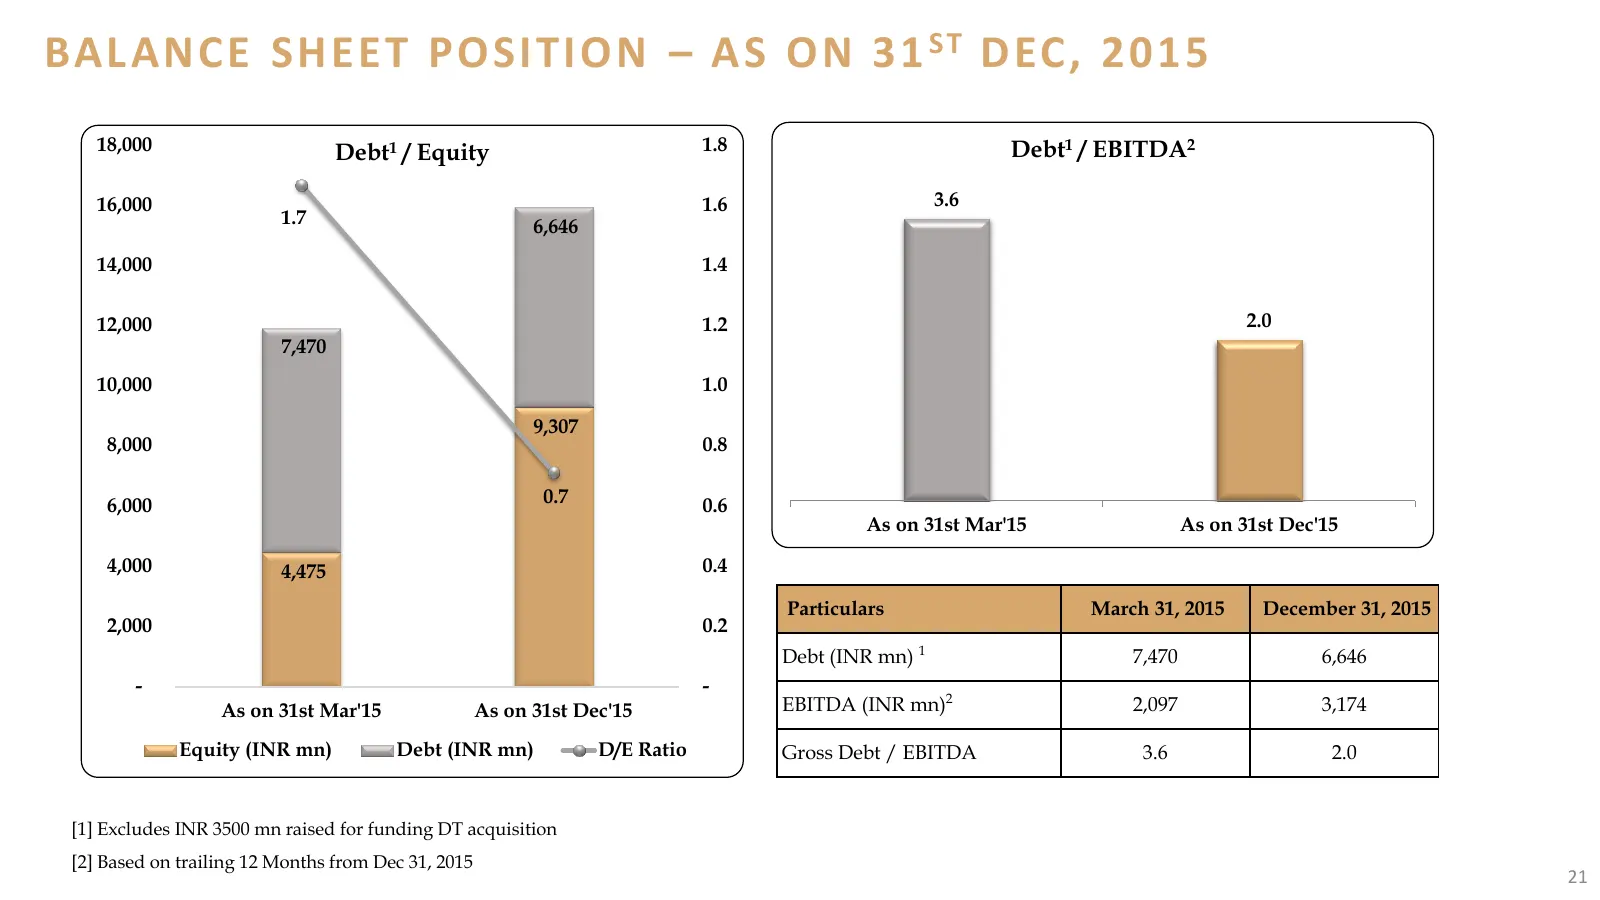
Slide 21: Balance Sheet Position – As on 31st Dec 2015
BALANCE SHEET POSITION – AS ON 31 ST DEC, 2015 18,000 Debt1 / Equity 1.8 Debt1 / EBITDA2 16,000 1.6 3.6 1.7 6,646 14,000 1.4 12,000 1.2 2.0 7,470 10,000 1.0 9,307 8,000 0.8 6,000 0.7 0.6 As on 31st Mar'15 As on 31st Dec'15 4,000 4,475 0.4 Particulars March 31, 2015 December 31, 2015 2,000 0.2 Debt (
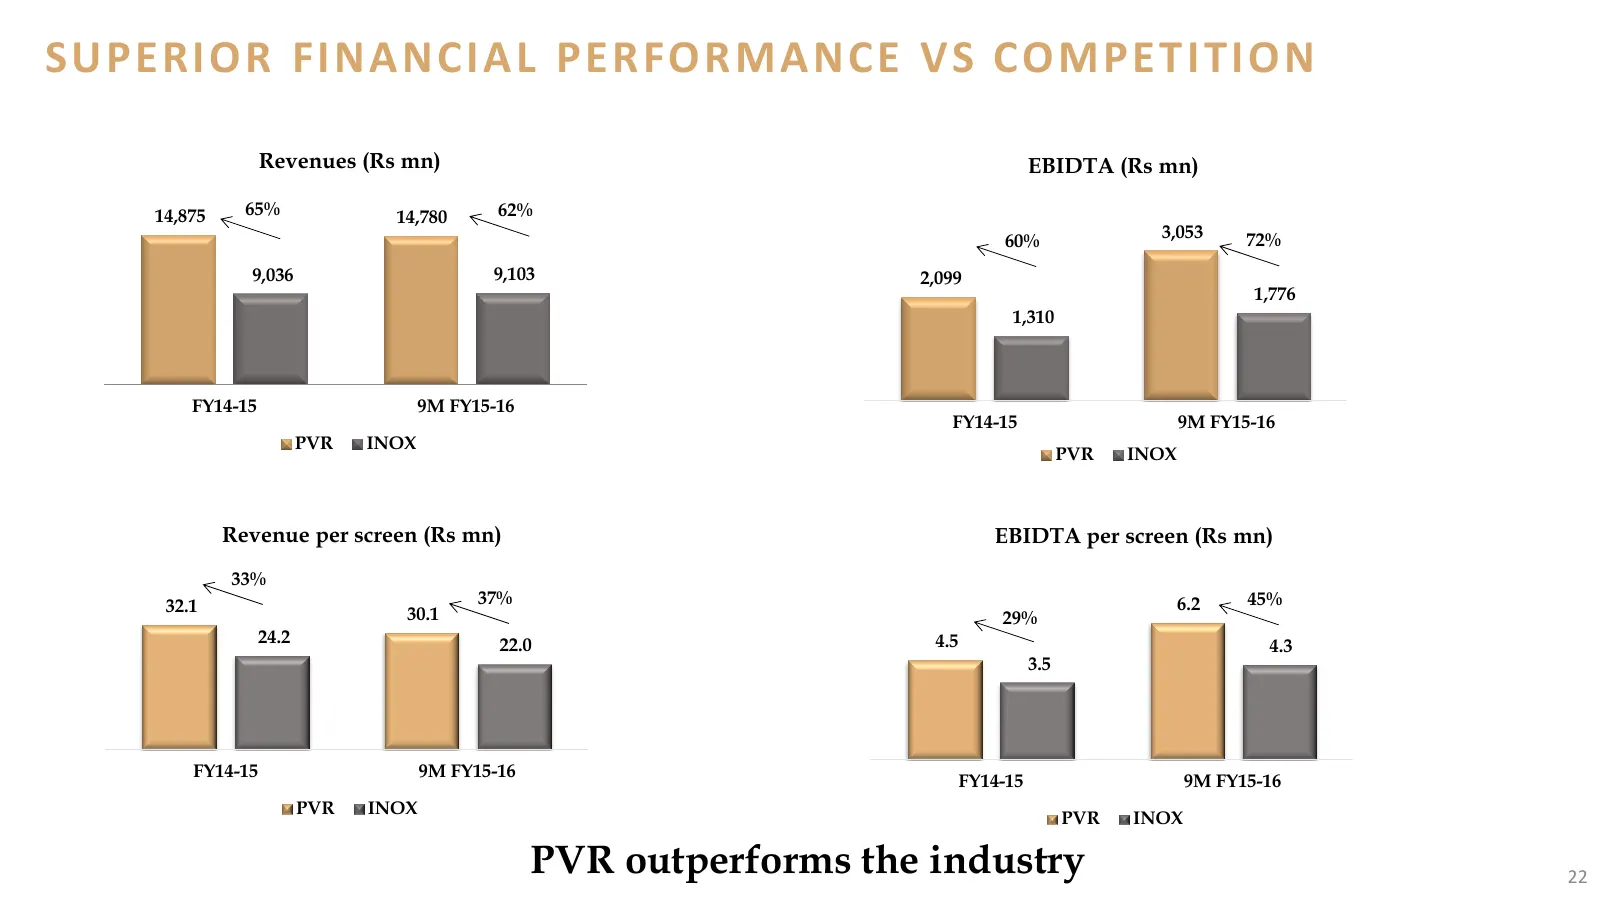
Slide 22: Superior Financial Performance vs Competition
SUPERIOR FINANC IAL PERFORMANCE VS COMPETITION Revenues (Rs mn) EBIDTA (Rs mn) 14,875 65% 14,780 62% 60% 3,053 72% 9,036 9,103 2,099 1,776 1,310 FY14-15 9M FY15-16 FY14-15 9M FY15-16 PVR INOX PVR INOX Revenue per screen (Rs mn) EBIDTA per screen (Rs mn) 33% 32.1 37% 6.2 45% 30.1 29% 24.2 22.0 4.5 4.
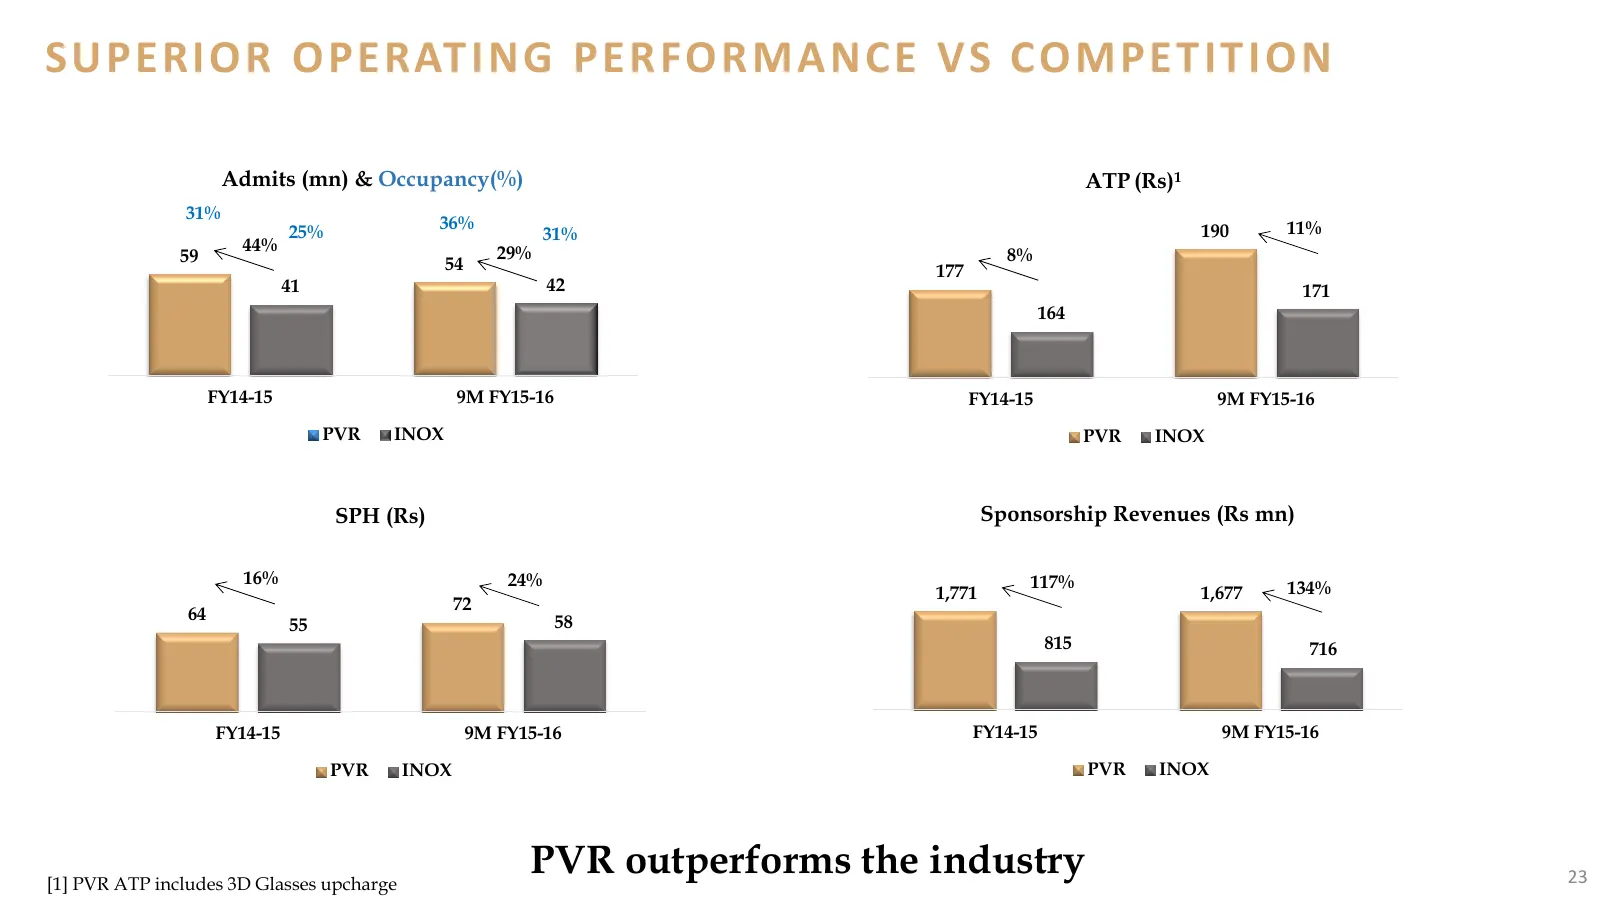
Slide 23: Superior Operating Performance vs Competition
SUPERIOR OPERATING PERFORMANCE VS COMPETITION Admits (mn) & Occupancy(%) ATP (Rs)1 31% 25% 36% 190 11% 31% 44% 29% 59 8% 54 177 41 42 171 164 FY14-15 9M FY15-16 FY14-15 9M FY15-16 PVR INOX PVR INOX SPH (Rs) Sponsorship Revenues (Rs mn) 16% 24% 117% 1,771 1,677 134% 72 64 58 55 815 716 FY14-15 9M FY1

Slide 24: Thank You!
THANK YOU !
Source: Internet Archive copy of static1.pvrcinemas.com
More decks from PVR Inox Limited
 Q2 FY2027 Earnings Presentation38 slides · Oct 28, 2026
 Q1 FY2027 Earnings Presentation29 slides · Jul 23, 2026
 Q4 FY2026 Earnings Presentation42 slides · May 11, 2026
 Q3 FY2026 Earnings Presentation45 slides · Feb 5, 2026
 Q2 FY2026 Earnings Presentation35 slides · Oct 17, 2025
 Q4 FY2025 Earnings Presentation32 slides · May 17, 2025